
From Research to Market Take-up
Francisco Gonzalez Balmas, TMB
4th EU Electromobility Stakeholders Forum
Brussels – 26th May 2016

2
Ventilation by
propulsion energy
Ratio of answers for Fleet renewal function of
propulsion types considered
+ 41,5%
Current Fleet
Electric Buses?Big interest from Stakeholders
Future Fleet
Projection
3
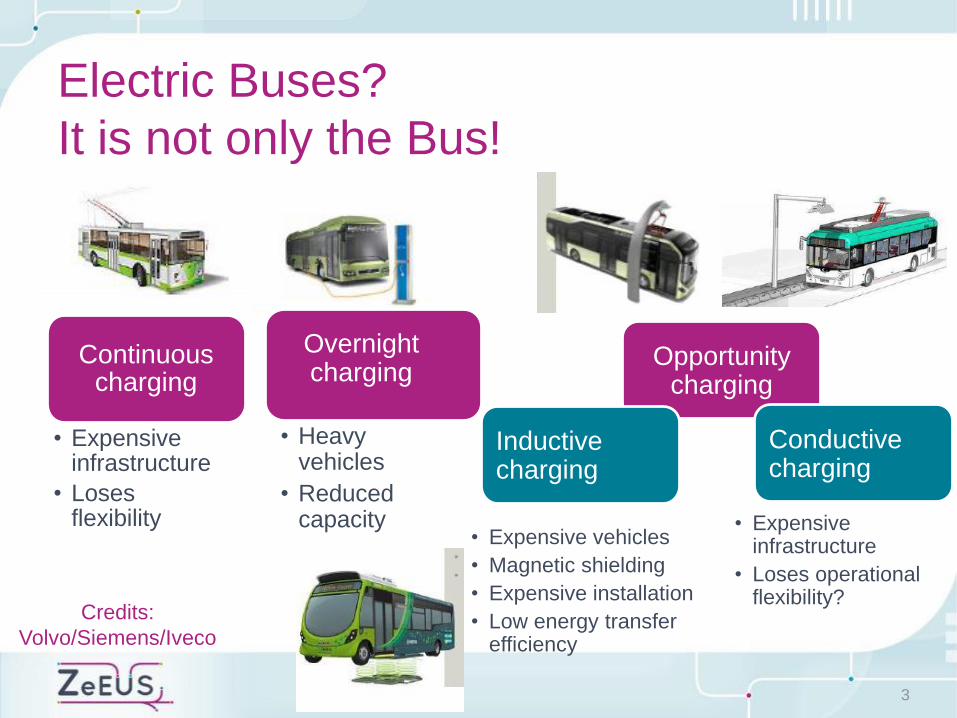
Electric Buses?
It is not only the Bus!
Continuouscharging
• Expensiveinfrastructure
• Losesflexibility
Opportunitycharging
• Heavy vehicles
• Reduced capacity
Overnightcharging
Inductive charging
Conductivecharging
• Expensive vehicles
• Magnetic shielding
• Expensive installation
• Low energy transferefficiency
• Expensiveinfrastructure
• Loses operationalflexibility?
Credits:
Volvo/Siemens/Iveco

• E-bus = 2 x the price of a conventional bus
• Battery = 45% of the e-bus cost
• Battery lifetime is key
• Cost of the charging infra and
installation must be added to the
above
• Depreciation rules
• TCO: maintenance cost
4
High Cost
5
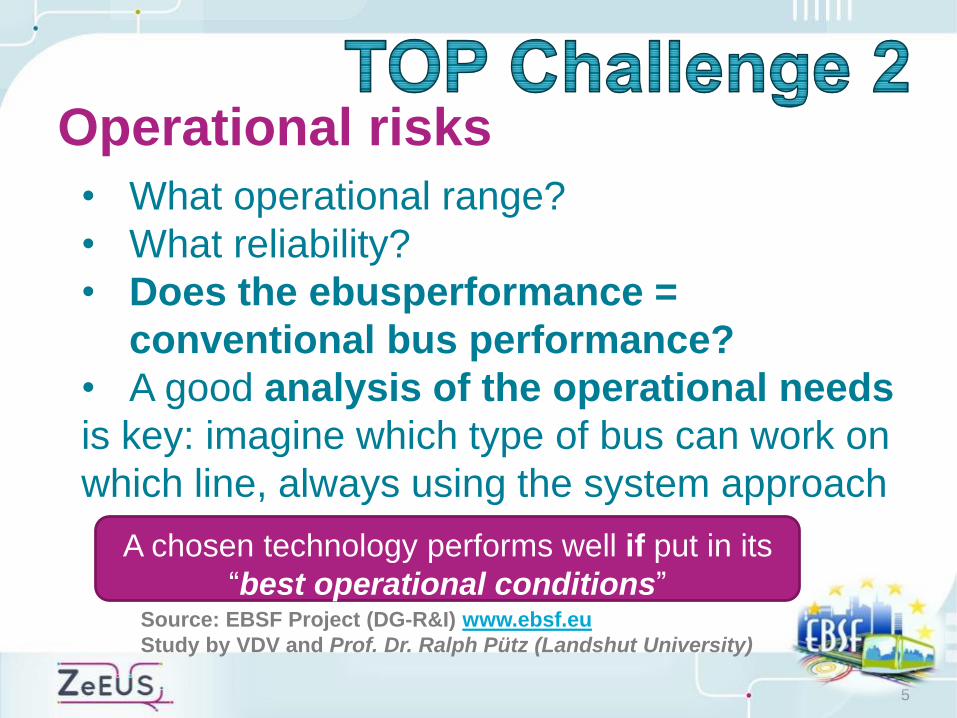
Operational risks
Source: EBSF Project (DG-R&I) www.ebsf.eu
Study by VDV and Prof. Dr. Ralph Pütz (Landshut University)
A chosen technology performs well if put in its
“best operational conditions”
• What operational range?
• What reliability?
• Does the ebusperformance =
conventional bus performance?
• A good analysis of the operational needs
is key: imagine which type of bus can work on
which line, always using the system approach

6
Contractual barriers
• Contract length & extensions
• Functions / Responsibilities sharing
between PTO & PTA
• Who to pay what cost?

7
Interoperability & flexibility
• What flexibility of the
operations with a dedicated
infrastructure?
• Charging infrastructure
standardization is key
• Slow charging - overnight
• Fast charging – opportunity

8
Interaction with Energy providers
• Urban location for
charging point
• Quality of the
electricity distribution
network
• Stability of electricity cost

10 ZeEUS Demonstrations
9
~70 electric buses •12 meters, articulated, double-deckers
•Plug-in Hybrid, Full-electric, Battery Trolleys
Energy supply mode: •plug-in, conductive, inductive, overhead
Charging strategies •Overnight (depot)
•Opportunity (terminals, bus-stops)
Fast / Slow Charging
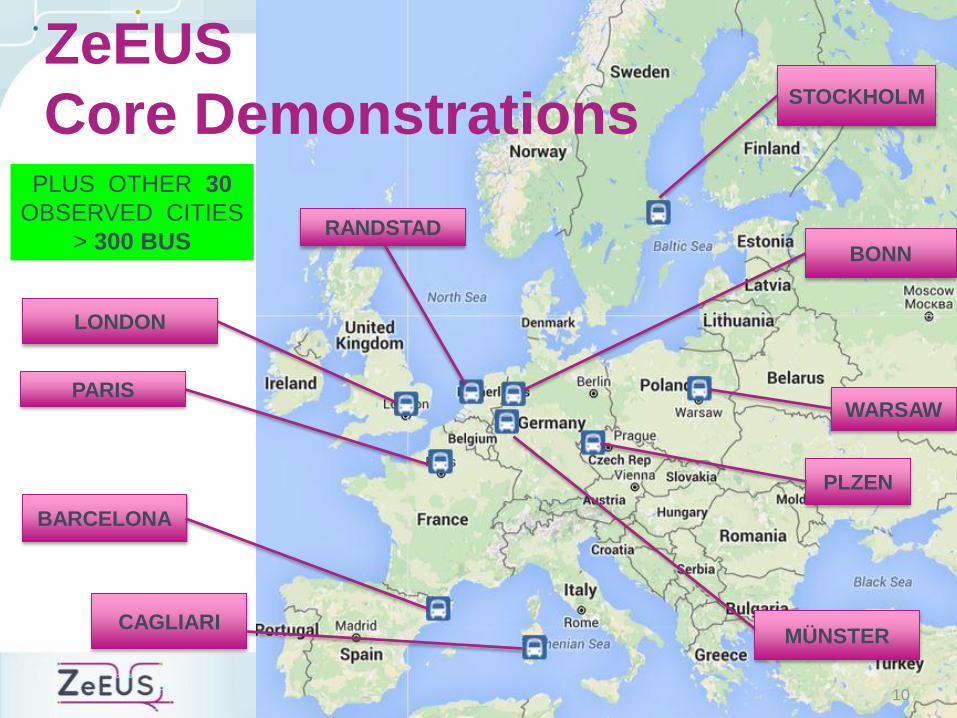
10
ZeEUS
Core Demonstrations
LONDON
STOCKHOLM
PARIS
BARCELONA
CAGLIARI
RANDSTAD
WARSAW
PLZEN
MÜNSTER
BONN
PLUS OTHER 30
OBSERVED CITIES
> 300 BUS

11
•Fair and beneficial business practices toward labour and the community and region in which a organization conducts its business
People
•Economic value created by the organization after deducting the cost of all inputs, including the cost of the capital tied up
Profit
•Sustainable environmental practices, benefit to the natural order as much as possible or at the least do no harm and minimise environmental impact
Planet
•Surrounding conditions: route description, buses in operation, number of charging point…
Technical and Operational Data
Characteristic
of the demo
Indicators
Evaluation bottom line approach: categories of indicators

Global evaluation of results for… Identification of the most relevant KPIs for
e-buses
Supporting procurement for future investments in electric bus systems
Analyse transferability of site- specific
results
Compiling a single handbook covering sustainability performance assessment
Support to feasibility and decision making, modelling and standardisation
NO DEMO-to-DEMO BENCHMARKING!
NO TECHNOLOGY-to-TECHNOLOGY BENCHMARKING!
12
Procurement Manual
for eBusesIncluding KPI details &
instructions

13
A set of tools and guidelines answering the stakeholders needs
IF – Know & Decide
WHAT – Select & Procure
WHEN – Plan, Regulate & Fund
HOW – Operate & Maintain
#eMSF2016@eMobilityForum
4th E-MOBILITY STAKEHOLDER FORUM
NOVELOG: Guiding Cities to sustainable city logistics
Dr. Georgia AyfantopoulouNOVELOG Project Coordinator
Hellenic Institute of Transport (HIT)Centre for Research and Technology Hellas (CERTH)

Agenda
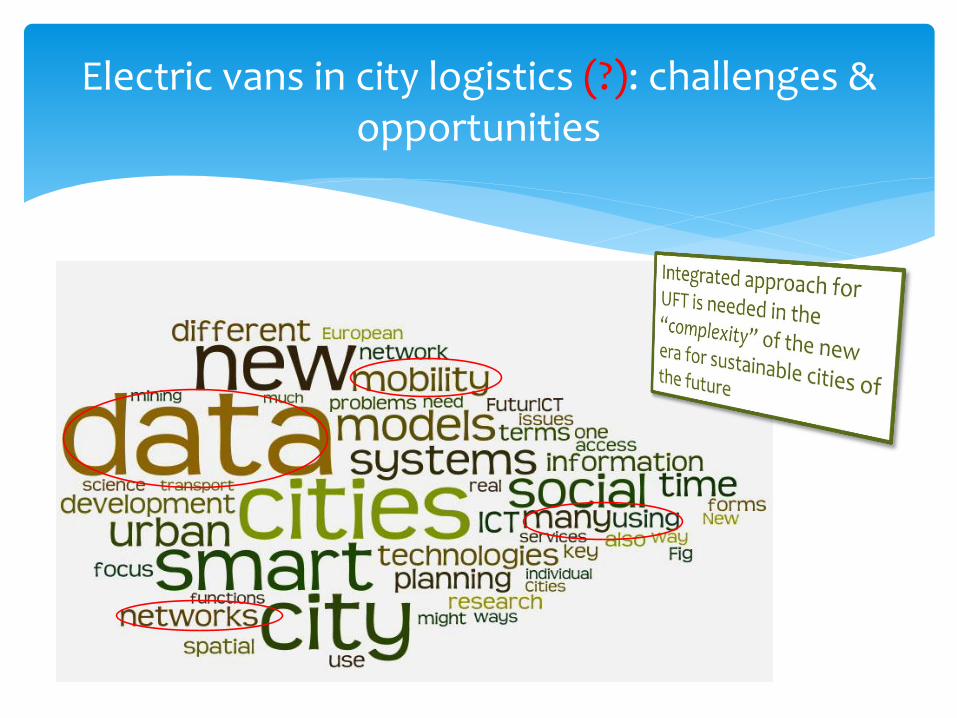
o Electric Vans in city logistics (?): challenges & opportunities
o The NOVELOG Project – An Overview
o NOVELOG and Electromobility
o Conclusions

Electric vans in city logistics : challenges & opportunities
Advantages
Increased Range for City Logistics (100 to 200km)
Increased output (increased speeds max. 80-90km/hr)
Potential for inclusion of additional power (i.e. solar panels, non-fossil fuel sources) to extend range
No CO2 emissions Reduced noise pollution
Challenges
Requires new infrastructure (network of recharge stations for achieving greater vehicle ranges)
Increased purchasing costs
Battery toxicity (environmental waste management issues)
Logistics sector is very fragmented with low level of innovation adoption

CO2 free city logistics by 2030
Reduction of noise pollution from freight
Reduction of carbon dependent technologies
Promote joint public procurement for low emission vehicles in commercial fleets
E-mobility is a sustainable answer to these requirements
Barriers do exist in terms of:
Decarbonazation of electrification
New infrastructure
New interfaces
New Business models
Support from authorities (local, national, int)
What Mayors really like about electromobility ?
Why its easier to implement in small cities ?
Common problem pass/ger & freight e-mobility?
E-mobility is important for improving the competitiveness of EU automotive industry
How we will involve them for flexible & economically viable solutions in city logistics?
EU Goals
Dynamics
Electric vans in city logistics : challenges & opportunities
Electric vans in city logistics (?): challenges & opportunities

Approaches to urban freight transport management
Approach Example
(1)Infrastructure Development of bypasses/ring roads,urban distribution centers, loading facilities
(2) Regulatory Introduction of fuel taxes, road user charge, dedicated freight Impose vehicle restrictions Introduce congestion charging
(3) Logistical Use of small delivery vehicles Improved terminal operations Improve driver competencies
(4) Co-operative Form freight partnerships load sharing systems (increase load factors) Joint delivering
(5) Technology Use of electric delivery vehicles Use of ITSImplement a vehicle parking reservation system
(6) Behavioral Implement anti idling messagesImprove social acceptance of urban freight activities Use of recommended truck routes
Electric vans in city logistics (?) : challenges & opportunities

The NOVELOG Project
o NOVELOG - New Cooperative Business Models and Guidance for Sustainable City Logistics
o Objective:o enabling of knowledge and understanding of urban freight
distribution and service trips by providing guidance for implementing effective and sustainable policies and measures for sustainable city logistics

Approach for cooperative logistics

• improved understanding of cost effective (non-vehicle technology based) strategies, measures & business models to reduce the carbon footprint of logistical operations in cities;
• increased load factors and reduced vehicle movements resulting in cost and emission benefits;
• optimized governance and stakeholders’ cooperation in urban distribution through a more powerful, consensus-oriented DSS;
• strengthened capacity of local authorities & stakeholders for sustainable policy making (SUMPs), by providing tools for managing “implementation chain” (problem capture - decision – planning – testing – assessment –adjustment - implementation).
• Impact EU Policy implementation.
• Impact innovation and integration of new knowledge to strengthen competitiveness and growth.
NOVELOG Expected Results & Impacts

4 Steps – 4 Tools
Assess
Understand
Guide
Focus
‘Toolkit’‘Evaluation’
tool
‘Guidance’
tool
‘Understand
-ing Cities’

Tools’ overview
‘Understand-
ing cities’
tool
‘Toolkit’
‘Evaluation’
tool
‘Guidance’
tool
Objective Output Tool type
To define the key factors
influencing UFT
development & their
expected evolution
To guide cities in selecting
the most appropriate UFT
solutions for their case
To provide cities with
evidence on whether to
select a specific UFT
measure (exante/expost)
To support the process of
defining the best business
model (BM)s for each city
A list of the key factors
influencing UFT, their impact
areas and their expected
evolution in 2 future time
horizons
A list of the most appropriate
combinations of measures &
interventions based on the
city’s typology
A ranking of alternative UFT
measures based on their
assessed impact and
contribution to cities LSI
Characteristics of alternative
and selected business model
for each city (based on the
BM Canvas structure)
Web platform
Web platform
Web platform
Framework

6 Pilots and 6 Case Studies
o Mechelen
o Graz
o Turin
o Rome
o Athens
o Barcelona
o Gothenburg
o Copenhagen
o London
o Venice
o Emilia-Romagna Region
o Pisa
Case studiesPilots
Different typology & maturity levels of cities.Multi-stakeholders platfroms in each city
One approach
External City network of 30 citiesInternational Quality Assurance Panel

6 Pilots and 6 Case Studies
Pilot cities Innovative Element
Athens Business cooperation between road and rail transport providers
Turin Flexible use of public infrastructure by ITS
Graz Home deliveries system for small shops
Rome DSS for city logistics measures
Barcelona Super-blocks planning in a city logistics perspective
Mechelen Shops and bike couriers cooperation for urban freight deliveries
Case Study Cities Innovative Element
Emilia Romagna Region Harmonization of city logistics rules among cities
Gothenburg Care off addresses and use of the existing logistics platforms for consolidation
Venice Using public transport for freight last mile deliveries
Copenhagen Formalized freight network for defining incentives to improve demand management
Pisa UDC business and operational model
London Freight travel plan and behavioral change policies
Three (3) city pilots promoting electromobility in city logistics: Barcelona Promotion strategy : electric fleet being part of an innovative project for freight
delivery
Pisa Promotion strategy : provision of incentives to local carriers in the context of an
integrated SULP approach .
Rome Promotion strategy : electric van sharing experiment for data collection &
technical justification - convincing through argumentation .
Car Industry view on electric vans adoption strategies in city logistics
Business models for facilitating electric fleets taken up in city logistics in conjunction with other measures.
NOVELOG & electromobility
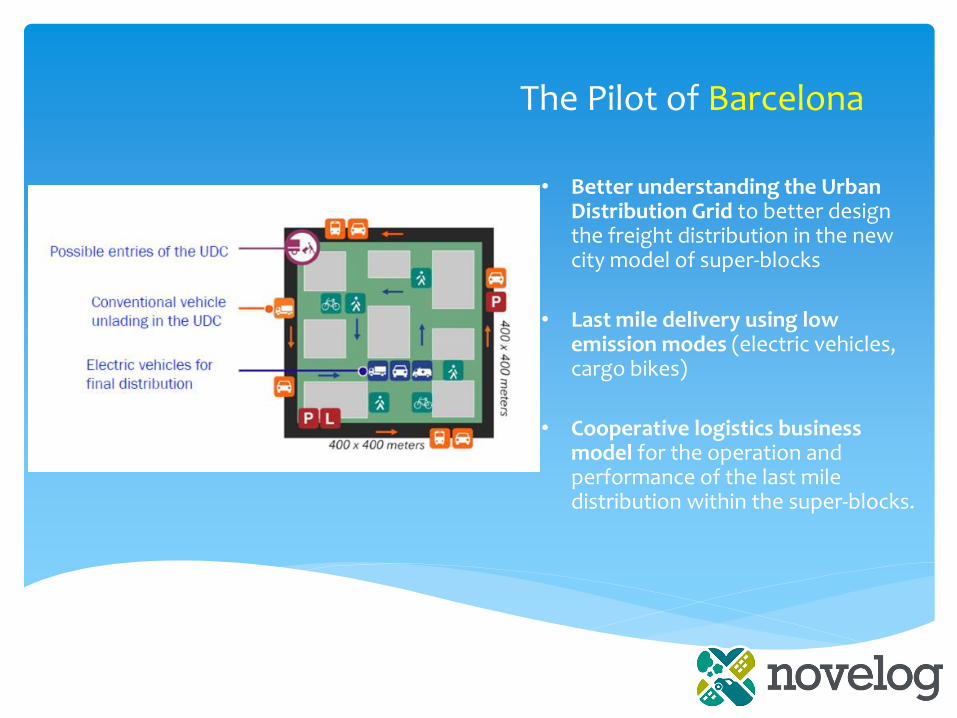
The Pilot of Barcelona
• Better understanding the Urban Distribution Grid to better design the freight distribution in the new city model of super-blocks
• Last mile delivery using low emission modes (electric vehicles, cargo bikes)
• Cooperative logistics business model for the operation and performance of the last mile distribution within the super-blocks.

The Pilot of Pisa• identification the population of
carriers
• monitor and manage the access of freight vehicles within the city
• send alert information via mobile app to goods carriers for a better organization of transport of goods
• encourage the use of electric vehicles within the LTZ for local exchange carriers
• Develop the implementation plan for integration of urban freight management solutions

The Pilot of Rome
• Design and development of a urban freight Decision Support System (DSS)
• Field trials monitoring and evaluation:
• Low emission vehicles performing the last mile distribution under freight traffic restrictions and regulations
• Urban Consolidation Centres in combination with electric vehicles
• Electric Van-Sharing experiments
NOVELOG will:
1. Validate the benefits of using electric vehicles and electric bikes for urban freight in conjunction with other measures (UDCs, LTZs).
2. Test and validate e-mobility solutions contribution in improving the sustainability of city logistics and meeting the requirements of the stakeholders. Examine and implement measures to promote and provide incentive to logistics industry to take-up such solutions.
3. Test new cooperative business models to increase the sustainability of these solutions and achieve consensus between city stakeholders on what the roles, requirements and expectations of each stakeholder are in such business models.
NOVELOG & electromobility
NOVELOG will:
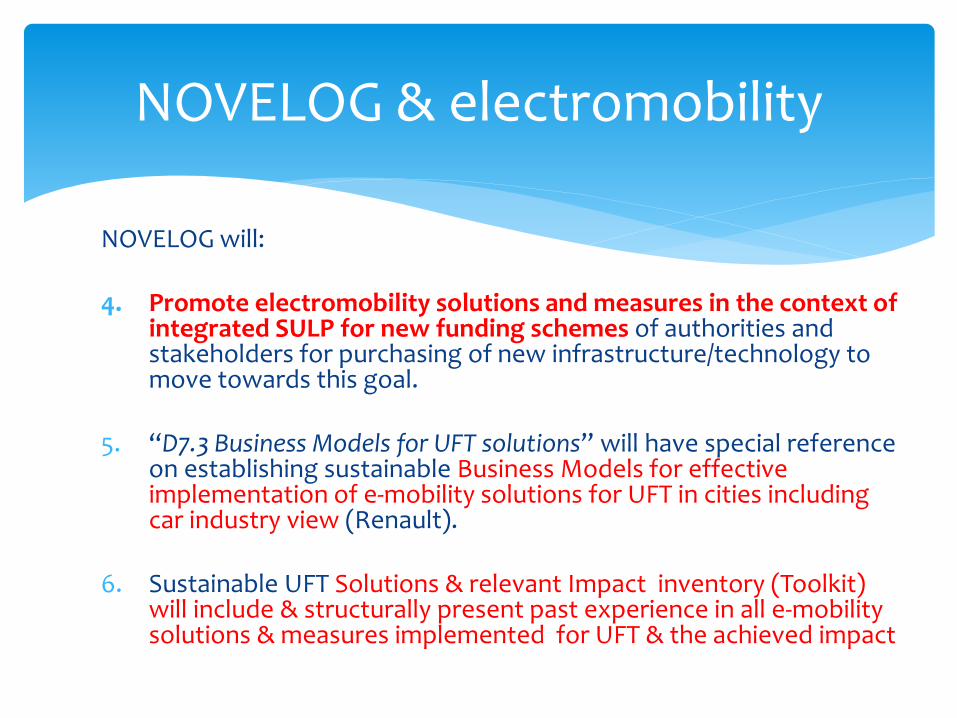
4. Promote electromobility solutions and measures in the context of integrated SULP for new funding schemes of authorities and stakeholders for purchasing of new infrastructure/technology to move towards this goal.
5. “D7.3 Business Models for UFT solutions” will have special reference on establishing sustainable Business Models for effective implementation of e-mobility solutions for UFT in cities including car industry view (Renault).
6. Sustainable UFT Solutions & relevant Impact inventory (Toolkit) will include & structurally present past experience in all e-mobility solutions & measures implemented for UFT & the achieved impact
NOVELOG & electromobility

#eMSF2016@eMobilityForum
Thank you Dr. Georgia Ayfantopoulou
NOVELOG Project Coordinator
www.novelog.eu

Back up slides

Validate the benefits of using electric vehicles and electric bikes for urban freight in conjunction with other measures (UDCs, LTZs).
Implement and validate the cooperative business models required for the effective deployment of the measures in the NOVELOG cities. Identification of the required characteristics/relations for successful co-operation and operation.
Evaluate the role of the local and national authorities in providing incentives and restrictions for the successful take-up of electric vehicles for Urban Freight Transport.
Research can help move towards take-up by demonstrating the benefits and potential of the use of electric freight vehicles. Industry is taking fast steps in improving technology and reducing the cost which is one of the main hurdles.
Conclusions

NOVELOG Focus on Business Models and guidance for development of sustainable business models for UFT.
Facilitate stakeholders to implement the guidance Strategy, enable the development/modification of their own Business Models and integrate urban logistics concerns and strategies.
“D7.3 Business Models for UFT solutions” to include chapter on establishing sustainable Business Models for effective implementation of electromobility solutions for UFT in cities (Renault).
NOVELOG Added Value for Electromobility

Developing tools for managing the “implementation chain”
4 Tools:• Understanding Cities
• Evaluation
Activities:1. Understanding urban freight and
service trips
-Data collection
-Drivers identification
-Scenario development
2. Development of a modular evaluation
framework
-LCA, SCBA, Behavioral modelling, Adaptability and
Transferability, Risk Analysis, MS-MCA D-M
3. Crafting of Toolkit of policies and
measures
-City typology
-Measures and impacts identification
-Measures ranking
4. On-site implementation
5. Impact assessment (Evaluation)
6. Business models and Guidance
-Guidance Strategy for SULP implementation
-City logistics business models
• NOVELOG Toolkit
• Guidance
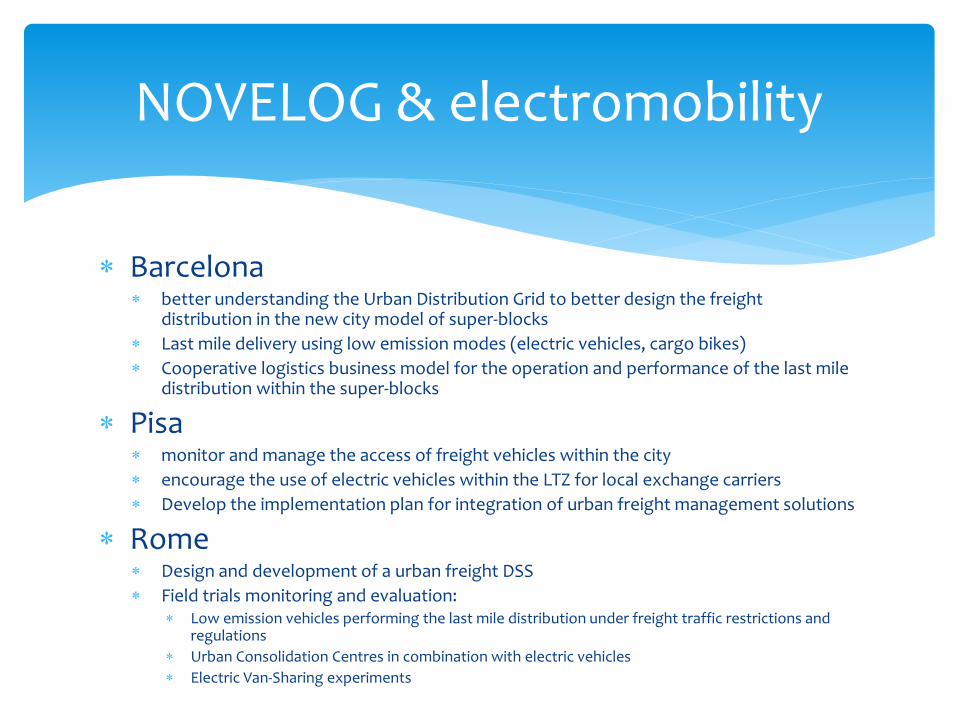
Barcelona better understanding the Urban Distribution Grid to better design the freight
distribution in the new city model of super-blocks
Last mile delivery using low emission modes (electric vehicles, cargo bikes)
Cooperative logistics business model for the operation and performance of the last mile distribution within the super-blocks
Pisa monitor and manage the access of freight vehicles within the city
encourage the use of electric vehicles within the LTZ for local exchange carriers
Develop the implementation plan for integration of urban freight management solutions
Rome Design and development of a urban freight DSS
Field trials monitoring and evaluation: Low emission vehicles performing the last mile distribution under freight traffic restrictions and
regulations
Urban Consolidation Centres in combination with electric vehicles
Electric Van-Sharing experiments
NOVELOG & electromobility

#eMSF2016@eMobilityForum
4th E-MOBILITY STAKEHOLDER FORUM
Taking Fuel Cell Buses to Market
Jean-Luc DelplanckeHead of the Programme Unit
Fuel Cells and Hydrogen 2 Joint Undertaking

Shifting public awareness towards sustainability and eco-friendliness requires new sustainable transport solutions
> 50% of Europeans think that climate change is one of the three most important challenges our world faces
> 81% say that air pollution is an important problem
> 72% of citizens say that noise pollution is a problem in their cities
> 63% feel that transport is a main threat to air quality
> 56% of Europeans think pollution can be reduced by improving public transport
> 71% of European citizens say that electric cars are the most environmentally friendly mode of transport
> 56% of Europeans think that public transport can best be improved by city authorities
> 72% of Europe's population believe that public authorities aren't doing enough to improve air quality
Source: Eurobarometer "Climate Change" (2014); Eurobarometer "Urban Mobility" (2013); Eurobarometer "Air quality"(2013)
…and want local authoritiesto solve them
Europeans perceive major environmental problems…
…to be caused by the transport sector…

FC buses are the most flexible zero emission option –clean like battery electric, they can be operated like diesel buses
High daily ranges … of 300 km on average without refuelling –Extension possible
Performance… comparable to diesel buses, e.g. acceleration or gradeability
High passenger comfort … due to reduced noise levels and smooth driving experience
Full route flexibility … not bound to any required infrastructure on the route
Fast refuelling … down to 7 minutes possible – Also several refuelling cycles per day possible
Close to technology maturity … with more than ten years and 8 m km of operational experience
Note: For a comparison of different alternative powertrain solutions please refer to the study "Urban buses: Alternative powertrains for Europe"

Strong Public-Private Partnership
with a focused objective
European Union represented by the
European Commission
The Joint Undertaking is managed by a Governing Board composed of representatives of all three partners and led by Industry.
To implement an optimal research and innovation programme to
bring FCH technologies to
the point of market readiness
by 2020
Fuel Cells & Hydrogen Joint Undertaking
4
Industry Grouping95 members
~ 50% SME
Research Grouping63 members
Industry-led Public-Private Partnership (PPP)
Council Regulations:
521/2008 of 30 May 2008 (FP7)
1183/2011 of 14 November 2011
559/2014 of 6 May 2014 (H2020)

Situation and Outlook in Europe:91 buses in operation or about to start
Ongoing EU-funded fuel cell bus project
3EmotionCherbourg, FR – 5 FC buses (2016/17)Rotterdam, NL – 4 FC buses(2016/17)South Holland, NL – 2 FC busesLondon, UK – 2 FC buses (2016/17)Flanders, BE – 3 FC buses (2016/17)Rome, IT – 5 FC buses (2016/17)
Current national/regional-funded fuel cell bus projects
Karlsruhe, DE * – 2 FC buses (2013)Stuttgart, DE * – 4 FC buses (2014)Arnhem, NL* – 3 FC buses (2016/17)Groningen, NL* – 2 FC buses (2016/17)Brabant, NL* – 2 FC buses (2016/17)
Ongoing EU-funded fuel cell bus projectsCHIC Bolzano, IT– 5 FC buses (2013) Aargau, CH –5 FC buses (2011) London, UK – 8 FC buses (2011) Milan, IT – 3 FC buses (2013) Oslo, NO – 5 FC buses (2013)
Cologne, DE* – 4 FC buses (2011/14)
Hamburg, DE* – 6 FC buses (2011/2015)
High V.LO-City Liguria, IT – 5 FC buses (2015) Antwerp, BE – 5 FC buses (2015) Aberdeen, UK – 4 FC buses (2015)
HyTransit Aberdeen, UK – 6 FC buses (2015)
In operation
Legend
* Co-financed by regional/national funding sources
Last update: October 2015
Planned operation
CHIC countries
(2015) Operation start/planned start

FCH JU Projects: Achievements and Challenges
Achievements
• As flexible as diesel buses– Full operations: 12-20hr daily shifts– Short refuelling time
• Cost reduction
• Efficient electric drivetrain
Challenges
• Availability• Spare parts• Time to repair• Trained staff• Cost of FCBs, Infrastructure/H2
Volumes bring lower costs and mature supply chain
Fuel Consumptionkg/100 km
20-24
8-12
- 50%
61M€ for 67 buses from 4 projects in 12 locations
Refuelling Time -min
15-20
<10
Vehicle Cost
- 40%1.5-2M€
<1M€
Baseline
2008
FCHJU projects
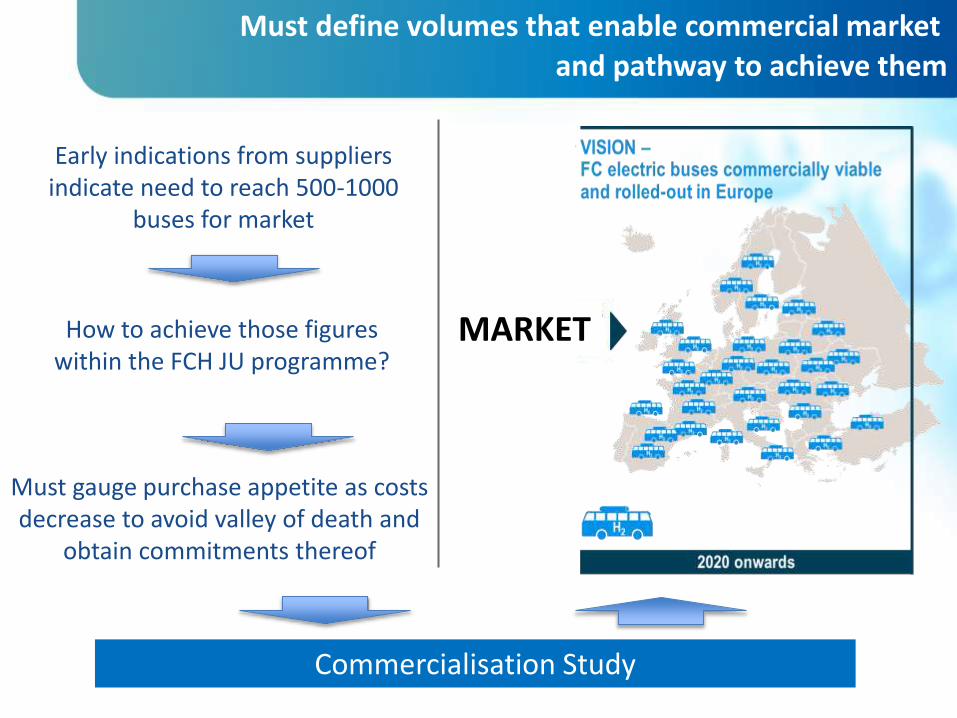
Must define volumes that enable commercial market
and pathway to achieve them
D
MARKET
Early indications from suppliers indicate need to reach 500-1000
buses for market
How to achieve those figures within the FCH JU programme?
Must gauge purchase appetite as costs decrease to avoid valley of death and
obtain commitments thereof
Commercialisation Study

Industry coalition membersParticipating locations
Bus manufacturers
Infrastructure/H2 providers
Technologyproviders
Other organisations
A broad stakeholder coalition of >80 organizations has been established including operators and local governments from 45 locations
Mobilisation
London
Oslo
Hamburg
Aachen
Wuppertal
Cologne Region
Aberdeen
South Holland
Province
Riga
Rotterdam
North East England Region
Imperia Province
Regione Lazio/ Rome
Münster
Stuttgart
Bozen
MainzAgglomération
Havraise
Dole
Grenoble-Isère Region
Belfort
Flanders
Dundee
Birmingham
Perth/Kinross
Switzerland
Torres Vedras
Potsdam
Inverness/Highlands
Berlin
Tallinn
Pärnu
Budapest
Rouen
Bordeaux
Study published and available at: www.fch.europa.eu

5 leading bus suppliers and 30 cities/operators have made clear public statements of their commitment to support commercialisation of FC buses
Users and suppliers agree on the need for action
Bus Suppliers Letter of Understanding
LoU presented to demand side representatives in an Handover-Ceremony in Brussels, 12 November 2014
Letter of Understanding of Transport Operators and Public Authorities
Left to right: First Mayor Olaf Scholz (Hamburg), Deputy Mayor Kit Malthouse (London), Filip van Hool (CEO Van Hool), Dariusz Michalak (Deputy CEO Solaris), Rémi Henkemans (Managing Director VDL Bus & Coach), Gustav Tuschen (Head of Product Engineering Daimler Buses)
LoU handed over to the EU Commissioner of Transport at the TEN-T Days in Riga on 23 June, 2015Left to right: Bert de Colvenaer (FCH JU Executive Director), Pierre-Etienne Franc (NEW-IG Chairman), Nils Usakovs (Mayor of Riga), Els de Wit (Head of Clean Fuels at the Dutch Ministry of Infrastructure and the Environment), Kirsten Holling (Ministry for Building, Housing, Urban development and Transport NRW), Violet Bulc (Commissioner for Transport), Bernard Frois (IPHE Chairman), Catherine Trautmann (European Coordinator North Sea-Baltic Corridor), Kurt Bodewig (European Coordinator Baltic-Adriatic Corridor), Florian Mussner Councillor for Mobility of South Tyrol-Bolzano)

Fuel cell bus deployment plans – European level
Potential no. of FC buses in projects under development by bus length (12m / 18m) and cluster
Comments
• Early figures indicate >500 fuel cell buses
• Overall level of investment: 1.5B€
• On-going engagement with bus industry to ensure demand can be met
116
72
117
52
47
114
0
100
200
300
400
500
0 30
300112
12m
466
18m
N. Europe
France
UK
Benelux
Germany
No
. of
fuel
cel
l bu
ses
Note that these are provisional estimates based on the data from cities / operators collected within each cluster. No firm commitment has been made to procure fuel cell buses by any parties involved. While the cluster coordinators have sought to
provide realistic and relatively conservative deployment numbers, in practice these figures may well fall as more detailed local feasibility work is undertaken.

• Call for proposals included topic for large scale validation of fuel cell bus fleets – max. funding of 32M€
• Requires: – At least 100 buses in total– At least 3 cities with 20 buses– At least 10 buses per participating location– Maximum price for standard 12m bus: 650,000€
• Provides: – Up to 200,000€ per standard 12m bus– Up to 1.2M€ for large stations, up to 600,000€ for small fleets
• More info available at www.fch.europa.eu
FCH JU – Call 2016
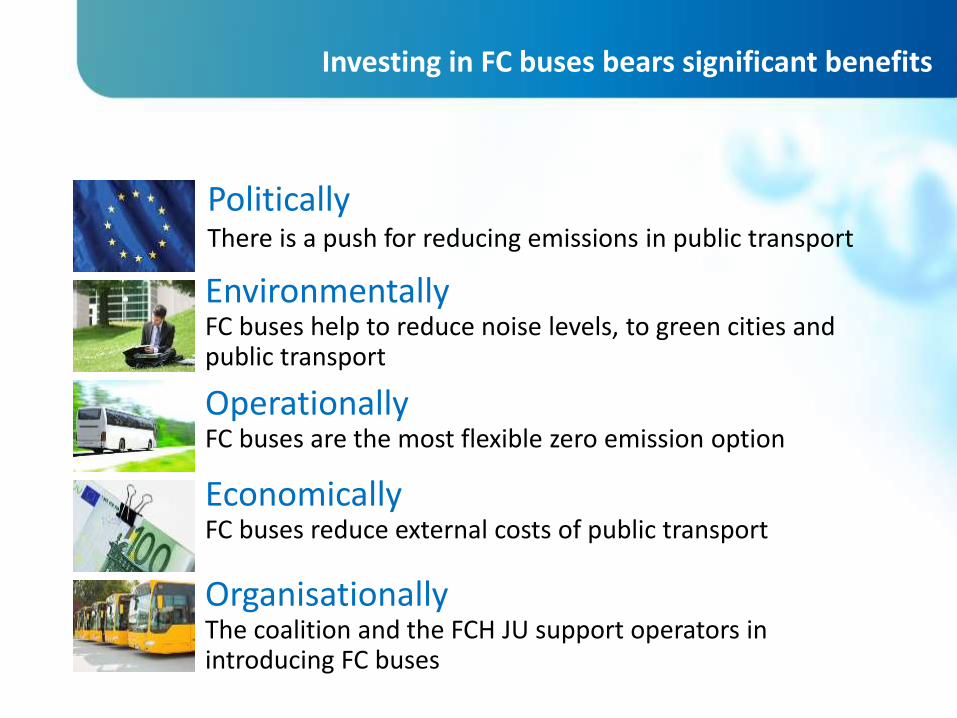
PoliticallyThere is a push for reducing emissions in public transport
Investing in FC buses bears significant benefits
EnvironmentallyFC buses help to reduce noise levels, to green cities and public transport
OperationallyFC buses are the most flexible zero emission option
EconomicallyFC buses reduce external costs of public transport
OrganisationallyThe coalition and the FCH JU support operators in introducing FC buses
Contact us: • Street address: Avenue de la Toison d’Or 56-60 B-1060 Brussels Belgium
• Postal address: FCH JU - TO56 4/29, B-1049 Brussels Belgium
• Tel: +32 2 221 81 29
• E-mail: [email protected]
Thank you for your attention
Further info :
• FCH JU : http://www.fch.europa.eu/
• HYDROGEN EUROPE : www.hydrogeneurope.eu
• N.ERGHY : http://www.nerghy.eu

![[En] Innovation in market research - Global Market research event](https://cdn.vdocument.in/doc/165x107/546e1796af79590b198b5847/en-innovation-in-market-research-global-market-research-event.jpg)


