
Global InequalityWhat do we know?
How responsible are we?

Questions to White People:• WHY DO YOU HAVE TO ASK ME ABOUT THESE ISSUES?
• YOU SHOULD KNOW THIS ALREADY. WHY DON’T YOU READ THINGS ON YOUR OWN? WATCH TV? SURF THE WEB?
• WHY DID IT TAKE YOU SO LONG TO BECOME CONCERNED ABOUT THESE ISSUES?
• HOW CAN YOU NOT SEE WHAT YOUR PEOPLE ARE DOING TO MY PEOPLE?
• WE DON’T WANT YOUR SYMPATHY. WE WANT YOU TO DO SOMETHING.

Questions to Americans:• WHY DO YOU HAVE TO ASK US ABOUT THESE ISSUES?
• YOU SHOULD KNOW THIS ALREADY. WHY DON’T YOU READ THINGS ON YOUR OWN? WATCH TV? SURF THE WEB?
• WHY DID IT TAKE YOU SO LONG TO BECOME CONCERNED ABOUT THESE ISSUES?
• HOW CAN YOU NOT SEE WHAT YOUR PEOPLE ARE DOING TO OTHERS AROUND THE WORLD?
• WE DON’T WANT YOUR SYMPATHY. WE WANT YOU TO DO SOMETHING.

Common reasons offered for “global poverty”
• Overpopulation• Lack of resources and technology• Poor education systems• Political and economic instability• Infertile land• Laziness
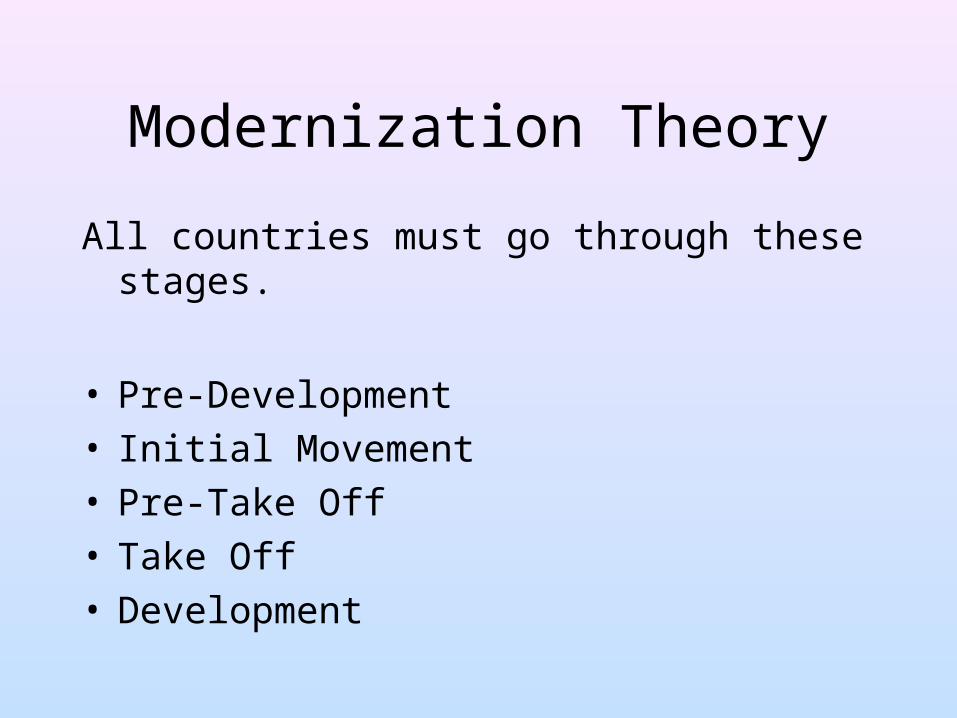
Modernization Theory
All countries must go through these stages.
• Pre-Development• Initial Movement• Pre-Take Off• Take Off• Development

and maybe there’s another side to the story…

Population Growth
• A U.N. Study concluded that it would require FOUR earths for everyone to live the lifestyle of a U.S. citizen.
• The U.N. estimates the world’s population to reach 9.3 billion by 2050 (about 4 billion of us will live with hunger).

World System/Dependency Theory
• The path to development depends on a country’s “take off” point.
• Countries with an early “take off” have few other countries to hold them back.
• “Development” is largely determined by availability of resources and technology.
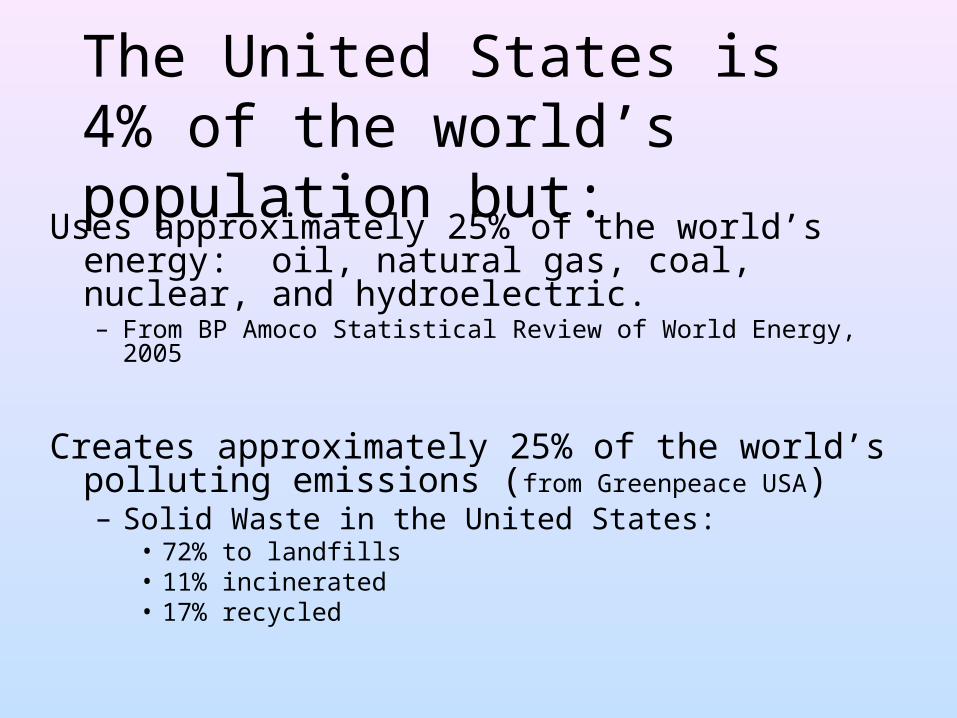
The United States is 4% of the world’s population but:
Uses approximately 25% of the world’s energy: oil, natural gas, coal, nuclear, and hydroelectric.– From BP Amoco Statistical Review of World Energy, 2005
Creates approximately 25% of the world’s polluting emissions (from Greenpeace USA)– Solid Waste in the United States:
• 72% to landfills• 11% incinerated• 17% recycled

WATER AND SANITATION
• 1.1 billion people lack clean drinking water
• Sanitation is available to 6 in 10 people worldwide
• 1.6 million people in poor countries die each year from illnesses associated with dirty water and poor sanitation.
– WHO & UNICEF data

Percent of populations with access to safe drinking
water:• U.S. = 99.9% • Nicaragua = 58• Haiti = 28• Mozambique = 33• Germany = 99.9
(These are all debatable as they don’t account for toxic chemicals.)


State of the World’s Children – 2005 (UNICEF)
• 640 million children do not have adequate shelter
• 500 million children lack access to basic sanitation
• 400 million children lack access to safe water • 300 million children lack access to information • 270 million children have no access to basic
health care services • 140 million children have never been to school • 90 million children are severely food-deprived

Estimated number of people who could be fed
for one year with the food Americans waste in one
day:
240,183

According to the World Bank, about 170 million children in
poor countries are underweight because of a
lack of food.
However, currently about 815 million people on the planet, or 13% of the pop, suffer from hunger and
malnutrition.

Between 30,000 – 35,000 children die in the world
EVERY DAY as a direct result of poverty and malnutrition.
That’s a full Beaver Stadium EVERY THREE DAYS!

Some U.S. Facts:
• The richest 25 million Americans earn as much as the world’s poorest 2 billion people.
• The bottom 10% of people living in the U.S. are better off than two-thirds of the world’s population.
• The wealthiest 1% of Americans own more than the poorest 92% combined.
~ World Bank Data

King of the Earth Mountain
We Are…
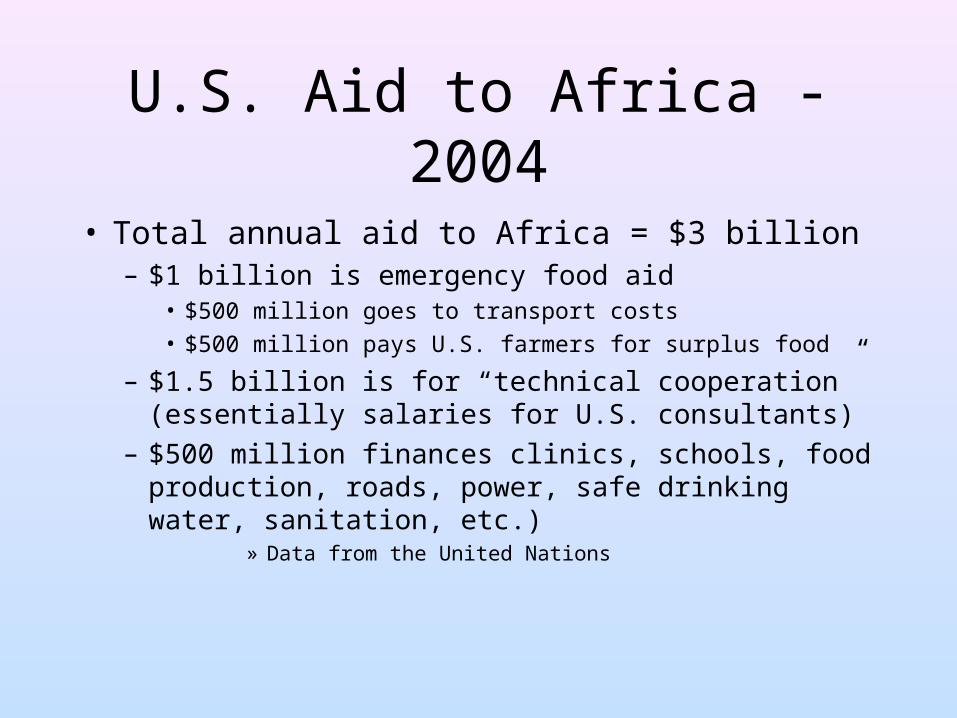
U.S. Aid to Africa - 2004
• Total annual aid to Africa = $3 billion– $1 billion is emergency food aid
• $500 million goes to transport costs• $500 million pays U.S. farmers for surplus food
– $1.5 billion is for “technical cooperation” (essentially salaries for U.S. consultants)
– $500 million finances clinics, schools, food production, roads, power, safe drinking water, sanitation, etc.)
» Data from the United Nations

Christian
Invaders

Our 2004 military budget of $399.1 billion was 30 times as large as the combined military spending of the seven countries the Pentagon has determined to be our
most likely adversaries in a war:
Iran, Iraq, North Korea, Libya, Syria, Cuba, Sudan = $13 billion
Add in Russia and China and it’s $134.2 billion (34% of the U.S. budget)
* the Iraq budget is the pre invasion budget of 2002

how much we spend to kill and protect
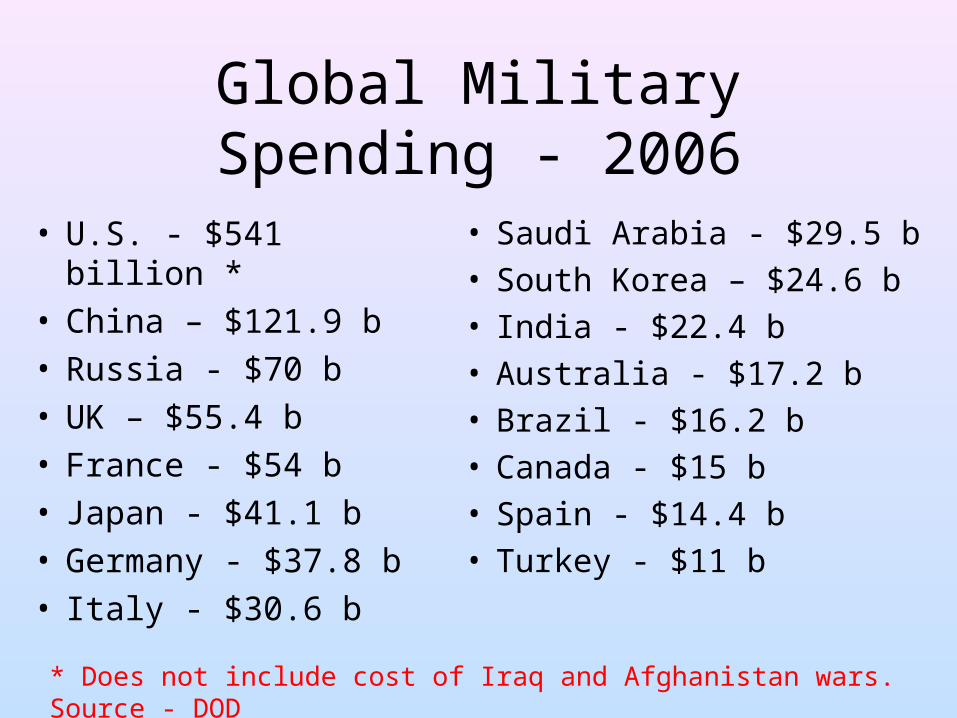
Global Military Spending - 2006
• U.S. - $541 billion *• China – $121.9 b• Russia - $70 b• UK – $55.4 b• France - $54 b• Japan - $41.1 b• Germany - $37.8 b• Italy - $30.6 b
• Saudi Arabia - $29.5 b• South Korea – $24.6 b• India - $22.4 b• Australia - $17.2 b• Brazil - $16.2 b• Canada - $15 b• Spain - $14.4 b• Turkey - $11 b
* Does not include cost of Iraq and Afghanistan wars. Source - DOD

The U.S. military budget for 2006 was more than the combined 2006
military spending of the next 14 most militarized nations.
The United States and our “close allies” accounted for almost three quarters of all military spending in
2006.
-- Jane’s Defense Weekly

Arms sales to the world - 2008
Total = $55.2 billion
United States = $37.8 billion of these sales (or 68.4%)
70.1% of U.S. arms sales agreements were to “developing countries”
** Congressional Research Office

More than half of the top 25 recipients of U.S. arms transfers in the developing world were defined
as “undemocratic” by the U.S. State Department’s Human Rights Report
and considered by the State Department’s Office of Human
Rights to have “poor human rights records.”
(including UAE, Morocco, Saudi Arabia, Pakistan, Yemen, Tunisia, Columbia and
Egypt)

State of the World’s Children – 2005 (UNICEF)
• 59 “wars” took place between 1990 – 2003
• Half of the 3.6 million people killed in war since 1990 have been children
• In the last decade alone 10 million children have been traumatized by war.

Children and War

Roma and Italians
• http://www.youtube.com/watch?v=MlMFRamBVsk&feature=related
• http://www.cnn.com/2008/WORLD/europe/07/21/italy.drowning/index.html#cnnSTCVideo


