Market Feasibility Analysis
High Rise Senior Apartments
Rome, Floyd County, Georgia
Prepared for:
Rea Ventures
Effective Date: April 17, 2017
Site Inspection: April 5, 2017
High Rise Senior Apartments | Table of Contents
Page i
TABLE OF CONTENTS
EXECUTIVE SUMMARY........................................................................................................... 11. INTRODUCTION .............................................................................................................. 8A. Overview of Subject..............................................................................................................................................8B. Purpose of Report.................................................................................................................................................8C. Format of Report ..................................................................................................................................................8D. Client, Intended User, and Intended Use .............................................................................................................8E. Applicable Requirements......................................................................................................................................8F. Scope of Work ......................................................................................................................................................8G. Report Limitations ................................................................................................................................................9
2. PROJECT DESCRIPTION.................................................................................................. 10A. Project Overview ................................................................................................................................................10B. Project Type and Target Market .........................................................................................................................10C. Building Types and Placement............................................................................................................................10D. Detailed Project Description...............................................................................................................................10
1. Project Description.....................................................................................................................................102. Other Proposed Uses .................................................................................................................................113. Scope of Rehabilitation ..............................................................................................................................114. Current Property Conditions ......................................................................................................................155. Proposed Timing of Development .............................................................................................................15
3. SITE AND NEIGHBORHOOD ANALYSIS ........................................................................... 16A. Site Analysis ........................................................................................................................................................16
1. Site Location...............................................................................................................................................162. Existing Uses...............................................................................................................................................163. Size, Shape, and Topography .....................................................................................................................164. General Description of Land Uses Surrounding the Subject Site ...............................................................185. Land Uses Surrounding the Subject Site ....................................................................................................18
B. Neighborhood Analysis.......................................................................................................................................201. General Description of Neighborhood .......................................................................................................202. Neighborhood Planning Activities..............................................................................................................203. Public Safety...............................................................................................................................................20
C. Site Visibility and Accessibility ............................................................................................................................211. Visibility ......................................................................................................................................................212. Vehicular Access.........................................................................................................................................213. Availability of Public Transit .......................................................................................................................224. Availability of Inter-Regional Transit..........................................................................................................225. Accessibility Improvements under Construction and Planned ..................................................................226. Environmental Concerns ............................................................................................................................22
D. Residential Support Network..............................................................................................................................221. Key Facilities and Services near the Subject Site........................................................................................222. Essential Services .......................................................................................................................................243. Commercial Goods and Services ................................................................................................................244. Recreational Amenities ..............................................................................................................................255. Location of Low Income Housing ...............................................................................................................25
E. Site Conclusion ...................................................................................................................................................25
4. MARKET AREA DEFINITION ........................................................................................... 26A. Introduction........................................................................................................................................................26B. Delineation of Market Area ................................................................................................................................26
5. ECONOMIC CONTENT ................................................................................................... 28A. Introduction........................................................................................................................................................28B. Labor Force, Resident Employment, and Unemployment................................................................................28
High Rise Senior Apartments | Table of Contents
Page i i
1. Trends in County Labor Force and Resident Employment .........................................................................282. Trends in County Unemployment Rate ....................................................................................................28
C. Commutation Patterns ......................................................................................................................................29D. At-Place Employment ........................................................................................................................................29
3. Trends in Total At-Place Employment ......................................................................................................294. At-Place Employment by Industry Sector .................................................................................................305. Major Employers .......................................................................................................................................326. Recent Economic Expansions and Contractions .......................................................................................327. Conclusions on Local Economics ...............................................................................................................33
6. DEMOGRAPHIC ANALYSIS ............................................................................................. 34A. Introduction and Methodology ..........................................................................................................................34B. Trends in Population and Households ................................................................................................................34
1. Recent Past Trends.....................................................................................................................................342. Projected Trends ........................................................................................................................................343. Building Permit Trends...............................................................................................................................344. Trends in Older Adult Households .............................................................................................................36
C. Demographic Characteristics..............................................................................................................................361. Age Distribution and Household Type .......................................................................................................362. Renter Household Characteristics..............................................................................................................383. Income Characteristics ...............................................................................................................................40
7. COMPETITIVE HOUSING ANALYSIS ................................................................................ 41A. Introduction and Sources of Information ...........................................................................................................41B. Overview of Market Area Housing Stock............................................................................................................41C. Survey of Age-Restricted Rental Communities...................................................................................................43
1. Introduction to the Age-Restricted Rental Housing Survey .......................................................................432. Location......................................................................................................................................................433. Age-Restricted Rental Housing Characteristics ..........................................................................................444. Vacancy Rates ............................................................................................................................................445. Absorption History .....................................................................................................................................446. Unit Distribution.........................................................................................................................................447. Effective Rents ...........................................................................................................................................448. Payment of Utility Costs.............................................................................................................................459. Unit Features..............................................................................................................................................4510. Community Amenities................................................................................................................................45
D. Survey of General Occupancy Rental Communities ...........................................................................................461. Introduction to the Rental Housing Survey................................................................................................462. Location......................................................................................................................................................463. Vacancy Rates ............................................................................................................................................474. Effective Rents ...........................................................................................................................................475. DCA Average Market Rent .........................................................................................................................48
E. Interviews ...........................................................................................................................................................49F. Multi-Family Pipeline..........................................................................................................................................49G. Housing Authority Data ......................................................................................................................................50H. Existing Low Income Rental Housing ..................................................................................................................50I. Impact of Abandoned, Vacant, or Foreclosed Homes ........................................................................................51
8. FINDINGS AND CONCLUSIONS....................................................................................... 53A. Key Findings ........................................................................................................................................................53
1. Site and Neighborhood Analysis ................................................................................................................532. Economic Context ......................................................................................................................................533. Population and Household Trends.............................................................................................................544. Demographic Analysis ................................................................................................................................545. Competitive Housing Analysis ....................................................................................................................55
B. Affordability Analysis ..........................................................................................................................................56
High Rise Senior Apartments | Table of Contents
Page i i i
1. Methodology..............................................................................................................................................562. Affordability Analysis .................................................................................................................................573. Conclusions of Affordability .......................................................................................................................58
C. Demand Estimates and Capture Rates ...............................................................................................................591. Methodology..............................................................................................................................................592. Demand Analysis ........................................................................................................................................603. DCA Demand Conclusions ..........................................................................................................................63
D. Target Markets ...................................................................................................................................................63E. Product Evaluation .............................................................................................................................................63F. Price Position ......................................................................................................................................................64G. Absorption Estimate ...........................................................................................................................................66H. Impact on Existing Market..................................................................................................................................66I. Final Conclusions and Recommendations ..........................................................................................................67
9. APPENDIX 1 UNDERLYING ASSUMPTIONS AND LIMITING CONDITIONS......................... 6810. APPENDIX 2 ANALYST CERTIFICATIONS ..................................................................... 7011. APPENDIX 3 NCHMA CERTIFICATION ......................................................................... 71
12. APPENDIX 4 ANALYST RESUMES ............................................................................... 7213. APPENDIX 5 DCA CHECKLIST ..................................................................................... 7514. APPENDIX 6 NCHMA CHECKLIST................................................................................ 8015. APPENDIX 7 RENTAL COMMUNITY PROFILES ............................................................. 8316. APPENDIX 8 TENANT RELOCATION SPREADSHEET...................................................... 84
High Rise Senior Apartments | Table of Contents
Page iv
TABLES, FIGURES AND MAPS
Table 1 High Rise Senior Apartments Detailed Project Summary ..............................................................................11Table 2 Key Facilities and Services..............................................................................................................................23Table 3 Labor Force and Unemployment Rates ........................................................................................................28Table 4 2011-2015 Commuting Patterns, High Rise Market Area .............................................................................29Table 5 2017 Major Employers, Floyd County ...........................................................................................................32Table 6 Population and Household Projections..........................................................................................................35Table 7 Building Permits by Structure Type, Floyd County.........................................................................................35Table 8 Trends in Senior Householders, High Rise Market Area ................................................................................36Table 9 2017 Age Distribution ....................................................................................................................................37Table 10 2010 Households by Household Type...........................................................................................................37Table 11 Households by Tenure.................................................................................................................................38Table 12 Senior Households by Tenure, Age 55+ ......................................................................................................39Table 13 Renter Households by Age of Householder ................................................................................................39Table 14 2010 Renter Households by Household Size ................................................................................................39Table 15 2017 Household Income ...............................................................................................................................40Table 16 2017 Senior Household Income by Tenure, Households 55+ .......................................................................40Table 17 Dwelling Units by Structure and Tenure ......................................................................................................41Table 18 Dwelling Units by Year Built and Tenure......................................................................................................42Table 19 Value of Owner Occupied Housing Stock......................................................................................................42Table 20 Rental Summary, Non-Subsidized Senior Rental Units .................................................................................45Table 21 Utility Arrangement and Unit Features.......................................................................................................45Table 22 Community Amenities ..................................................................................................................................46Table 23 Rental Summary, General Occupancy Communities ....................................................................................48Table 24 Average Market Rents, All Surveyed Properties ...........................................................................................49Table 25 Average Market Rent and Rent Advantage Summary .................................................................................49Table 26 Subsidized Communities, High Rise Market Area ........................................................................................50Table 27 Foreclosure Rate and Recent Foreclosure Activity, ZIP Code 30165, March 2017 ......................................52Table 28 2019 Total and Renter Income Distribution, Households 55+ .....................................................................56Table 29 LIHTC Income and Rent Limits, Rome, GA MSA .........................................................................................57Table 30 2019 Affordability Analysis without PBV, High Rise Senior Apartments......................................................59Table 31 2019 Affordability Analysis with PBV, High Rise Senior Apartments ...........................................................59Table 32 Substandard and Cost Burdened Calculations ............................................................................................61Table 33 Homeownership to Rental Housing Conversion ...........................................................................................61Table 34 Overall Demand Estimates without PBV, High Rise Senior Apartments .....................................................62Table 35 Demand Estimates by Floor Plan (with and without PBV), High Rise Senior Apartments ..........................62
Figure 1 Views of Subject Property and Surrounding Land Uses.................................................................................17Figure 2 Satellite Image of Subject Site .......................................................................................................................19Figure 3 At-Place Employment ..................................................................................................................................30Figure 4 Total Employment by Sector .......................................................................................................................31Figure 5 Change in Employment by Sector 2011-2015 Q2 ........................................................................................31Figure 6 Price Position .................................................................................................................................................64
Map 1 Site Location ....................................................................................................................................................16Map 2 2016 CrimeRisk, Subject Site and Surrounding Areas .....................................................................................21Map 3 Location of Key Facilities and Services ............................................................................................................23Map 4 High Rise Market Area .....................................................................................................................................27Map 5 Surveyed Senior Rental Communities .............................................................................................................43Map 6 Surveyed Comparable General Occupancy Rental Communities....................................................................47Map 7 Subsidized Rental Communities ......................................................................................................................51
High Rise Senior Apartments | Executive Summary
Page 1
EXECUTIVE SUMMARY
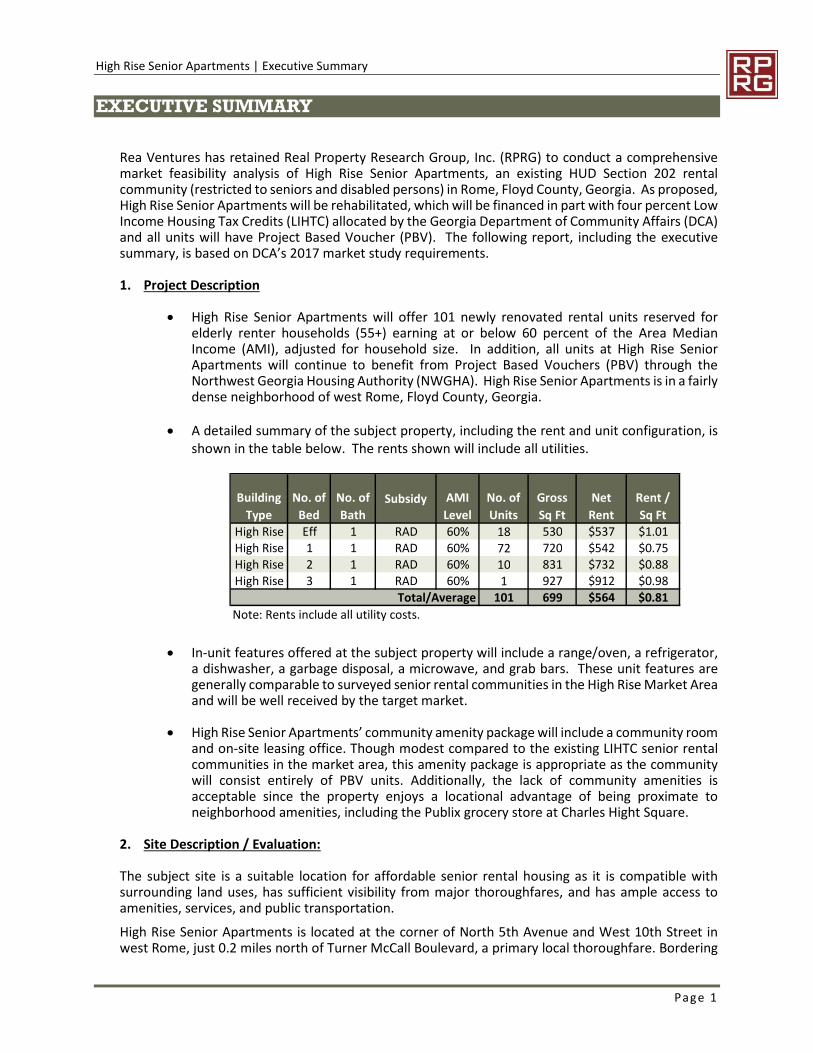
Rea Ventures has retained Real Property Research Group, Inc. (RPRG) to conduct a comprehensivemarket feasibility analysis of High Rise Senior Apartments, an existing HUD Section 202 rentalcommunity (restricted to seniors and disabled persons) in Rome, Floyd County, Georgia. As proposed,High Rise Senior Apartments will be rehabilitated, which will be financed in part with four percent LowIncome Housing Tax Credits (LIHTC) allocated by the Georgia Department of Community Affairs (DCA)and all units will have Project Based Voucher (PBV). The following report, including the executivesummary, is based on DCA’s 2017 market study requirements.
1. Project Description
High Rise Senior Apartments will offer 101 newly renovated rental units reserved forelderly renter households (55+) earning at or below 60 percent of the Area MedianIncome (AMI), adjusted for household size. In addition, all units at High Rise SeniorApartments will continue to benefit from Project Based Vouchers (PBV) through theNorthwest Georgia Housing Authority (NWGHA). High Rise Senior Apartments is in a fairlydense neighborhood of west Rome, Floyd County, Georgia.
A detailed summary of the subject property, including the rent and unit configuration, isshown in the table below. The rents shown will include all utilities.
In-unit features offered at the subject property will include a range/oven, a refrigerator,a dishwasher, a garbage disposal, a microwave, and grab bars. These unit features aregenerally comparable to surveyed senior rental communities in the High Rise Market Areaand will be well received by the target market.
High Rise Senior Apartments’ community amenity package will include a community roomand on-site leasing office. Though modest compared to the existing LIHTC senior rentalcommunities in the market area, this amenity package is appropriate as the communitywill consist entirely of PBV units. Additionally, the lack of community amenities isacceptable since the property enjoys a locational advantage of being proximate toneighborhood amenities, including the Publix grocery store at Charles Hight Square.
2. Site Description / Evaluation:
The subject site is a suitable location for affordable senior rental housing as it is compatible withsurrounding land uses, has sufficient visibility from major thoroughfares, and has ample access toamenities, services, and public transportation.
High Rise Senior Apartments is located at the corner of North 5th Avenue and West 10th Street inwest Rome, just 0.2 miles north of Turner McCall Boulevard, a primary local thoroughfare. Bordering
Building
Type
No. of
Bed
No. of
BathSubsidy AMI
Level
No. of
Units
Gross
Sq Ft
Net
Rent
Rent /
Sq Ft
High Rise Eff 1 RAD 60% 18 530 $537 $1.01High Rise 1 1 RAD 60% 72 720 $542 $0.75High Rise 2 1 RAD 60% 10 831 $732 $0.88High Rise 3 1 RAD 60% 1 927 $912 $0.98
Total/Average 101 699 $564 $0.81
Note: Rents include all utility costs.
High Rise Senior Apartments | Executive Summary
Page 2
land uses include the subject’s two sister structures as well as Riverwood retirement home, smallhealthcare facilities, and a vacant lot.
Community services, medical services, shopping, and recreational centers/parks are all in the subjectsite’s immediate vicinity. Charles Hight Square shopping center is within the periphery of the site –just 0.2 mile southwest – and is anchored by Publix grocery store and pharmacy. Healthcare andmedical facilities are within a one-mile radius of the site, including the Valley Healthcare physician,PrimeCare Nursing, Floyd Medical Center, Harbin Clinic, and Fifth Avenue Health Care Center. Theclosest senior services center is 0.6 mile east of the site at Rome Senior Center, which provides dailyactivities for elderly adults.
The Rome Transit Department (RTD) provides public bus transportation throughout the city, and twoRTD bus routes pass through a fixed bus stop along Avenue B. The bus stop is located within walkingdistance of the site, approximately 0.1 mile to the east.
High Rise Senior Apartments will have excellent visibility from North 5th Avenue, a moderatelytraveled road connecting the West Rome neighborhood to the city’s downtown district. As one of thetallest buildings in the area, the subject property will also have visibility from surrounding side streetsand awareness for the subject will benefit from traffic generated by surrounding commercial landuses.
The subject property’s location is generally comparable to both senior and general occupancy rentalcommunities in the High Rise Market Area. No land uses were identified that would negatively affectthe proposed development’s viability in the marketplace. As the subject property is an existing seniorrental community, its proposed rehabilitation will not alter the land use characteristics of theimmediate area.
3. Market Area Definition
The High Rise Market Area consists of census tracts in Floyd County, all of which are in the city ofRome (Map 4). The High Rise Market Area is restricted to Rome and its immediate surrounding. Thisdoes not include other municipalities such as Cave Spring and Armuchee. This area is generallyhomogenous in terms of housing stock and demographic composition with residents moving freelythroughout for work and commerce. Furthermore, the city’s highway system includes both north-south and east-west thoughfares. The size of the market area to the west is influenced by the size andshape of the census tracts. In order to include all comparable areas, census tracts needed to beincluded that stretch several miles to the north and northwest. These areas are generally sparselypopulated and do not have a significant number of households. While these tracts significantlyincrease the geographic size of the market area, they do not overstate demand. The vast majority ofthe market area’s households are within five miles of the subject site. The boundaries of High RiseMarket Area and their approximate distance from the subject property are Scenic Road (7.4 miles tothe north), Moran Lake Road (3.7 miles to the east), Boose Mountain Road (6.2 miles to the south),and the state of Alabama (16.0 miles to the west).
4. Community Demographic Data
Senior household growth (55+) in the High Rise Market Area experience some annual growth from2010 to 2017 and is expected to remain stable through 2019.
Between 2000 and 2010 Census counts, the population of the High Rise Market Area had anet growth of 6.7 percent and the households grew by 4.5 percent. Market area growthslowed down to 2.6 percent among the population and 1.2 percent among households from2010 to 2017. Over the next two years, the market area is expected to remain relatively stablewith 0.6 percent more people and only 0.3 percent more households.
From 2017 to 2019, households with householders age 55+ are projected to increase at anannual rate of 1.1 percent or 122 households. This would bring the total number ofhouseholds with householders age 55+ in the High Rise Market Area to 11,527.
High Rise Senior Apartments | Executive Summary
Page 3
Senior households in the High Rise Market Area have general modest incomes, accounting for nearlyone-third of market area renter households.
Seniors (persons age 55 and older) comprise 27.6 percent of the population in the High RiseMarket Area. Adults age 35 to 54 comprise of nearly one-quarter of the population in themarket area at 24.2 percent. Young adults age 20 to 34 account for 20.7 percent of the marketarea.
Over one-third (37.2 percent) of all households in the market area have at least two peoplewith no children, and over one-quarter (28.3 percent) are single-person households.
As of the 2010 Census, 42.8 percent of all households in the High Rise Market Area wererenters, compared to 36.7 percent in Floyd County. The renter percentage increased slightlyto 46.5 percent in 2017 and is expected to remain unchanged through 2019.
Among householders age 55 or older, the market area’s 2017 renter percentages is 32.3percent.
Roughly 58 percent of renter households in the market area contain one or two peopleincluding nearly 34 percent with one person. Three percent households account for about 16percent of market area renters.
The 2017 median income of households in the High Rise Market Area is $39,914, about $3,500 oreight percent lower than the $43,425 median in Floyd County. RPRG estimates the 2017 medianincome for senior renter householders (age 55 or older) in the High Rise Market Area is a modest$23,985. A majority of senior renter households (52.4 percent) earn less than $25,000 including 28.3percent earning less than $15,000. Approximately 27 percent of senior renter households earn$25,000 to $49,999.
5. Economic Data:
Although Floyd County historically experienced relatively more job losses and higher unemploymentrates than the nation as a result of the Great Recession, the county has recently shown signs ofrecovery.
The unemployment rate in Floyd County has decreased significantly to 5.9 percent in 2016from a recession era high of 12.1 percent in 2011.
From 2006 to 2011, Floyd County lost over 6,000 jobs as a result of the nation’s economicdownturn. Between 2012 and 2015, the economy appeared to have stabilized with the netaddition of 1,606 jobs. As of third quarter 2016, the county’s at-place employment stood at38,561 jobs.
As of third quarter 2016, 23.8 percent of all jobs in the county are in the Education-Healthsector. Three of the ten largest employers in the county are hospitals and are all within threemiles of the subject site.
In the last year, several companies announced job expansions in close proximity to the subjectsite. Carlsen Precision Manufacturing is investing $5,000,000 in its first United Statesoperations located in Industrial Park, less than two miles north of the subject. SykesEnterprises, The Ball Metal Beverage Container, and Transdev are also opening facilities in thearea, creating more than 200 new jobs in Rome.
Given the senior-oriented nature of the subject property, it is less likely to be affected bychanges in economic conditions. We do not expect current economic conditions in FloydCounty to negatively impact the proposed development of High Rise Senior Apartments.
6. Project Specific Affordability and Demand Analysis:
High Rise Senior Apartments | Executive Summary
Page 4
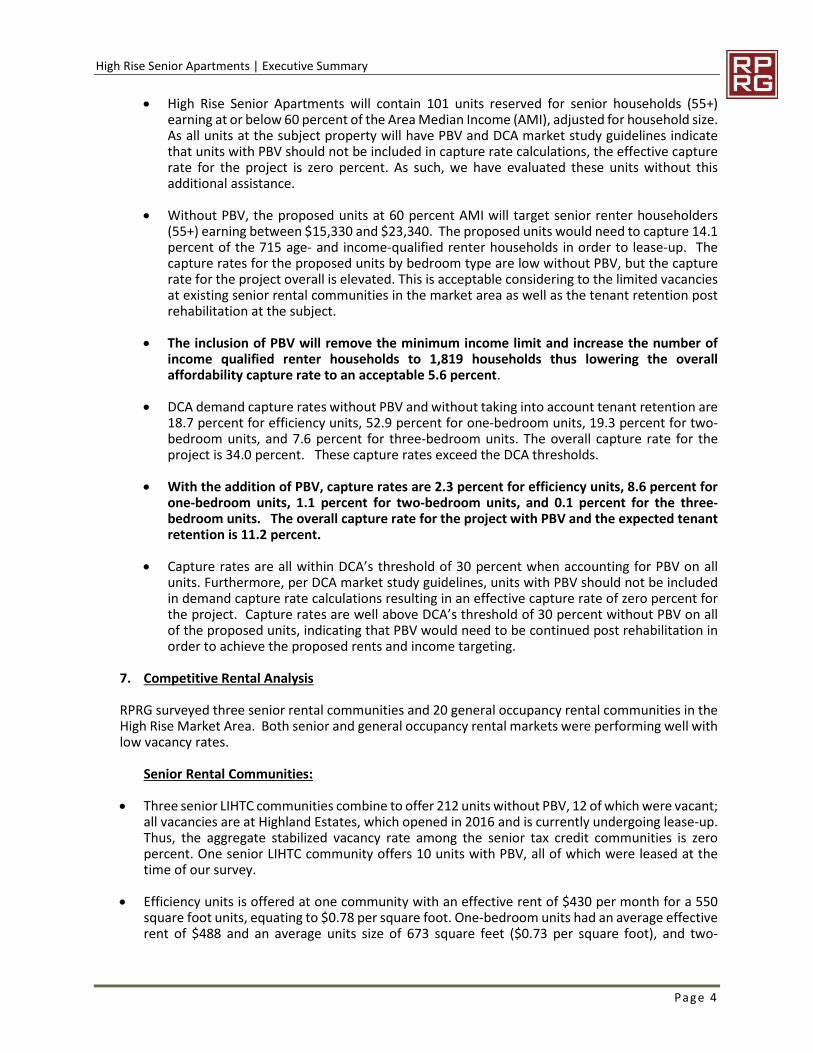
High Rise Senior Apartments will contain 101 units reserved for senior households (55+)earning at or below 60 percent of the Area Median Income (AMI), adjusted for household size.As all units at the subject property will have PBV and DCA market study guidelines indicatethat units with PBV should not be included in capture rate calculations, the effective capturerate for the project is zero percent. As such, we have evaluated these units without thisadditional assistance.
Without PBV, the proposed units at 60 percent AMI will target senior renter householders(55+) earning between $15,330 and $23,340. The proposed units would need to capture 14.1percent of the 715 age- and income-qualified renter households in order to lease-up. Thecapture rates for the proposed units by bedroom type are low without PBV, but the capturerate for the project overall is elevated. This is acceptable considering to the limited vacanciesat existing senior rental communities in the market area as well as the tenant retention postrehabilitation at the subject.
The inclusion of PBV will remove the minimum income limit and increase the number ofincome qualified renter households to 1,819 households thus lowering the overallaffordability capture rate to an acceptable 5.6 percent.
DCA demand capture rates without PBV and without taking into account tenant retention are18.7 percent for efficiency units, 52.9 percent for one-bedroom units, 19.3 percent for two-bedroom units, and 7.6 percent for three-bedroom units. The overall capture rate for theproject is 34.0 percent. These capture rates exceed the DCA thresholds.
With the addition of PBV, capture rates are 2.3 percent for efficiency units, 8.6 percent forone-bedroom units, 1.1 percent for two-bedroom units, and 0.1 percent for the three-bedroom units. The overall capture rate for the project with PBV and the expected tenantretention is 11.2 percent.
Capture rates are all within DCA’s threshold of 30 percent when accounting for PBV on allunits. Furthermore, per DCA market study guidelines, units with PBV should not be includedin demand capture rate calculations resulting in an effective capture rate of zero percent forthe project. Capture rates are well above DCA’s threshold of 30 percent without PBV on allof the proposed units, indicating that PBV would need to be continued post rehabilitation inorder to achieve the proposed rents and income targeting.
7. Competitive Rental Analysis
RPRG surveyed three senior rental communities and 20 general occupancy rental communities in theHigh Rise Market Area. Both senior and general occupancy rental markets were performing well withlow vacancy rates.
Senior Rental Communities:
Three senior LIHTC communities combine to offer 212 units without PBV, 12 of which were vacant;all vacancies are at Highland Estates, which opened in 2016 and is currently undergoing lease-up.Thus, the aggregate stabilized vacancy rate among the senior tax credit communities is zeropercent. One senior LIHTC community offers 10 units with PBV, all of which were leased at thetime of our survey.
Efficiency units is offered at one community with an effective rent of $430 per month for a 550square foot units, equating to $0.78 per square foot. One-bedroom units had an average effectiverent of $488 and an average units size of 673 square feet ($0.73 per square foot), and two-
High Rise Senior Apartments | Executive Summary
Page 5
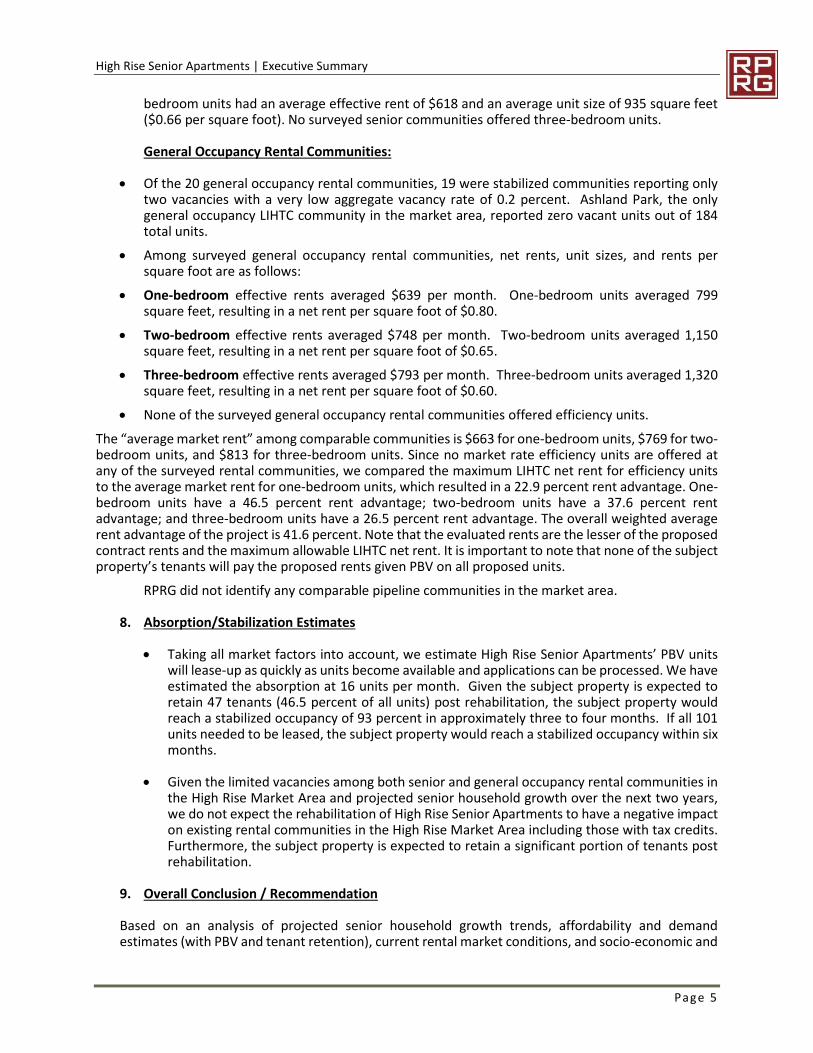
bedroom units had an average effective rent of $618 and an average unit size of 935 square feet($0.66 per square foot). No surveyed senior communities offered three-bedroom units.
General Occupancy Rental Communities:
Of the 20 general occupancy rental communities, 19 were stabilized communities reporting onlytwo vacancies with a very low aggregate vacancy rate of 0.2 percent. Ashland Park, the onlygeneral occupancy LIHTC community in the market area, reported zero vacant units out of 184total units.
Among surveyed general occupancy rental communities, net rents, unit sizes, and rents persquare foot are as follows:
One-bedroom effective rents averaged $639 per month. One-bedroom units averaged 799square feet, resulting in a net rent per square foot of $0.80.
Two-bedroom effective rents averaged $748 per month. Two-bedroom units averaged 1,150square feet, resulting in a net rent per square foot of $0.65.
Three-bedroom effective rents averaged $793 per month. Three-bedroom units averaged 1,320square feet, resulting in a net rent per square foot of $0.60.
None of the surveyed general occupancy rental communities offered efficiency units.
The “average market rent” among comparable communities is $663 for one-bedroom units, $769 for two-bedroom units, and $813 for three-bedroom units. Since no market rate efficiency units are offered atany of the surveyed rental communities, we compared the maximum LIHTC net rent for efficiency unitsto the average market rent for one-bedroom units, which resulted in a 22.9 percent rent advantage. One-bedroom units have a 46.5 percent rent advantage; two-bedroom units have a 37.6 percent rentadvantage; and three-bedroom units have a 26.5 percent rent advantage. The overall weighted averagerent advantage of the project is 41.6 percent. Note that the evaluated rents are the lesser of the proposedcontract rents and the maximum allowable LIHTC net rent. It is important to note that none of the subjectproperty’s tenants will pay the proposed rents given PBV on all proposed units.
RPRG did not identify any comparable pipeline communities in the market area.
8. Absorption/Stabilization Estimates
Taking all market factors into account, we estimate High Rise Senior Apartments’ PBV unitswill lease-up as quickly as units become available and applications can be processed. We haveestimated the absorption at 16 units per month. Given the subject property is expected toretain 47 tenants (46.5 percent of all units) post rehabilitation, the subject property wouldreach a stabilized occupancy of 93 percent in approximately three to four months. If all 101units needed to be leased, the subject property would reach a stabilized occupancy within sixmonths.
Given the limited vacancies among both senior and general occupancy rental communities inthe High Rise Market Area and projected senior household growth over the next two years,we do not expect the rehabilitation of High Rise Senior Apartments to have a negative impacton existing rental communities in the High Rise Market Area including those with tax credits.Furthermore, the subject property is expected to retain a significant portion of tenants postrehabilitation.
9. Overall Conclusion / Recommendation
Based on an analysis of projected senior household growth trends, affordability and demandestimates (with PBV and tenant retention), current rental market conditions, and socio-economic and
High Rise Senior Apartments | Executive Summary
Page 6
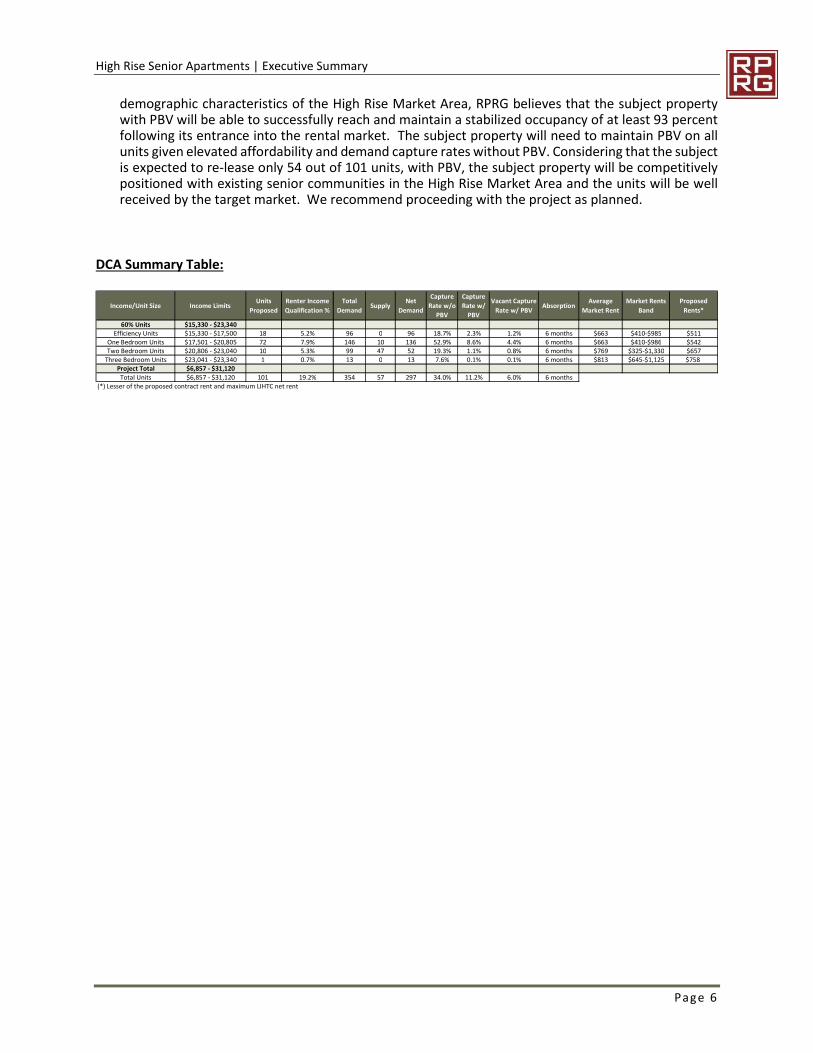
demographic characteristics of the High Rise Market Area, RPRG believes that the subject propertywith PBV will be able to successfully reach and maintain a stabilized occupancy of at least 93 percentfollowing its entrance into the rental market. The subject property will need to maintain PBV on allunits given elevated affordability and demand capture rates without PBV. Considering that the subjectis expected to re-lease only 54 out of 101 units, with PBV, the subject property will be competitivelypositioned with existing senior communities in the High Rise Market Area and the units will be wellreceived by the target market. We recommend proceeding with the project as planned.
DCA Summary Table:
Income/Unit Size Income LimitsUnits
Proposed
Renter Income
Qualification %
Total
DemandSupply
Net
Demand
Capture
Rate w/o
PBV
Capture
Rate w/
PBV
Vacant Capture
Rate w/ PBVAbsorption
Average
Market Rent
Market Rents
Band
Proposed
Rents*
60% Units $15,330 - $23,340Efficiency Units $15,330 - $17,500 18 5.2% 96 0 96 18.7% 2.3% 1.2% 6 months $663 $410-$985 $511
One Bedroom Units $17,501 - $20,805 72 7.9% 146 10 136 52.9% 8.6% 4.4% 6 months $663 $410-$986 $542Two Bedroom Units $20,806 - $23,040 10 5.3% 99 47 52 19.3% 1.1% 0.8% 6 months $769 $325-$1,330 $657
Three Bedroom Units $23,041 - $23,340 1 0.7% 13 0 13 7.6% 0.1% 0.1% 6 months $813 $645-$1,125 $758Project Total $6,857 - $31,120
Total Units $6,857 - $31,120 101 19.2% 354 57 297 34.0% 11.2% 6.0% 6 months(*) Lesser of the proposed contract rent and maximum LIHTC net rent
High Rise Senior Apartments | Executive Summary
Page 7
High Rise Senior Apartments | Introduction
Page 8
1. INTRODUCTION
A. Overview of Subject
The subject of this report is one of three residential buildings at High Rise Senior Apartments, anexisting HUD Section 202 rental community (restricted to seniors and disabled persons) in Rome,Floyd County, Georgia. As proposed, the rehabilitation of this particular High Rise Senior Apartmentsbuilding will be financed with four percent Low Income Housing Tax Credits (LIHTC) allocated by theGeorgia Department of Community Affairs (DCA) through the Rental Assistance Demonstration (RAD)program. This building will offer 101 newly renovated rental units reserved for elderly renterhouseholds (55+) earning at or below 60 percent of the Area Median Income (AMI), adjusted forhousehold size. All units will continue to have rent subsidies. Of the 101 units, 50 are Personal CareHome units, which will have the Medicaid waiver to address tenants in need of assisted living services.For the purposes of this market feasibility analysis, the subject will be referred to as High Rise SeniorApartments throughout the remainder of this report.
B. Purpose of Report
The purpose of this market study is to perform a market feasibility analysis through an examinationof the economic context, a demographic analysis of the defined market area, a competitive housinganalysis, a derivation of demand, and an affordability/penetration analysis.
C. Format of Report
The report format is comprehensive and conforms to DCA’s 2017 Market Study Manual. The marketstudy also considered the National Council of Housing Market Analysts’ (NCHMA) recommendedModel Content Standards and Market Study Index.
D. Client, Intended User, and Intended Use
The Client is Rea Ventures. Along with the Client, the Intended Users are the Northwest GeorgiaHousing Authority (NWGHA), DCA, Atlanta Housing Authority, potential lenders, and investors.
E. Applicable Requirements
This market study is intended to conform to the requirements of the following:
DCA’s 2017 Market Study Manual and Qualified Allocation Plan (QAP).
The National Council of Housing Market Analyst’s (NCHMA) Model Content Standards andMarket Study Index.
F. Scope of Work
To determine the appropriate scope of work for the assignment, we considered the intended use ofthe market study, the needs of the user, the complexity of the property, and other pertinent factors.Our concluded scope of work is described below:
Please refer to Appendix 5 and 6 for a detailed list of DCA and NCHMA requirements as wellas the corresponding pages of requirements within the report.
Zahara Kadir (Analyst) conducted a site visit on April 5, 2017.
High Rise Senior Apartments | Introduction
Page 9
Primary information gathered through field and phone interviews was used throughout thevarious sections of this report. The interviewees included rental community propertymanagers/leasing, Melvin Scott and LaRose Wilson of NWGHA, as well as Sue Hiller andHoward Gibson of the Rome-Floyd County Planning & Zoning Department.
All pertinent information obtained was incorporated in the appropriate section(s) of thisreport.
G. Report Limitations
The conclusions reached in a market assessment are inherently subjective and should not be reliedupon as a determinative predictor of results that will actually occur in the marketplace. There can beno assurance that the estimates made or assumptions employed in preparing this report will in factbe realized or that other methods or assumptions might not be appropriate. The conclusionsexpressed in this report are as of the date of this report, and an analysis conducted as of another datemay require different conclusions. The actual results achieved will depend on a variety of factors,including the performance of management, the impact of changes in general and local economicconditions, and the absence of material changes in the regulatory or competitive environment.Reference is made to the statement of Underlying Assumptions and Limiting Conditions contained inAppendix I of this report.
High Rise Senior Apartments | Introduction
Page 10
2. PROJECT DESCRIPTION
A. Project Overview
High Rise Senior Apartments will offer 101 newly rehabilitated rental units targeting seniorhouseholders (55+), all of which will benefit from Low Income Housing Tax Credits (LIHTC). All unitswill be reserved for households earning at or below 60 percent of the Area Median Income (AMI),adjusted for household size, and will have Project Based Voucher (PBV) through the Rental AssistanceDemonstration (RAD) program. The subject property’s units will be subject to maximum allowablerents, and prospective renters will be subject to maximum income limits; however, as tenant’sreceiving PBV only pay a percentage of their income toward rent, minimum income limits will notapply. Note that the subject will include 50 Personal Care Home units, which have the Medicaid waiverto address tenants in need of assisted living services. However, for the purpose of this analysis, wewill examine those units as senior units without subsidies.
B. Project Type and Target Market
High Rise Senior Apartments’ 101 LIHTC units with PBV will target low income senior households (55+)earning at or below 60 percent AMI, adjusted for household size. The subject property will appeal tosingles and couples with a unit mix of efficiency, one-, two- and three-bedroom floor plans.
C. Building Types and Placement
High Rise Senior Apartments’ 101 rental units are contained within one seven-story high-rise buildingwith elevator service, interior access hallways, and a brick exterior. The community also features freeon-site surface parking.
D. Detailed Project Description
1. Project Description
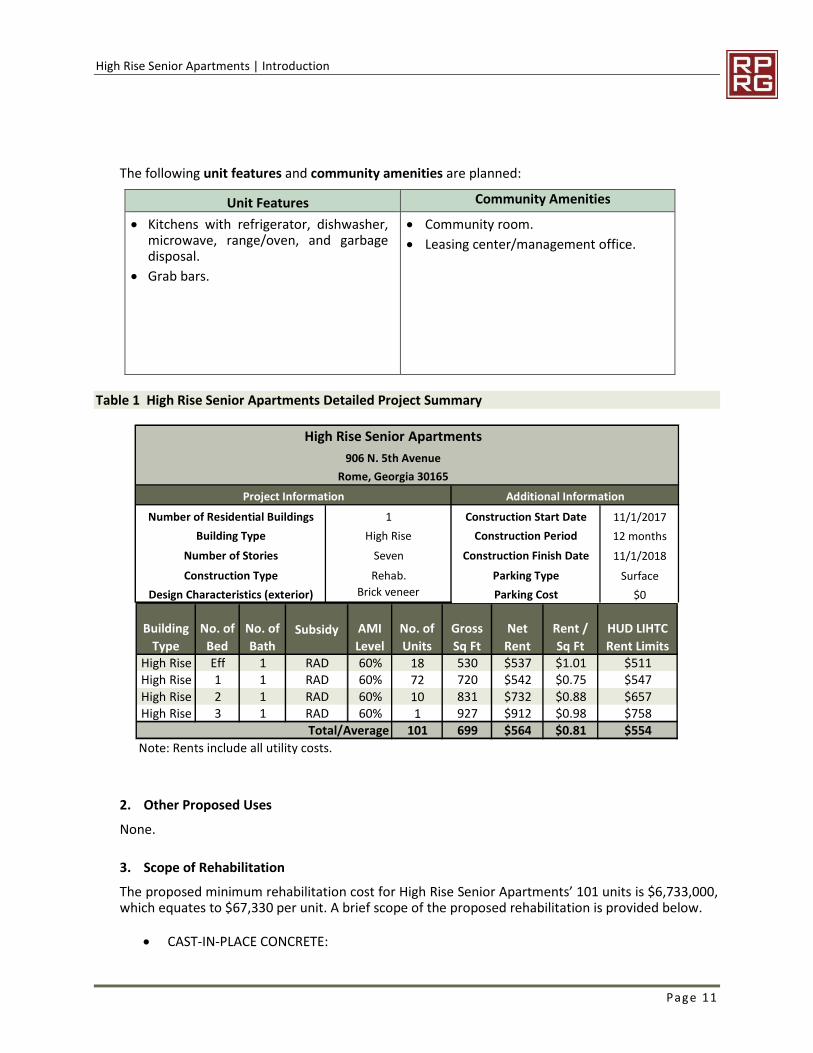
High Rise Senior Apartments will offer 101 LIHTC units, all with PBV, including 18 efficiencyunits, 72 one-bedroom units, 10 two-bedroom units, and one three-bedroom unit (Table 1).
Proposed unit sizes are 530 square feet for efficiency units; 720 square feet for one-bedroomunits; 831 square feet for two-bedroom units; and 927 square feet for three-bedroom units.
All units will have one bathroom.
Proposed rents are contract rents; tenants will only pay a percentage of adjusted income forrent with no minimum contribution. For the purposes of this analysis, the maximumallowable 60 percent AMI LIHTC net rents (the most that could be charged without PBV) havebeen analyzed as the proposed contract rents are above these levels.
Rents will include the cost of all utilities including water/sewer, gas, and electricity. A $200fee will be added for trash removal. The heat source and appliances for each unit will beelectric.
High Rise Senior Apartments | Introduction
Page 11
The following unit features and community amenities are planned:
Unit Features Community Amenities
Kitchens with refrigerator, dishwasher,microwave, range/oven, and garbagedisposal.
Grab bars.
Community room.
Leasing center/management office.
Table 1 High Rise Senior Apartments Detailed Project Summary
2. Other Proposed Uses
None.
3. Scope of Rehabilitation
The proposed minimum rehabilitation cost for High Rise Senior Apartments’ 101 units is $6,733,000,which equates to $67,330 per unit. A brief scope of the proposed rehabilitation is provided below.
CAST-IN-PLACE CONCRETE:
11/1/2017
12 months
11/1/2018
Surface
$0
Construction Type
Seven Construction Finish Date
Parking Cost
Parking TypeRehab.
Brick veneer
High Rise Senior Apartments
Rome, Georgia 30165
Construction Period
Project Information
Number of Residential Buildings
Building Type
Additional Information
Construction Start Date
906 N. 5th Avenue
1
High Rise
Number of Stories
Design Characteristics (exterior)
Building
Type
No. of
Bed
No. of
BathSubsidy AMI
Level
No. of
Units
Gross
Sq Ft
Net
Rent
Rent /
Sq Ft
HUD LIHTC
Rent LimitsHigh Rise Eff 1 RAD 60% 18 530 $537 $1.01 $511High Rise 1 1 RAD 60% 72 720 $542 $0.75 $547High Rise 2 1 RAD 60% 10 831 $732 $0.88 $657High Rise 3 1 RAD 60% 1 927 $912 $0.98 $758
Total/Average 101 699 $564 $0.81 $554
Note: Rents include all utility costs.
High Rise Senior Apartments | Introduction
Page 12
o Mailbox Pad: N/A, Existing interior mailbox to remain.o Bench Pads: N/A, Existing to remaino Dumpster: N/A – Existing to remaino Sidewalks (Accessibility & Repairs): Sidewalk replacement from HC parking to entry.o City sidewalks within ROW are outside of scope.
SITE AMENITIES: N/A – all amenities are internal.
PAVEMENT:o Driveways & Parking Lots: Repair existing cracks and damaged areas as required.
Approx. 4/10th of an acre of parking area to be topped and restriped.o Parking Lot Striping – Removal: Remove existing parking lot striping so that new
striping is easily identifiable as needed, front entry and rear parking area.o Parking Lot Striping: Provide new striping for all parking spaces including compliant
ADA accessible parking spaces and walkways as needed.o Parking Lot Striping - HC: Provide a new handicap accessible parking striping.o Parking Lot Striping – HC Crosswalk: Provide new handicap accessible crosswalk
striping if neededo Parking Signage - Handicap: Signage is newer, to remain.o Parking Signage – Van Accessible: Provide new van accessible sign for van accessible
parking space as needed.o Parking Lot – Pressure Wash: Pressure wash all horizontal concrete surfaces prior to
restriping.
LANDSCAPING & PLANTING:o Landscaping Planting: Protect existing plantings during construction, provide an
allowance to prune trees, and provide budget of $500 per unit for new landscaping.
EXTERIOR BUILDING ITEMS:o MASONRY:
Façade Cleaning: Clean exterior brick façade, concrete ribs, horizontalbands/walks, and entryway sidewalk to building.
Provide allowance for repointing.o METAL FABRICATIONS:
Replace Exterior railings, secured to existing deck.o THERMAL INSULATION: NA – Existing to remain.o ROOFING AND ACCESSORIES:
Existing roofing to remain.o DOORS & FRAMES:
Exterior Doors – Existing sensor doors to remain at main entry. Replace Unitlevel doors.
Exterior Door Signage - Replace existing signage to all entries.o WINDOWS & BLINDS:
Exterior Windows: Replace All existing windows. Window Treatments: Replace with new 2” faux wood window blinds.
NWGHA to salvage existing.o FINISH HARDWARE:
Exterior Doors: Replace exterior door hardware. Supply hardware on new interior doors.
o MISCELLANEOUS SPECIALTIES: Mailbox Structure: Interior Mailboxes: Interior, replace
High Rise Senior Apartments | Introduction
Page 13
Building Signage: Replace the existing building signage with new signage.
INTERIOR BUILDING ITEMS:o ROUGH CARPENTRY:
Reconfigure interior walls. See framing layout on first floor for commercial space. Framing as required for reconfigured rooms and/or bump outs for
plumbing.o DOORS & FRAMES:
Interior Unit Door: Provide units with new doors see schedule. Interior Unit Door Hardware: Provide new hardware on new unit interior
doors only. Provide lever type at Handicap Units and doors at CommunityBuilding. At standard units match existing hardware.
Door Bumpers: Provide an allowance to replace (4) four door bumpers ateach apartment unit interior doors.
o FLOORING: Existing – All existing flooring finishes to be removed. See specs for tile flooring at kitchenette and LVT throughout rest of unit. Base – See finish schedule for base. Tub Strips –Replace tub strips.
o GYPSUM BOARD: Patch and repair existing walls to remain as need to finish shown on plans. Tub Repair – Drywall: Repair adjacent drywall at all tub/showers per
drawings. Ceiling Repair – Drywall: Ceilings to be stripped and gypsum ceiling to be
replaced.o PAINTING:
Painting – Full Unit: Repaint apartment unit interior per Finish Schedule. Paint – Exterior Unit Doors: Paint exterior apartment unit and storage doors
per Painting Schedule. Painting – New Interior Door: Provide a new door paint allowance per total
bedrooms. Painting – Ceiling: see Finish Schedule.
o TOILET & BATH ACCESSORIES: Paper Holder: Provide a new toilet paper holder at apartment units as
specified Towel Bars: Provide new towel bars at apartment units. (as specified in
drawings) Shower Rod: Provide a new shower rod at apartment units. Grab Bars – UFAS Handicap Accessible Units: Replace grab bars at toilets,
see plans for location. Grab Bars – Community Building: Replace grab bars at toilets, see plans for
location. Wood Backer Board: Provide a wood backer board at apartment unit Bathroom for installation of accessories as required. Framed Mirror all units. Medicine Cabinet – NA. See new floor plans, need to be coordinated with RCP.
o RESIDENTIAL APPLIANCES:
High Rise Senior Apartments | Introduction
Page 14
Ranges: No ranges specified in units, DCA waiver requested. Range Hoods: See above. Fire Suppression Extinguishers: See above Range Cord: See above. Refrigerators: Replace all refrigerators with an Energy Star Qualified model. Install new accessible microwave as noted. NO garbage disposal
o RESIDENTIAL CABINETS: Cabinets – Standard Unit: Replace all Kitchen and Bath cabinets including
countertops (see specs in drawing set and basis of design). Kitchen Grease Shield: See tile pattern at cabinets. Cabinets - UFAS Handicap Accessible Unit: Replace existing Kitchen cabinets
including countertops with removable bases as noted on drawings.o PLUMBING FIXTURES & EQUIPMENT:
Kitchen Sinks & Trim: Replace existing Kitchen sinks and trim at all units perplans and specifications – UFAS Handicap unit replace with accessible sink.
Tub/Shower Units & Trim – UFAS Handicap Accessible Unit: Replace tubsand surrounds with roll in drain pan. Walls to be tile as specified ondrawings. Shower shall have grab bars and tub seat to meet accessibilitystandards as required.
Non ADA units – reglaze existing tubs, surround to be tile as specified. Lavatories & Trim - UFAS Handicap Accessible Unit: Replace existing
Bathroom lavatories and trim per plans and specifications. Lavatories & Trim - Standard Unit: Replace existing Bathroom lavatories and
trim per plans and specifications. Toilets - UFAS Handicap Accessible Unit: Replace toilet with new elongated
type per plans and specifications. Toilets - Standard Unit: Replace toilet per plans and specifications. Unit level Water Heating supplied by existing boiler. Provide new Ice Maker Supply wall box for refrigerator/freezers in units. DEMO existing lines as required for relocated fixtures, see notes on plans. Install new sanitary as required for relocated fixtures. Install new domestic water lines within units as required for relocated
fixtures. Hub Drains: Replace as noted on drawings, route condensate as noted on
drawings.o HVAC EQUIPMENT:
Demo existing hydronic heating boiler and existing wall heaters as noted ondrawings.
Replace with PTAC units as specified on drawings.. Replace existing exhaust fans as noted on drawings. See drawings for Kitchen Equipment related HVAC and hoods at ground
level.o ELECTRICAL:
GFI Outlets: Remove and replace all existing GFI outlets with new outlets inapartment units.
Bath Exhaust Fans: Remove and replace all Bathroom exhaust fans with new50 cfm exhaust fans. Switched with light and on timer.
High Rise Senior Apartments | Introduction
Page 15
Range Hood: NA. Hot Water Heater: Make electrical connections at new water heater for KE. Electrical Switches, Outlets, and Cover Plates: Remove and replace existing
light switch and outlets and their plates with new (see drawing notes). Interior Light Fixtures: Make electrical connections at new fixtures. Exterior Light Fixtures: Make electrical connections at new fixtures. AHU Wiring & Breaker: Install new 150 amp electrical panel as noted in
drawing. Ceiling Fan – NA Install new hard wired smoke detectors. Full replacement of mains to each unit and rewire interior of each unit. New electric panels. Coordinate kitchen outlet and switch locations with cabinetry and locate as
needed.o LIGHTING:
Exterior Unit Entry Lighting: Replace. Dining Area Lighting: Replace. Kitchen Lighting: Replace. Bathroom Lighting: Replace. Hallway Lighting: Replace. Bedroom Lighting: Replace. Pantry/Storage Lighting: Replace. Community Building Interior Lighting: Replace. Community Building Exterior Lighting: Replace. Apartment Unit Outside Storage Room Lighting: NA. Smoke Detectors - Units: Install new detectors in every Bedroom per the
National Electrical Code. Smoke Detectors – Community Building: Install new detectors per the
National Electrical Code. Strobe and Horn Smoke Detector - Sensory Unit: Provide to meet Sensory
Guidelines. Install per the National Electrical Code. Strobe and Horn for Doorbell - Sensory Unit: Provide to meet Sensory
Guidelines.
4. Current Property Conditions
High Rise Senior Apartments is a 101-unit elderly public housing property. The community is onecomponent to AMP 1, which consists of two other similarly structured buildings located on adjacentlots. The NWGHA reported that 55 of the 101 units are vacant in anticipation of the upcomingrehabilitation. As tenants receiving PBV only pay a percentage of their income toward rent, theproposed contract rents following rehabilitation will have no bearing on the subject property’saffordability. For the purposes of this analysis, the subject property is expected to retain 47 tenantsor 46.5 percent of its 101 total units post rehabilitation.
5. Proposed Timing of Development
High Rise Senior Apartments is expected to begin renovations in 2017 and the full rehabilitation isexpected to complete in 2018. For the purposes of this report, the subject property’s anticipatedplaced-in-service year is 2018.
High Rise Senior Apartments | Introduction
Page 16
3. SITE AND NEIGHBORHOOD ANALYSIS
A. Site Analysis
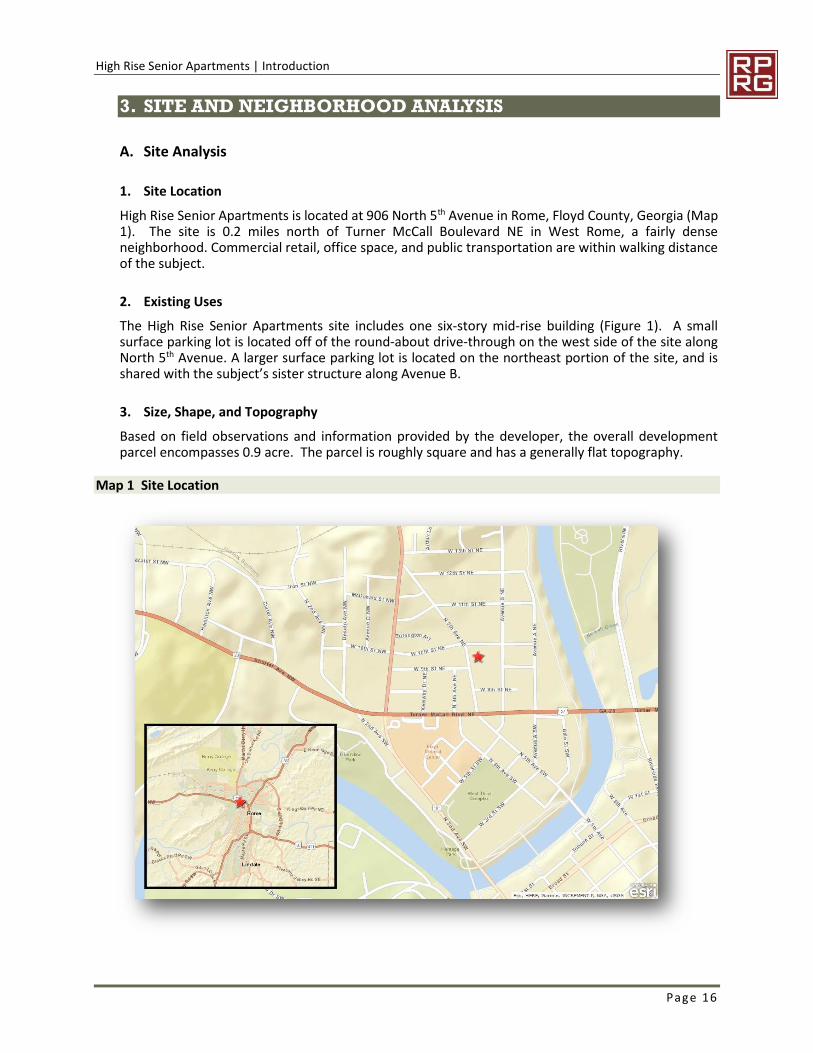
1. Site Location
High Rise Senior Apartments is located at 906 North 5th Avenue in Rome, Floyd County, Georgia (Map1). The site is 0.2 miles north of Turner McCall Boulevard NE in West Rome, a fairly denseneighborhood. Commercial retail, office space, and public transportation are within walking distanceof the subject.
2. Existing Uses
The High Rise Senior Apartments site includes one six-story mid-rise building (Figure 1). A smallsurface parking lot is located off of the round-about drive-through on the west side of the site alongNorth 5th Avenue. A larger surface parking lot is located on the northeast portion of the site, and isshared with the subject’s sister structure along Avenue B.
3. Size, Shape, and Topography
Based on field observations and information provided by the developer, the overall developmentparcel encompasses 0.9 acre. The parcel is roughly square and has a generally flat topography.
Map 1 Site Location
High Rise Senior Apartments | Introduction
Page 17
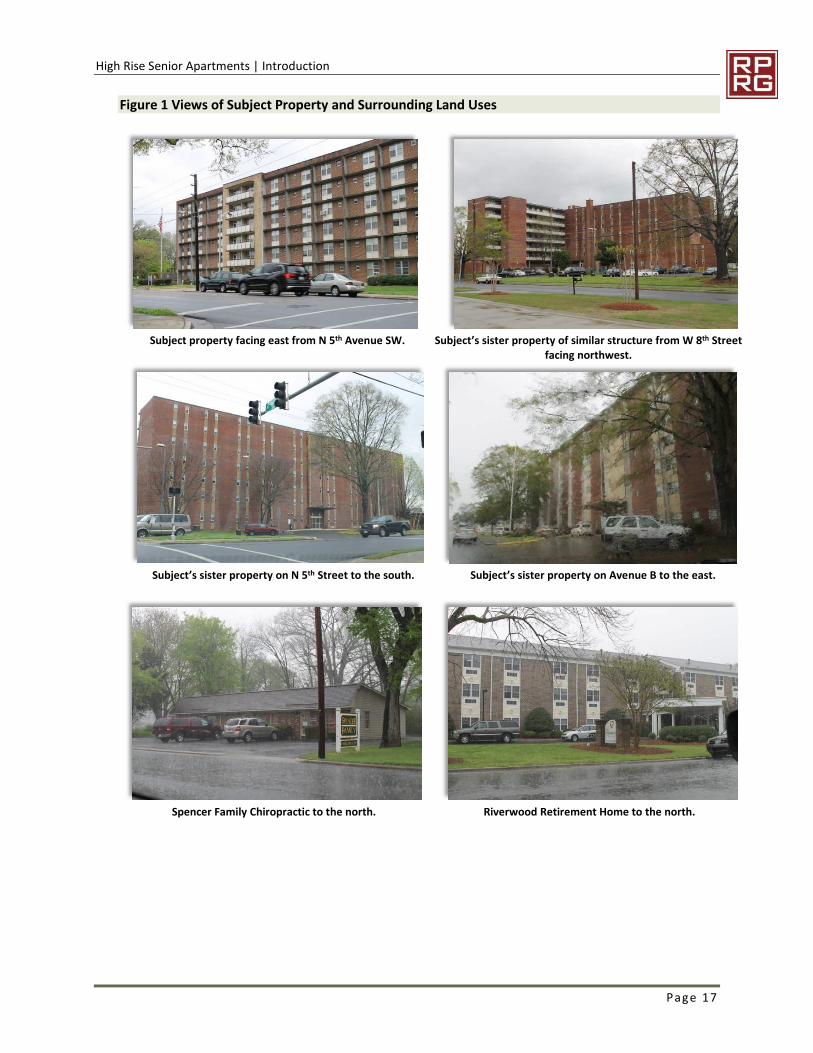
Figure 1 Views of Subject Property and Surrounding Land Uses
Subject property facing east from N 5th Avenue SW. Subject’s sister property of similar structure from W 8th Streetfacing northwest.
Subject’s sister property on N 5th Street to the south. Subject’s sister property on Avenue B to the east.
Spencer Family Chiropractic to the north. Riverwood Retirement Home to the north.
High Rise Senior Apartments | Introduction
Page 18
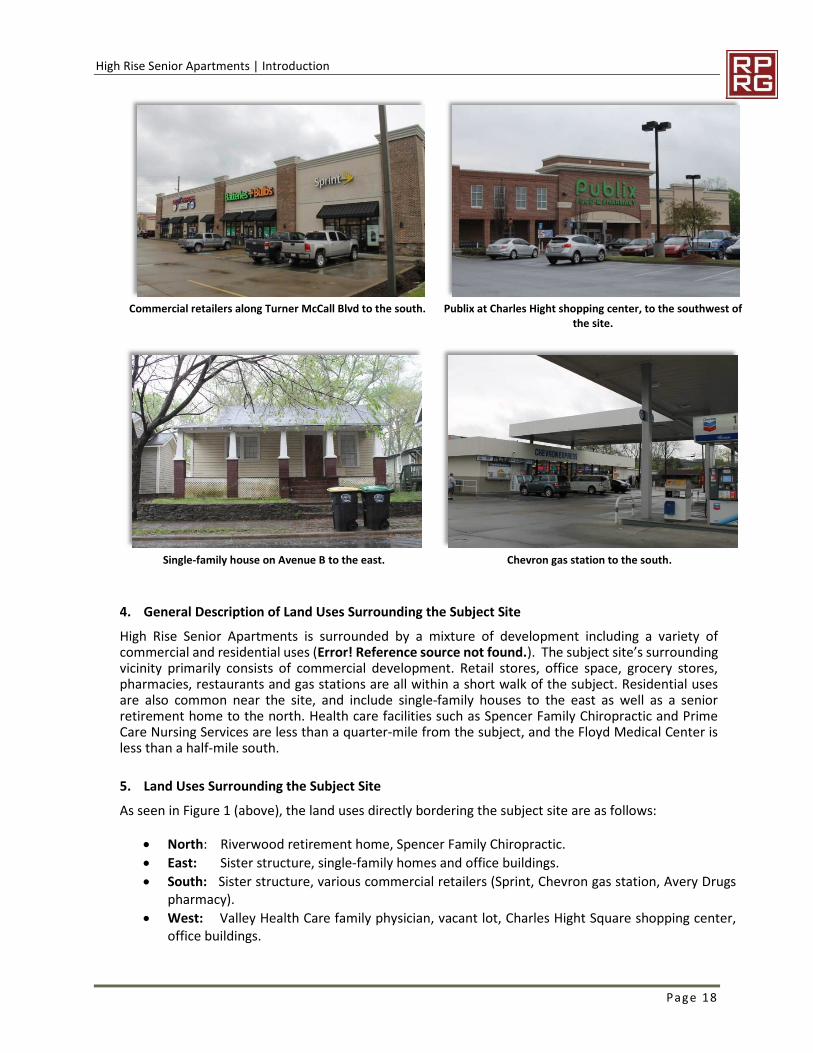
Commercial retailers along Turner McCall Blvd to the south. Publix at Charles Hight shopping center, to the southwest ofthe site.
Single-family house on Avenue B to the east. Chevron gas station to the south.
4. General Description of Land Uses Surrounding the Subject Site
High Rise Senior Apartments is surrounded by a mixture of development including a variety ofcommercial and residential uses (Error! Reference source not found.). The subject site’s surroundingvicinity primarily consists of commercial development. Retail stores, office space, grocery stores,pharmacies, restaurants and gas stations are all within a short walk of the subject. Residential usesare also common near the site, and include single-family houses to the east as well as a seniorretirement home to the north. Health care facilities such as Spencer Family Chiropractic and PrimeCare Nursing Services are less than a quarter-mile from the subject, and the Floyd Medical Center isless than a half-mile south.
5. Land Uses Surrounding the Subject Site
As seen in Figure 1 (above), the land uses directly bordering the subject site are as follows:
North: Riverwood retirement home, Spencer Family Chiropractic.
East: Sister structure, single-family homes and office buildings.
South: Sister structure, various commercial retailers (Sprint, Chevron gas station, Avery Drugspharmacy).
West: Valley Health Care family physician, vacant lot, Charles Hight Square shopping center,office buildings.
High Rise Senior Apartments | Introduction
Page 19
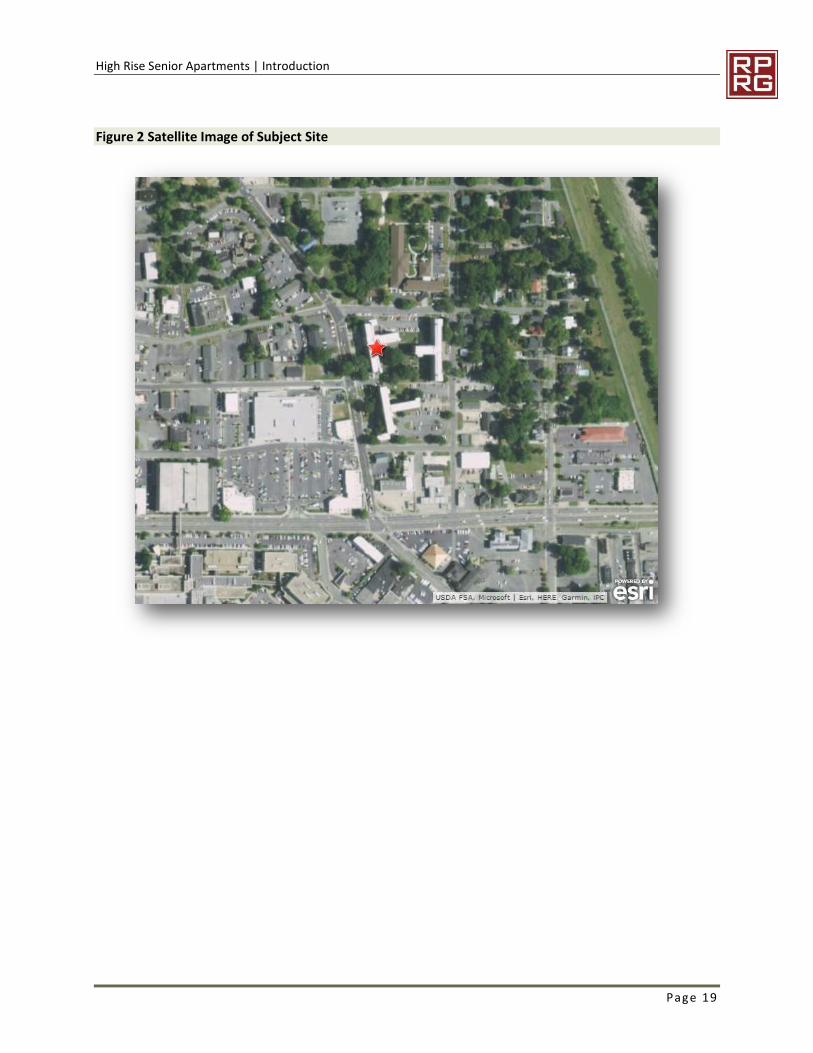
Figure 2 Satellite Image of Subject Site
High Rise Senior Apartments | Site and Neighborhood Analysis
Page 20
B. Neighborhood Analysis
1. General Description of Neighborhood
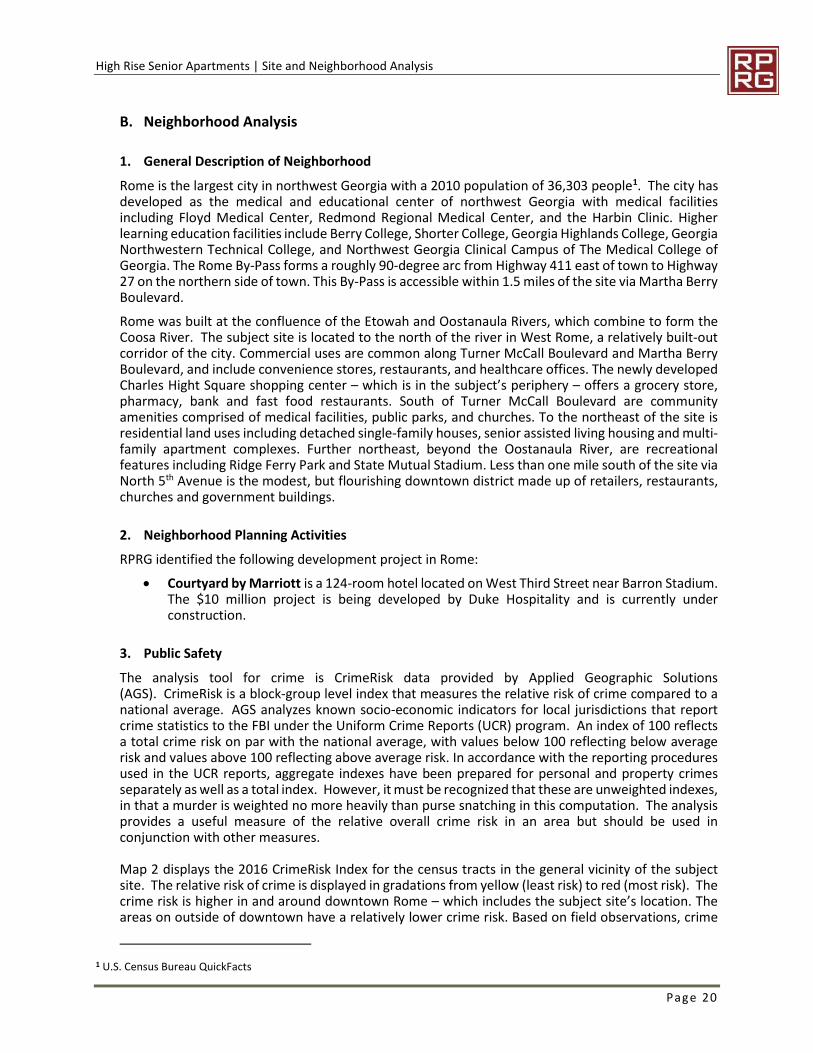
Rome is the largest city in northwest Georgia with a 2010 population of 36,303 people1. The city hasdeveloped as the medical and educational center of northwest Georgia with medical facilitiesincluding Floyd Medical Center, Redmond Regional Medical Center, and the Harbin Clinic. Higherlearning education facilities include Berry College, Shorter College, Georgia Highlands College, GeorgiaNorthwestern Technical College, and Northwest Georgia Clinical Campus of The Medical College ofGeorgia. The Rome By-Pass forms a roughly 90-degree arc from Highway 411 east of town to Highway27 on the northern side of town. This By-Pass is accessible within 1.5 miles of the site via Martha BerryBoulevard.
Rome was built at the confluence of the Etowah and Oostanaula Rivers, which combine to form theCoosa River. The subject site is located to the north of the river in West Rome, a relatively built-outcorridor of the city. Commercial uses are common along Turner McCall Boulevard and Martha BerryBoulevard, and include convenience stores, restaurants, and healthcare offices. The newly developedCharles Hight Square shopping center – which is in the subject’s periphery – offers a grocery store,pharmacy, bank and fast food restaurants. South of Turner McCall Boulevard are communityamenities comprised of medical facilities, public parks, and churches. To the northeast of the site isresidential land uses including detached single-family houses, senior assisted living housing and multi-family apartment complexes. Further northeast, beyond the Oostanaula River, are recreationalfeatures including Ridge Ferry Park and State Mutual Stadium. Less than one mile south of the site viaNorth 5th Avenue is the modest, but flourishing downtown district made up of retailers, restaurants,churches and government buildings.
2. Neighborhood Planning Activities
RPRG identified the following development project in Rome:
Courtyard by Marriott is a 124-room hotel located on West Third Street near Barron Stadium.The $10 million project is being developed by Duke Hospitality and is currently underconstruction.
3. Public Safety
The analysis tool for crime is CrimeRisk data provided by Applied Geographic Solutions(AGS). CrimeRisk is a block-group level index that measures the relative risk of crime compared to anational average. AGS analyzes known socio-economic indicators for local jurisdictions that reportcrime statistics to the FBI under the Uniform Crime Reports (UCR) program. An index of 100 reflectsa total crime risk on par with the national average, with values below 100 reflecting below averagerisk and values above 100 reflecting above average risk. In accordance with the reporting proceduresused in the UCR reports, aggregate indexes have been prepared for personal and property crimesseparately as well as a total index. However, it must be recognized that these are unweighted indexes,in that a murder is weighted no more heavily than purse snatching in this computation. The analysisprovides a useful measure of the relative overall crime risk in an area but should be used inconjunction with other measures.
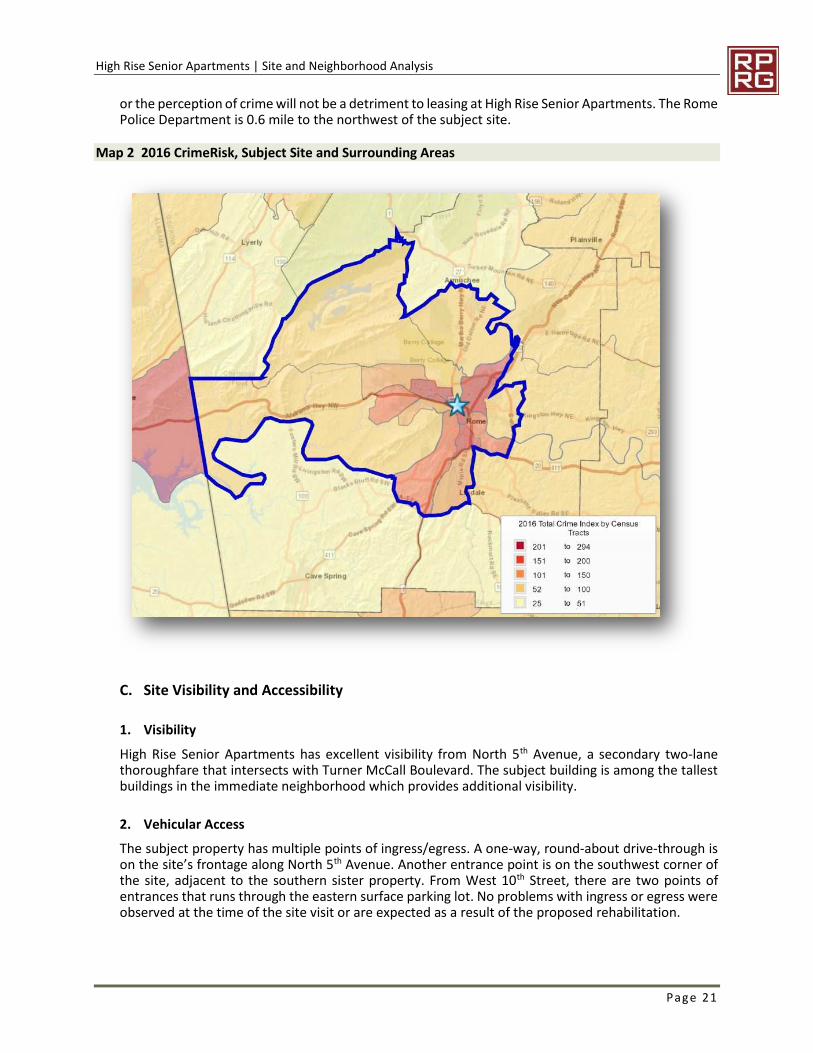
Map 2 displays the 2016 CrimeRisk Index for the census tracts in the general vicinity of the subjectsite. The relative risk of crime is displayed in gradations from yellow (least risk) to red (most risk). Thecrime risk is higher in and around downtown Rome – which includes the subject site’s location. Theareas on outside of downtown have a relatively lower crime risk. Based on field observations, crime
1 U.S. Census Bureau QuickFacts
High Rise Senior Apartments | Site and Neighborhood Analysis
Page 21
or the perception of crime will not be a detriment to leasing at High Rise Senior Apartments. The RomePolice Department is 0.6 mile to the northwest of the subject site.
Map 2 2016 CrimeRisk, Subject Site and Surrounding Areas
C. Site Visibility and Accessibility
1. Visibility
High Rise Senior Apartments has excellent visibility from North 5th Avenue, a secondary two-lanethoroughfare that intersects with Turner McCall Boulevard. The subject building is among the tallestbuildings in the immediate neighborhood which provides additional visibility.
2. Vehicular Access
The subject property has multiple points of ingress/egress. A one-way, round-about drive-through ison the site’s frontage along North 5th Avenue. Another entrance point is on the southwest corner ofthe site, adjacent to the southern sister property. From West 10th Street, there are two points ofentrances that runs through the eastern surface parking lot. No problems with ingress or egress wereobserved at the time of the site visit or are expected as a result of the proposed rehabilitation.
High Rise Senior Apartments | Site and Neighborhood Analysis
Page 22
3. Availability of Public Transit
The Rome Transit Department (RTD) operates fixed route public bus transportation throughout Rome.The subject is 0.1-mile walk to the nearest bus stop on Avenue B, which is served by Route One A andRoute One B. Both routes serve West Rome passing through Harbin Clinic, Redmond RegionalHospital, Walmart, Shorter College and Floyd Medical Center. All RTD routes connect to the MidtownTransit Station in the downtown district, providing connections throughout the city. Main Lineservices are available Monday through Friday from 5:40AM to 6:30PM.
4. Availability of Inter-Regional Transit
The Russell Regional Airport/Towers Field is a general aviation facility operated by Rome-FloydCounty. Atlanta’s Hartsfield-Jackson International Airport is 70 miles from downtown Rome.
5. Accessibility Improvements under Construction and Planned
Roadway Improvements under Construction and Planned
RPRG reviewed information from local stakeholders to assess whether any capital improvementprojects affecting road, transit, or pedestrian access to the subject site are currently underway orlikely to commence within the next few years. Observations made during the site visit contributed tothe process. No significant roadway projects were identified as planned that would benefit the site.
Transit and Other Improvements under Construction and/or Planned
None identified.
6. Environmental Concerns
No visible environmental site concerns were identified.
D. Residential Support Network
1. Key Facilities and Services near the Subject Site
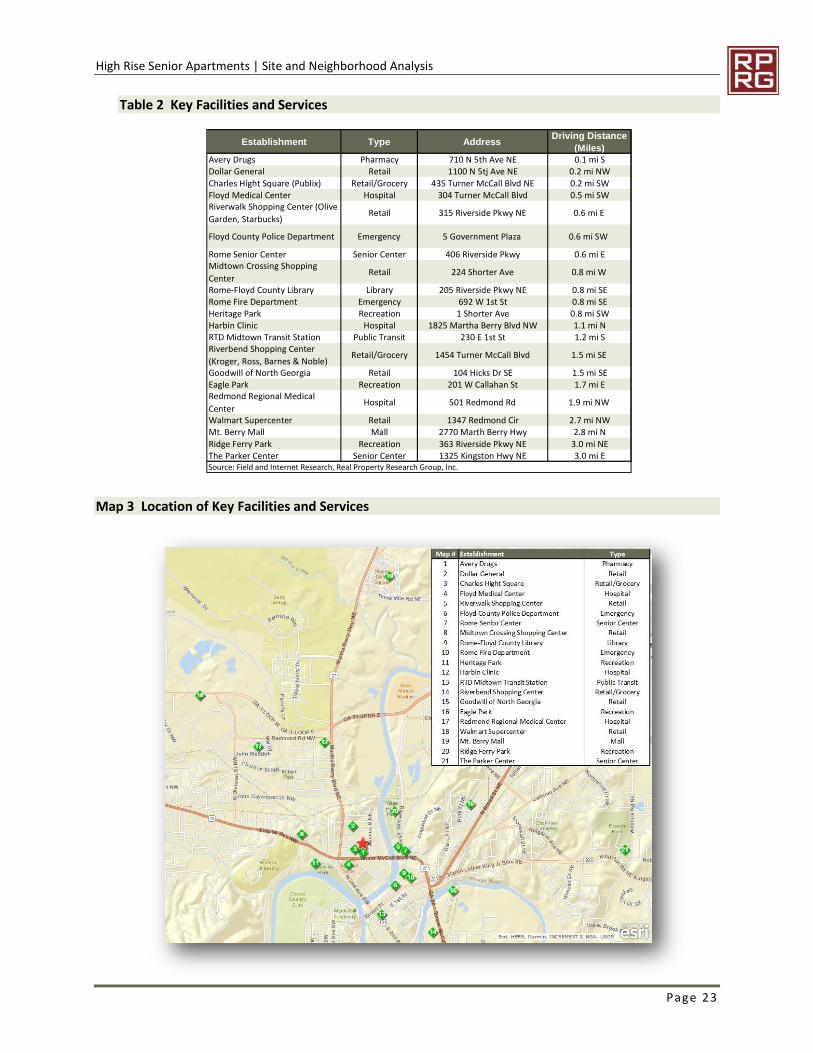
The appeal of any given community is often based in part on its proximity to those facilities andservices required on a daily basis. Key facilities and services and their driving distances from thesubject site are listed in Table 2. The location of those facilities is plotted on Error! Reference sourcenot found..
High Rise Senior Apartments | Site and Neighborhood Analysis
Page 23
Table 2 Key Facilities and Services
Map 3 Location of Key Facilities and Services
Establishment Type AddressDriving Distance
(Miles)Avery Drugs Pharmacy 710 N 5th Ave NE 0.1 mi SDollar General Retail 1100 N 5tj Ave NE 0.2 mi NW
Charles Hight Square (Publix) Retail/Grocery 435 Turner McCall Blvd NE 0.2 mi SWFloyd Medical Center Hospital 304 Turner McCall Blvd 0.5 mi SWRiverwalk Shopping Center (Olive
Garden, Starbucks)Retail 315 Riverside Pkwy NE 0.6 mi E
Floyd County Police Department Emergency 5 Government Plaza 0.6 mi SW
Rome Senior Center Senior Center 406 Riverside Pkwy 0.6 mi EMidtown Crossing Shopping
CenterRetail 224 Shorter Ave 0.8 mi W
Rome-Floyd County Library Library 205 Riverside Pkwy NE 0.8 mi SERome Fire Department Emergency 692 W 1st St 0.8 mi SEHeritage Park Recreation 1 Shorter Ave 0.8 mi SWHarbin Clinic Hospital 1825 Martha Berry Blvd NW 1.1 mi NRTD Midtown Transit Station Public Transit 230 E 1st St 1.2 mi SRiverbend Shopping Center
(Kroger, Ross, Barnes & Noble)Retail/Grocery 1454 Turner McCall Blvd 1.5 mi SE
Goodwill of North Georgia Retail 104 Hicks Dr SE 1.5 mi SEEagle Park Recreation 201 W Callahan St 1.7 mi ERedmond Regional Medical
CenterHospital 501 Redmond Rd 1.9 mi NW
Walmart Supercenter Retail 1347 Redmond Cir 2.7 mi NWMt. Berry Mall Mall 2770 Marth Berry Hwy 2.8 mi N
Ridge Ferry Park Recreation 363 Riverside Pkwy NE 3.0 mi NEThe Parker Center Senior Center 1325 Kingston Hwy NE 3.0 mi ESource: Field and Internet Research, Real Property Research Group, Inc.
High Rise Senior Apartments | Site and Neighborhood Analysis
Page 24
2. Essential Services
Health Care
Rome has a significant Healthcare presence as it is home to Floyd Medical Center, Redmond RegionalMedical Center, and the Harbin Clinic:
Floyd Medical Center is Rome’s largest medical provider and employer with 304 beds andmore than 2,000 employees. Floyd Medical Center provides a wide range of services includinga Level II Trauma Center, Primary Stroke Center, and general services/emergency medicine.Floyd Medical Center is just northwest of downtown Rome and within 0.6 mile of the site nearthe intersection of Turner McColl Boulevard and Martha Berry Highway.
The Harbin Clinic features more than 140 doctors with 35 specialties and is the largestprivately owned multispecialty medical clinic in Georgia. Harbin Clinic offers 27 officesthroughout Northwest Georgia including Rome, Cartersville, Calhoun, and Summerville.
Redmond Regional Medical Center is a private acute-care hospital with 230 beds. RedmondRegional offers a wide range of services, but specializes in cardiac services and is the onlydedicated chest pain center in Northwest Georgia. Redmond Regional employs more than1,200 people is about two miles to the northwest of the site along Martha Berry Highway.
Several smaller medical clinics serve Rome, including the Valley Healthcare family physician,PrimeCare Nursing, and Fifth Avenue Health Care Center – all of which less than a half-mile from thesite. Other medical service providers are located within close proximity of the major hospitals.
Senior Centers
The closest senior services to the subject site are the Rome Senior Center and the Parker Center. TheRome Senior Center is located across the street from Ridge Ferry Park on 406 Riverside Parkway, 0.6miles east of the subject. This senior center features a banquet room equipped with a catering kitchen.Daily activities are held between the hours of 8 AM and 12 PM, and include nutritional seminars,billiards, singing, arts and crafts, and more. During this time, participants are provided meals. TheParker Center is located three miles east of the site on 1325 Kington Highway in Etowah Park, andfeatures a banquet room, party/meeting room, and billiards. The center offers activities such as yoga,softball, karaoke, cyber assistance classes and dance classes. Additionally, the Parker Center providesseniors with resources for health and supportive service, nutritional services, housing, financialservices and legal advice among many other services.
3. Commercial Goods and Services
Convenience Goods
The term “convenience goods” refers to inexpensive, nondurable items that households purchase ona frequent basis and for which they generally do not comparison shop. Examples of conveniencegoods are groceries, fast food, health and beauty aids, household cleaning products, newspapers, andgasoline.
High Rise Senior Apartments is adjacent to Charles Hight Square, which is anchored by Publix grocerystore and pharmacy. The shopping center also includes a Wells Fargo bank and restaurants such as LaParrilla Mexican and Jimmy John’s. Two other pharmacies are proximate to the subject: Avery Drugsis 0.1 mile south of the site on North 5th Avenue and Walgreens is 0.3 miles to the west. Restaurantoptions along Martha Berry Boulevard include Wendy’s, Arby’s, and Pizza Hut. A Chevron gas stationis located along Turner McCall Boulevard, 0.2 mile south of the site. Riverwalk Shopping Center offers
High Rise Senior Apartments | Site and Neighborhood Analysis
Page 25
several restaurants including Olive Garden, Starbucks and smaller retailers, and is just 0.6 mile east ofthe site.
Shoppers Goods
The term “shoppers goods” refers to larger ticket merchandise that households purchase on aninfrequent basis and for which they usually comparison shop. The category is sometimes called“comparison goods.” Examples of shoppers’ goods are apparel and accessories, furniture and homefurnishings, appliances, jewelry, and sporting goods.
The Mount Berry Mall, anchored by JC Penny, Belk and Dunham’s Sporting Goods, is less than threemiles north of the site. Midtown Crossing is located on 224 Shorter Avenue, less than one mile westof the site. The shopping center consists of Hobby Lobby and Staples as well as several restaurantsincluding Chick-fil-A and LongHorn Steakhouse. Riverbend Shopping Center (1.5 miles southest) offersa Kroger, TJ Maxx, Barnes and Noble, and Ross as well as several restaurants. Discount retailers suchas Dollar General and Goodwill are within 1.5 miles of the site, and the closest Walmart is 2.7 milesnorthwest on 1347 Redmond Circle.
4. Recreational Amenities
The Rome Floyd Parks and Recreation Authority operates more than 20 facilities including parks,playgrounds, swimming centers, a tennis center, and Barron Stadium.
The closest facility to the site is Ridge Ferry Park, located 0.7 mile north. Ridge Ferry Park is a 60 acrepark along the Oostanaula River and features several pavilions, a playground, restrooms, access tothe Heritage Trail, and docks/boat ramps on the river. The subject site is also within close proximityof a public library, Heritage Park, and the Rome Area History Museum. Other recreational amenitiesin the area include the Rome Braves’ stadium, Chieftains Museum, and Oak Hill (Martha BerryMuseum).
5. Location of Low Income Housing
A list and map of existing low-income housing in the High Rise Market Area are provided in the ExistingLow Income Rental Housing section of this report, starting on page 50.
E. Site Conclusion
The subject site is compatible with surrounding land uses and is within one-half mile of a number ofcommunity amenities including major healthcare facilities and senior services. The site is also withina short walking distance (0.1 mile) of a RTD public bus transportation route. Based on these factorsand excellent visibility from the surrounding neighborhood, the site for High Rise Senior Apartmentsis appropriate for its current and future intended use of affordable senior rental housing.
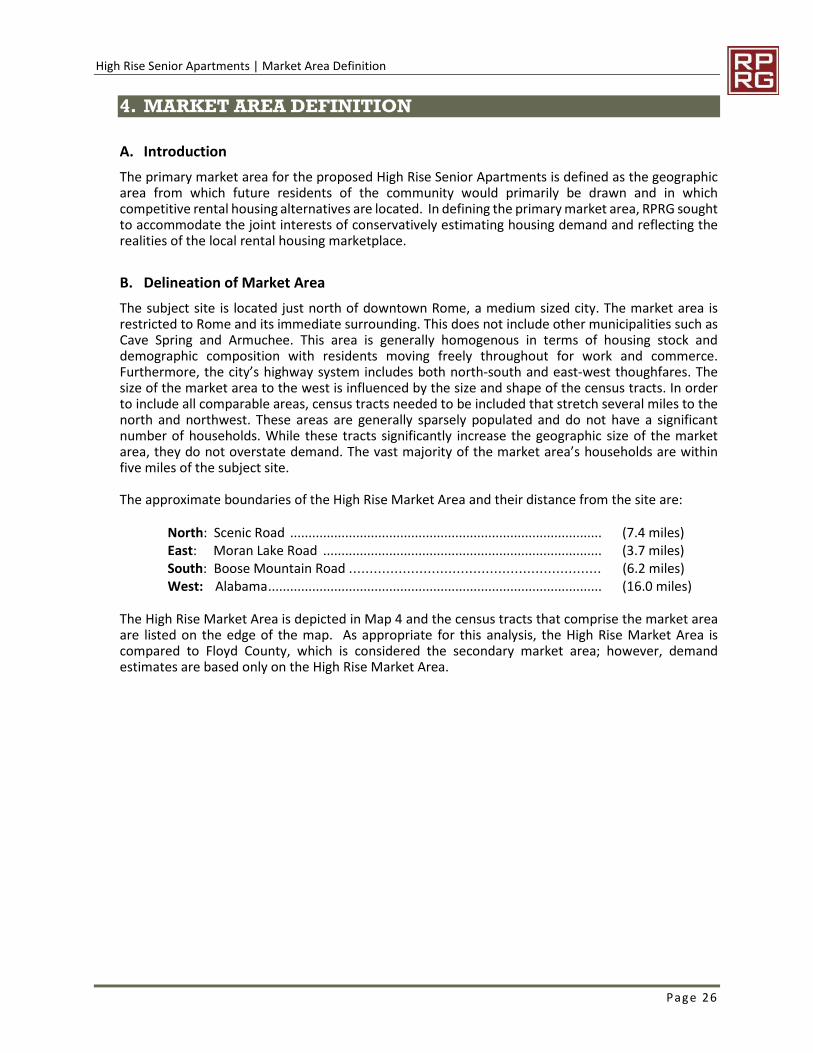
High Rise Senior Apartments | Market Area Definition
Page 26
4. MARKET AREA DEFINITION
A. Introduction
The primary market area for the proposed High Rise Senior Apartments is defined as the geographicarea from which future residents of the community would primarily be drawn and in whichcompetitive rental housing alternatives are located. In defining the primary market area, RPRG soughtto accommodate the joint interests of conservatively estimating housing demand and reflecting therealities of the local rental housing marketplace.
B. Delineation of Market Area
The subject site is located just north of downtown Rome, a medium sized city. The market area isrestricted to Rome and its immediate surrounding. This does not include other municipalities such asCave Spring and Armuchee. This area is generally homogenous in terms of housing stock anddemographic composition with residents moving freely throughout for work and commerce.Furthermore, the city’s highway system includes both north-south and east-west thoughfares. Thesize of the market area to the west is influenced by the size and shape of the census tracts. In orderto include all comparable areas, census tracts needed to be included that stretch several miles to thenorth and northwest. These areas are generally sparsely populated and do not have a significantnumber of households. While these tracts significantly increase the geographic size of the marketarea, they do not overstate demand. The vast majority of the market area’s households are withinfive miles of the subject site.
The approximate boundaries of the High Rise Market Area and their distance from the site are:
North: Scenic Road ..................................................................................... (7.4 miles)East: Moran Lake Road ............................................................................ (3.7 miles)South: Boose Mountain Road ............................................................. (6.2 miles)West: Alabama........................................................................................... (16.0 miles)
The High Rise Market Area is depicted in Map 4 and the census tracts that comprise the market areaare listed on the edge of the map. As appropriate for this analysis, the High Rise Market Area iscompared to Floyd County, which is considered the secondary market area; however, demandestimates are based only on the High Rise Market Area.
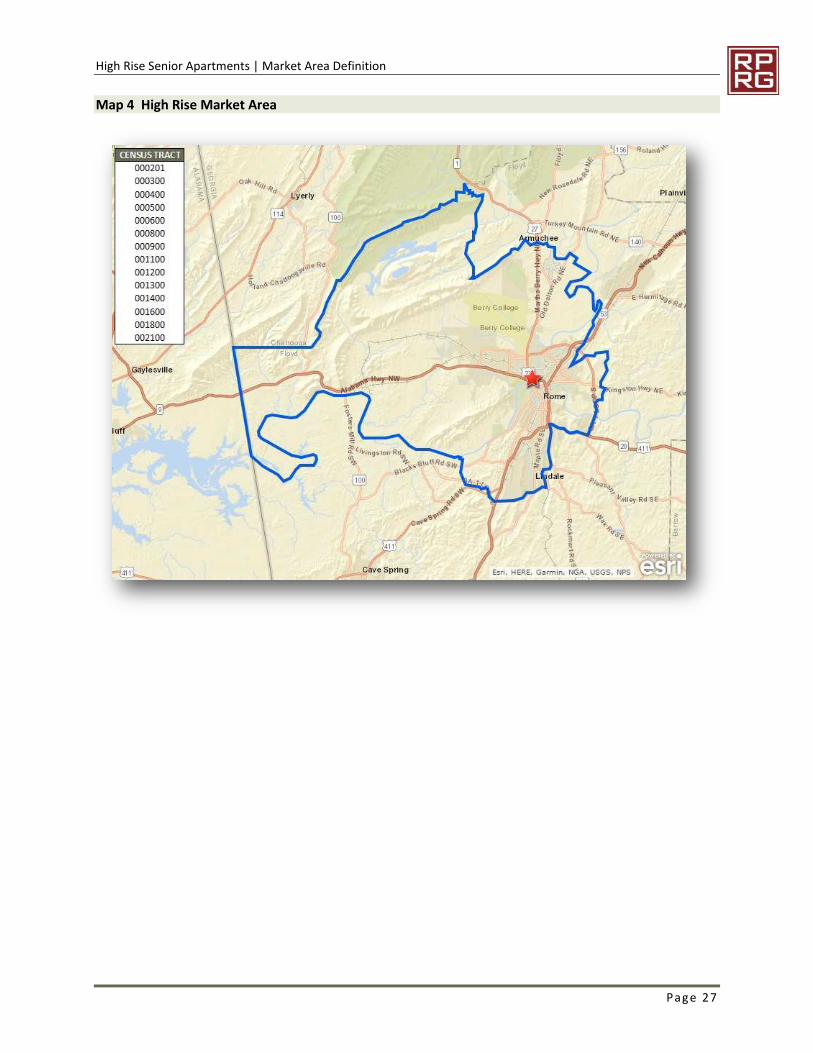
High Rise Senior Apartments | Market Area Definition
Page 27
Map 4 High Rise Market Area
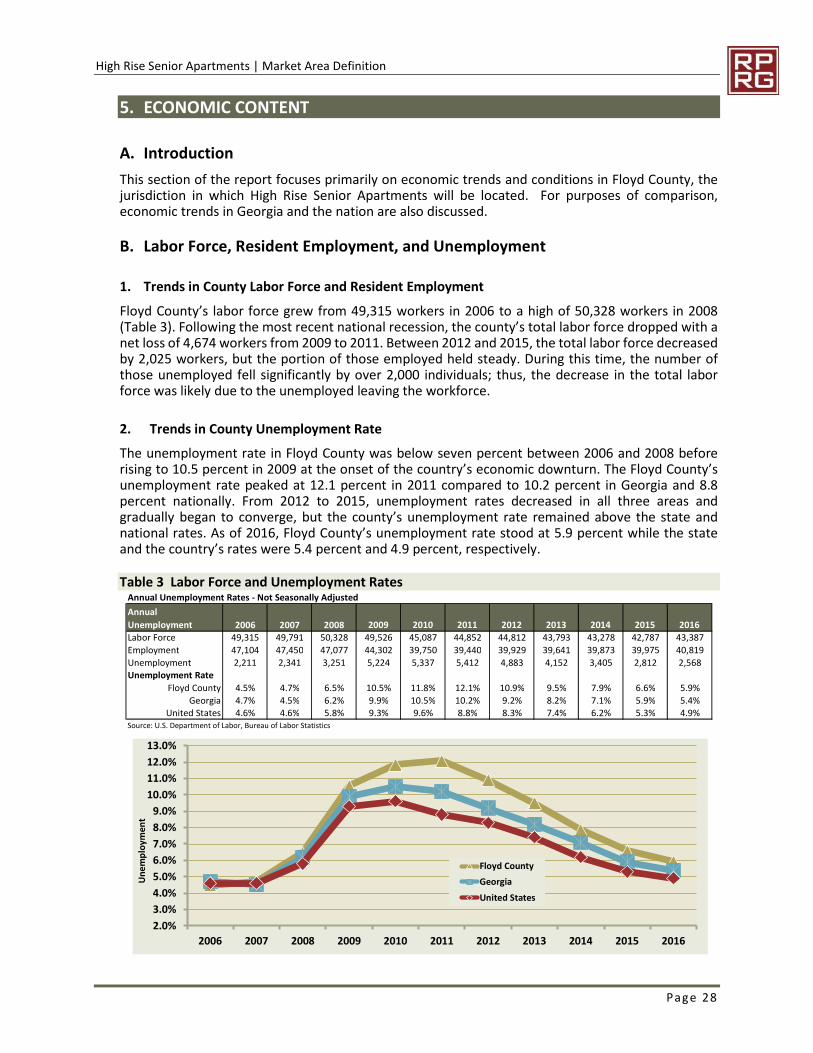
High Rise Senior Apartments | Market Area Definition
Page 28
5. ECONOMIC CONTENT
A. Introduction
This section of the report focuses primarily on economic trends and conditions in Floyd County, thejurisdiction in which High Rise Senior Apartments will be located. For purposes of comparison,economic trends in Georgia and the nation are also discussed.
B. Labor Force, Resident Employment, and Unemployment
1. Trends in County Labor Force and Resident Employment
Floyd County’s labor force grew from 49,315 workers in 2006 to a high of 50,328 workers in 2008(Table 3). Following the most recent national recession, the county’s total labor force dropped with anet loss of 4,674 workers from 2009 to 2011. Between 2012 and 2015, the total labor force decreasedby 2,025 workers, but the portion of those employed held steady. During this time, the number ofthose unemployed fell significantly by over 2,000 individuals; thus, the decrease in the total laborforce was likely due to the unemployed leaving the workforce.
2. Trends in County Unemployment Rate
The unemployment rate in Floyd County was below seven percent between 2006 and 2008 beforerising to 10.5 percent in 2009 at the onset of the country’s economic downturn. The Floyd County’sunemployment rate peaked at 12.1 percent in 2011 compared to 10.2 percent in Georgia and 8.8percent nationally. From 2012 to 2015, unemployment rates decreased in all three areas andgradually began to converge, but the county’s unemployment rate remained above the state andnational rates. As of 2016, Floyd County’s unemployment rate stood at 5.9 percent while the stateand the country’s rates were 5.4 percent and 4.9 percent, respectively.
Table 3 Labor Force and Unemployment RatesAnnual Unemployment Rates - Not Seasonally Adjusted
Annual
Unemployment 2006 2007 2008 2009 2010 2011 2012 2013 2014 2015 2016
Labor Force 49,315 49,791 50,328 49,526 45,087 44,852 44,812 43,793 43,278 42,787 43,387
Employment 47,104 47,450 47,077 44,302 39,750 39,440 39,929 39,641 39,873 39,975 40,819
Unemployment 2,211 2,341 3,251 5,224 5,337 5,412 4,883 4,152 3,405 2,812 2,568Unemployment Rate
Floyd County 4.5% 4.7% 6.5% 10.5% 11.8% 12.1% 10.9% 9.5% 7.9% 6.6% 5.9%
Georgia 4.7% 4.5% 6.2% 9.9% 10.5% 10.2% 9.2% 8.2% 7.1% 5.9% 5.4%United States 4.6% 4.6% 5.8% 9.3% 9.6% 8.8% 8.3% 7.4% 6.2% 5.3% 4.9%
Source: U.S. Department of Labor, Bureau of Labor Statistics
2.0%
3.0%
4.0%
5.0%
6.0%
7.0%
8.0%
9.0%
10.0%
11.0%
12.0%
13.0%
2006 2007 2008 2009 2010 2011 2012 2013 2014 2015 2016
Floyd County
Georgia
United States
Un
em
plo
ymen
t
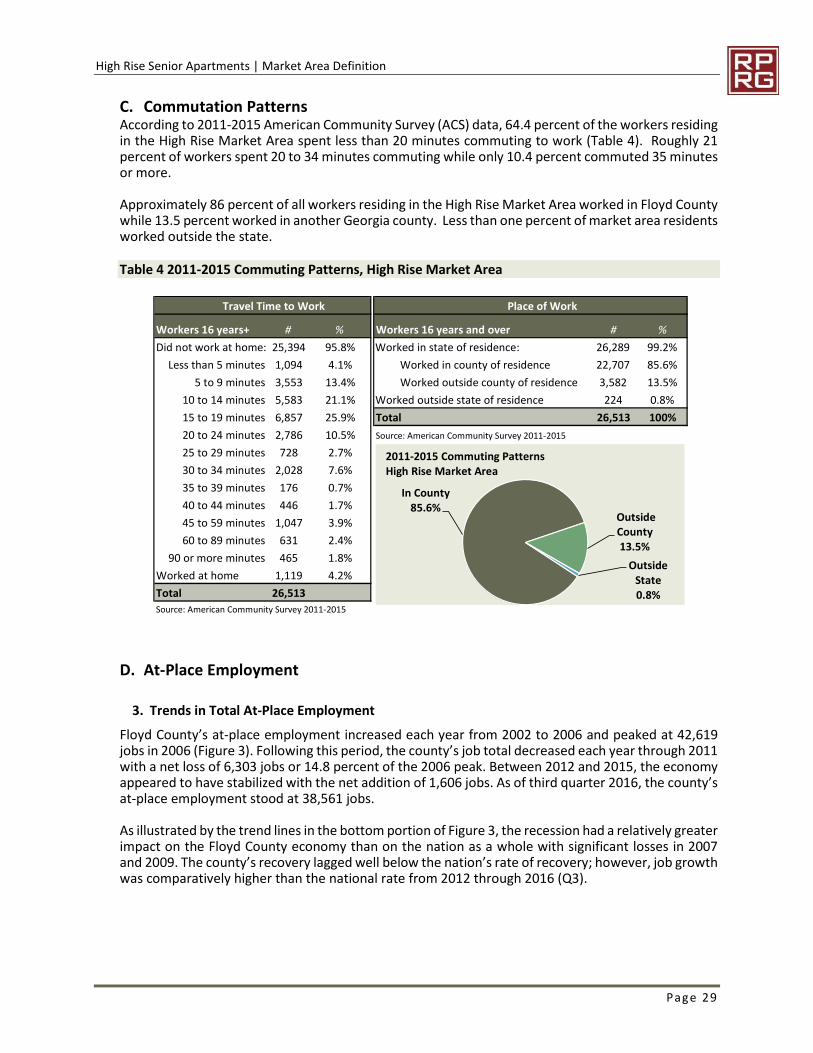
High Rise Senior Apartments | Market Area Definition
Page 29
C. Commutation PatternsAccording to 2011-2015 American Community Survey (ACS) data, 64.4 percent of the workers residingin the High Rise Market Area spent less than 20 minutes commuting to work (Table 4). Roughly 21percent of workers spent 20 to 34 minutes commuting while only 10.4 percent commuted 35 minutesor more.
Approximately 86 percent of all workers residing in the High Rise Market Area worked in Floyd Countywhile 13.5 percent worked in another Georgia county. Less than one percent of market area residentsworked outside the state.
Table 4 2011-2015 Commuting Patterns, High Rise Market Area
D. At-Place Employment
3. Trends in Total At-Place Employment
Floyd County’s at-place employment increased each year from 2002 to 2006 and peaked at 42,619jobs in 2006 (Figure 3). Following this period, the county’s job total decreased each year through 2011with a net loss of 6,303 jobs or 14.8 percent of the 2006 peak. Between 2012 and 2015, the economyappeared to have stabilized with the net addition of 1,606 jobs. As of third quarter 2016, the county’sat-place employment stood at 38,561 jobs.
As illustrated by the trend lines in the bottom portion of Figure 3, the recession had a relatively greaterimpact on the Floyd County economy than on the nation as a whole with significant losses in 2007and 2009. The county’s recovery lagged well below the nation’s rate of recovery; however, job growthwas comparatively higher than the national rate from 2012 through 2016 (Q3).
Travel Time to Work Place of Work
Workers 16 years+ # % Workers 16 years and over # %
Did not work at home: 25,394 95.8% Worked in state of residence: 26,289 99.2%
Less than 5 minutes 1,094 4.1% Worked in county of residence 22,707 85.6%
5 to 9 minutes 3,553 13.4% Worked outside county of residence 3,582 13.5%
10 to 14 minutes 5,583 21.1% Worked outside state of residence 224 0.8%
15 to 19 minutes 6,857 25.9% Total 26,513 100%
20 to 24 minutes 2,786 10.5% Source: American Community Survey 2011-2015
25 to 29 minutes 728 2.7%
30 to 34 minutes 2,028 7.6%
35 to 39 minutes 176 0.7%
40 to 44 minutes 446 1.7%
45 to 59 minutes 1,047 3.9%
60 to 89 minutes 631 2.4%
90 or more minutes 465 1.8%
Worked at home 1,119 4.2%
Total 26,513
Source: American Community Survey 2011-2015
In County85.6%
OutsideCounty13.5%
OutsideState0.8%
2011-2015 Commuting PatternsHigh Rise Market Area
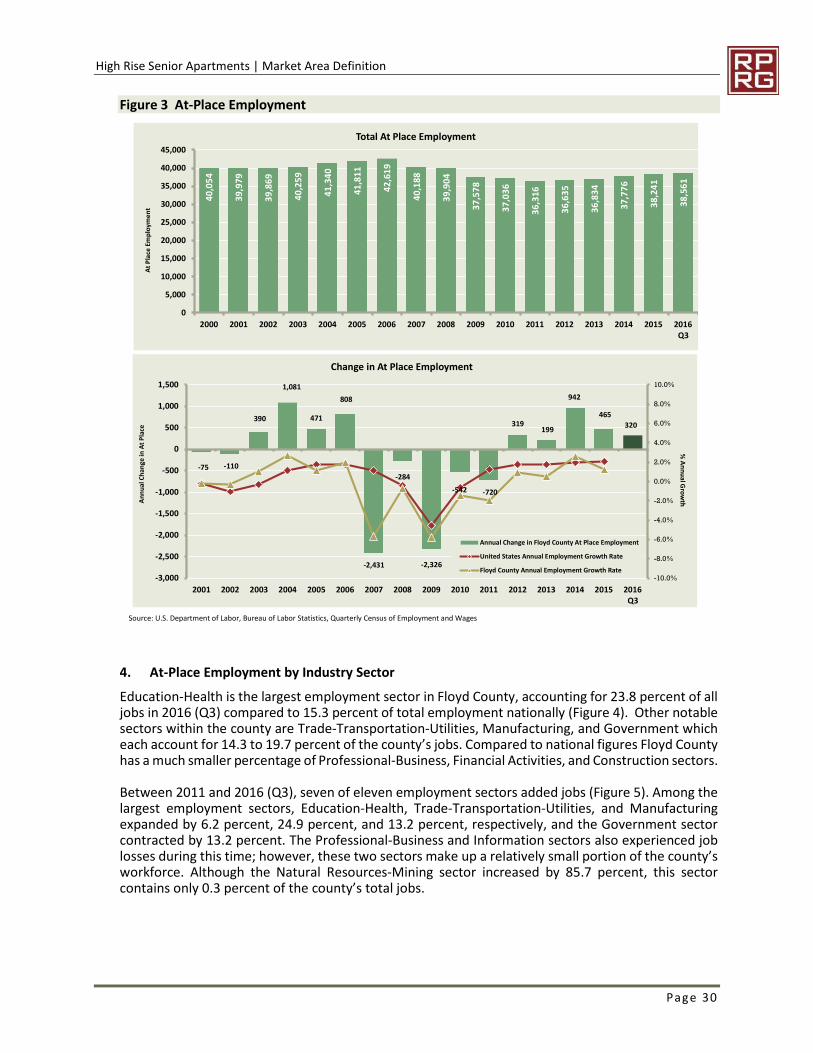
High Rise Senior Apartments | Market Area Definition
Page 30
Figure 3 At-Place Employment
4. At-Place Employment by Industry Sector
Education-Health is the largest employment sector in Floyd County, accounting for 23.8 percent of alljobs in 2016 (Q3) compared to 15.3 percent of total employment nationally (Figure 4). Other notablesectors within the county are Trade-Transportation-Utilities, Manufacturing, and Government whicheach account for 14.3 to 19.7 percent of the county’s jobs. Compared to national figures Floyd Countyhas a much smaller percentage of Professional-Business, Financial Activities, and Construction sectors.
Between 2011 and 2016 (Q3), seven of eleven employment sectors added jobs (Figure 5). Among thelargest employment sectors, Education-Health, Trade-Transportation-Utilities, and Manufacturingexpanded by 6.2 percent, 24.9 percent, and 13.2 percent, respectively, and the Government sectorcontracted by 13.2 percent. The Professional-Business and Information sectors also experienced joblosses during this time; however, these two sectors make up a relatively small portion of the county’sworkforce. Although the Natural Resources-Mining sector increased by 85.7 percent, this sectorcontains only 0.3 percent of the county’s total jobs.
Source: U.S. Department of Labor, Bureau of Labor Statistics, Quarterly Census of Employment and Wages
40
,05
4
39,9
79
39
,86
9
40
,25
9
41
,34
0
41
,81
1
42
,61
9
40
,18
8
39
,90
4
37
,57
8
37
,03
6
36
,316
36
,63
5
36
,83
4
37,
77
6
38
,24
1
38
,56
1
0
5,000
10,000
15,000
20,000
25,000
30,000
35,000
40,000
45,000
2000 2001 2002 2003 2004 2005 2006 2007 2008 2009 2010 2011 2012 2013 2014 2015 2016Q3
At
Pla
ceEm
plo
yme
nt
Total At Place Employment
-75 -110
390
1,081
471
808
-2,431
-284
-2,326
-542 -720
319199
942
465
320
-10.0%
-8.0%
-6.0%
-4.0%
-2.0%
0.0%
2.0%
4.0%
6.0%
8.0%
10.0%
-3,000
-2,500
-2,000
-1,500
-1,000
-500
0
500
1,000
1,500
2001 2002 2003 2004 2005 2006 2007 2008 2009 2010 2011 2012 2013 2014 2015 2016Q3
Change in At Place Employment
Annual Change in Floyd County At Place Employment
United States Annual Employment Growth Rate
Floyd County Annual Employment Growth Rate
An
nu
alC
han
gein
At
Pla
ce
%A
nn
ualG
row
th
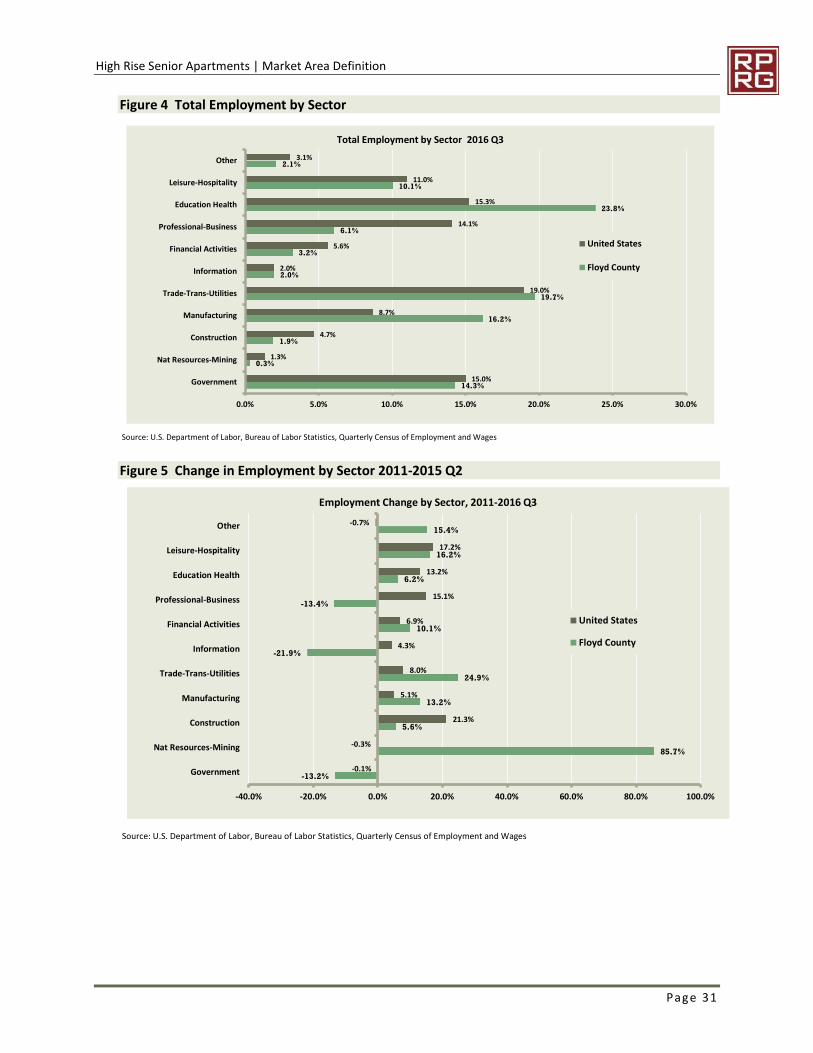
High Rise Senior Apartments | Market Area Definition
Page 31
Figure 4 Total Employment by Sector
Figure 5 Change in Employment by Sector 2011-2015 Q2
Source: U.S. Department of Labor, Bureau of Labor Statistics, Quarterly Census of Employment and Wages
14.3%
0.3%
1.9%
16.2%
19.7%
2.0%
3.2%
6.1%
23.8%
10.1%
2.1%
15.0%
1.3%
4.7%
8.7%
19.0%
2.0%
5.6%
14.1%
15.3%
11.0%
3.1%
0.0% 5.0% 10.0% 15.0% 20.0% 25.0% 30.0%
Government
Nat Resources-Mining
Construction
Manufacturing
Trade-Trans-Utilities
Information
Financial Activities
Professional-Business
Education Health
Leisure-Hospitality
Other
Total Employment by Sector 2016 Q3
United States
Floyd County
Source: U.S. Department of Labor, Bureau of Labor Statistics, Quarterly Census of Employment and Wages
-13.2%
85.7%
5.6%
13.2%
24.9%
-21.9%
10.1%
-13.4%
6.2%
16.2%
15.4%
-0.1%
-0.3%
21.3%
5.1%
8.0%
4.3%
6.9%
15.1%
13.2%
17.2%
-0.7%
-40.0% -20.0% 0.0% 20.0% 40.0% 60.0% 80.0% 100.0%
Government
Nat Resources-Mining
Construction
Manufacturing
Trade-Trans-Utilities
Information
Financial Activities
Professional-Business
Education Health
Leisure-Hospitality
Other
Employment Change by Sector, 2011-2016 Q3
United States
Floyd County
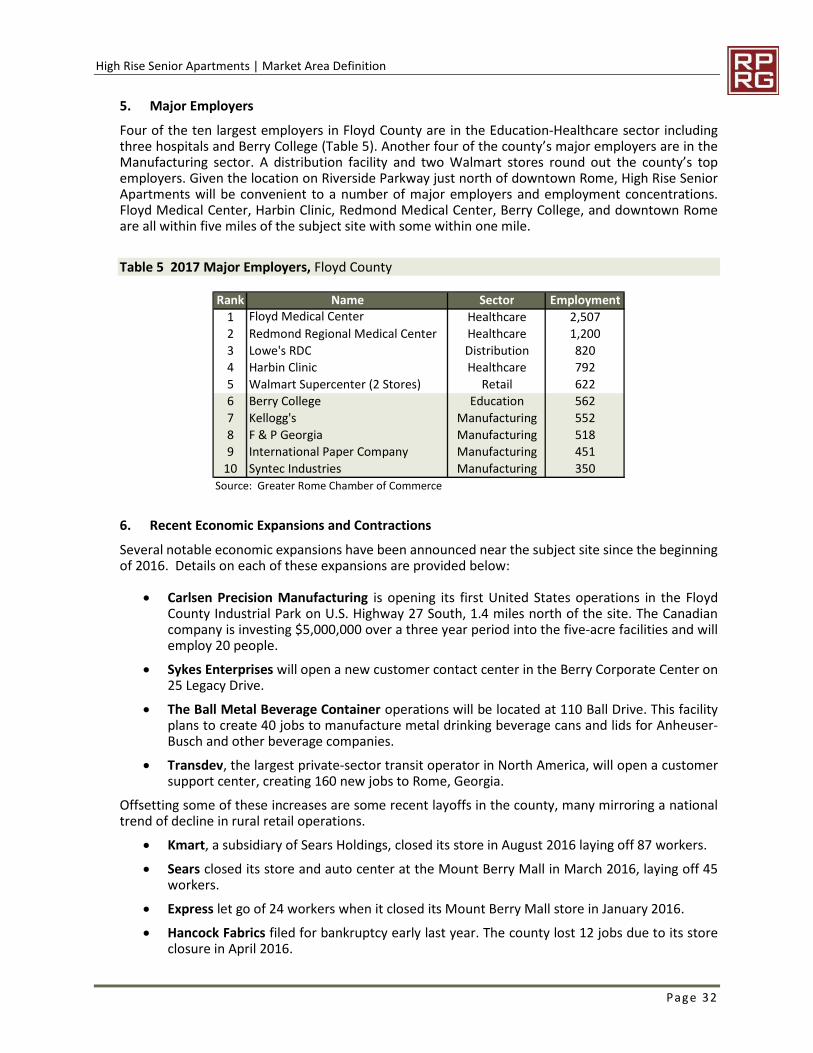
High Rise Senior Apartments | Market Area Definition
Page 32
5. Major Employers
Four of the ten largest employers in Floyd County are in the Education-Healthcare sector includingthree hospitals and Berry College (Table 5). Another four of the county’s major employers are in theManufacturing sector. A distribution facility and two Walmart stores round out the county’s topemployers. Given the location on Riverside Parkway just north of downtown Rome, High Rise SeniorApartments will be convenient to a number of major employers and employment concentrations.Floyd Medical Center, Harbin Clinic, Redmond Medical Center, Berry College, and downtown Romeare all within five miles of the subject site with some within one mile.
Table 5 2017 Major Employers, Floyd County
6. Recent Economic Expansions and Contractions
Several notable economic expansions have been announced near the subject site since the beginningof 2016. Details on each of these expansions are provided below:
Carlsen Precision Manufacturing is opening its first United States operations in the FloydCounty Industrial Park on U.S. Highway 27 South, 1.4 miles north of the site. The Canadiancompany is investing $5,000,000 over a three year period into the five-acre facilities and willemploy 20 people.
Sykes Enterprises will open a new customer contact center in the Berry Corporate Center on25 Legacy Drive.
The Ball Metal Beverage Container operations will be located at 110 Ball Drive. This facilityplans to create 40 jobs to manufacture metal drinking beverage cans and lids for Anheuser-Busch and other beverage companies.
Transdev, the largest private-sector transit operator in North America, will open a customersupport center, creating 160 new jobs to Rome, Georgia.
Offsetting some of these increases are some recent layoffs in the county, many mirroring a nationaltrend of decline in rural retail operations.
Kmart, a subsidiary of Sears Holdings, closed its store in August 2016 laying off 87 workers.
Sears closed its store and auto center at the Mount Berry Mall in March 2016, laying off 45workers.
Express let go of 24 workers when it closed its Mount Berry Mall store in January 2016.
Hancock Fabrics filed for bankruptcy early last year. The county lost 12 jobs due to its storeclosure in April 2016.
Rank Name Sector Employment
1 Floyd Medical Center Healthcare 2,507
2 Redmond Regional Medical Center Healthcare 1,200
3 Lowe's RDC Distribution 820
4 Harbin Clinic Healthcare 792
5 Walmart Supercenter (2 Stores) Retail 622
6 Berry College Education 562
7 Kellogg's Manufacturing 552
8 F & P Georgia Manufacturing 518
9 International Paper Company Manufacturing 451
10 Syntec Industries Manufacturing 350
Source: Greater Rome Chamber of Commerce

High Rise Senior Apartments | Market Area Definition
Page 33
7. Conclusions on Local Economics
Although Floyd County experienced relatively more job losses and higher unemployment rates thanthe nation as a result of the national recession, the county’s economy seems to be stabilizing. Newcompanies are investing in facilities proximate to the subject site, creating more jobs in the county.
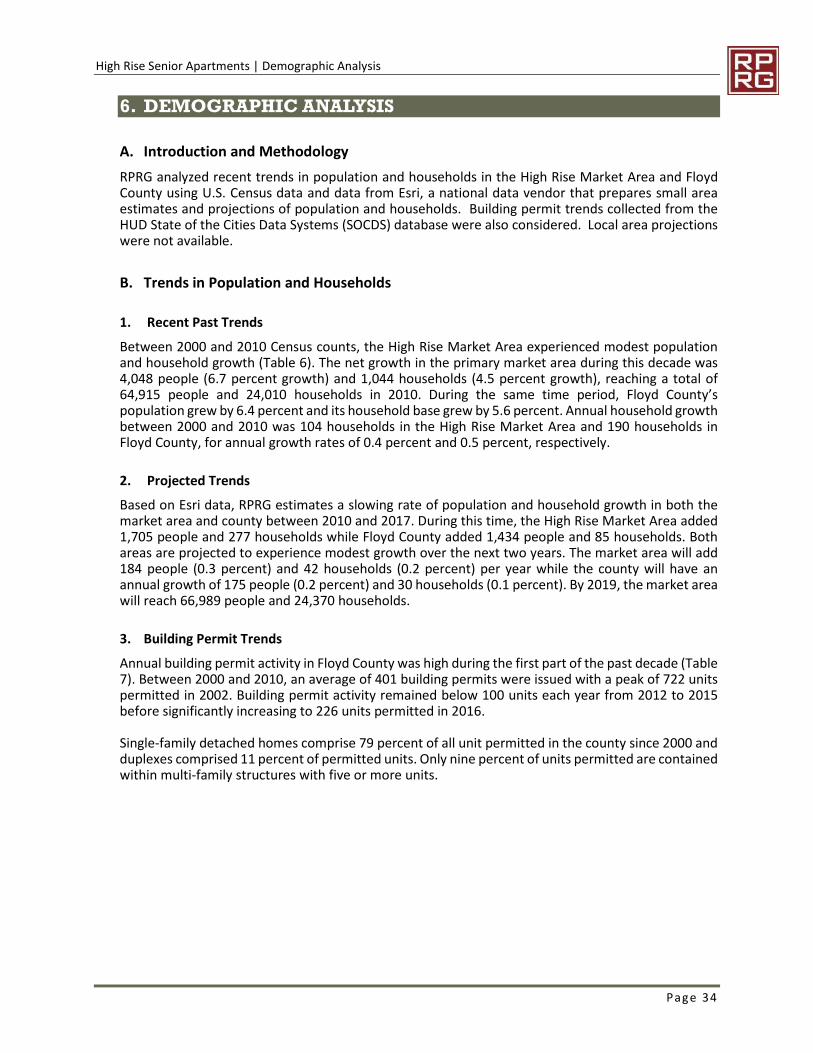
High Rise Senior Apartments | Demographic Analysis
Page 34
6. DEMOGRAPHIC ANALYSIS
A. Introduction and Methodology
RPRG analyzed recent trends in population and households in the High Rise Market Area and FloydCounty using U.S. Census data and data from Esri, a national data vendor that prepares small areaestimates and projections of population and households. Building permit trends collected from theHUD State of the Cities Data Systems (SOCDS) database were also considered. Local area projectionswere not available.
B. Trends in Population and Households
1. Recent Past Trends
Between 2000 and 2010 Census counts, the High Rise Market Area experienced modest populationand household growth (Table 6). The net growth in the primary market area during this decade was4,048 people (6.7 percent growth) and 1,044 households (4.5 percent growth), reaching a total of64,915 people and 24,010 households in 2010. During the same time period, Floyd County’spopulation grew by 6.4 percent and its household base grew by 5.6 percent. Annual household growthbetween 2000 and 2010 was 104 households in the High Rise Market Area and 190 households inFloyd County, for annual growth rates of 0.4 percent and 0.5 percent, respectively.
2. Projected Trends
Based on Esri data, RPRG estimates a slowing rate of population and household growth in both themarket area and county between 2010 and 2017. During this time, the High Rise Market Area added1,705 people and 277 households while Floyd County added 1,434 people and 85 households. Bothareas are projected to experience modest growth over the next two years. The market area will add184 people (0.3 percent) and 42 households (0.2 percent) per year while the county will have anannual growth of 175 people (0.2 percent) and 30 households (0.1 percent). By 2019, the market areawill reach 66,989 people and 24,370 households.
3. Building Permit Trends
Annual building permit activity in Floyd County was high during the first part of the past decade (Table7). Between 2000 and 2010, an average of 401 building permits were issued with a peak of 722 unitspermitted in 2002. Building permit activity remained below 100 units each year from 2012 to 2015before significantly increasing to 226 units permitted in 2016.
Single-family detached homes comprise 79 percent of all unit permitted in the county since 2000 andduplexes comprised 11 percent of permitted units. Only nine percent of units permitted are containedwithin multi-family structures with five or more units.
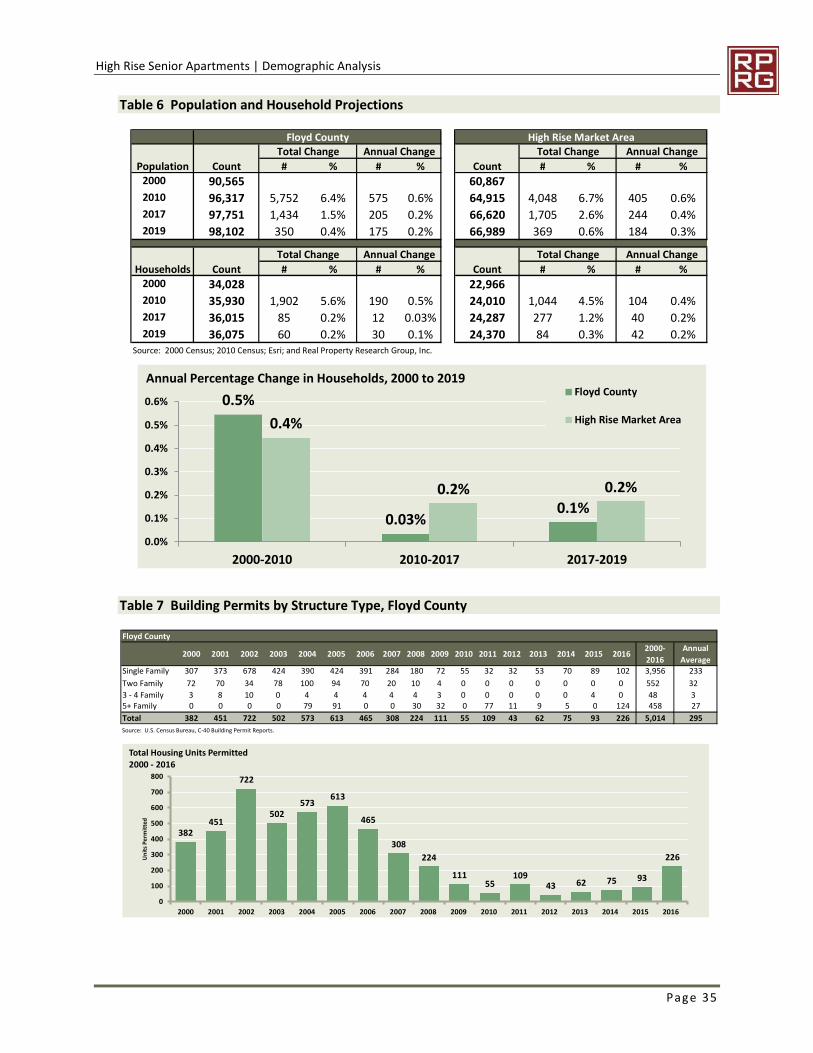
High Rise Senior Apartments | Demographic Analysis
Page 35
Table 6 Population and Household Projections
Table 7 Building Permits by Structure Type, Floyd County
Floyd County High Rise Market AreaTotal Change Annual Change Total Change Annual Change
Population Count # % # % Count # % # %2000 90,565 60,8672010 96,317 5,752 6.4% 575 0.6% 64,915 4,048 6.7% 405 0.6%2017 97,751 1,434 1.5% 205 0.2% 66,620 1,705 2.6% 244 0.4%2019 98,102 350 0.4% 175 0.2% 66,989 369 0.6% 184 0.3%
Total Change Annual Change Total Change Annual Change
Households Count # % # % Count # % # %2000 34,028 22,9662010 35,930 1,902 5.6% 190 0.5% 24,010 1,044 4.5% 104 0.4%2017 36,015 85 0.2% 12 0.03% 24,287 277 1.2% 40 0.2%2019 36,075 60 0.2% 30 0.1% 24,370 84 0.3% 42 0.2%
Source: 2000 Census; 2010 Census; Esri; and Real Property Research Group, Inc.
0.5%
0.03%0.1%
0.4%
0.2% 0.2%
0.0%
0.1%
0.2%
0.3%
0.4%
0.5%
0.6%
2000-2010 2010-2017 2017-2019
Floyd County
High Rise Market Area
Annual Percentage Change in Households, 2000 to 2019
Floyd County
2000 2001 2002 2003 2004 2005 2006 2007 2008 2009 2010 2011 2012 2013 2014 2015 20162000-
2016
Annual
AverageSingle Family 307 373 678 424 390 424 391 284 180 72 55 32 32 53 70 89 102 3,956 233
Two Family 72 70 34 78 100 94 70 20 10 4 0 0 0 0 0 0 0 552 32
3 - 4 Family 3 8 10 0 4 4 4 4 4 3 0 0 0 0 0 4 0 48 35+ Family 0 0 0 0 79 91 0 0 30 32 0 77 11 9 5 0 124 458 27
Total 382 451 722 502 573 613 465 308 224 111 55 109 43 62 75 93 226 5,014 295
Source: U.S. Census Bureau, C-40 Building Permit Reports.
382451
722
502573
613
465
308
224
11155
10943 62 75 93
226
0
100
200
300
400
500
600
700
800
2000 2001 2002 2003 2004 2005 2006 2007 2008 2009 2010 2011 2012 2013 2014 2015 2016
Un
its
Pe
rmit
ted
Total Housing Units Permitted2000 - 2016
High Rise Senior Apartments | Demographic Analysis
Page 36
4. Trends in Older Adult Households
Older adult and senior households are expected to remain stable in the High Rise Market Area; seniorhousehold growth includes both net migration and aging in place. The High Rise Market Area had10,338 households with householder age 55+ as of the 2010 Census (Table 8). Senior households withhouseholders age 55+ increased by 1.3 percent per year between 2010 and 2017.
Senior household growth is expected to continue in stability over the next two years. Householdswith householders age 55+ are projected to remain relatively steady at an annual rate of 1.1 percentor 122 households from 2017 to 2019 and households, reaching a total of 11,527 in 2019.
Table 8 Trends in Senior Householders, High Rise Market Area
C. Demographic Characteristics
1. Age Distribution and Household Type
The population of both the High Rise Market Area and Floyd County represent a range of residentswith median ages of 35 and 38, respectively (Table 9). Adults ages 35 to 61 comprise the largestcomponents of both areas at 32.4 percent in the market area and 33.9 percent in the county.Children/Youth ages 19 and under comprise 27.5 percent in the market area and 26.2 percent in thecounty. Seniors age 62 and older represent 19.4 percent of the market area and 20.5 percent of thecounty.
High Rise Market Area Total Annual Total AnnualAge of 2010 2017 2019 # % # % # % # %55 to 61 3,035 29.4% 3,168 28.1% 3,162 27.4% 133 4.4% 19 0.6% -6 -0.2% -3 -0.1%62-64 1,242 12.0% 1,358 12.0% 1,355 11.8% 116 9.3% 17 1.3% -2 -0.2% -1 -0.1%65 to 74 3,017 29.2% 3,525 31.2% 3,698 32.1% 508 16.8% 73 2.2% 173 4.9% 87 2.4%75 and older 3,044 29.4% 3,232 28.6% 3,312 28.7% 188 6.2% 27 0.9% 80 2.5% 40 1.2%Householders
55+10,338 100.0% 11,283 100.0% 11,527 100.0% 945 9.1% 135 1.3% 244 2.2% 122 1.1%
Source: 2010 Census; Esri; RPRG
Change 2010 to 2017 Change 2017 to 2019
3,035
1,242
3,017 3,0443,168
1,358
3,5253,2323,162
1,355
3,698
3,312
0
500
1,000
1,500
2,000
2,500
3,000
3,500
4,000
55 to 61 62-64 65 to 74 75 and older
#H
ou
seh
old
s
2017-2019 Older Adult Householders by Age - High Rise Market Area
2010
2017
2019
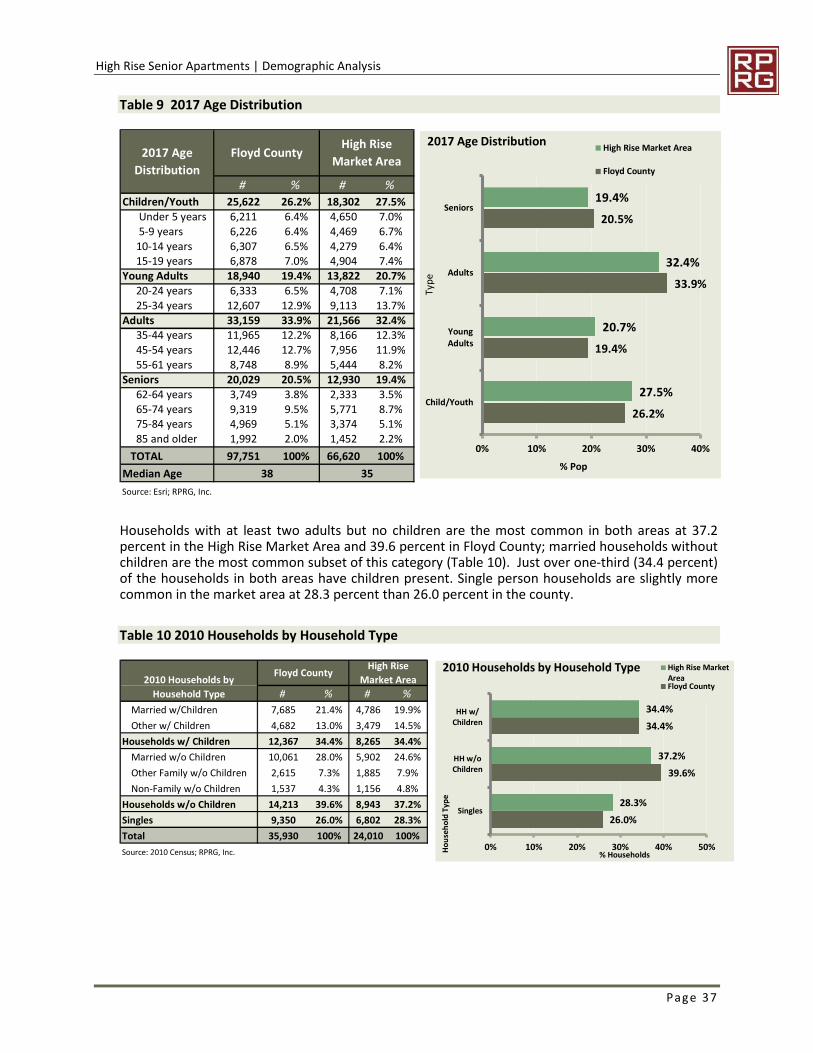
High Rise Senior Apartments | Demographic Analysis
Page 37
Table 9 2017 Age Distribution
Households with at least two adults but no children are the most common in both areas at 37.2percent in the High Rise Market Area and 39.6 percent in Floyd County; married households withoutchildren are the most common subset of this category (Table 10). Just over one-third (34.4 percent)of the households in both areas have children present. Single person households are slightly morecommon in the market area at 28.3 percent than 26.0 percent in the county.
Table 10 2010 Households by Household Type
# % # %Children/Youth 25,622 26.2% 18,302 27.5%
Under 5 years 6,211 6.4% 4,650 7.0%5-9 years 6,226 6.4% 4,469 6.7%
10-14 years 6,307 6.5% 4,279 6.4%15-19 years 6,878 7.0% 4,904 7.4%
Young Adults 18,940 19.4% 13,822 20.7%20-24 years 6,333 6.5% 4,708 7.1%25-34 years 12,607 12.9% 9,113 13.7%
Adults 33,159 33.9% 21,566 32.4%35-44 years 11,965 12.2% 8,166 12.3%45-54 years 12,446 12.7% 7,956 11.9%55-61 years 8,748 8.9% 5,444 8.2%
Seniors 20,029 20.5% 12,930 19.4%62-64 years 3,749 3.8% 2,333 3.5%65-74 years 9,319 9.5% 5,771 8.7%75-84 years 4,969 5.1% 3,374 5.1%85 and older 1,992 2.0% 1,452 2.2%
TOTAL 97,751 100% 66,620 100%
Median Age
Source: Esri; RPRG, Inc.
38 35
Floyd CountyHigh Rise
Market Area2017 Age
Distribution
26.2%
19.4%
33.9%
20.5%
27.5%
20.7%
32.4%
19.4%
0% 10% 20% 30% 40%
Child/Youth
YoungAdults
Adults
Seniors
% Pop
Typ
e
2017 Age DistributionHigh Rise Market Area
Floyd County
# % # %
Married w/Children 7,685 21.4% 4,786 19.9%
Other w/ Children 4,682 13.0% 3,479 14.5%
Households w/ Children 12,367 34.4% 8,265 34.4%
Married w/o Children 10,061 28.0% 5,902 24.6%
Other Family w/o Children 2,615 7.3% 1,885 7.9%
Non-Family w/o Children 1,537 4.3% 1,156 4.8%
Households w/o Children 14,213 39.6% 8,943 37.2%
Singles 9,350 26.0% 6,802 28.3%
Total 35,930 100% 24,010 100%
Source: 2010 Census; RPRG, Inc.
2010 Households by
Household Type
Floyd CountyHigh Rise
Market Area
26.0%
39.6%
34.4%
28.3%
37.2%
34.4%
0% 10% 20% 30% 40% 50%
Singles
HH w/oChildren
HH w/Children
% Households
Ho
use
ho
ldTy
pe
2010 Households by Household Type High Rise MarketAreaFloyd County
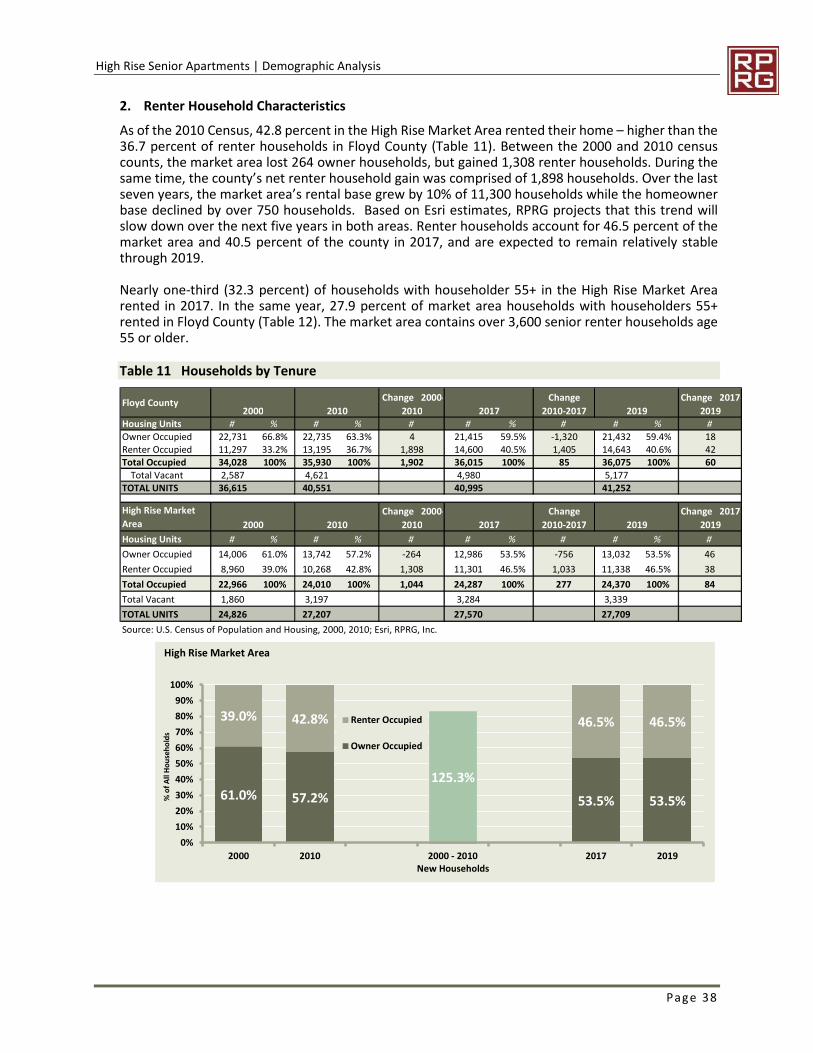
High Rise Senior Apartments | Demographic Analysis
Page 38
2. Renter Household Characteristics
As of the 2010 Census, 42.8 percent in the High Rise Market Area rented their home – higher than the36.7 percent of renter households in Floyd County (Table 11). Between the 2000 and 2010 censuscounts, the market area lost 264 owner households, but gained 1,308 renter households. During thesame time, the county’s net renter household gain was comprised of 1,898 households. Over the lastseven years, the market area’s rental base grew by 10% of 11,300 households while the homeownerbase declined by over 750 households. Based on Esri estimates, RPRG projects that this trend willslow down over the next five years in both areas. Renter households account for 46.5 percent of themarket area and 40.5 percent of the county in 2017, and are expected to remain relatively stablethrough 2019.
Nearly one-third (32.3 percent) of households with householder 55+ in the High Rise Market Arearented in 2017. In the same year, 27.9 percent of market area households with householders 55+rented in Floyd County (Table 12). The market area contains over 3,600 senior renter households age55 or older.
Table 11 Households by Tenure
Floyd County2000 2010
Change 2000-
2010 2017
Change
2010-2017 2019
Change 2017-
2019Housing Units # % # % # # % # # % #
Owner Occupied 22,731 66.8% 22,735 63.3% 4 21,415 59.5% -1,320 21,432 59.4% 18Renter Occupied 11,297 33.2% 13,195 36.7% 1,898 14,600 40.5% 1,405 14,643 40.6% 42Total Occupied 34,028 100% 35,930 100% 1,902 36,015 100% 85 36,075 100% 60
Total Vacant 2,587 4,621 4,980 5,177TOTAL UNITS 36,615 40,551 40,995 41,252
High Rise Market
Area 2000 2010
Change 2000-
2010 2017
Change
2010-2017 2019
Change 2017-
2019
Housing Units # % # % # # % # # % #
Owner Occupied 14,006 61.0% 13,742 57.2% -264 12,986 53.5% -756 13,032 53.5% 46
Renter Occupied 8,960 39.0% 10,268 42.8% 1,308 11,301 46.5% 1,033 11,338 46.5% 38
Total Occupied 22,966 100% 24,010 100% 1,044 24,287 100% 277 24,370 100% 84
Total Vacant 1,860 3,197 3,284 3,339
TOTAL UNITS 24,826 27,207 27,570 27,709
Source: U.S. Census of Population and Housing, 2000, 2010; Esri, RPRG, Inc.
61.0% 57.2% 53.5% 53.5%
39.0% 42.8%
125.3%
46.5% 46.5%
0%
10%
20%
30%
40%
50%
60%
70%
80%
90%
100%
2000 2010 2000 - 2010New Households
2017 2019
%o
fA
llH
ou
seh
old
s
Renter Occupied
Owner Occupied
High Rise Market Area
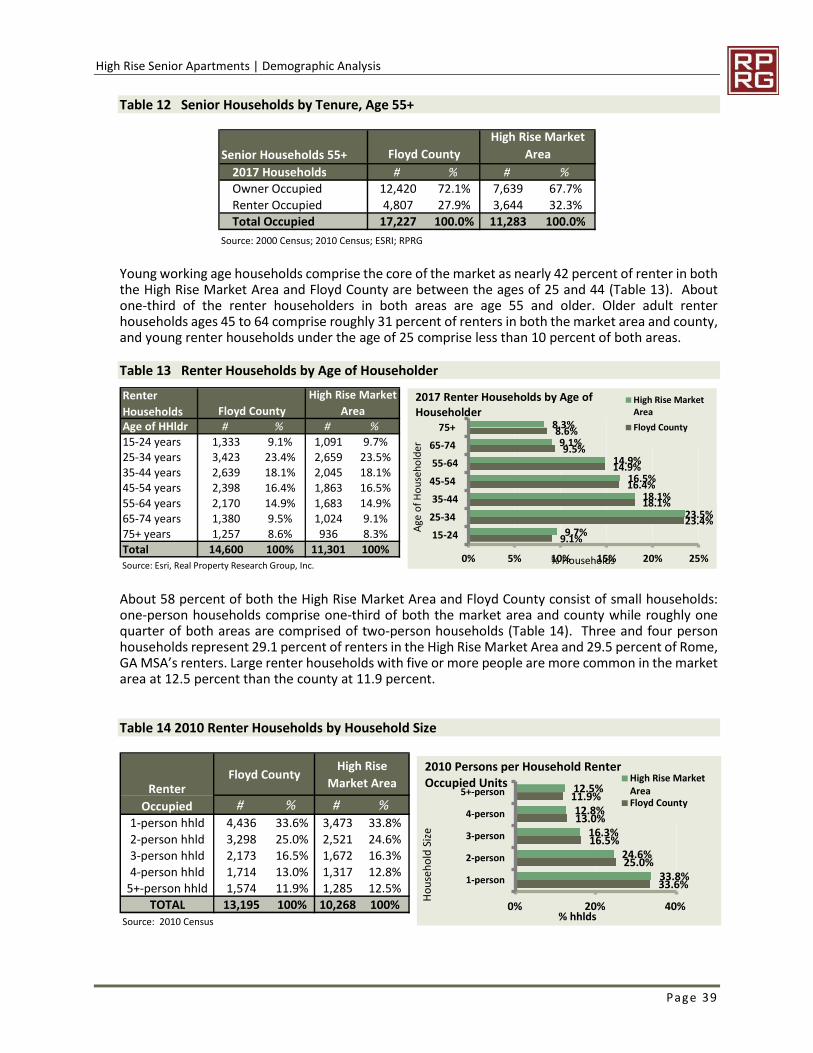
High Rise Senior Apartments | Demographic Analysis
Page 39
Table 12 Senior Households by Tenure, Age 55+
Young working age households comprise the core of the market as nearly 42 percent of renter in boththe High Rise Market Area and Floyd County are between the ages of 25 and 44 (Table 13). Aboutone-third of the renter householders in both areas are age 55 and older. Older adult renterhouseholds ages 45 to 64 comprise roughly 31 percent of renters in both the market area and county,and young renter households under the age of 25 comprise less than 10 percent of both areas.
Table 13 Renter Households by Age of Householder
About 58 percent of both the High Rise Market Area and Floyd County consist of small households:one-person households comprise one-third of both the market area and county while roughly onequarter of both areas are comprised of two-person households (Table 14). Three and four personhouseholds represent 29.1 percent of renters in the High Rise Market Area and 29.5 percent of Rome,GA MSA’s renters. Large renter households with five or more people are more common in the marketarea at 12.5 percent than the county at 11.9 percent.
Table 14 2010 Renter Households by Household Size
Senior Households 55+ Floyd County
High Rise Market
Area
2017 Households # % # %Owner Occupied 12,420 72.1% 7,639 67.7%Renter Occupied 4,807 27.9% 3,644 32.3%Total Occupied 17,227 100.0% 11,283 100.0%
Source: 2000 Census; 2010 Census; ESRI; RPRG
Renter
Households Floyd County
High Rise Market
AreaAge of HHldr # % # %
15-24 years 1,333 9.1% 1,091 9.7% 125-34 years 3,423 23.4% 2,659 23.5% 135-44 years 2,639 18.1% 2,045 18.1% 145-54 years 2,398 16.4% 1,863 16.5% 1
55-64 years 2,170 14.9% 1,683 14.9%65-74 years 1,380 9.5% 1,024 9.1% 275+ years 1,257 8.6% 936 8.3% 2
Total 14,600 100% 11,301 100%Source: Esri, Real Property Research Group, Inc.
9.1%
23.4%
18.1%
16.4%
14.9%
9.5%
8.6%
9.7%
23.5%
18.1%
16.5%
14.9%
9.1%
8.3%
0% 5% 10% 15% 20% 25%
15-24
25-34
35-44
45-54
55-64
65-74
75+
% Households
Age
of
Ho
use
ho
lder
2017 Renter Households by Age ofHouseholder
High Rise MarketArea
Floyd County
Floyd CountyHigh Rise
Market Area
# % # %1-person hhld 4,436 33.6% 3,473 33.8%2-person hhld 3,298 25.0% 2,521 24.6%3-person hhld 2,173 16.5% 1,672 16.3%4-person hhld 1,714 13.0% 1,317 12.8%
5+-person hhld 1,574 11.9% 1,285 12.5%TOTAL 13,195 100% 10,268 100%
Source: 2010 Census
Renter
Occupied
33.6%
25.0%
16.5%
13.0%
11.9%
33.8%
24.6%
16.3%
12.8%
12.5%
0% 20% 40%
1-person
2-person
3-person
4-person
5+-person
% hhlds
Ho
use
ho
ldSi
ze
2010 Persons per Household RenterOccupied Units High Rise Market
AreaFloyd County
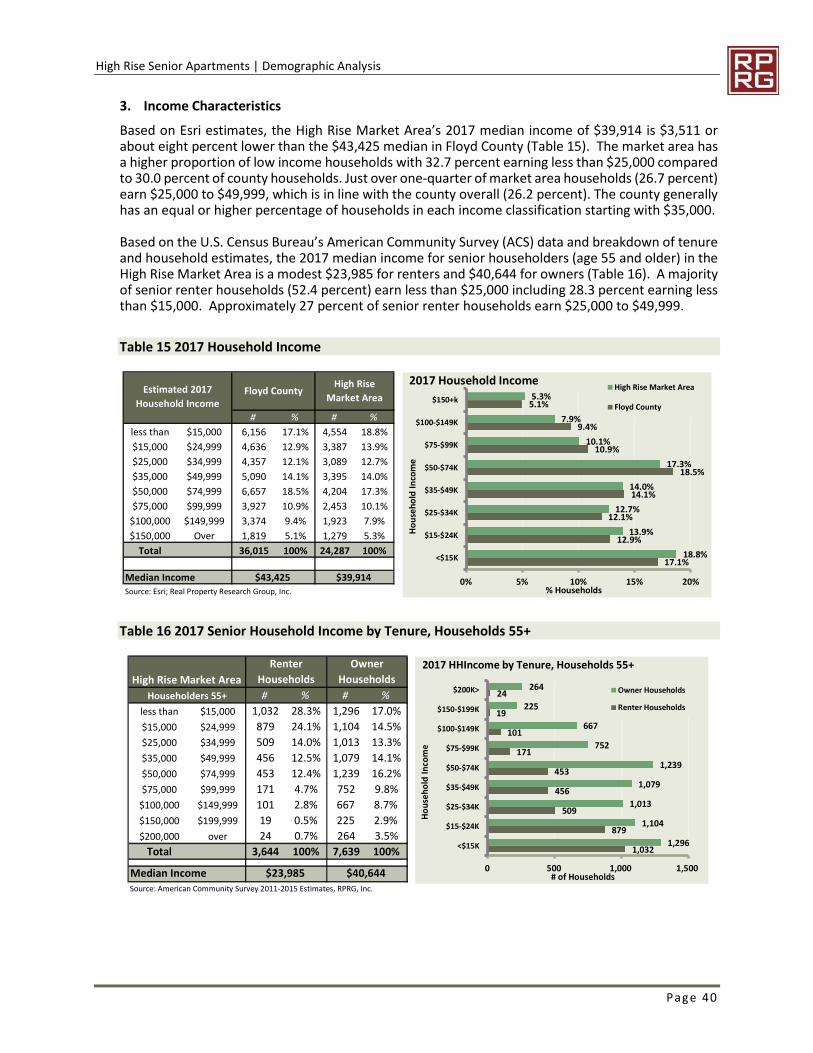
High Rise Senior Apartments | Demographic Analysis
Page 40
3. Income Characteristics
Based on Esri estimates, the High Rise Market Area’s 2017 median income of $39,914 is $3,511 orabout eight percent lower than the $43,425 median in Floyd County (Table 15). The market area hasa higher proportion of low income households with 32.7 percent earning less than $25,000 comparedto 30.0 percent of county households. Just over one-quarter of market area households (26.7 percent)earn $25,000 to $49,999, which is in line with the county overall (26.2 percent). The county generallyhas an equal or higher percentage of households in each income classification starting with $35,000.
Based on the U.S. Census Bureau’s American Community Survey (ACS) data and breakdown of tenureand household estimates, the 2017 median income for senior householders (age 55 and older) in theHigh Rise Market Area is a modest $23,985 for renters and $40,644 for owners (Table 16). A majorityof senior renter households (52.4 percent) earn less than $25,000 including 28.3 percent earning lessthan $15,000. Approximately 27 percent of senior renter households earn $25,000 to $49,999.
Table 15 2017 Household Income
Table 16 2017 Senior Household Income by Tenure, Households 55+
# % # %
less than $15,000 6,156 17.1% 4,554 18.8% 2
$15,000 $24,999 4,636 12.9% 3,387 13.9% 3
$25,000 $34,999 4,357 12.1% 3,089 12.7% 4
$35,000 $49,999 5,090 14.1% 3,395 14.0% 5
$50,000 $74,999 6,657 18.5% 4,204 17.3% 6
$75,000 $99,999 3,927 10.9% 2,453 10.1% 7
$100,000 $149,999 3,374 9.4% 1,923 7.9% 8
$150,000 Over 1,819 5.1% 1,279 5.3% 9
Total 36,015 100% 24,287 100% 10
Median Income $43,425 $39,914
Source: Esri; Real Property Research Group, Inc.
High Rise
Market AreaFloyd CountyEstimated 2017
Household Income
17.1%
12.9%
12.1%
14.1%
18.5%
10.9%
9.4%
5.1%
18.8%
13.9%
12.7%
14.0%
17.3%
10.1%
7.9%
5.3%
0% 5% 10% 15% 20%
<$15K
$15-$24K
$25-$34K
$35-$49K
$50-$74K
$75-$99K
$100-$149K
$150+k
% Households
Ho
use
ho
ldIn
com
e
2017 Household IncomeHigh Rise Market Area
Floyd County
# % # %
less than $15,000 1,032 28.3% 1,296 17.0% 2
$15,000 $24,999 879 24.1% 1,104 14.5% 3
$25,000 $34,999 509 14.0% 1,013 13.3% 4
$35,000 $49,999 456 12.5% 1,079 14.1% 5
$50,000 $74,999 453 12.4% 1,239 16.2% 6
$75,000 $99,999 171 4.7% 752 9.8% 7
$100,000 $149,999 101 2.8% 667 8.7% 8
$150,000 $199,999 19 0.5% 225 2.9% 9
$200,000 over 24 0.7% 264 3.5% 10
Total 3,644 100% 7,639 100%
Median Income 23
Source: American Community Survey 2011-2015 Estimates, RPRG, Inc.
Renter
Households
Owner
Households
$23,985 $40,644
High Rise Market Area
Householders 55+
1,032
879
509
456
453
171
101
19
24
1,296
1,104
1,013
1,079
1,239
752
667
225
264
0 500 1,000 1,500
<$15K
$15-$24K
$25-$34K
$35-$49K
$50-$74K
$75-$99K
$100-$149K
$150-$199K
$200K>
# of Households
Ho
use
ho
ldIn
com
e
2017 HHIncome by Tenure, Households 55+
Owner Households
Renter Households
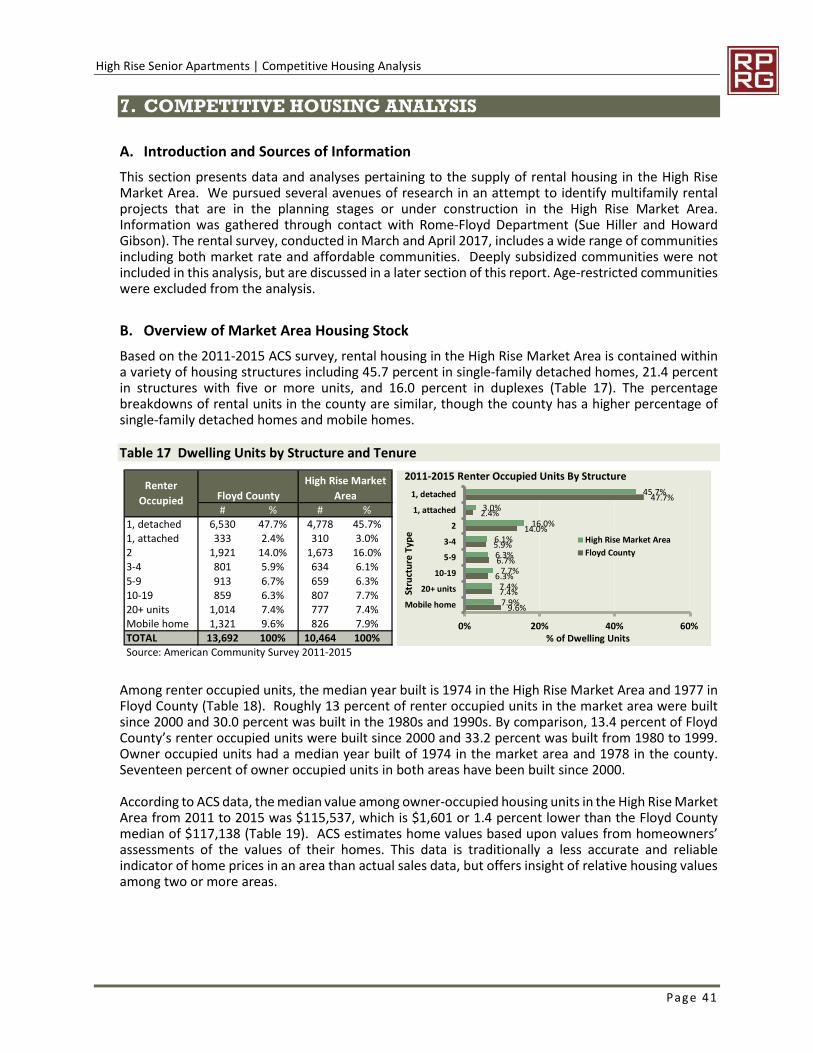
High Rise Senior Apartments | Competitive Housing Analysis
Page 41
7. COMPETITIVE HOUSING ANALYSIS
A. Introduction and Sources of Information
This section presents data and analyses pertaining to the supply of rental housing in the High RiseMarket Area. We pursued several avenues of research in an attempt to identify multifamily rentalprojects that are in the planning stages or under construction in the High Rise Market Area.Information was gathered through contact with Rome-Floyd Department (Sue Hiller and HowardGibson). The rental survey, conducted in March and April 2017, includes a wide range of communitiesincluding both market rate and affordable communities. Deeply subsidized communities were notincluded in this analysis, but are discussed in a later section of this report. Age-restricted communitieswere excluded from the analysis.
B. Overview of Market Area Housing Stock
Based on the 2011-2015 ACS survey, rental housing in the High Rise Market Area is contained withina variety of housing structures including 45.7 percent in single-family detached homes, 21.4 percentin structures with five or more units, and 16.0 percent in duplexes (Table 17). The percentagebreakdowns of rental units in the county are similar, though the county has a higher percentage ofsingle-family detached homes and mobile homes.
Table 17 Dwelling Units by Structure and Tenure
Among renter occupied units, the median year built is 1974 in the High Rise Market Area and 1977 inFloyd County (Table 18). Roughly 13 percent of renter occupied units in the market area were builtsince 2000 and 30.0 percent was built in the 1980s and 1990s. By comparison, 13.4 percent of FloydCounty’s renter occupied units were built since 2000 and 33.2 percent was built from 1980 to 1999.Owner occupied units had a median year built of 1974 in the market area and 1978 in the county.Seventeen percent of owner occupied units in both areas have been built since 2000.
According to ACS data, the median value among owner-occupied housing units in the High Rise MarketArea from 2011 to 2015 was $115,537, which is $1,601 or 1.4 percent lower than the Floyd Countymedian of $117,138 (Table 19). ACS estimates home values based upon values from homeowners’assessments of the values of their homes. This data is traditionally a less accurate and reliableindicator of home prices in an area than actual sales data, but offers insight of relative housing valuesamong two or more areas.
Floyd County
High Rise Market
Area# % # %
1, detached 6,530 47.7% 4,778 45.7%1, attached 333 2.4% 310 3.0%2 1,921 14.0% 1,673 16.0%3-4 801 5.9% 634 6.1%
5-9 913 6.7% 659 6.3%10-19 859 6.3% 807 7.7%20+ units 1,014 7.4% 777 7.4%Mobile home 1,321 9.6% 826 7.9%TOTAL 13,692 100% 10,464 100%Source: American Community Survey 2011-2015
Renter
Occupied45.7%
3.0%
16.0%
6.1%
6.3%
7.7%
7.4%
7.9%
47.7%
2.4%
14.0%
5.9%
6.7%
6.3%
7.4%
9.6%
0% 20% 40% 60%
1, detached
1, attached
2
3-4
5-9
10-19
20+ units
Mobile home
% of Dwelling Units
Stru
ctu
reTy
pe
2011-2015 Renter Occupied Units By Structure
High Rise Market Area
Floyd County
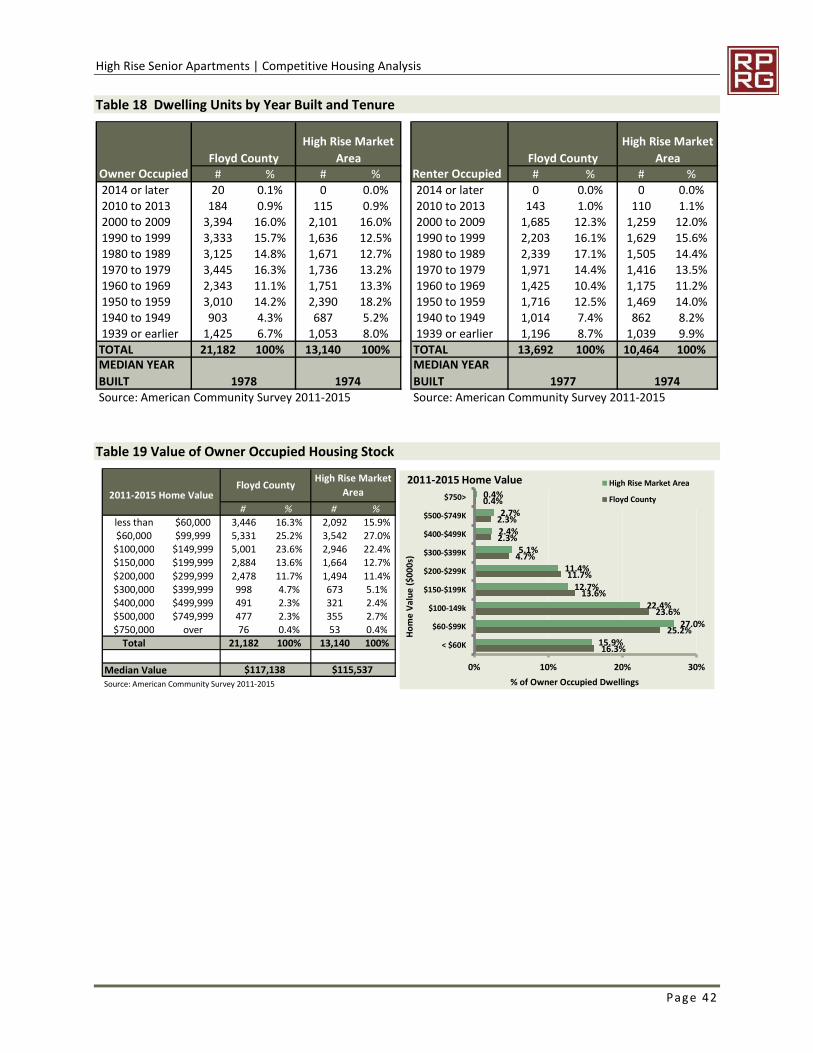
High Rise Senior Apartments | Competitive Housing Analysis
Page 42
Table 18 Dwelling Units by Year Built and Tenure
Table 19 Value of Owner Occupied Housing Stock
Floyd County
High Rise Market
Area Floyd County
High Rise Market
Area# % # % # % # %
2014 or later 20 0.1% 0 0.0% 2014 or later 0 0.0% 0 0.0%2010 to 2013 184 0.9% 115 0.9% 2010 to 2013 143 1.0% 110 1.1%2000 to 2009 3,394 16.0% 2,101 16.0% 2000 to 2009 1,685 12.3% 1,259 12.0%1990 to 1999 3,333 15.7% 1,636 12.5% 1990 to 1999 2,203 16.1% 1,629 15.6%1980 to 1989 3,125 14.8% 1,671 12.7% 1980 to 1989 2,339 17.1% 1,505 14.4%1970 to 1979 3,445 16.3% 1,736 13.2% 1970 to 1979 1,971 14.4% 1,416 13.5%1960 to 1969 2,343 11.1% 1,751 13.3% 1960 to 1969 1,425 10.4% 1,175 11.2%1950 to 1959 3,010 14.2% 2,390 18.2% 1950 to 1959 1,716 12.5% 1,469 14.0%1940 to 1949 903 4.3% 687 5.2% 1940 to 1949 1,014 7.4% 862 8.2%1939 or earlier 1,425 6.7% 1,053 8.0% 1939 or earlier 1,196 8.7% 1,039 9.9%TOTAL 21,182 100% 13,140 100% TOTAL 13,692 100% 10,464 100%MEDIAN YEAR
BUILT 1978 1974
MEDIAN YEAR
BUILT 1977 1974Source: American Community Survey 2011-2015 Source: American Community Survey 2011-2015
Owner Occupied Renter Occupied
# % # %less than $60,000 3,446 16.3% 2,092 15.9%$60,000 $99,999 5,331 25.2% 3,542 27.0%
$100,000 $149,999 5,001 23.6% 2,946 22.4%$150,000 $199,999 2,884 13.6% 1,664 12.7%
$200,000 $299,999 2,478 11.7% 1,494 11.4%$300,000 $399,999 998 4.7% 673 5.1%$400,000 $499,999 491 2.3% 321 2.4%$500,000 $749,999 477 2.3% 355 2.7%$750,000 over 76 0.4% 53 0.4%
Total 21,182 100% 13,140 100%
Median ValueSource: American Community Survey 2011-2015
2011-2015 Home ValueFloyd County
High Rise Market
Area
$117,138 $115,537
16.3%
25.2%
23.6%
13.6%
11.7%
4.7%
2.3%
2.3%
0.4%
15.9%
27.0%
22.4%
12.7%
11.4%
5.1%
2.4%
2.7%
0.4%
0% 10% 20% 30%
< $60K
$60-$99K
$100-149k
$150-$199K
$200-$299K
$300-$399K
$400-$499K
$500-$749K
$750>
% of Owner Occupied Dwellings
Ho
me
Val
ue
($0
00
s)
2011-2015 Home Value High Rise Market Area
Floyd County
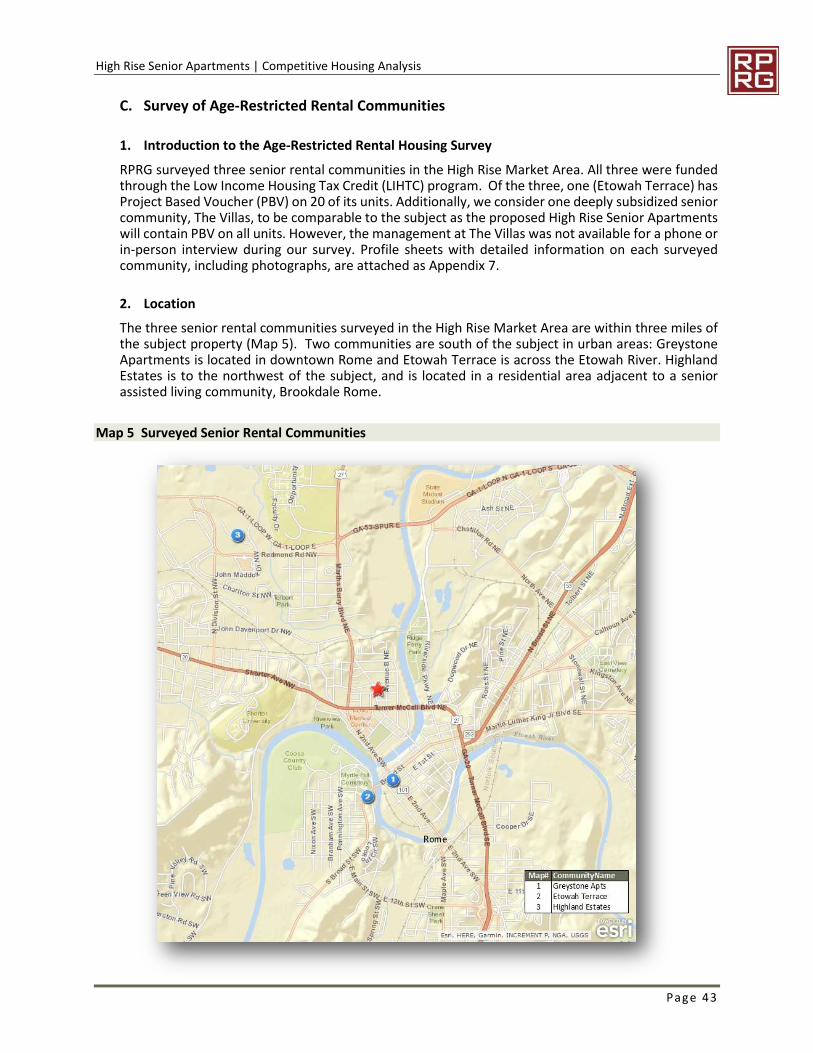
High Rise Senior Apartments | Competitive Housing Analysis
Page 43
C. Survey of Age-Restricted Rental Communities
1. Introduction to the Age-Restricted Rental Housing Survey
RPRG surveyed three senior rental communities in the High Rise Market Area. All three were fundedthrough the Low Income Housing Tax Credit (LIHTC) program. Of the three, one (Etowah Terrace) hasProject Based Voucher (PBV) on 20 of its units. Additionally, we consider one deeply subsidized seniorcommunity, The Villas, to be comparable to the subject as the proposed High Rise Senior Apartmentswill contain PBV on all units. However, the management at The Villas was not available for a phone orin-person interview during our survey. Profile sheets with detailed information on each surveyedcommunity, including photographs, are attached as Appendix 7.
2. Location
The three senior rental communities surveyed in the High Rise Market Area are within three miles ofthe subject property (Map 5). Two communities are south of the subject in urban areas: GreystoneApartments is located in downtown Rome and Etowah Terrace is across the Etowah River. HighlandEstates is to the northwest of the subject, and is located in a residential area adjacent to a seniorassisted living community, Brookdale Rome.
Map 5 Surveyed Senior Rental Communities
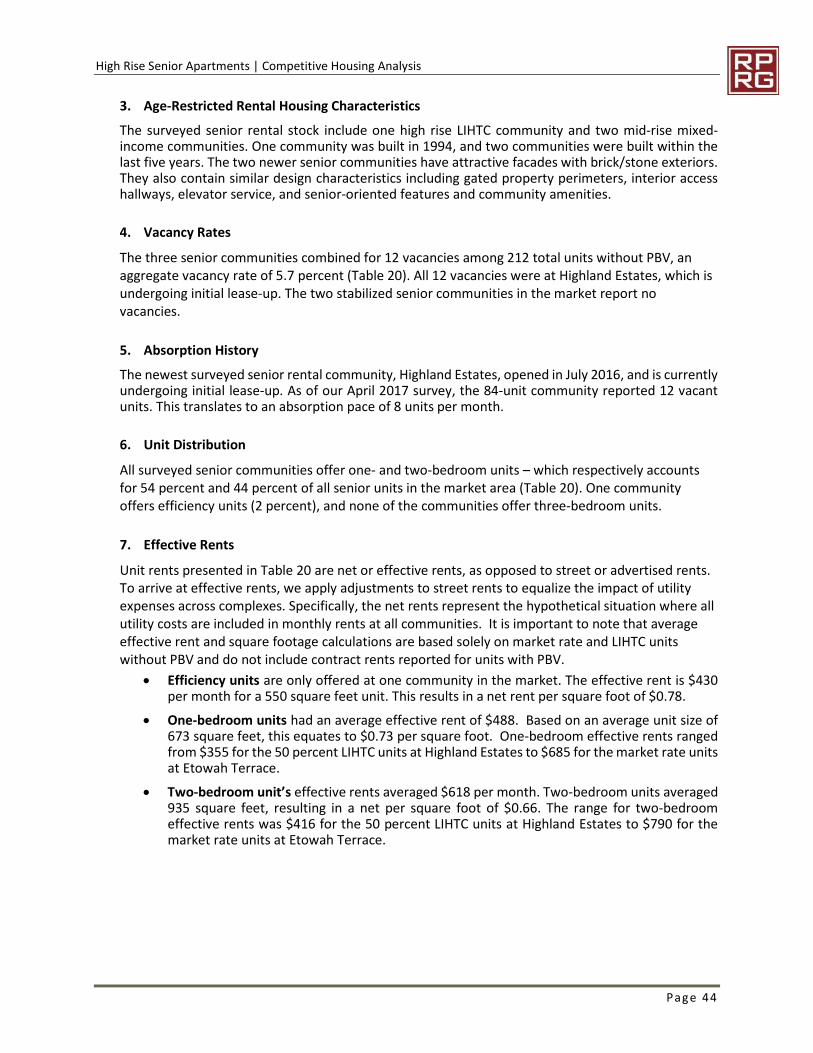
High Rise Senior Apartments | Competitive Housing Analysis
Page 44
3. Age-Restricted Rental Housing Characteristics
The surveyed senior rental stock include one high rise LIHTC community and two mid-rise mixed-income communities. One community was built in 1994, and two communities were built within thelast five years. The two newer senior communities have attractive facades with brick/stone exteriors.They also contain similar design characteristics including gated property perimeters, interior accesshallways, elevator service, and senior-oriented features and community amenities.
4. Vacancy Rates
The three senior communities combined for 12 vacancies among 212 total units without PBV, anaggregate vacancy rate of 5.7 percent (Table 20). All 12 vacancies were at Highland Estates, which isundergoing initial lease-up. The two stabilized senior communities in the market report novacancies.
5. Absorption History
The newest surveyed senior rental community, Highland Estates, opened in July 2016, and is currentlyundergoing initial lease-up. As of our April 2017 survey, the 84-unit community reported 12 vacantunits. This translates to an absorption pace of 8 units per month.
6. Unit Distribution
All surveyed senior communities offer one- and two-bedroom units – which respectively accountsfor 54 percent and 44 percent of all senior units in the market area (Table 20). One communityoffers efficiency units (2 percent), and none of the communities offer three-bedroom units.
7. Effective Rents
Unit rents presented in Table 20 are net or effective rents, as opposed to street or advertised rents.To arrive at effective rents, we apply adjustments to street rents to equalize the impact of utilityexpenses across complexes. Specifically, the net rents represent the hypothetical situation where allutility costs are included in monthly rents at all communities. It is important to note that averageeffective rent and square footage calculations are based solely on market rate and LIHTC unitswithout PBV and do not include contract rents reported for units with PBV.
Efficiency units are only offered at one community in the market. The effective rent is $430per month for a 550 square feet unit. This results in a net rent per square foot of $0.78.
One-bedroom units had an average effective rent of $488. Based on an average unit size of673 square feet, this equates to $0.73 per square foot. One-bedroom effective rents rangedfrom $355 for the 50 percent LIHTC units at Highland Estates to $685 for the market rate unitsat Etowah Terrace.
Two-bedroom unit’s effective rents averaged $618 per month. Two-bedroom units averaged935 square feet, resulting in a net per square foot of $0.66. The range for two-bedroomeffective rents was $416 for the 50 percent LIHTC units at Highland Estates to $790 for themarket rate units at Etowah Terrace.
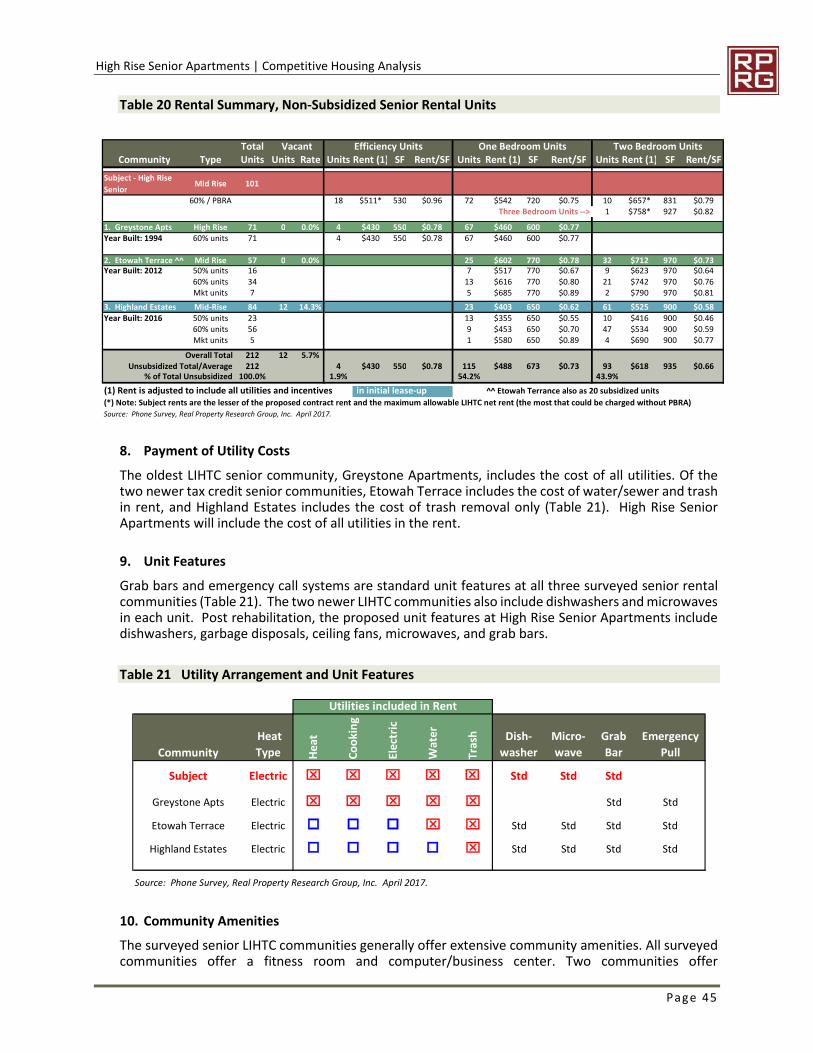
High Rise Senior Apartments | Competitive Housing Analysis
Page 45
Table 20 Rental Summary, Non-Subsidized Senior Rental Units
8. Payment of Utility Costs
The oldest LIHTC senior community, Greystone Apartments, includes the cost of all utilities. Of thetwo newer tax credit senior communities, Etowah Terrace includes the cost of water/sewer and trashin rent, and Highland Estates includes the cost of trash removal only (Table 21). High Rise SeniorApartments will include the cost of all utilities in the rent.
9. Unit Features
Grab bars and emergency call systems are standard unit features at all three surveyed senior rentalcommunities (Table 21). The two newer LIHTC communities also include dishwashers and microwavesin each unit. Post rehabilitation, the proposed unit features at High Rise Senior Apartments includedishwashers, garbage disposals, ceiling fans, microwaves, and grab bars.
Table 21 Utility Arrangement and Unit Features
10. Community Amenities
The surveyed senior LIHTC communities generally offer extensive community amenities. All surveyedcommunities offer a fitness room and computer/business center. Two communities offer
Total Efficiency Units One Bedroom Units Two Bedroom UnitsCommunity Type Units Units Rate Units Rent (1) SF Rent/SF Units Rent (1) SF Rent/SF Units Rent (1) SF Rent/SF
Subject - High Rise
SeniorMid Rise 101
60% / PBRA 18 $511* 530 $0.96 72 $542 720 $0.75 10 $657* 831 $0.79Three Bedroom Units --> 1 $758* 927 $0.82
1. Greystone Apts High Rise 71 0 0.0% 4 $430 550 $0.78 67 $460 600 $0.77Year Built: 1994 60% units 71 4 $430 550 $0.78 67 $460 600 $0.77
2. Etowah Terrace ^^ Mid Rise 57 0 0.0% 25 $602 770 $0.78 32 $712 970 $0.73Year Built: 2012 50% units 16 7 $517 770 $0.67 9 $623 970 $0.64
60% units 34 13 $616 770 $0.80 21 $742 970 $0.76Mkt units 7 5 $685 770 $0.89 2 $790 970 $0.81
3. Highland Estates Mid-Rise 84 12 14.3% 23 $403 650 $0.62 61 $525 900 $0.58
Year Built: 2016 50% units 23 13 $355 650 $0.55 10 $416 900 $0.4660% units 56 9 $453 650 $0.70 47 $534 900 $0.59Mkt units 5 1 $580 650 $0.89 4 $690 900 $0.77
Overall Total 212 12 5.7%Unsubsidized Total/Average 212 4 $430 550 $0.78 115 $488 673 $0.73 93 $618 935 $0.66
% of Total Unsubsidized 100.0% 1.9% 54.2% 43.9%
(1) Rent is adjusted to include all utilities and incentives in initial lease-up ^^ Etowah Terrance also as 20 subsidized units
(*) Note: Subject rents are the lesser of the proposed contract rent and the maximum allowable LIHTC net rent (the most that could be charged without PBRA)
Source: Phone Survey, Real Property Research Group, Inc. April 2017.
Vacant
Utilities included in Rent
Community
Heat
Type Hea
t
Co
oki
ng
Elec
tric
Wat
er
Tras
h Dish-
washer
Micro-
wave
Grab
Bar
Emergency
Pull
Subject Electric x x x x x Std Std Std
Greystone Apts Electric x x x x x Std Std
Etowah Terrace Electric o o o x x Std Std Std Std
Highland Estates Electric o o o o x Std Std Std Std
Source: Phone Survey, Real Property Research Group, Inc. April 2017.
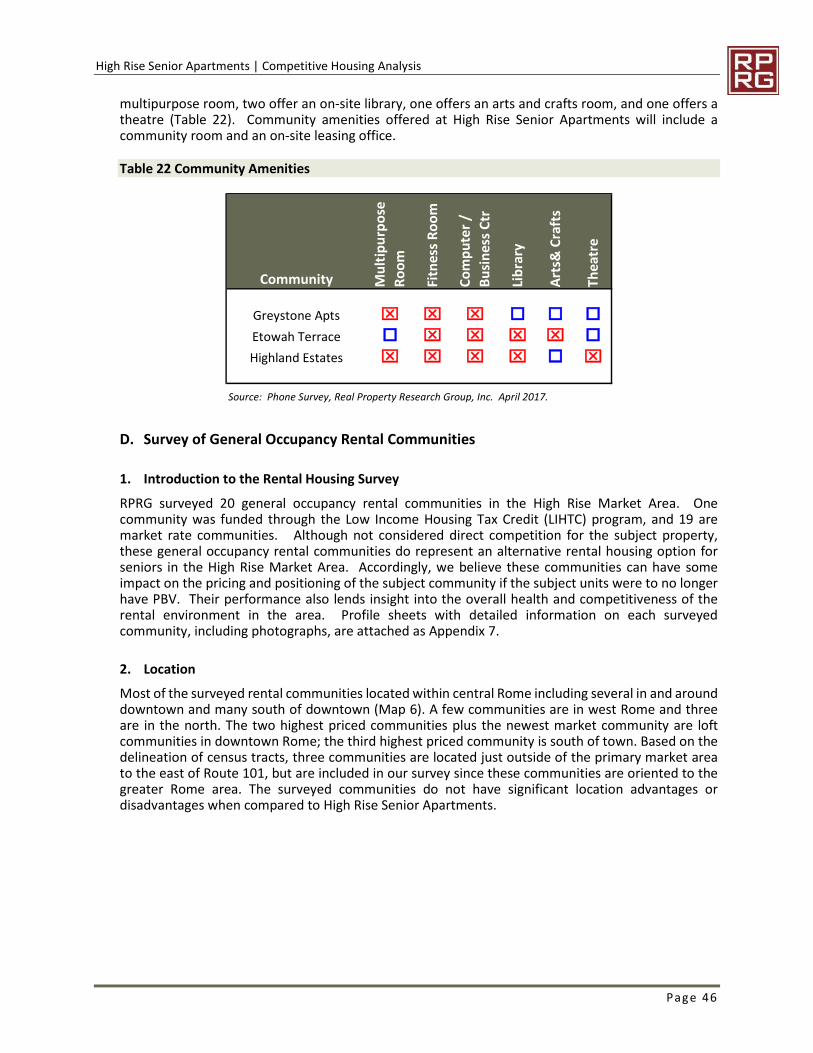
High Rise Senior Apartments | Competitive Housing Analysis
Page 46
multipurpose room, two offer an on-site library, one offers an arts and crafts room, and one offers atheatre (Table 22). Community amenities offered at High Rise Senior Apartments will include acommunity room and an on-site leasing office.
Table 22 Community Amenities
D. Survey of General Occupancy Rental Communities
1. Introduction to the Rental Housing Survey
RPRG surveyed 20 general occupancy rental communities in the High Rise Market Area. Onecommunity was funded through the Low Income Housing Tax Credit (LIHTC) program, and 19 aremarket rate communities. Although not considered direct competition for the subject property,these general occupancy rental communities do represent an alternative rental housing option forseniors in the High Rise Market Area. Accordingly, we believe these communities can have someimpact on the pricing and positioning of the subject community if the subject units were to no longerhave PBV. Their performance also lends insight into the overall health and competitiveness of therental environment in the area. Profile sheets with detailed information on each surveyedcommunity, including photographs, are attached as Appendix 7.
2. Location
Most of the surveyed rental communities located within central Rome including several in and arounddowntown and many south of downtown (Map 6). A few communities are in west Rome and threeare in the north. The two highest priced communities plus the newest market community are loftcommunities in downtown Rome; the third highest priced community is south of town. Based on thedelineation of census tracts, three communities are located just outside of the primary market areato the east of Route 101, but are included in our survey since these communities are oriented to thegreater Rome area. The surveyed communities do not have significant location advantages ordisadvantages when compared to High Rise Senior Apartments.
Community Mu
ltip
urp
ose
Ro
om
Fitn
ess
Ro
om
Co
mp
ute
r/
Bu
sin
ess
Ctr
Lib
rary
Art
s&C
raft
s
Thea
tre
Greystone Apts x x x o o oEtowah Terrace o x x x x oHighland Estates x x x x o x
Source: Phone Survey, Real Property Research Group, Inc. April 2017.
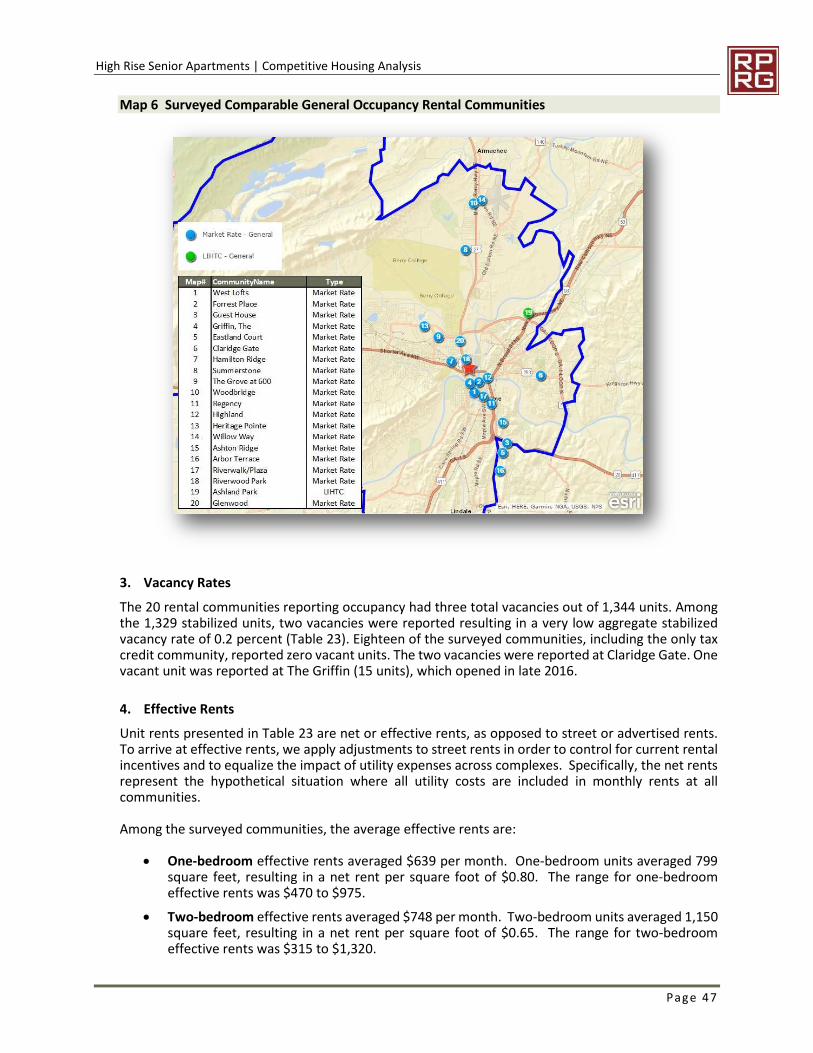
High Rise Senior Apartments | Competitive Housing Analysis
Page 47
Map 6 Surveyed Comparable General Occupancy Rental Communities
3. Vacancy Rates
The 20 rental communities reporting occupancy had three total vacancies out of 1,344 units. Amongthe 1,329 stabilized units, two vacancies were reported resulting in a very low aggregate stabilizedvacancy rate of 0.2 percent (Table 23). Eighteen of the surveyed communities, including the only taxcredit community, reported zero vacant units. The two vacancies were reported at Claridge Gate. Onevacant unit was reported at The Griffin (15 units), which opened in late 2016.
4. Effective Rents
Unit rents presented in Table 23 are net or effective rents, as opposed to street or advertised rents.To arrive at effective rents, we apply adjustments to street rents in order to control for current rentalincentives and to equalize the impact of utility expenses across complexes. Specifically, the net rentsrepresent the hypothetical situation where all utility costs are included in monthly rents at allcommunities.
Among the surveyed communities, the average effective rents are:
One-bedroom effective rents averaged $639 per month. One-bedroom units averaged 799square feet, resulting in a net rent per square foot of $0.80. The range for one-bedroomeffective rents was $470 to $975.
Two-bedroom effective rents averaged $748 per month. Two-bedroom units averaged 1,150square feet, resulting in a net rent per square foot of $0.65. The range for two-bedroomeffective rents was $315 to $1,320.
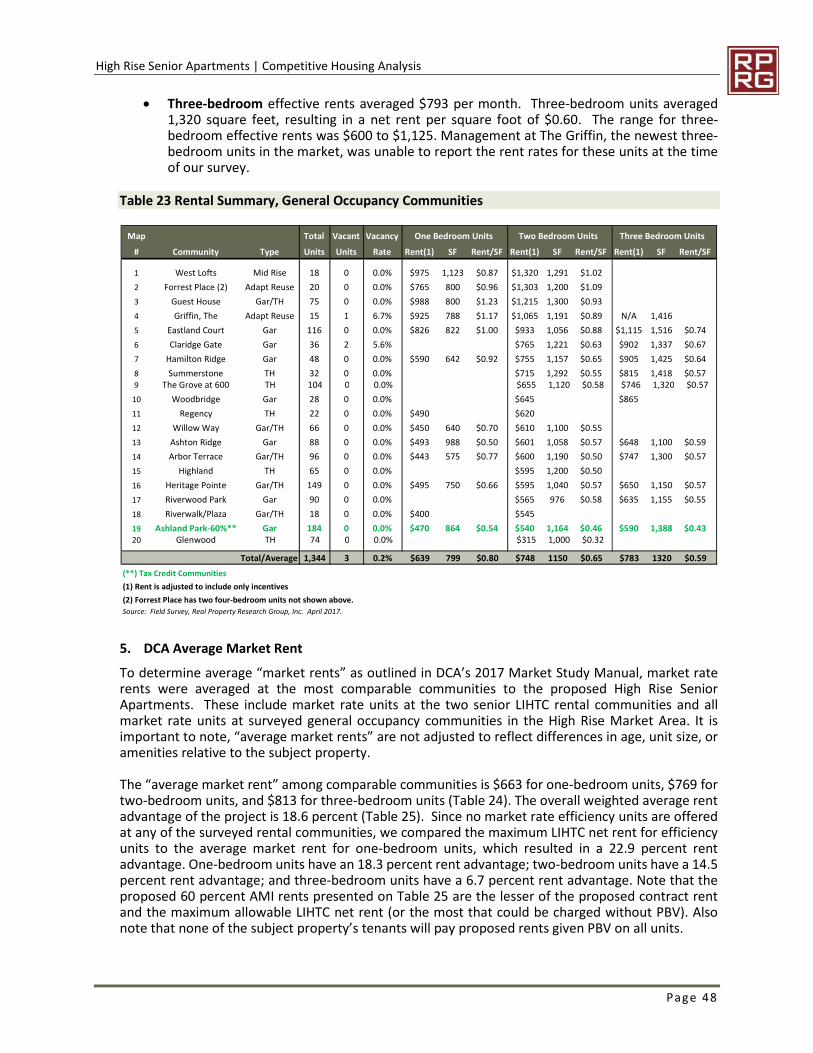
High Rise Senior Apartments | Competitive Housing Analysis
Page 48
Three-bedroom effective rents averaged $793 per month. Three-bedroom units averaged1,320 square feet, resulting in a net rent per square foot of $0.60. The range for three-bedroom effective rents was $600 to $1,125. Management at The Griffin, the newest three-bedroom units in the market, was unable to report the rent rates for these units at the timeof our survey.
Table 23 Rental Summary, General Occupancy Communities
5. DCA Average Market Rent
To determine average “market rents” as outlined in DCA’s 2017 Market Study Manual, market raterents were averaged at the most comparable communities to the proposed High Rise SeniorApartments. These include market rate units at the two senior LIHTC rental communities and allmarket rate units at surveyed general occupancy communities in the High Rise Market Area. It isimportant to note, “average market rents” are not adjusted to reflect differences in age, unit size, oramenities relative to the subject property.
The “average market rent” among comparable communities is $663 for one-bedroom units, $769 fortwo-bedroom units, and $813 for three-bedroom units (Table 24). The overall weighted average rentadvantage of the project is 18.6 percent (Table 25). Since no market rate efficiency units are offeredat any of the surveyed rental communities, we compared the maximum LIHTC net rent for efficiencyunits to the average market rent for one-bedroom units, which resulted in a 22.9 percent rentadvantage. One-bedroom units have an 18.3 percent rent advantage; two-bedroom units have a 14.5percent rent advantage; and three-bedroom units have a 6.7 percent rent advantage. Note that theproposed 60 percent AMI rents presented on Table 25 are the lesser of the proposed contract rentand the maximum allowable LIHTC net rent (or the most that could be charged without PBV). Alsonote that none of the subject property’s tenants will pay proposed rents given PBV on all units.
Map Total Vacant Vacancy One Bedroom Units Two Bedroom Units Three Bedroom Units
# Community Type Units Units Rate Rent(1) SF Rent/SF Rent(1) SF Rent/SF Rent(1) SF Rent/SF
1 West Lofts Mid Rise 18 0 0.0% $975 1,123 $0.87 $1,320 1,291 $1.02
2 Forrest Place (2) Adapt Reuse 20 0 0.0% $765 800 $0.96 $1,303 1,200 $1.09
3 Guest House Gar/TH 75 0 0.0% $988 800 $1.23 $1,215 1,300 $0.93
4 Griffin, The Adapt Reuse 15 1 6.7% $925 788 $1.17 $1,065 1,191 $0.89 N/A 1,416
5 Eastland Court Gar 116 0 0.0% $826 822 $1.00 $933 1,056 $0.88 $1,115 1,516 $0.74
6 Claridge Gate Gar 36 2 5.6% $765 1,221 $0.63 $902 1,337 $0.67
7 Hamilton Ridge Gar 48 0 0.0% $590 642 $0.92 $755 1,157 $0.65 $905 1,425 $0.64
8 Summerstone TH 32 0 0.0% $715 1,292 $0.55 $815 1,418 $0.579 The Grove at 600 TH 104 0 0.0% $655 1,120 $0.58 $746 1,320 $0.57
10 Woodbridge Gar 28 0 0.0% $645 $865
11 Regency TH 22 0 0.0% $490 $620
12 Willow Way Gar/TH 66 0 0.0% $450 640 $0.70 $610 1,100 $0.55
13 Ashton Ridge Gar 88 0 0.0% $493 988 $0.50 $601 1,058 $0.57 $648 1,100 $0.59
14 Arbor Terrace Gar/TH 96 0 0.0% $443 575 $0.77 $600 1,190 $0.50 $747 1,300 $0.57
15 Highland TH 65 0 0.0% $595 1,200 $0.50
16 Heritage Pointe Gar/TH 149 0 0.0% $495 750 $0.66 $595 1,040 $0.57 $650 1,150 $0.57
17 Riverwood Park Gar 90 0 0.0% $565 976 $0.58 $635 1,155 $0.55
18 Riverwalk/Plaza Gar/TH 18 0 0.0% $400 $545
19 Ashland Park-60%** Gar 184 0 0.0% $470 864 $0.54 $540 1,164 $0.46 $590 1,388 $0.4320 Glenwood TH 74 0 0.0% $315 1,000 $0.32
Total/Average 1,344 3 0.2% $639 799 $0.80 $748 1150 $0.65 $783 1320 $0.59
(**) Tax Credit Communities
(1) Rent is adjusted to include only incentives
(2) Forrest Place has two four-bedroom units not shown above.
Source: Field Survey, Real Property Research Group, Inc. April 2017.
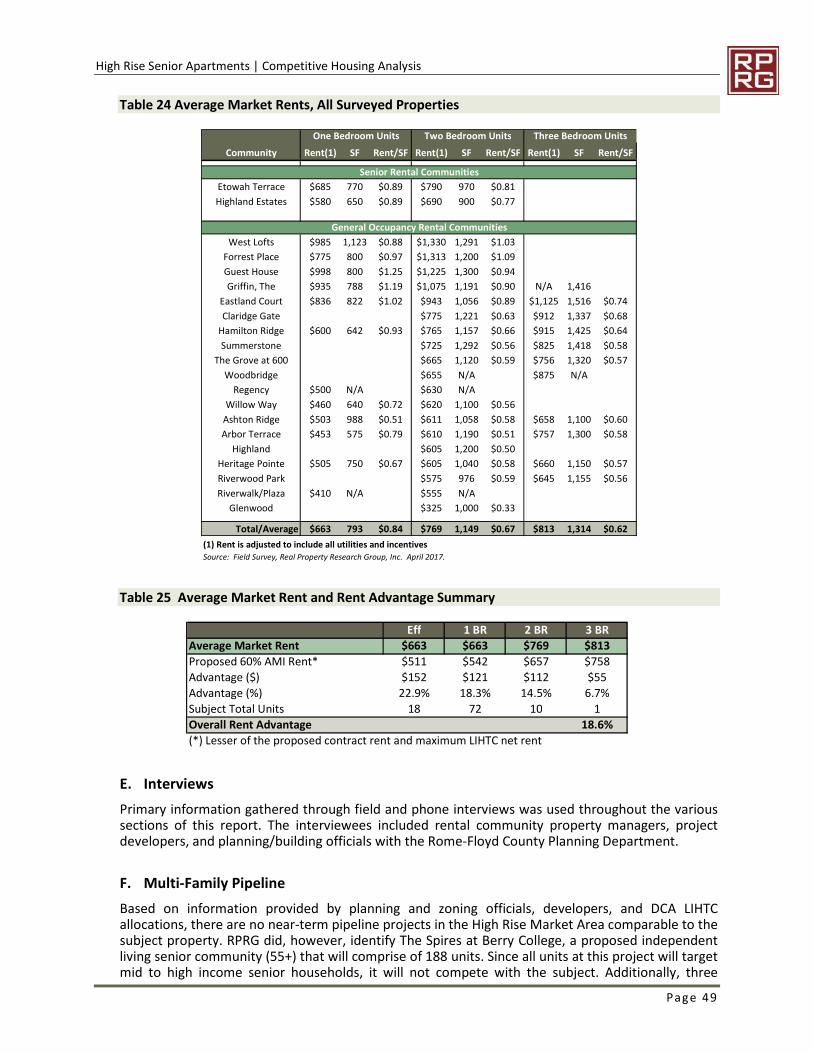
High Rise Senior Apartments | Competitive Housing Analysis
Page 49
Table 24 Average Market Rents, All Surveyed Properties
Table 25 Average Market Rent and Rent Advantage Summary
E. Interviews
Primary information gathered through field and phone interviews was used throughout the varioussections of this report. The interviewees included rental community property managers, projectdevelopers, and planning/building officials with the Rome-Floyd County Planning Department.
F. Multi-Family Pipeline
Based on information provided by planning and zoning officials, developers, and DCA LIHTCallocations, there are no near-term pipeline projects in the High Rise Market Area comparable to thesubject property. RPRG did, however, identify The Spires at Berry College, a proposed independentliving senior community (55+) that will comprise of 188 units. Since all units at this project will targetmid to high income senior households, it will not compete with the subject. Additionally, three
One Bedroom Units Two Bedroom Units Three Bedroom Units
Community Rent(1) SF Rent/SF Rent(1) SF Rent/SF Rent(1) SF Rent/SF
Senior Rental Communities
Etowah Terrace $685 770 $0.89 $790 970 $0.81
Highland Estates $580 650 $0.89 $690 900 $0.77
General Occupancy Rental Communities
West Lofts $985 1,123 $0.88 $1,330 1,291 $1.03
Forrest Place $775 800 $0.97 $1,313 1,200 $1.09
Guest House $998 800 $1.25 $1,225 1,300 $0.94
Griffin, The $935 788 $1.19 $1,075 1,191 $0.90 N/A 1,416
Eastland Court $836 822 $1.02 $943 1,056 $0.89 $1,125 1,516 $0.74
Claridge Gate $775 1,221 $0.63 $912 1,337 $0.68
Hamilton Ridge $600 642 $0.93 $765 1,157 $0.66 $915 1,425 $0.64
Summerstone $725 1,292 $0.56 $825 1,418 $0.58
The Grove at 600 $665 1,120 $0.59 $756 1,320 $0.57
Woodbridge $655 N/A $875 N/A
Regency $500 N/A $630 N/A
Willow Way $460 640 $0.72 $620 1,100 $0.56
Ashton Ridge $503 988 $0.51 $611 1,058 $0.58 $658 1,100 $0.60
Arbor Terrace $453 575 $0.79 $610 1,190 $0.51 $757 1,300 $0.58
Highland $605 1,200 $0.50
Heritage Pointe $505 750 $0.67 $605 1,040 $0.58 $660 1,150 $0.57
Riverwood Park $575 976 $0.59 $645 1,155 $0.56
Riverwalk/Plaza $410 N/A $555 N/A
Glenwood $325 1,000 $0.33
Total/Average $663 793 $0.84 $769 1,149 $0.67 $813 1,314 $0.62
(1) Rent is adjusted to include all utilities and incentives
Source: Field Survey, Real Property Research Group, Inc. April 2017.
Eff 1 BR 2 BR 3 BR
Average Market Rent $663 $663 $769 $813
Proposed 60% AMI Rent* $511 $542 $657 $758
Advantage ($) $152 $121 $112 $55
Advantage (%) 22.9% 18.3% 14.5% 6.7%
Subject Total Units 18 72 10 1
Overall Rent Advantage 18.6%
(*) Lesser of the proposed contract rent and maximum LIHTC net rent
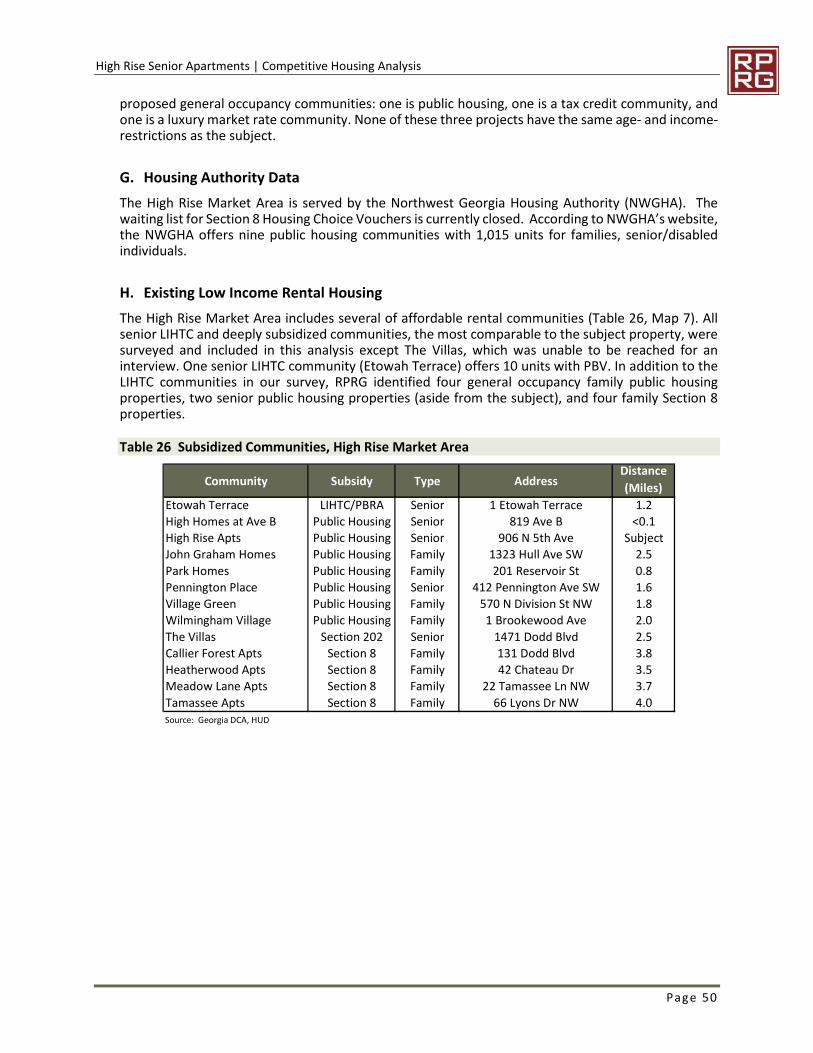
High Rise Senior Apartments | Competitive Housing Analysis
Page 50
proposed general occupancy communities: one is public housing, one is a tax credit community, andone is a luxury market rate community. None of these three projects have the same age- and income-restrictions as the subject.
G. Housing Authority Data
The High Rise Market Area is served by the Northwest Georgia Housing Authority (NWGHA). Thewaiting list for Section 8 Housing Choice Vouchers is currently closed. According to NWGHA’s website,the NWGHA offers nine public housing communities with 1,015 units for families, senior/disabledindividuals.
H. Existing Low Income Rental Housing
The High Rise Market Area includes several of affordable rental communities (Table 26, Map 7). Allsenior LIHTC and deeply subsidized communities, the most comparable to the subject property, weresurveyed and included in this analysis except The Villas, which was unable to be reached for aninterview. One senior LIHTC community (Etowah Terrace) offers 10 units with PBV. In addition to theLIHTC communities in our survey, RPRG identified four general occupancy family public housingproperties, two senior public housing properties (aside from the subject), and four family Section 8properties.
Table 26 Subsidized Communities, High Rise Market Area
Community Subsidy Type AddressDistance
(Miles)
Etowah Terrace LIHTC/PBRA Senior 1 Etowah Terrace 1.2
High Homes at Ave B Public Housing Senior 819 Ave B <0.1
High Rise Apts Public Housing Senior 906 N 5th Ave Subject
John Graham Homes Public Housing Family 1323 Hull Ave SW 2.5
Park Homes Public Housing Family 201 Reservoir St 0.8
Pennington Place Public Housing Senior 412 Pennington Ave SW 1.6
Village Green Public Housing Family 570 N Division St NW 1.8
Wilmingham Village Public Housing Family 1 Brookewood Ave 2.0
The Villas Section 202 Senior 1471 Dodd Blvd 2.5
Callier Forest Apts Section 8 Family 131 Dodd Blvd 3.8
Heatherwood Apts Section 8 Family 42 Chateau Dr 3.5
Meadow Lane Apts Section 8 Family 22 Tamassee Ln NW 3.7
Tamassee Apts Section 8 Family 66 Lyons Dr NW 4.0Source: Georgia DCA, HUD
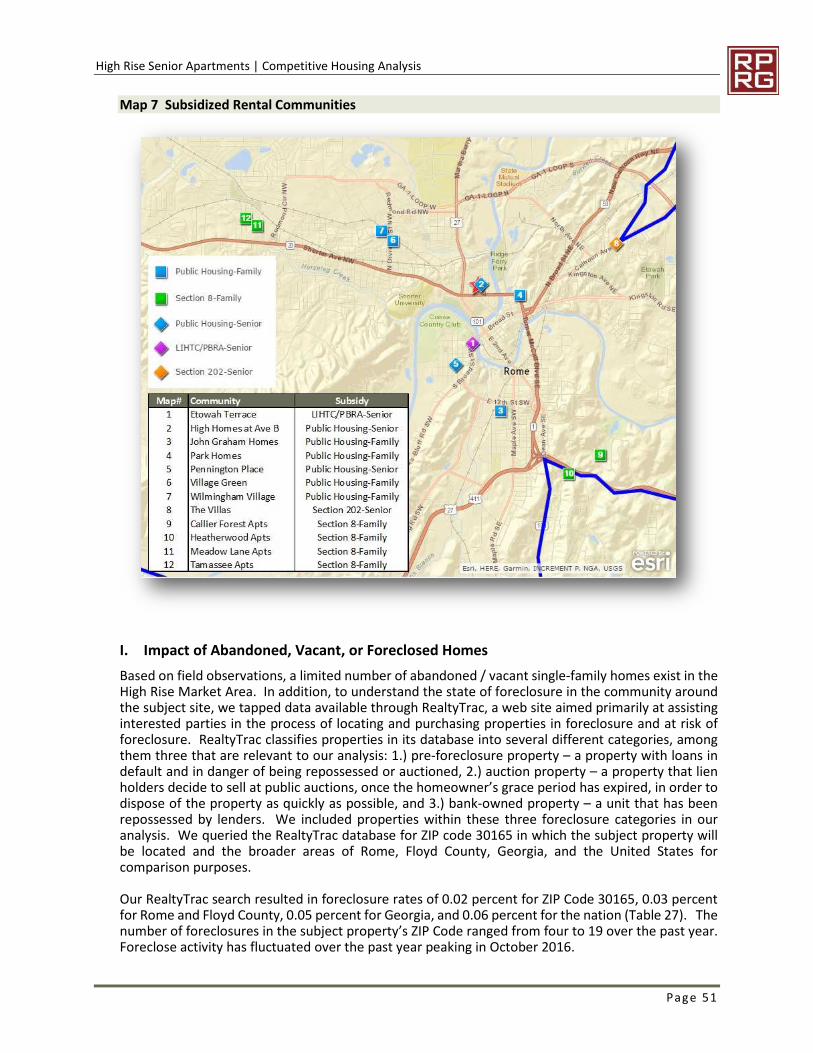
High Rise Senior Apartments | Competitive Housing Analysis
Page 51
Map 7 Subsidized Rental Communities
I. Impact of Abandoned, Vacant, or Foreclosed Homes
Based on field observations, a limited number of abandoned / vacant single-family homes exist in theHigh Rise Market Area. In addition, to understand the state of foreclosure in the community aroundthe subject site, we tapped data available through RealtyTrac, a web site aimed primarily at assistinginterested parties in the process of locating and purchasing properties in foreclosure and at risk offoreclosure. RealtyTrac classifies properties in its database into several different categories, amongthem three that are relevant to our analysis: 1.) pre-foreclosure property – a property with loans indefault and in danger of being repossessed or auctioned, 2.) auction property – a property that lienholders decide to sell at public auctions, once the homeowner’s grace period has expired, in order todispose of the property as quickly as possible, and 3.) bank-owned property – a unit that has beenrepossessed by lenders. We included properties within these three foreclosure categories in ouranalysis. We queried the RealtyTrac database for ZIP code 30165 in which the subject property willbe located and the broader areas of Rome, Floyd County, Georgia, and the United States forcomparison purposes.
Our RealtyTrac search resulted in foreclosure rates of 0.02 percent for ZIP Code 30165, 0.03 percentfor Rome and Floyd County, 0.05 percent for Georgia, and 0.06 percent for the nation (Table 27). Thenumber of foreclosures in the subject property’s ZIP Code ranged from four to 19 over the past year.Foreclose activity has fluctuated over the past year peaking in October 2016.
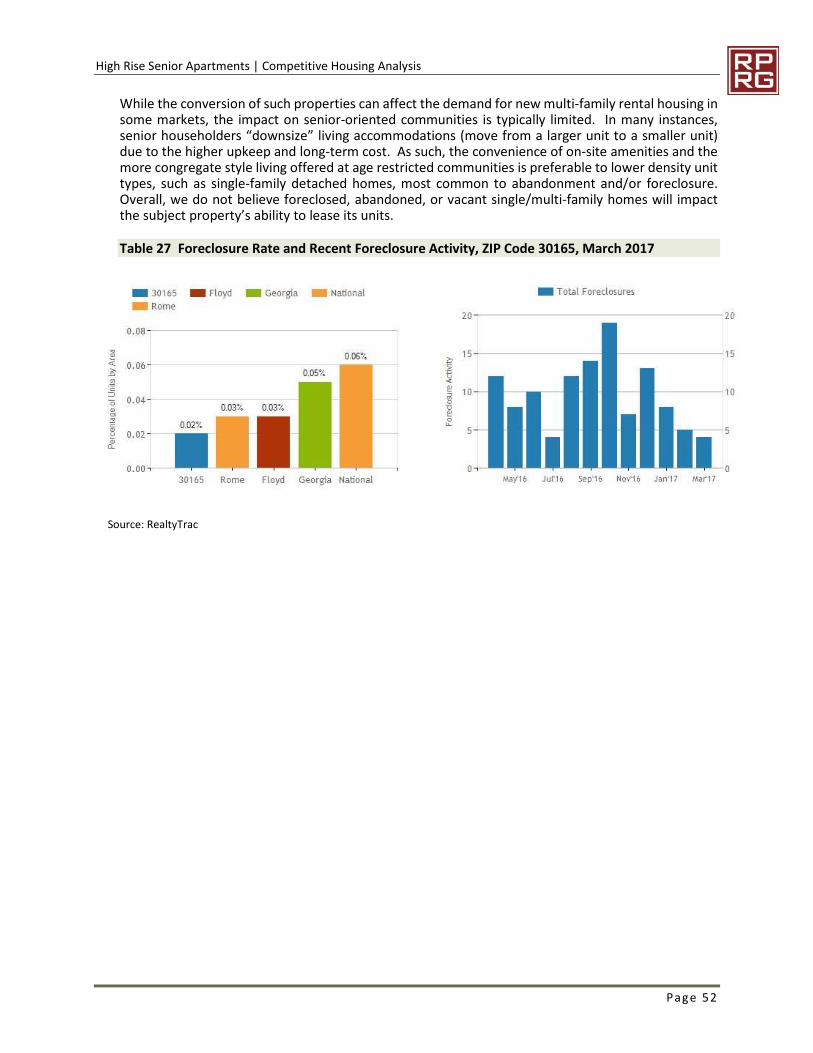
High Rise Senior Apartments | Competitive Housing Analysis
Page 52
While the conversion of such properties can affect the demand for new multi-family rental housing insome markets, the impact on senior-oriented communities is typically limited. In many instances,senior householders “downsize” living accommodations (move from a larger unit to a smaller unit)due to the higher upkeep and long-term cost. As such, the convenience of on-site amenities and themore congregate style living offered at age restricted communities is preferable to lower density unittypes, such as single-family detached homes, most common to abandonment and/or foreclosure.Overall, we do not believe foreclosed, abandoned, or vacant single/multi-family homes will impactthe subject property’s ability to lease its units.
Table 27 Foreclosure Rate and Recent Foreclosure Activity, ZIP Code 30165, March 2017
Source: RealtyTrac
High Rise Senior Apartments | Findings and Conclusions
Page 53
8. FINDINGS AND CONCLUSIONS
A. Key Findings
Based on the preceding review of the subject project and demographic and competitive housingtrends in the High Rise Market Area, RPRG offers the following key findings:
1. Site and Neighborhood Analysis
The subject site is a suitable location for affordable senior rental housing as it is compatible withsurrounding land uses, has sufficient visibility from major thoroughfares, and has ample access toamenities, services, and public transportation.
High Rise Senior Apartments is located at the corner of North 5th Avenue and West 10th Street inwest Rome, just 0.2 miles north of Turner McCall Boulevard, a primary local thoroughfare.Bordering land uses include the subject’s two sister structures as well as Riverwood retirementhome, small healthcare facilities, and a vacant lot.
Community services, medical services, shopping, and recreational centers/parks are all in thesubject site’s immediate vicinity. Charles Hight Square shopping center is within the periphery ofthe site – just 0.2 mile southwest – and is anchored by Publix grocery store and pharmacy.Healthcare and medical facilities are within a one-mile radius of the site, including the ValleyHealthcare physician, PrimeCare Nursing, Floyd Medical Center, Harbin Clinic, and Fifth AvenueHealth Care Center. The closest senior services center is 0.6 mile east of the site at Rome SeniorCenter, which provides daily activities for elderly adults.
The Rome Transit Department (RTD) provides public bus transportation throughout the city, andtwo RTD bus routes pass through a fixed bus stop along Avenue B. The bus stop is located withinwalking distance of the site, approximately 0.1 mile to the east.
High Rise Senior Apartments will have excellent visibility from North 5th Avenue, a moderatelytraveled road connecting the West Rome neighborhood to the city’s downtown district. As oneof the tallest buildings in the area, the subject property will also have visibility from surroundingside streets and awareness for the subject will benefit from traffic generated by surroundingcommercial land uses.
The subject property’s location is generally comparable to both senior and general occupancyrental communities in the High Rise Market Area. No land uses were identified that wouldnegatively affect the proposed development’s viability in the marketplace. As the subjectproperty is an existing senior rental community, its proposed rehabilitation will not alter the landuse characteristics of the immediate area.
2. Economic Context
Although Floyd County historically experienced relatively more job losses and higher unemploymentrates than the nation as a result of the Great Recession, the county has recently shown signs ofrecovery.
The unemployment rate in Floyd County has decreased significantly to 5.9 percent in 2016from a recession era high of 12.1 percent in 2011.
From 2006 to 2011, Floyd County lost over 6,000 jobs as a result of the nation’s economicdownturn. Between 2012 and 2015, the economy appeared to have stabilized with the netaddition of 1,606 jobs. As of third quarter 2016, the county’s at-place employment stood at38,561 jobs.
As of third quarter 2016, 23.8 percent of all jobs in the county are in the Education-Healthsector. Three of the ten largest employers in the county are hospitals and are all within threemiles of the subject site.
High Rise Senior Apartments | Findings and Conclusions
Page 54
In the last year, several companies announced job expansions in close proximity to the subjectsite. Carlsen Precision Manufacturing is investing $5,000,000 in its first United Statesoperations located in Industrial Park, less than two miles north of the subject. SykesEnterprises, The Ball Metal Beverage Container, and Transdev are also opening facilities in thearea, creating more than 200 new jobs in Rome.
Given the senior-oriented nature of the subject property, it is less likely to be affected by changes ineconomic conditions. We do not expect current economic conditions in Floyd County to negatively impactthe proposed development of High Rise Senior Apartments.
3. Population and Household Trends
Senior household growth (55+) in the High Rise Market Area experience some annual growth from2010 to 2017 and is expected to remain stable through 2019.
Between 2000 and 2010 Census counts, the population of the High Rise Market Area had a net growth of6.7 percent and the households grew by 4.5 percent. Market area growth slowed down to 2.6 percentamong the population and 1.2 percent among households from 2010 to 2017. Over the next two years,the market area is expected to remain relatively stable with 0.6 percent more people and only 0.3 percentmore households.
From 2017 to 2019, households with householders age 55+ are projected to increase at an annual rate of1.1 percent or 122 households. This would bring the total number of households with householders age55+ in the High Rise Market Area to 11,527.
4. Demographic Analysis
Senior households in the High Rise Market Area have general modest incomes, accounting for nearlyone-third of market area renter households.
Seniors (persons age 55 and older) comprise 27.6 percent of the population in the High RiseMarket Area. Adults age 35 to 54 comprise of nearly one-quarter of the population in themarket area at 24.2 percent. Young adults age 20 to 34 account for 20.7 percent of the marketarea.
Over one-third (37.2 percent) of all households in the market area have at least two peoplewith no children, and over one-quarter (28.3 percent) are single-person households.
As of the 2010 Census, 42.8 percent of all households in the High Rise Market Area wererenters, compared to 36.7 percent in Floyd County. The renter percentage increased slightlyto 46.5 percent in 2017 and is expected to remain unchanged through 2019.
Among householders age 55 or older, the market area’s 2017 renter percentages is 32.3percent.
Roughly 58 percent of renter households in the market area contain one or two peopleincluding nearly 34 percent with one person. Three percent households account for about 16percent of market area renters.
The 2017 median income of households in the High Rise Market Area is $39,914, about $3,500 or eightpercent lower than the $43,425 median in Floyd County. RPRG estimates the 2017 median income forsenior renter householders (age 55 or older) in the High Rise Market Area is a modest $23,985. A majorityof senior renter households (52.4 percent) earn less than $25,000 including 28.3 percent earning less than$15,000. Approximately 27 percent of senior renter households earn $25,000 to $49,999.
High Rise Senior Apartments | Findings and Conclusions
Page 55
5. Competitive Housing Analysis
RPRG surveyed three senior rental communities and 20 general occupancy rental communities in theHigh Rise Market Area. Both senior and general occupancy rental markets were performing well withlow vacancy rates.
Senior Rental Communities:
Three senior LIHTC communities combine to offer 212 units without PBV, 12 of which were vacant;all vacancies are at Highland Estates, which opened in 2016 and is currently undergoing lease-up.Thus, the aggregate stabilized vacancy rate among the senior tax credit communities is zeropercent. One senior LIHTC community offers 10 units with PBV, all of which were leased at thetime of our survey.
Efficiency units is offered at one community with an effective rent of $430 per month for a 550square foot units, equating to $0.78 per square foot. One-bedroom units had an average effectiverent of $488 and an average units size of 673 square feet ($0.73 per square foot), and two-bedroom units had an average effective rent of $618 and an average unit size of 935 square feet($0.66 per square foot). No surveyed senior communities offered three-bedroom units.
General Occupancy Rental Communities:
Of the 20 general occupancy rental communities, 19 were stabilized communities reporting onlytwo vacancies with a very low aggregate vacancy rate of 0.2 percent. Ashland Park, the onlygeneral occupancy LIHTC community in the market area, reported zero vacant units out of 184total units.
Among surveyed general occupancy rental communities, net rents, unit sizes, and rents persquare foot are as follows:
One-bedroom effective rents averaged $639 per month. One-bedroom units averaged 799square feet, resulting in a net rent per square foot of $0.80.
Two-bedroom effective rents averaged $748 per month. Two-bedroom units averaged 1,150square feet, resulting in a net rent per square foot of $0.65.
Three-bedroom effective rents averaged $793 per month. Three-bedroom units averaged 1,320square feet, resulting in a net rent per square foot of $0.60.
None of the surveyed general occupancy rental communities offered efficiency units.
The “average market rent” among comparable communities is $663 for one-bedroom units, $769 for two-bedroom units, and $813 for three-bedroom units. Since no market rate efficiency units are offered atany of the surveyed rental communities, we compared the maximum LIHTC net rent for efficiency unitsto the average market rent for one-bedroom units, which resulted in a 22.9 percent rent advantage. One-bedroom units have a 46.5 percent rent advantage; two-bedroom units have a 37.6 percent rentadvantage; and three-bedroom units have a 26.5 percent rent advantage. The overall weighted averagerent advantage of the project is 41.6 percent. Note that the evaluated rents are the lesser of the proposedcontract rents and the maximum allowable LIHTC net rent. It is important to note that none of the subjectproperty’s tenants will pay the proposed rents given PBV on all proposed units.
RPRG did not identify any comparable pipeline communities in the market area.
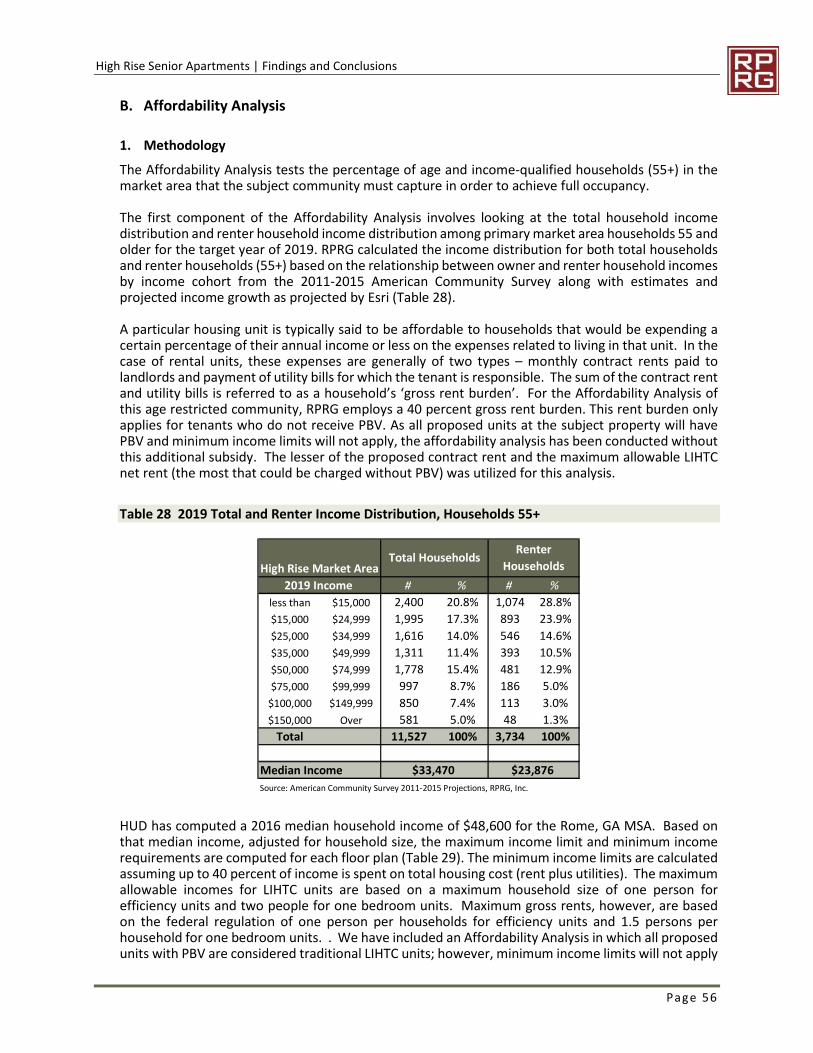
High Rise Senior Apartments | Findings and Conclusions
Page 56
B. Affordability Analysis
1. Methodology
The Affordability Analysis tests the percentage of age and income-qualified households (55+) in themarket area that the subject community must capture in order to achieve full occupancy.
The first component of the Affordability Analysis involves looking at the total household incomedistribution and renter household income distribution among primary market area households 55 andolder for the target year of 2019. RPRG calculated the income distribution for both total householdsand renter households (55+) based on the relationship between owner and renter household incomesby income cohort from the 2011-2015 American Community Survey along with estimates andprojected income growth as projected by Esri (Table 28).
A particular housing unit is typically said to be affordable to households that would be expending acertain percentage of their annual income or less on the expenses related to living in that unit. In thecase of rental units, these expenses are generally of two types – monthly contract rents paid tolandlords and payment of utility bills for which the tenant is responsible. The sum of the contract rentand utility bills is referred to as a household’s ‘gross rent burden’. For the Affordability Analysis ofthis age restricted community, RPRG employs a 40 percent gross rent burden. This rent burden onlyapplies for tenants who do not receive PBV. As all proposed units at the subject property will havePBV and minimum income limits will not apply, the affordability analysis has been conducted withoutthis additional subsidy. The lesser of the proposed contract rent and the maximum allowable LIHTCnet rent (the most that could be charged without PBV) was utilized for this analysis.
Table 28 2019 Total and Renter Income Distribution, Households 55+
HUD has computed a 2016 median household income of $48,600 for the Rome, GA MSA. Based onthat median income, adjusted for household size, the maximum income limit and minimum incomerequirements are computed for each floor plan (Table 29). The minimum income limits are calculatedassuming up to 40 percent of income is spent on total housing cost (rent plus utilities). The maximumallowable incomes for LIHTC units are based on a maximum household size of one person forefficiency units and two people for one bedroom units. Maximum gross rents, however, are basedon the federal regulation of one person per households for efficiency units and 1.5 persons perhousehold for one bedroom units. . We have included an Affordability Analysis in which all proposedunits with PBV are considered traditional LIHTC units; however, minimum income limits will not apply
2019 Income # % # %
less than $15,000 2,400 20.8% 1,074 28.8%
$15,000 $24,999 1,995 17.3% 893 23.9%
$25,000 $34,999 1,616 14.0% 546 14.6%
$35,000 $49,999 1,311 11.4% 393 10.5%
$50,000 $74,999 1,778 15.4% 481 12.9%
$75,000 $99,999 997 8.7% 186 5.0%
$100,000 $149,999 850 7.4% 113 3.0%
$150,000 Over 581 5.0% 48 1.3%
Total 11,527 100% 3,734 100%
Median Income
Source: American Community Survey 2011-2015 Projections, RPRG, Inc.
High Rise Market Area
$33,470 $23,876
Total HouseholdsRenter
Households
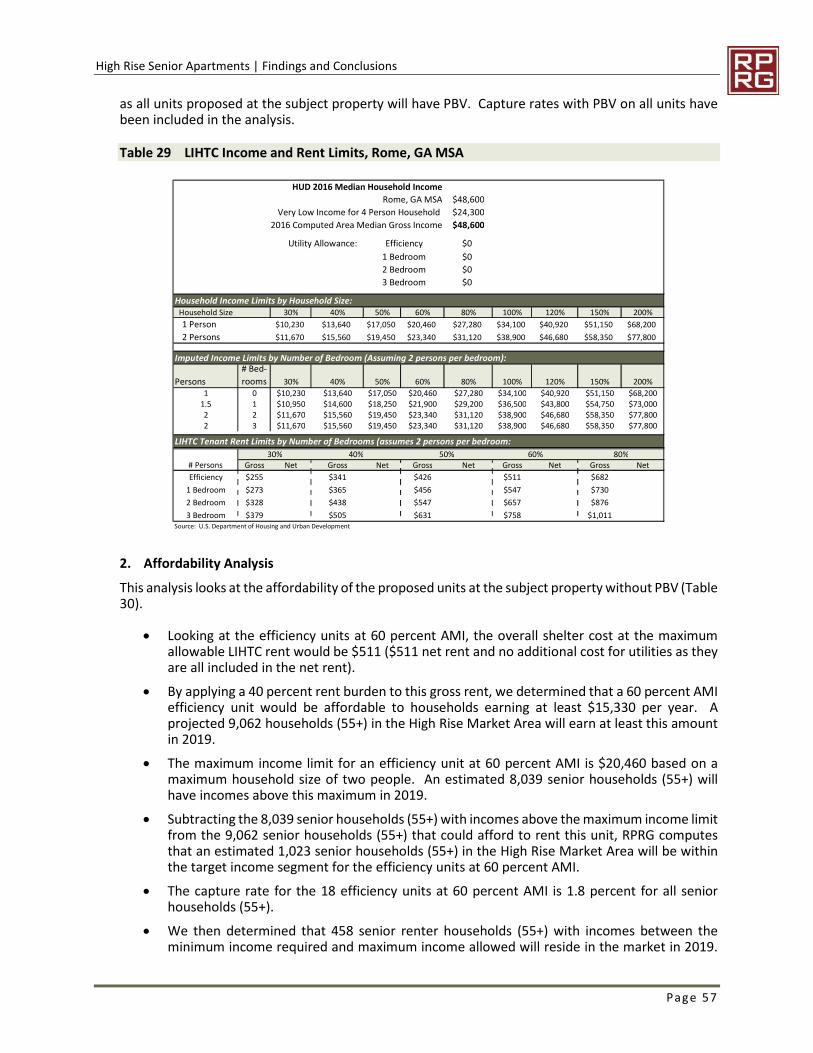
High Rise Senior Apartments | Findings and Conclusions
Page 57
as all units proposed at the subject property will have PBV. Capture rates with PBV on all units havebeen included in the analysis.
Table 29 LIHTC Income and Rent Limits, Rome, GA MSA
2. Affordability Analysis
This analysis looks at the affordability of the proposed units at the subject property without PBV (Table30).
Looking at the efficiency units at 60 percent AMI, the overall shelter cost at the maximumallowable LIHTC rent would be $511 ($511 net rent and no additional cost for utilities as theyare all included in the net rent).
By applying a 40 percent rent burden to this gross rent, we determined that a 60 percent AMIefficiency unit would be affordable to households earning at least $15,330 per year. Aprojected 9,062 households (55+) in the High Rise Market Area will earn at least this amountin 2019.
The maximum income limit for an efficiency unit at 60 percent AMI is $20,460 based on amaximum household size of two people. An estimated 8,039 senior households (55+) willhave incomes above this maximum in 2019.
Subtracting the 8,039 senior households (55+) with incomes above the maximum income limitfrom the 9,062 senior households (55+) that could afford to rent this unit, RPRG computesthat an estimated 1,023 senior households (55+) in the High Rise Market Area will be withinthe target income segment for the efficiency units at 60 percent AMI.
The capture rate for the 18 efficiency units at 60 percent AMI is 1.8 percent for all seniorhouseholds (55+).
We then determined that 458 senior renter households (55+) with incomes between theminimum income required and maximum income allowed will reside in the market in 2019.
HUD 2016 Median Household Income
Rome, GA MSA $48,600
Very Low Income for 4 Person Household $24,300
2016 Computed Area Median Gross Income $48,600
Utility Allowance: $0
$0
$0
$0
Household Income Limits by Household Size:Household Size 30% 40% 50% 60% 80% 100% 120% 150% 200%
1 Person $10,230 $13,640 $17,050 $20,460 $27,280 $34,100 $40,920 $51,150 $68,200
2 Persons $11,670 $15,560 $19,450 $23,340 $31,120 $38,900 $46,680 $58,350 $77,8007 Persons $0 $0 $0 $0 $0 $08 Persons $0 $0 $0 $0 $0 $0
Imputed Income Limits by Number of Bedroom (Assuming 2 persons per bedroom):
Persons
# Bed-
rooms 30% 40% 50% 60% 80% 100% 120% 150% 200%
1 0 $10,230 $13,640 $17,050 $20,460 $27,280 $34,100 $40,920 $51,150 $68,2001.5 1 $10,950 $14,600 $18,250 $21,900 $29,200 $36,500 $43,800 $54,750 $73,0002 2 $11,670 $15,560 $19,450 $23,340 $31,120 $38,900 $46,680 $58,350 $77,8002 3 $11,670 $15,560 $19,450 $23,340 $31,120 $38,900 $46,680 $58,350 $77,800
LIHTC Tenant Rent Limits by Number of Bedrooms (assumes 2 persons per bedroom:
30% 40% 50% 60% 80%Gross Net Gross Net Gross Net Gross Net Gross Net
Efficiency $255 $341 $426 $511 $682
1 Bedroom $273 $365 $456 $547 $730
2 Bedroom $328 $438 $547 $657 $876
3 Bedroom $379 $505 $631 $758 $1,011Source: U.S. Department of Housing and Urban Development
# Persons
Efficiency
1 Bedroom
2 Bedroom
3 Bedroom
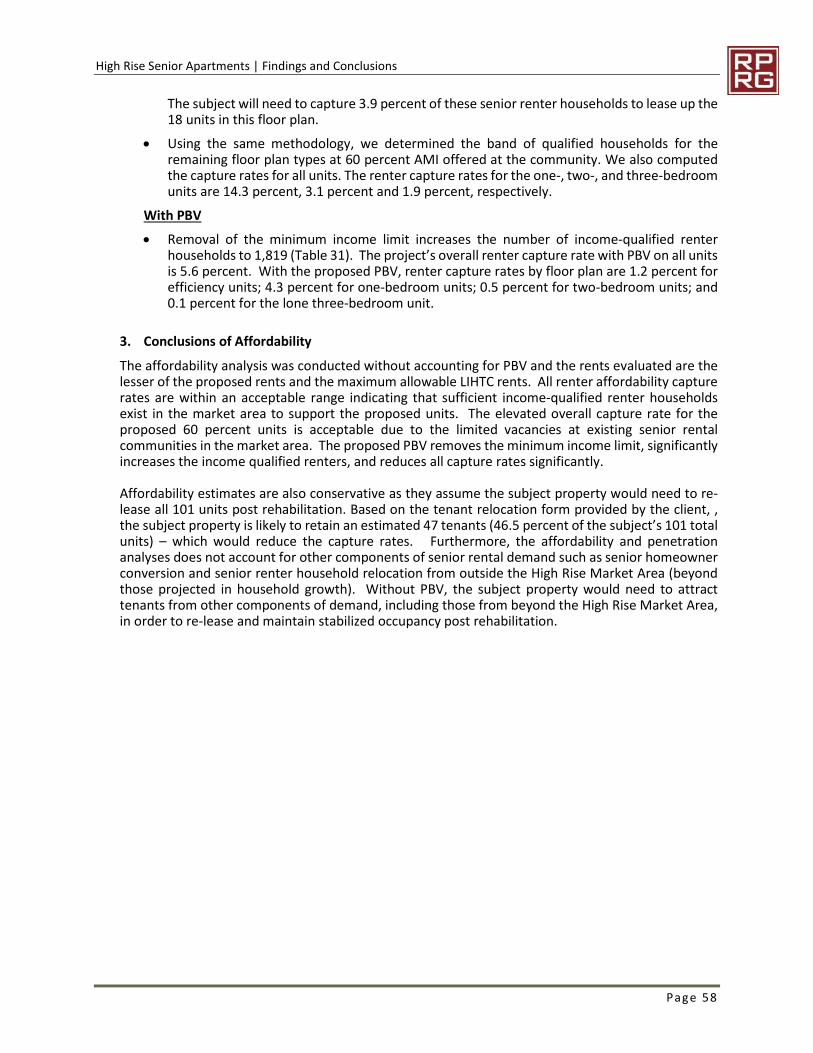
High Rise Senior Apartments | Findings and Conclusions
Page 58
The subject will need to capture 3.9 percent of these senior renter households to lease up the18 units in this floor plan.
Using the same methodology, we determined the band of qualified households for theremaining floor plan types at 60 percent AMI offered at the community. We also computedthe capture rates for all units. The renter capture rates for the one-, two-, and three-bedroomunits are 14.3 percent, 3.1 percent and 1.9 percent, respectively.
With PBV
Removal of the minimum income limit increases the number of income-qualified renterhouseholds to 1,819 (Table 31). The project’s overall renter capture rate with PBV on all unitsis 5.6 percent. With the proposed PBV, renter capture rates by floor plan are 1.2 percent forefficiency units; 4.3 percent for one-bedroom units; 0.5 percent for two-bedroom units; and0.1 percent for the lone three-bedroom unit.
3. Conclusions of Affordability
The affordability analysis was conducted without accounting for PBV and the rents evaluated are thelesser of the proposed rents and the maximum allowable LIHTC rents. All renter affordability capturerates are within an acceptable range indicating that sufficient income-qualified renter householdsexist in the market area to support the proposed units. The elevated overall capture rate for theproposed 60 percent units is acceptable due to the limited vacancies at existing senior rentalcommunities in the market area. The proposed PBV removes the minimum income limit, significantlyincreases the income qualified renters, and reduces all capture rates significantly.
Affordability estimates are also conservative as they assume the subject property would need to re-lease all 101 units post rehabilitation. Based on the tenant relocation form provided by the client, ,the subject property is likely to retain an estimated 47 tenants (46.5 percent of the subject’s 101 totalunits) – which would reduce the capture rates. Furthermore, the affordability and penetrationanalyses does not account for other components of senior rental demand such as senior homeownerconversion and senior renter household relocation from outside the High Rise Market Area (beyondthose projected in household growth). Without PBV, the subject property would need to attracttenants from other components of demand, including those from beyond the High Rise Market Area,in order to re-lease and maintain stabilized occupancy post rehabilitation.
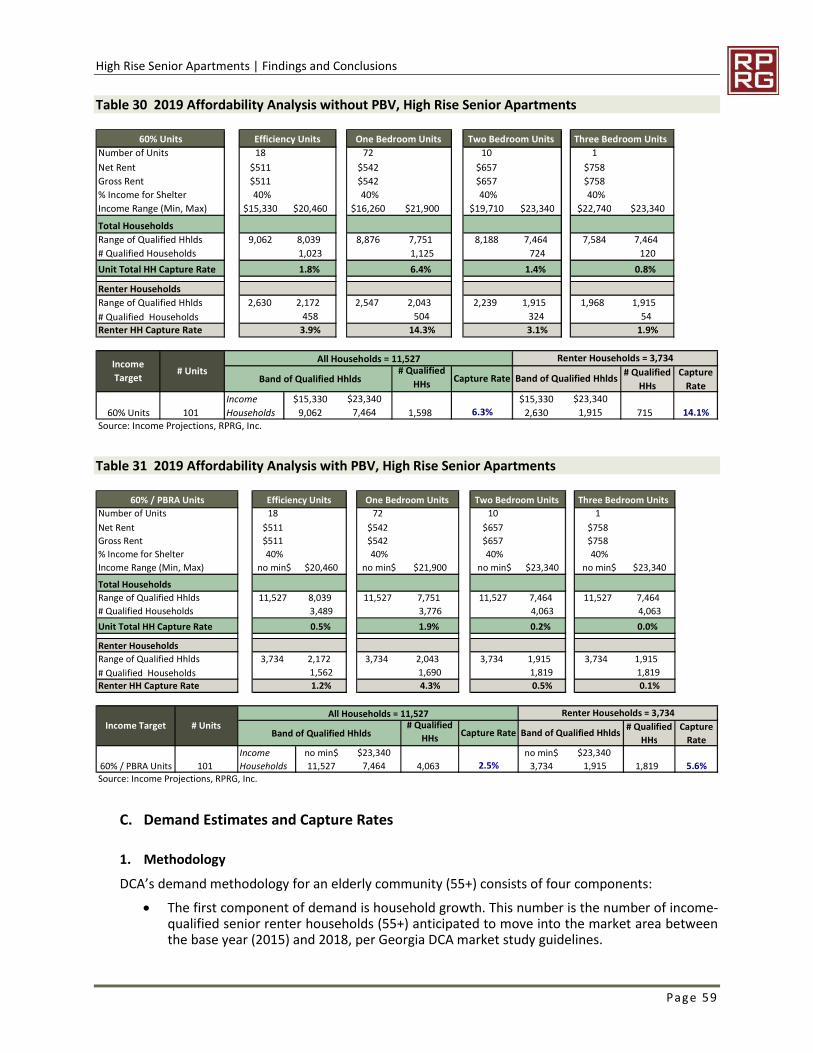
High Rise Senior Apartments | Findings and Conclusions
Page 59
Table 30 2019 Affordability Analysis without PBV, High Rise Senior Apartments
Table 31 2019 Affordability Analysis with PBV, High Rise Senior Apartments
C. Demand Estimates and Capture Rates
1. Methodology
DCA’s demand methodology for an elderly community (55+) consists of four components:
The first component of demand is household growth. This number is the number of income-qualified senior renter households (55+) anticipated to move into the market area betweenthe base year (2015) and 2018, per Georgia DCA market study guidelines.
60% Units Efficiency Units One Bedroom Units Two Bedroom Units Three Bedroom Units
Number of Units 18 72 10 1
Net Rent $511 $542 $657 $758
Gross Rent $511 $542 $657 $758
% Income for Shelter 40% 40% 40% 40%
Income Range (Min, Max) $15,330 $20,460 $16,260 $21,900 $19,710 $23,340 $22,740 $23,340
Total Households
Range of Qualified Hhlds 9,062 8,039 8,876 7,751 8,188 7,464 7,584 7,464
# Qualified Households 1,023 1,125 724 120
Unit Total HH Capture Rate 1.8% 6.4% 1.4% 0.8%
Renter Households
Range of Qualified Hhlds 2,630 2,172 2,547 2,043 2,239 1,915 1,968 1,915
# Qualified Households 458 504 324 54
Renter HH Capture Rate 3.9% 14.3% 3.1% 1.9%
Band of Qualified Hhlds# Qualified
HHs# Qualified
HHs
Capture
Rate
Income $15,330 $15,330
60% Units 101 Households 9,062 1,598 2,630 715 14.1%
Source: Income Projections, RPRG, Inc.
Income
Target# Units
$23,340 $23,340
7,464 1,915
Renter Households = 3,734All Households = 11,527
6.3%
Capture Rate Band of Qualified Hhlds
60% / PBRA Units Efficiency Units One Bedroom Units Two Bedroom Units Three Bedroom Units
Number of Units 18 72 10 1
Net Rent $511 $542 $657 $758
Gross Rent $511 $542 $657 $758
% Income for Shelter 40% 40% 40% 40%
Income Range (Min, Max) no min$ $20,460 no min$ $21,900 no min$ $23,340 no min$ $23,340
Total Households
Range of Qualified Hhlds 11,527 8,039 11,527 7,751 11,527 7,464 11,527 7,464
# Qualified Households 3,489 3,776 4,063 4,063
Unit Total HH Capture Rate 0.5% 1.9% 0.2% 0.0%
Renter Households
Range of Qualified Hhlds 3,734 2,172 3,734 2,043 3,734 1,915 3,734 1,915
# Qualified Households 1,562 1,690 1,819 1,819
Renter HH Capture Rate 1.2% 4.3% 0.5% 0.1%
Band of Qualified Hhlds# Qualified
HHs# Qualified
HHs
Capture
Rate
Income no min$ no min$
60% / PBRA Units 101 Households 11,527 4,063 3,734 1,819 5.6%
Source: Income Projections, RPRG, Inc.
$23,340 $23,340
7,464 2.5% 1,915
Income Target # UnitsAll Households = 11,527 Renter Households = 3,734
Capture Rate Band of Qualified Hhlds

High Rise Senior Apartments | Findings and Conclusions
Page 60
The second component is income-qualified renter households living in substandard housing.“Substandard” is defined as having more than 1.01 persons per room and/or lacking completeplumbing facilities. According to U.S. Census ACS data, 3.5 percent of the renter occupiedunits in the High Rise Market Area are considered “substandard” (Table 32).
The third component of demand is cost burdened renters, which is defined as those renterhouseholds paying more than 40 percent of household income for housing costs. Accordingto 2011-2015 American Community Survey (ACS) data, 39.3 percent of High Rise Market Areasenior renter households (65+) are categorized as cost burdened (Table 32). This costburdened percentage is applied to the current senior household base (55+).
The final component of demand is from homeowners converting to rental housing. There is alack of detailed local or regional information regarding the movership of elderly homeownersto rental housing. According to the American Housing Survey conducted for the U.S. CensusBureau in 2011, 3.0 percent of elderly households move each year in the Atlanta MSA. Ofthose moving within the past twelve months and reporting tenure, 31.8 percent moved fromowned to rental housing (Table 33). This equates to 1.0 percent of all senior householdsconverting from owners to renters. Given the lack of local information, this source isconsidered to be the most current and accurate. This component of demand is limited to twopercent of total demand per DCA’s requirements.
The data assumptions used in the calculation of these demand estimates are detailed at the bottomof Table 34 and Table 35. Income qualification percentages for demand estimates are derived by usingthe Affordability Analysis detailed in Table 30, but are adjusted to remove overlap among bedroomsizes within the same AMI level.
The first three components of DCA demand are augmented by 10 percent to account for secondarymarket demand. While no longer specifically part of DCA’s demand methodology, this component ofdemand is relevant for senior-oriented communities that often attract a significant proportion oftenants from well beyond primary market area boundaries.
2. Demand Analysis
According to DCA’s demand methodology, all comparable units built or approved since the base year(2015) are to be subtracted from the demand estimates to arrive at net demand. Highland Estates isa senior independent living community (55+) that opened in July 2016. The community is comprisedof 84 units; of these units, 57 target senior householders earning at or below 60 percent AMI. These57 units are subtracted from demand estimates.
In order to test market conditions, we have calculated demand without PBV. The overall capture ratefor the subject property is 34.0 percent for the 60 percent AMI units (Table 34). High Rise SeniorApartments’ capture rate for the efficiency units is 18.7 percent; the capture rate for all one-bedroomunits is 52.9 percent; the capture rates for all two-bedroom units is 19.3 percent; and the capturerates for the three-bedroom unit is 7.6 percent. These capture rates for the one-bedroom units andfor the overall project exceed DCA’s mandated thresholds of 30 percent and indicate insufficientdemand to support the proposed rehabilitation without PBRA on all units.
With the inclusion of PBV, which eliminates the minimum income limit, capture rates are significantlylower at 2.3 percent for the efficiency units, 8.6 percent for the one-bedroom units, 1.1 percent forthe two-bedroom units, and 0.1 percent for the three-bedroom units. The overall capture rate for allproposed units with PBV is 11.2 percent. Accounting for tenant retention of 47 units, the demandcapture rates by floor plan with PBV are even lower, with an overall capture rate of 6.0 percent.
As all units at the subject property will have PBV and DCA market study guidelines indicate thatunits with PBV should not be included in demand capture rate calculations, the effective capturerate for the project is zero percent.
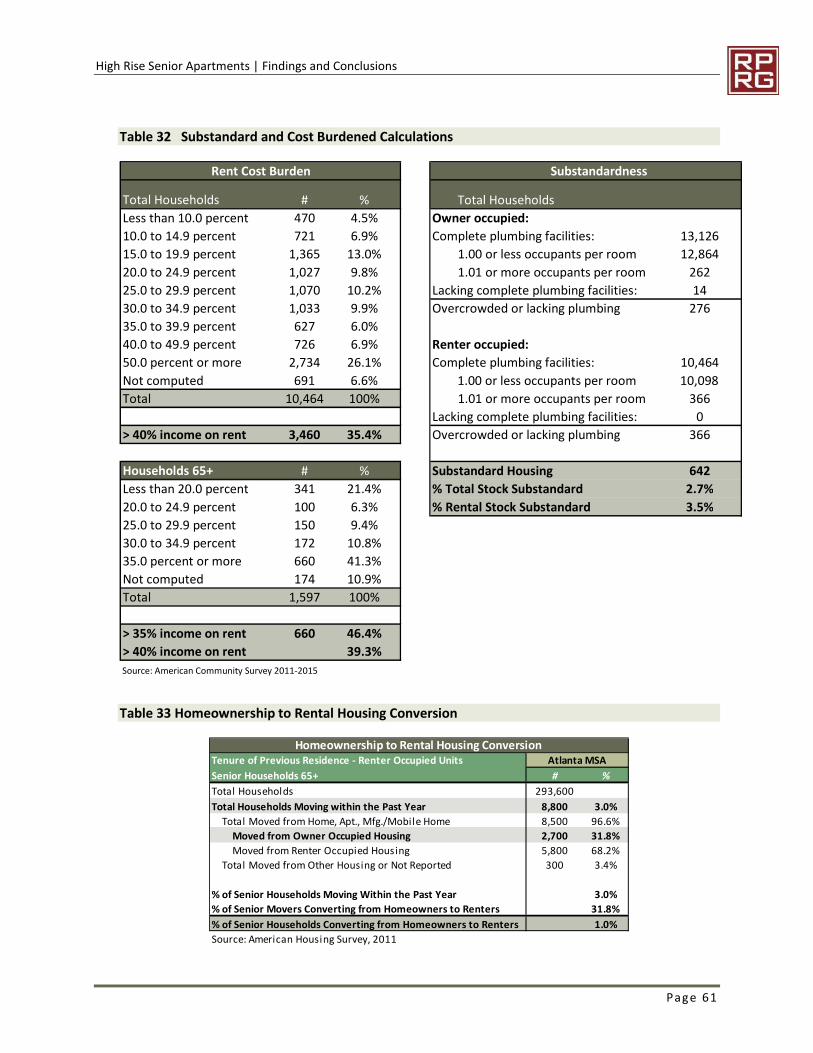
High Rise Senior Apartments | Findings and Conclusions
Page 61
Table 32 Substandard and Cost Burdened Calculations
Table 33 Homeownership to Rental Housing Conversion
Rent Cost Burden Substandardness
Total Households # % Total Households
Less than 10.0 percent 470 4.5% Owner occupied:
10.0 to 14.9 percent 721 6.9% Complete plumbing facilities: 13,126
15.0 to 19.9 percent 1,365 13.0% 1.00 or less occupants per room 12,864
20.0 to 24.9 percent 1,027 9.8% 1.01 or more occupants per room 262
25.0 to 29.9 percent 1,070 10.2% Lacking complete plumbing facilities: 14
30.0 to 34.9 percent 1,033 9.9% Overcrowded or lacking plumbing 276
35.0 to 39.9 percent 627 6.0%
40.0 to 49.9 percent 726 6.9% Renter occupied:
50.0 percent or more 2,734 26.1% Complete plumbing facilities: 10,464
Not computed 691 6.6% 1.00 or less occupants per room 10,098
Total 10,464 100% 1.01 or more occupants per room 366
Lacking complete plumbing facilities: 0
> 40% income on rent 3,460 35.4% Overcrowded or lacking plumbing 366
Households 65+ # % Substandard Housing 642
Less than 20.0 percent 341 21.4% % Total Stock Substandard 2.7%
20.0 to 24.9 percent 100 6.3% % Rental Stock Substandard 3.5%
25.0 to 29.9 percent 150 9.4%
30.0 to 34.9 percent 172 10.8%
35.0 percent or more 660 41.3%
Not computed 174 10.9%
Total 1,597 100%
> 35% income on rent 660 46.4%
> 40% income on rent 39.3%
Source: American Community Survey 2011-2015
Tenure of Previous Residence - Renter Occupied Units Atlanta MSA
Senior Households 65+ # %
Total Households 293,600
Total Households Moving within the Past Year 8,800 3.0%
Total Moved from Home, Apt., Mfg./Mobile Home 8,500 96.6%
Moved from Owner Occupied Housing 2,700 31.8%
Moved from Renter Occupied Housing 5,800 68.2%
Total Moved from Other Housing or Not Reported 300 3.4%
% of Senior Households Moving Within the Past Year 3.0%
% of Senior Movers Converting from Homeowners to Renters 31.8%
% of Senior Households Converting from Homeowners to Renters 1.0%
Source: American Housing Survey, 2011
Homeownership to Rental Housing Conversion
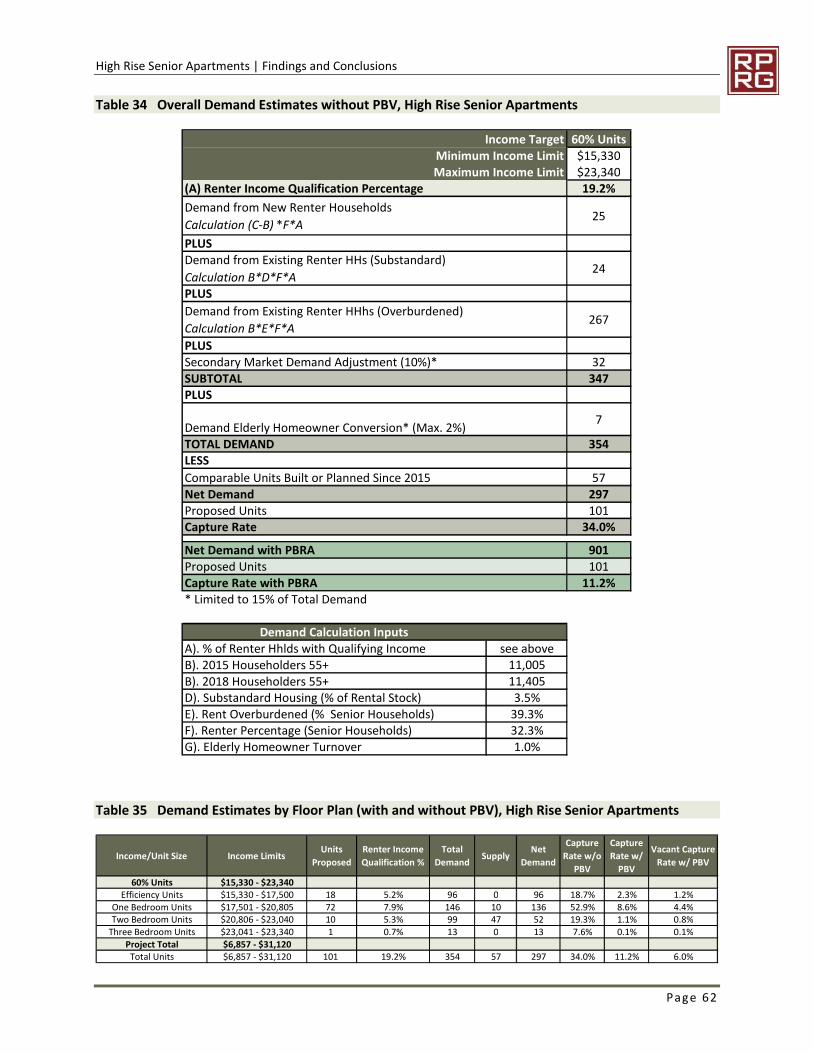
High Rise Senior Apartments | Findings and Conclusions
Page 62
Table 34 Overall Demand Estimates without PBV, High Rise Senior Apartments
Table 35 Demand Estimates by Floor Plan (with and without PBV), High Rise Senior Apartments
Income Target 60% UnitsMinimum Income Limit $15,330Maximum Income Limit $23,340
(A) Renter Income Qualification Percentage 19.2%
Demand from New Renter Households
Calculation (C-B) *F*A25
PLUSDemand from Existing Renter HHs (Substandard)
Calculation B*D*F*A24
PLUS
Demand from Existing Renter HHhs (Overburdened)
Calculation B*E*F*A267
PLUSSecondary Market Demand Adjustment (10%)* 32SUBTOTAL 347PLUS
Demand Elderly Homeowner Conversion* (Max. 2%)7
TOTAL DEMAND 354LESS
Comparable Units Built or Planned Since 2015 57Net Demand 297Proposed Units 101Capture Rate 34.0%
Net Demand with PBRA 901Proposed Units 101Capture Rate with PBRA 11.2%* Limited to 15% of Total Demand
Demand Calculation InputsA). % of Renter Hhlds with Qualifying Income see aboveB). 2015 Householders 55+ 11,005
B). 2018 Householders 55+ 11,405D). Substandard Housing (% of Rental Stock) 3.5%E). Rent Overburdened (% Senior Households) 39.3%F). Renter Percentage (Senior Households) 32.3%G). Elderly Homeowner Turnover 1.0%
Income/Unit Size Income LimitsUnits
Proposed
Renter Income
Qualification %
Total
DemandSupply
Net
Demand
Capture
Rate w/o
PBV
Capture
Rate w/
PBV
Vacant Capture
Rate w/ PBV
60% Units $15,330 - $23,340Efficiency Units $15,330 - $17,500 18 5.2% 96 0 96 18.7% 2.3% 1.2%
One Bedroom Units $17,501 - $20,805 72 7.9% 146 10 136 52.9% 8.6% 4.4%Two Bedroom Units $20,806 - $23,040 10 5.3% 99 47 52 19.3% 1.1% 0.8%
Three Bedroom Units $23,041 - $23,340 1 0.7% 13 0 13 7.6% 0.1% 0.1%Project Total $6,857 - $31,120
Total Units $6,857 - $31,120 101 19.2% 354 57 297 34.0% 11.2% 6.0%
High Rise Senior Apartments | Findings and Conclusions
Page 63
3. DCA Demand Conclusions
Capture rates (with and without PBV) are within DCA thresholds when accounting for tenantretention,. Furthermore, per DCA market study guidelines, units with PBV should not be included indemand capture rate calculations resulting in an effective capture rate of zero percent for the project.Capture rates are well above DCA’s threshold of 30 percent without PBRA on all the proposed units,indicating that PBV would need to be continued post rehabilitation in order to achieve the proposedrents and income targeting.
D. Target Markets
High Rise Senior Apartments will target low income senior renter households age 55 and older. Withthe majority of subject units being efficiency, one-, and two-bedroom floor plans, the subject propertywill primarily appeal to singles and couples. The subject will offer one three-bedroom unit which mayappeal to elderly households living in a roommate situation with an of-age friend or family member.
E. Product Evaluation
Considered in the context of the competitive environment, the relative position of High Rise SeniorApartments is as follows:
Site: The subject property is suitable for a rental housing development targeted to lowincome senior households as it is compatible with surrounding land uses and is convenient topublic transportation and community amenities within a short 0.2-mile walking distance. Onesenior center is about one-half mile of the site and a number of other recreationalparks/centers are within one mile of the subject. The subject property will also have excellentvisibility from major thoroughfares. As an existing deeply subsidized senior rental community,the proposed rehabilitation of the subject property will not alter the land use composition ofthe immediate area.
Unit Distribution: The proposed unit mix for 101-unit High Rise Senior Apartments includes18 efficiencies, 72 one-bedroom units, 10 two-bedroom units, and one three-bedroom unit.The emphasis on one-bedroom units is appropriate as 54.2 percent of surveyed senior rentalcommunities in the market area consist of one-bedroom units. Although the existing seniorrental communities in the High Rise Market Area have a greater proportion of two-bedroomunits at nearly 44 percent than efficiencies at 2 percent, the subject’s breakdown ofefficiencies and two-bedroom units is suitable since one- and two-person households accountfor roughly 58 percent of renters in the market area. The lone three-bedroom unit at thesubject will be the only senior LIHTC three-bedroom in the market area.
Unit Size: The unit sizes at High Rise Senior Apartments are 530 square feet for efficiencyunits, 720 square feet for one-bedroom units, 831 square feet for two-bedroom units, and927 square feet for the three-bedroom unit. The proposed efficiency size is 20 square feetsmaller than the average among senior units without PBV. The proposed one-bedroom unitsare nearly 50 square feet larger than the senior market average. The subject’s two-bedroomunits are about 100 square feet smaller than other senior two-bedroom units in the marketarea while the three-bedroom unit is comparable to those units. This is not a significantdifference and will have minimal impact on the subject property’s marketability due to theexistence of PBV on all proposed units. As such, we believe the proposed unit sizes areappropriate for the proposed rehabilitation.
Unit Features: In-unit features offered at the subject property will include a range/oven, arefrigerator, a dishwasher, a garbage disposal, a microwave, and grab bars. These unitfeatures are generally comparable to surveyed senior rental communities in the High RiseMarket Area and will be well received by the target market.
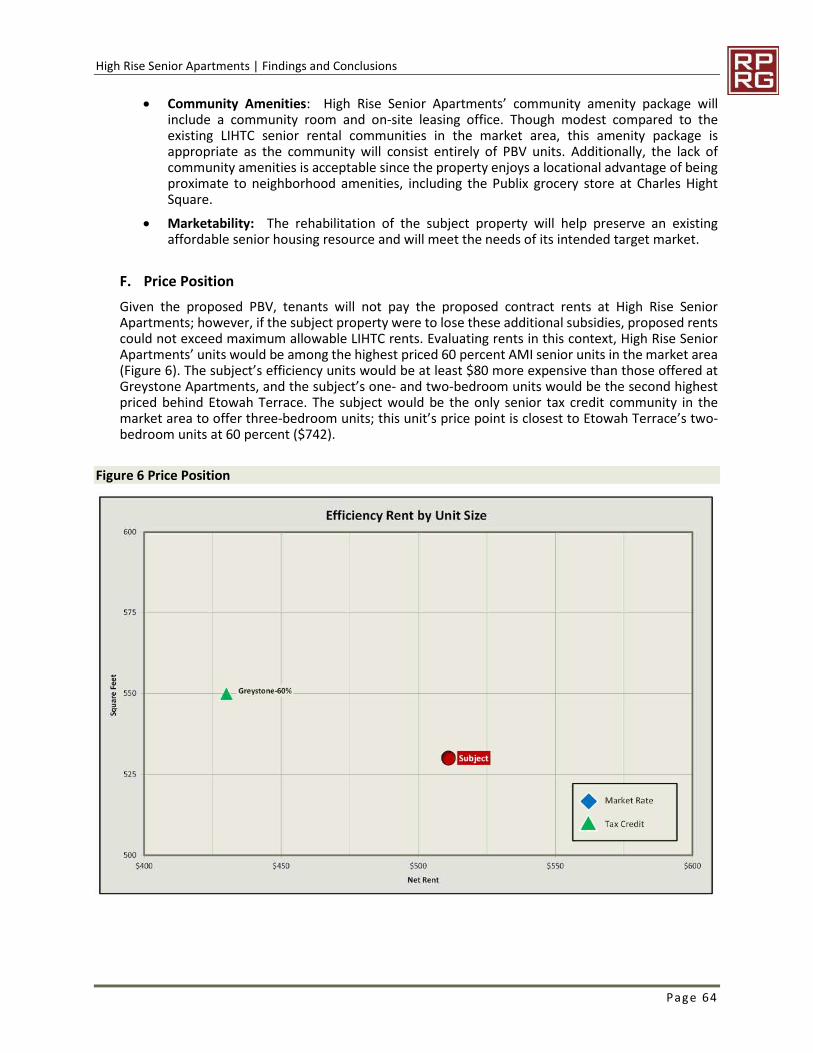
High Rise Senior Apartments | Findings and Conclusions
Page 64
Community Amenities: High Rise Senior Apartments’ community amenity package willinclude a community room and on-site leasing office. Though modest compared to theexisting LIHTC senior rental communities in the market area, this amenity package isappropriate as the community will consist entirely of PBV units. Additionally, the lack ofcommunity amenities is acceptable since the property enjoys a locational advantage of beingproximate to neighborhood amenities, including the Publix grocery store at Charles HightSquare.
Marketability: The rehabilitation of the subject property will help preserve an existingaffordable senior housing resource and will meet the needs of its intended target market.
F. Price Position
Given the proposed PBV, tenants will not pay the proposed contract rents at High Rise SeniorApartments; however, if the subject property were to lose these additional subsidies, proposed rentscould not exceed maximum allowable LIHTC rents. Evaluating rents in this context, High Rise SeniorApartments’ units would be among the highest priced 60 percent AMI senior units in the market area(Figure 6). The subject’s efficiency units would be at least $80 more expensive than those offered atGreystone Apartments, and the subject’s one- and two-bedroom units would be the second highestpriced behind Etowah Terrace. The subject would be the only senior tax credit community in themarket area to offer three-bedroom units; this unit’s price point is closest to Etowah Terrace’s two-bedroom units at 60 percent ($742).
Figure 6 Price Position
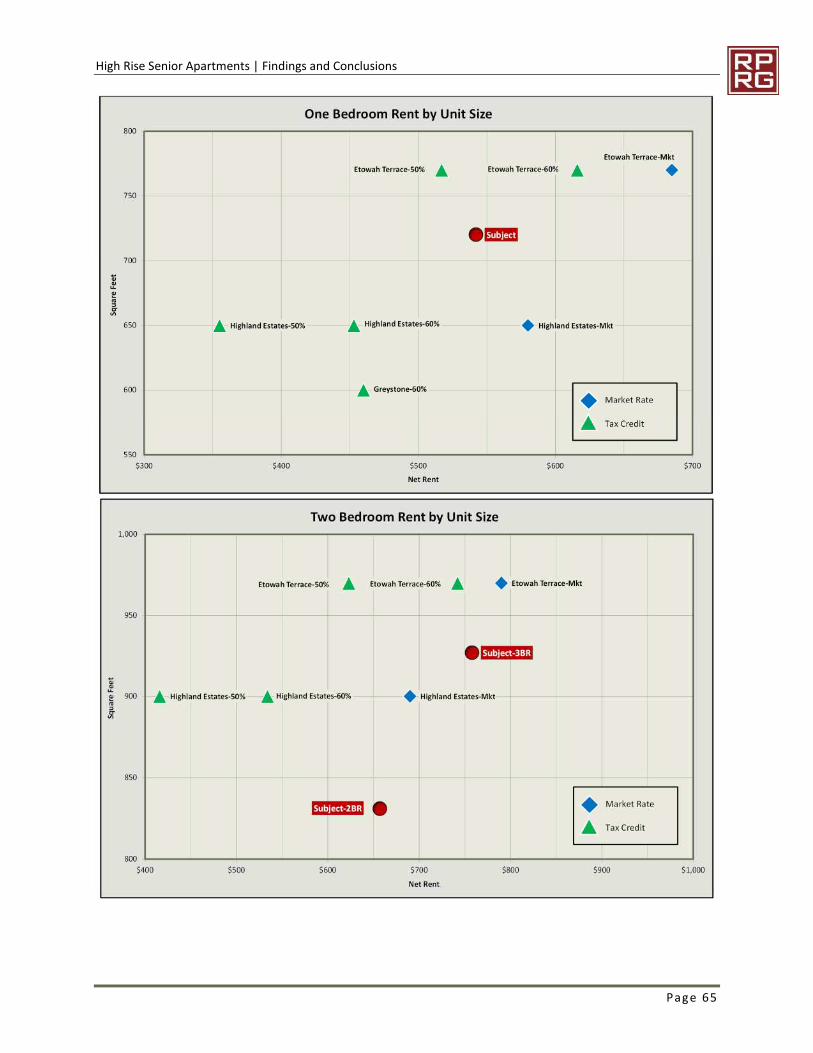
High Rise Senior Apartments | Findings and Conclusions
Page 65
High Rise Senior Apartments | Findings and Conclusions
Page 66
G. Absorption Estimate
One senior LIHTC rental community is currently undergoing initial lease-up. Highland Estates openedin July 2016, and as of April 2017, 12 of its 84 units were reported as vacant. This results in anabsorption pace of 8 units per month. Although the units at Highland Estates target elderly households(55+) who earn incomes at or below 60 percent AMI, none of its units have PBV. Since all 101 units atthe subject will have PBV, we will additionally consider the experiences at comparable rentalcommunities, the subject property’s projected absorption rate is based on projected senior householdgrowth, age and income-qualified renter households in the market area, demand estimates, rentalmarket conditions, and the marketability of the proposed site/product.
From 2017 and 2019, the market area is projected to add 122 households with householdersage 55+ per year, annual growth of 1.2 percent.
Accounting for PBV on all proposed units, over 1,800 renter households (62+) will be income-qualified for one or more units proposed at High Rise Senior Apartments by its placed-in-service year of 2018. The subject would only need to capture 5.6 percent of these age- andincome-qualified renter households in order to fill all 101 units.
Accounting for PBV, all DCA demand capture rates are within acceptable levels including anoverall capture rate of 28.7 percent. All units at the subject property will have PBV and DCAmarket study guidelines indicate that units with PBV should not be included in demandcapture rate calculations resulting in an effective demand capture rate of zero percent for thesubject property.
The senior rental market is performing very well with a 0.0 percent vacancy rate amongstabilized communities without PBV; this vacancy rate includes the 10 subsidized units atEtowah Terrace.
Post rehabilitation, High Rise Senior Apartments will offer an attractive and affordableproduct that will be well received by the target market in the High Rise Market Area.
Taking all of these market factors into account, we estimate High Rise Senior Apartments’ PBV unitswill lease-up as quickly as units become available and applications can be processed. We haveestimated the absorption at 16 units per month. Given the subject property is expected to retainabout 47 percent of its current tenants post rehabilitation, the subject property would reach astabilized occupancy of 93 percent in approximately three to four months. If all 101 units needed tobe leased, the subject property would reach a stabilized occupancy within six months.
H. Impact on Existing Market
Given the limited vacancies among both senior and general occupancy rental communities in the HighRise Market Area and projected senior household growth over the next two years, we do not expectthe rehabilitation of High Rise Senior Apartments to have a negative impact on existing rentalcommunities in the High Rise Market Area including those with tax credits. Furthermore, the subjectproperty is expected to retain 47 of its tenants post rehabilitation.
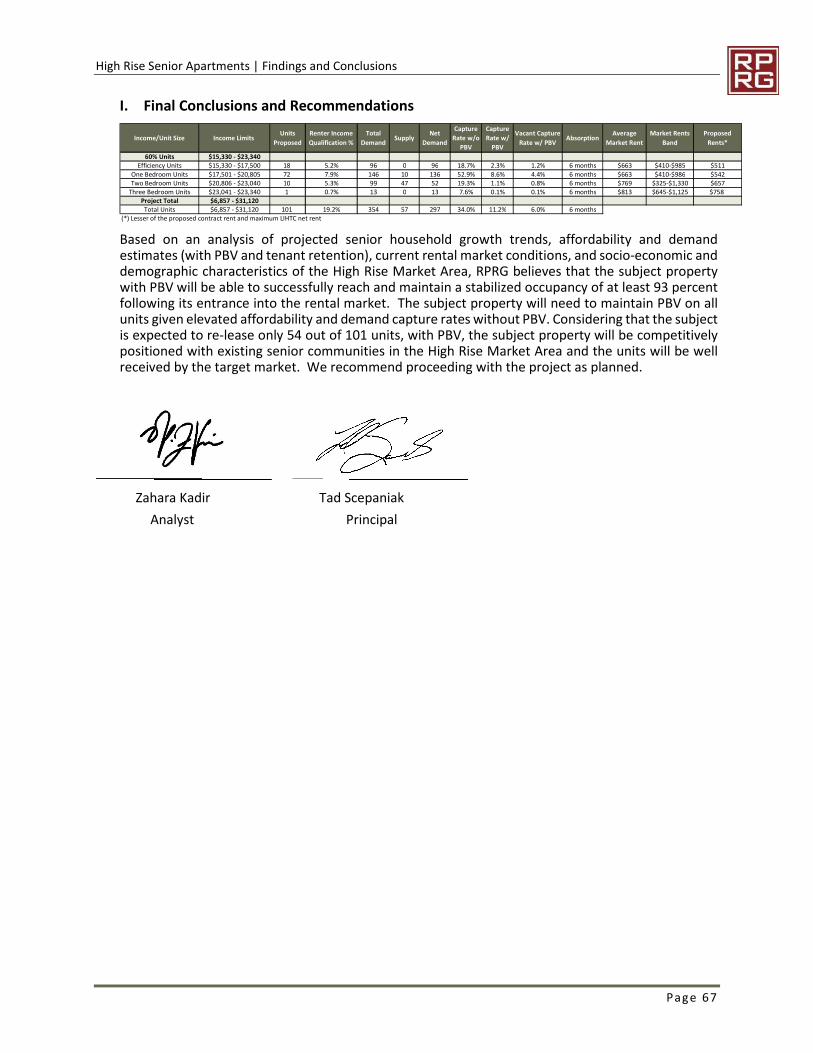
High Rise Senior Apartments | Findings and Conclusions
Page 67
I. Final Conclusions and Recommendations
Based on an analysis of projected senior household growth trends, affordability and demandestimates (with PBV and tenant retention), current rental market conditions, and socio-economic anddemographic characteristics of the High Rise Market Area, RPRG believes that the subject propertywith PBV will be able to successfully reach and maintain a stabilized occupancy of at least 93 percentfollowing its entrance into the rental market. The subject property will need to maintain PBV on allunits given elevated affordability and demand capture rates without PBV. Considering that the subjectis expected to re-lease only 54 out of 101 units, with PBV, the subject property will be competitivelypositioned with existing senior communities in the High Rise Market Area and the units will be wellreceived by the target market. We recommend proceeding with the project as planned.
Zahara Kadir Tad Scepaniak
Analyst Principal
Income/Unit Size Income LimitsUnits
Proposed
Renter Income
Qualification %
Total
DemandSupply
Net
Demand
Capture
Rate w/o
PBV
Capture
Rate w/
PBV
Vacant Capture
Rate w/ PBVAbsorption
Average
Market Rent
Market Rents
Band
Proposed
Rents*
60% Units $15,330 - $23,340Efficiency Units $15,330 - $17,500 18 5.2% 96 0 96 18.7% 2.3% 1.2% 6 months $663 $410-$985 $511
One Bedroom Units $17,501 - $20,805 72 7.9% 146 10 136 52.9% 8.6% 4.4% 6 months $663 $410-$986 $542Two Bedroom Units $20,806 - $23,040 10 5.3% 99 47 52 19.3% 1.1% 0.8% 6 months $769 $325-$1,330 $657
Three Bedroom Units $23,041 - $23,340 1 0.7% 13 0 13 7.6% 0.1% 0.1% 6 months $813 $645-$1,125 $758Project Total $6,857 - $31,120Total Units $6,857 - $31,120 101 19.2% 354 57 297 34.0% 11.2% 6.0% 6 months
(*) Lesser of the proposed contract rent and maximum LIHTC net rent
High Rise Senior Apartments | Appendix 1 Underlying Assumptions and Limiting Conditions
Page 68
9. APPENDIX 1 UNDERLYING ASSUMPTIONS AND LIMITINGCONDITIONS
In conducting the analysis, we will make the following assumptions, except as otherwise noted in ourreport:
1. There are no zoning, building, safety, environmental or other federal, state or local laws,regulations or codes which would prohibit or impair the development, marketing or operation of thesubject project in the manner contemplated in our report, and the subject project will be developed,marketed and operated in compliance with all applicable laws, regulations and codes.
2. No material changes will occur in (a) any federal, state or local law, regulation or code (including,without limitation, the Internal Revenue Code) affecting the subject project, or (b) any federal, stateor local grant, financing or other program which is to be utilized in connection with the subject project.
3. The local, national and international economies will not deteriorate, and there will be nosignificant changes in interest rates or in rates of inflation or deflation.
4. The subject project will be served by adequate transportation, utilities and governmentalfacilities.
5. The subject project will not be subjected to any war, energy crisis, embargo, strike, earthquake,flood, fire or other casualty or act of God.
6. The subject project will be on the market at the time and with the product anticipated in ourreport, and at the price position specified in our report.
7. The subject project will be developed, marketed and operated in a highly professional manner.
8. No projects will be developed which will be in competition with the subject project, except as setforth in our report.
9. There are neither existing judgments nor any pending or threatened litigation, which could hinderthe development, marketing or operation of the subject project.
High Rise Senior Apartments | Appendix 1 Underlying Assumptions and Limiting Conditions
Page 69
The analysis will be subject to the following limiting conditions, except as otherwise noted in ourreport:
1. The analysis contained in this report necessarily incorporates numerous estimates andassumptions with respect to property performance, general and local business and economicconditions, the absence of material changes in the competitive environment and other matters. Someestimates or assumptions, however, inevitably will not materialize, and unanticipated events andcircumstances may occur; therefore, actual results achieved during the period covered by our analysiswill vary from our estimates and the variations may be material.
2. Our absorption estimates are based on the assumption that the product recommendations setforth in our report will be followed without material deviation.
3. All estimates of future dollar amounts are based on the current value of the dollar, without anyallowance for inflation or deflation.
4. We have no responsibility for considerations requiring expertise in other fields. Suchconsiderations include, but are not limited to, legal matters, environmental matters, architecturalmatters, geologic considerations, such as soils and seismic stability, and civil, mechanical, electrical,structural and other engineering matters.
5. Information, estimates and opinions contained in or referred to in our report, which we haveobtained from sources outside of this office, are assumed to be reliable and have not beenindependently verified.
6. The conclusions and recommendations in our report are subject to these Underlying Assumptionsand Limiting Conditions and to any additional assumptions or conditions set forth in the body of ourreport.
High Rise Senior Apartments | Appendix 2 Analyst Certifications
Page 70
10. APPENDIX 2 ANALYST CERTIFICATIONS
I certify that, to the best of my knowledge and belief:
The statements of fact contained in this report are true and correct.
The reported analyses, opinions, and conclusions are limited only by the reportedassumptions and limiting conditions, and is my personal, unbiased professional analyses,opinions, and conclusions.
I have no present or prospective interest in the property that is the subject of this report,and I have no personal interest or bias with respect to the parties involved.
My compensation is not contingent on an action or event resulting from the analysis,opinions, or conclusions in, or the use of, this report.
The market study was not based on tax credit approval or approval of a loan. Mycompensation is not contingent upon the reporting of a predetermined demand thatfavors the cause of the client, the attainment of a stipulated result, or the occurrence ofa subsequent event.
My analyses, opinions, and conclusions were developed, and this report has beenprepared, in conformity with the requirements of the Code of Professional Ethics and theStandards of Professional Practice as set forth in the Uniform Standards of ProfessionalAppraisal Practice (USPAP) as adopted by the Appraisal Standards Board of the AppraisalFoundation.
To the best of my knowledge, the market can support the proposed project as shown inthe study. I understand that any misrepresentation of this statement may result in thedenial of further participation in DCA’s rental housing programs.
DCA may rely on the representation made in the market study provided and thisdocument is assignable to other lenders that are parties to the DCA loan transaction.
__________________
Zahara Kadir Tad Scepaniak
Analyst Principal
Real Property Research Group, Inc. Real Property Research Group, Inc.
Warning: Title 18 U.S.C. 1001, provides in part that whoever knowingly and willfully makes or uses a document containing
any false, fictitious, or fraudulent statement or entry, in any manner in the jurisdiction of any department or agency of the
United States, shall be fined not more than $10,000 or imprisoned for not more than five years or both.
High Rise Senior Apartments | Appendix 3 NCHMA Certification
Page 71
11. APPENDIX 3 NCHMA CERTIFICATION
This market study has been prepared by Real Property Research Group, Inc., a member in goodstanding of the National Council of Housing Market Analysts (NCHMA). This study has been prepared inconformance with the standards adopted by NCHMA for the market analysts’ industry. These standardsinclude the Standard Definitions of Key Terms Used in Market Studies for Affordable Housing Projects andModel Content Standards for the Content of Market Studies for Affordable Housing Projects. TheseStandards are designed to enhance the quality of market studies and to make them easier to prepare,understand, and use by market analysts and by the end users. These Standards are voluntary only, and nolegal responsibility regarding their use is assumed by the National Council of Housing Market Analysts.
Real Property Research Group, Inc. is duly qualified and experienced in providing market analysisfor Affordable Housing. The company’s principals participate in NCHMA educational and informationsharing programs to maintain the highest professional standards and state-of-the-art knowledge. RealProperty Research Group, Inc. is an independent market analyst. No principal or employee of RealProperty Research Group, Inc. has any financial interest whatsoever in the development for which thisanalysis has been undertaken.
While the document specifies Real Property Research Group, Inc., the certification is alwayssigned by the individual completing the study and attesting to the certification.
Real Property Research Group, Inc.
____ Tad Scepaniak___ _Name
_ __ Principal___ _Title
_________April 5, 2017_______
Date
High Rise Senior Apartments | Appendix 4 Analyst Resumes
Page 72
12. APPENDIX 4 ANALYST RESUMES
ROBERT M. LEFENFELD
Mr. Lefenfeld is the Managing Principal of the firm with over 30 years of experience in the field ofresidential market research. Before founding Real Property Research Group in February, 2001, Bobserved as an officer of research subsidiaries of the accounting firm of Reznick Fedder & Silverman andLegg Mason. Between 1998 and 2001, Bob was Managing Director of RF&S Realty Advisors,conducting market studies throughout the United States on rental and for sale projects. From 1987to 1995, Bob served as Senior Vice President of Legg Mason Realty Group, managing the firm’sconsulting practice and serving as publisher of a Mid-Atlantic residential data service, Housing MarketProfiles. Prior to joining Legg Mason, Bob spent ten years with the Baltimore Metropolitan Council asa housing economist. Bob also served as Research Director for Regency Homes between 1995 and1998, analyzing markets throughout the Eastern United States and evaluating the company’s activebuilding operation.
Bob oversees the execution and completion of all of the firm’s research assignments, ranging from astrategic assessment of new development and building opportunities throughout a region to thedevelopment and refinement of a particular product on a specific site. He combines extensiveexperience in the real estate industry with capabilities in database development and informationmanagement. Over the years, he has developed a series of information products and proprietarydatabases serving real estate professionals.
Bob has lectured and written extensively on the subject of residential real estate market analysis. Hehas served as a panel member, speaker, and lecturer at events held by the National Association ofHomebuilders, the National Council on Seniors’ Housing and various local homebuilder associations.Bob serves as a visiting professor for the Graduate Programs in Real Estate Development, School ofArchitecture, Planning and Preservation, University of Maryland College Park. He has served asNational Chair of the National Council of Affordable Housing Market Analysts (NCAHMA) and iscurrently a board member of the Baltimore chapter of Lambda Alpha Land Economics Society.
Areas of Concentration:
Strategic Assessments: Mr. Lefenfeld has conducted numerous corridor analyses throughout theUnited States to assist building and real estate companies in evaluating development opportunities.Such analyses document demographic, economic, competitive, and proposed development activityby submarket and discuss opportunities for development.
Feasibility Analysis: Mr. Lefenfeld has conducted feasibility studies for various types of residentialdevelopments for builders and developers. Subjects for these analyses have included for-sale single-family and townhouse developments, age-restricted rental and for-sale developments, large multi-product PUDs, urban renovations and continuing care facilities for the elderly.
Information Products: Bob has developed a series of proprietary databases to assist clients inmonitoring growth trends. Subjects of these databases have included for sale housing, pipelineinformation, and rental communities. Information compiled is committed to a GeographicInformation System (GIS), facilitating the comprehensive integration of data.
Education:Master of Urban and Regional Planning; The George Washington University.Bachelor of Arts - Political Science; Northeastern University.
High Rise Senior Apartments | Appendix 4 Analyst Resumes
Page 73
TAD SCEPANIAK
Tad Scepaniak directs the Atlanta office of Real Property Research Group and leads the firm’saffordable housing practice. Tad directs the firm’s efforts in the southeast and south central UnitedStates and has worked extensively in North Carolina, South Carolina, Georgia, Florida, Tennessee,Iowa, and Michigan. He specializes in the preparation of market feasibility studies for rental housingcommunities, including market-rate apartments developed under the HUD 221(d)(4) program andaffordable housing built under the Low-Income Housing Tax Credit program. Along with work fordeveloper clients, Tad is the key contact for research contracts with the North Carolina, SouthCarolina, Georgia, Michigan, and Iowa Housing Finance agencies. Tad is also responsible fordevelopment and implementation of many of the firm’s automated systems.
Tad is Vice Chair of the National Council of Housing Market Analysts (NCHMA) and previously servedas the Co-Chair of Standards Committee. He has taken a lead role in the development of theorganization's Standard Definitions and Recommended Market Study Content, and he has authoredand co-authored white papers on market areas, derivation of market rents, and selection ofcomparable properties. Tad is also a founding member of the Atlanta chapter of the Lambda AlphaLand Economics Society.
Areas of Concentration:
Low Income Tax Credit Rental Housing: Mr. Scepaniak has worked extensively with the Low IncomeTax Credit program throughout the United States, with special emphasis on the Southeast and Mid-Atlantic regions.
Senior Housing: Mr. Scepaniak has conducted feasibility analysis for a variety of senior oriented rentalhousing. The majority of this work has been under the Low Income Tax Credit program; however hisexperience includes assisted living facilities and market rate senior rental communities.
Market Rate Rental Housing: Mr. Scepaniak has conducted various projects for developers of marketrate rental housing. The studies produced for these developers are generally used to determine therental housing needs of a specific submarket and to obtain financing.
Public Housing Authority Consultation: Tad has worked with Housing Authorities throughout theUnited States to document trends rental and for sale housing market trends to better understandredevelopment opportunities. He has completed studies examining development opportunities forhousing authorities through the Choice Neighborhood Initiative or other programs in Florida, Georgia,North Carolina, South Carolina, Texas and Tennessee.
Education:Bachelor of Science – Marketing; Berry College – Rome, Georgia
High Rise Senior Apartments | Appendix 4 Analyst Resumes
Page 74
ZAHARA KADIR
Zahara Kadir joined Real Property Research Group (RPRG) as a Research Associate in 2015. During thattime, she gathered economic, demographic, and competitive data for market feasibility analyses. In2016, she was promoted to analyst, conducting market feasibility analyses for a variety of rentalproducts in the Mid Atlantic United States.
Prior to joining RPRG, Zahara served as a finance intern at Modus Hotels in Washington, DC whereshe collected competitive data and assisted in the analysis of pricing and sales forecasting. Hereducational background consists of coursework in statistical analysis, economic demography,business and technical writing as well as environmental engineering.
Areas of Concentration:
Market Rate Rental Housing: Zahara has worked on projects for lenders and developers of marketrate rental housing including those compliant with HUD MAP guidelines under the FHA 221(d)(4)program.
Low Income Tax Credit: Zahara has prepared rental market studies for submission to lenders andstate agencies for nine percent and four percent Low Income Housing Tax Credit allocations. Studiesinclude analysis of new construction product as well as the feasibility of renovating existing familyrental communities.
Education:Bachelor of Science – Economics; Penn State University, University Park, PA
High Rise Senior Apartments | Appendix 5 DCA Checklist
Page 75
13. APPENDIX 5 DCA CHECKLIST
I understand that by initializing (or checking) the following items, I am stating that those items are includedand/or addressed in the report. If an item is not checked, a full explanation is included in the report. Alist listing of page number(s) is equivalent to check or initializing.
The report was written according to DCA's market study requirements, that the information included isaccurate and that the report can be relied upon by DCA as a true assessment of the low-income housingrental market.
I also certify that I have inspected the subject property as well as all rent comparables.
Signed: Date: April 5, 2017
Zahara Kadir
A. Executive Summary
1. Project Description:
i. Brief description of the project location including address and/or position
relative to the closest cross-street..........................................................................................Page(s) 16
ii. Construction and Occupancy Types ......................................................................................Page(s) 10
iii. Unit mix, including bedrooms, bathrooms, square footage, Income targeting,
rents, and utility allowance .....................................................................................................Page(s) 11
iv. Any additional subsidies available, including project based Voucher (PBV).........................Page(s) 10
v. Brief description of proposed amenities and how they compare with existing
properties ...............................................................................................................................Page(s) 45
2. Site Description/Evaluation:
i. A brief description of physical features of the site and adjacent parcels................................Page(s) 21
ii. A brief overview of the neighborhood land composition (residential,
commercial, industrial, agricultural)........................................................................................Page(s) 20
iii. A discussion of site access and visibility ..........................................................................Page(s) 21, 21
iv. Any significant positive or negative aspects of the subject site..............................................Page(s) 25
v. A brief summary of the site’s proximity to neighborhood services including
shopping, medical care, employment concentrations, public transportation, etc ...................Page(s) 22
vi. An overall conclusion of the site’s appropriateness for the proposed
development...........................................................................................................................Page(s) 25
3. Market Area Definition:
i. A brief definition of the primary market area (PMA) including boundaries and
their approximate distance from the subject site ...................................................................Page(s) 26
4. Community Demographic Data:
i. Current and projected household and population counts for the PMA...................................Page(s) 34
ii. Household tenure including any trends in rental rates. ..........................................................Page(s) 38
iii. Household income level. ........................................................................................................Page(s) 40
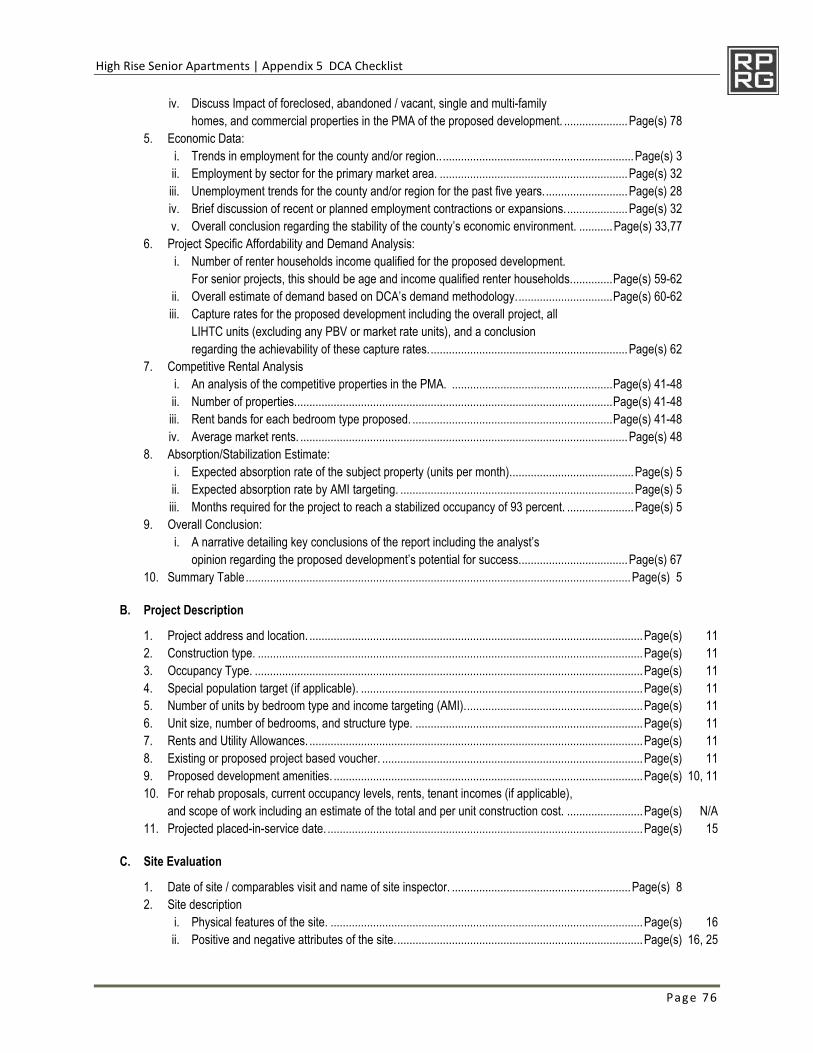
High Rise Senior Apartments | Appendix 5 DCA Checklist
Page 76
iv. Discuss Impact of foreclosed, abandoned / vacant, single and multi-family
homes, and commercial properties in the PMA of the proposed development. .....................Page(s) 78
5. Economic Data:
i. Trends in employment for the county and/or region.................................................................Page(s) 3
ii. Employment by sector for the primary market area. ..............................................................Page(s) 32
iii. Unemployment trends for the county and/or region for the past five years............................Page(s) 28
iv. Brief discussion of recent or planned employment contractions or expansions.....................Page(s) 32
v. Overall conclusion regarding the stability of the county’s economic environment. ...........Page(s) 33,77
6. Project Specific Affordability and Demand Analysis:
i. Number of renter households income qualified for the proposed development.
For senior projects, this should be age and income qualified renter households..............Page(s) 59-62
ii. Overall estimate of demand based on DCA’s demand methodology................................Page(s) 60-62
iii. Capture rates for the proposed development including the overall project, all
LIHTC units (excluding any PBV or market rate units), and a conclusion
regarding the achievability of these capture rates..................................................................Page(s) 62
7. Competitive Rental Analysis
i. An analysis of the competitive properties in the PMA. .....................................................Page(s) 41-48
ii. Number of properties.........................................................................................................Page(s) 41-48
iii. Rent bands for each bedroom type proposed. ..................................................................Page(s) 41-48
iv. Average market rents. ............................................................................................................Page(s) 48
8. Absorption/Stabilization Estimate:
i. Expected absorption rate of the subject property (units per month).........................................Page(s) 5
ii. Expected absorption rate by AMI targeting. .............................................................................Page(s) 5
iii. Months required for the project to reach a stabilized occupancy of 93 percent. ......................Page(s) 5
9. Overall Conclusion:
i. A narrative detailing key conclusions of the report including the analyst’s
opinion regarding the proposed development’s potential for success....................................Page(s) 67
10. Summary Table...............................................................................................................................Page(s) 5
B. Project Description
1. Project address and location. ..............................................................................................................Page(s) 11
2. Construction type. ...............................................................................................................................Page(s) 11
3. Occupancy Type. ................................................................................................................................Page(s) 11
4. Special population target (if applicable). .............................................................................................Page(s) 11
5. Number of units by bedroom type and income targeting (AMI)...........................................................Page(s) 11
6. Unit size, number of bedrooms, and structure type. ...........................................................................Page(s) 11
7. Rents and Utility Allowances. ..............................................................................................................Page(s) 11
8. Existing or proposed project based voucher. ......................................................................................Page(s) 11
9. Proposed development amenities. ......................................................................................................Page(s) 10, 11
10. For rehab proposals, current occupancy levels, rents, tenant incomes (if applicable),
and scope of work including an estimate of the total and per unit construction cost. .........................Page(s) N/A
11. Projected placed-in-service date. ........................................................................................................Page(s) 15
C. Site Evaluation
1. Date of site / comparables visit and name of site inspector. ...........................................................Page(s) 8
2. Site description
i. Physical features of the site. .......................................................................................................Page(s) 16
ii. Positive and negative attributes of the site..................................................................................Page(s) 16, 25
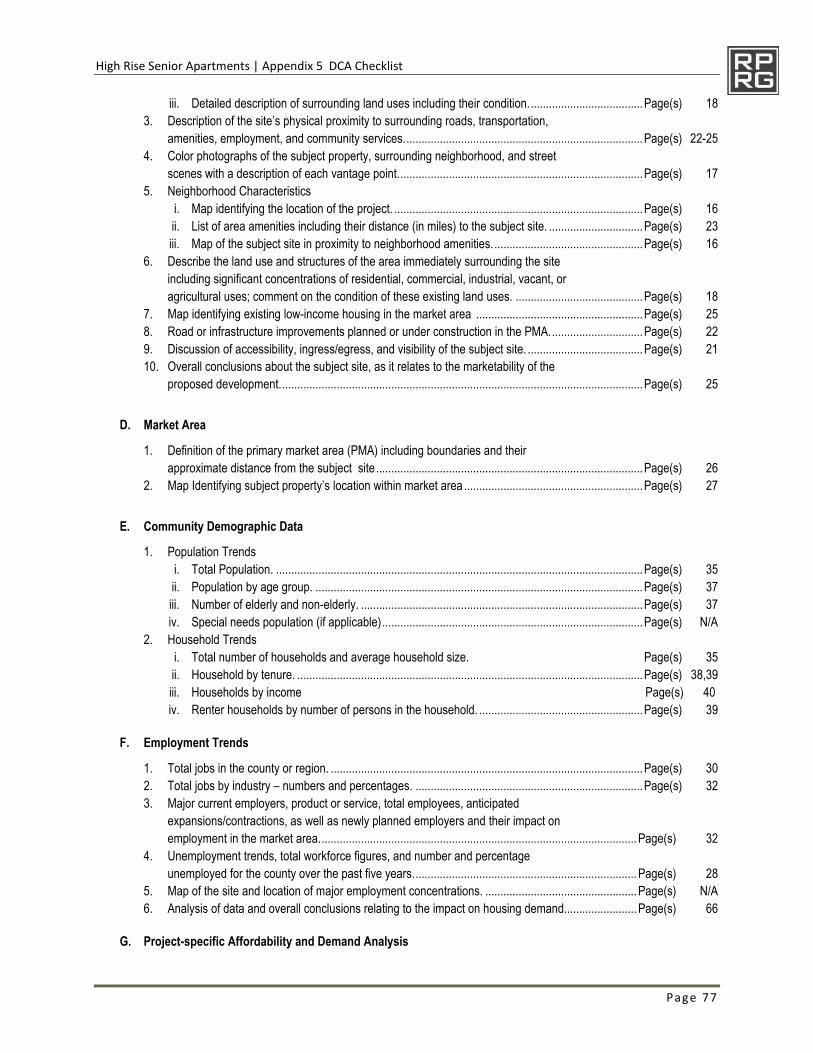
High Rise Senior Apartments | Appendix 5 DCA Checklist
Page 77
iii. Detailed description of surrounding land uses including their condition......................................Page(s) 18
3. Description of the site’s physical proximity to surrounding roads, transportation,
amenities, employment, and community services...............................................................................Page(s) 22-25
4. Color photographs of the subject property, surrounding neighborhood, and street
scenes with a description of each vantage point.................................................................................Page(s) 17
5. Neighborhood Characteristics
i. Map identifying the location of the project. ..................................................................................Page(s) 16
ii. List of area amenities including their distance (in miles) to the subject site. ...............................Page(s) 23
iii. Map of the subject site in proximity to neighborhood amenities..................................................Page(s) 16
6. Describe the land use and structures of the area immediately surrounding the site
including significant concentrations of residential, commercial, industrial, vacant, or
agricultural uses; comment on the condition of these existing land uses. ..........................................Page(s) 18
7. Map identifying existing low-income housing in the market area .......................................................Page(s) 25
8. Road or infrastructure improvements planned or under construction in the PMA...............................Page(s) 22
9. Discussion of accessibility, ingress/egress, and visibility of the subject site. ......................................Page(s) 21
10. Overall conclusions about the subject site, as it relates to the marketability of the
proposed development........................................................................................................................Page(s) 25
D. Market Area
1. Definition of the primary market area (PMA) including boundaries and their
approximate distance from the subject site........................................................................................Page(s) 26
2. Map Identifying subject property’s location within market area ...........................................................Page(s) 27
E. Community Demographic Data
1. Population Trends
i. Total Population. .........................................................................................................................Page(s) 35
ii. Population by age group. ............................................................................................................Page(s) 37
iii. Number of elderly and non-elderly. .............................................................................................Page(s) 37
iv. Special needs population (if applicable)......................................................................................Page(s) N/A
2. Household Trends
i. Total number of households and average household size. Page(s) 35
ii. Household by tenure. ..................................................................................................................Page(s) 38,39
iii. Households by income Page(s) 40
iv. Renter households by number of persons in the household. ......................................................Page(s) 39
F. Employment Trends
1. Total jobs in the county or region. .......................................................................................................Page(s) 30
2. Total jobs by industry – numbers and percentages. ...........................................................................Page(s) 32
3. Major current employers, product or service, total employees, anticipated
expansions/contractions, as well as newly planned employers and their impact on
employment in the market area.........................................................................................................Page(s) 32
4. Unemployment trends, total workforce figures, and number and percentage
unemployed for the county over the past five years..........................................................................Page(s) 28
5. Map of the site and location of major employment concentrations. ..................................................Page(s) N/A
6. Analysis of data and overall conclusions relating to the impact on housing demand........................Page(s) 66
G. Project-specific Affordability and Demand Analysis
High Rise Senior Apartments | Appendix 5 DCA Checklist
Page 78
1. Income Restrictions / Limits. .............................................................................................................Page(s) 56, 57
2. Affordability estimates. ...........................................................................................................Page(s) 56-59
3. Components of Demand
i. Demand from new households..................................................................................................Page(s) 59-62
ii. Demand from existing households. ...........................................................................................Page(s) 59-62
iii. Elderly Homeowners likely to convert to rentership. .................................................................Page(s) 59-62
iv. Other sources of demand (if applicable). Page(s) N/A
4. Net Demand, Capture Rate, and Stabilization Calculations
i. Net demand
1. By AMI Level .......................................................................................................................Page(s) 62
2. By floor plan ........................................................................................................................Page(s) 62
ii. Capture rates
1. By AMI level ........................................................................................................................Page(s) 62
2. By floor plan ........................................................................................................................Page(s) 62
5. Capture rate analysis chart .................................................................................................................Page(s) 62
6. Detailed project information for each competitive rental community surveyed
i. Charts summarizing competitive data including a comparison of the proposed
project’s rents, square footage, amenities, to comparable rental communities in
the market area. ........................................................................................................................Page(s) 43-48
7. Additional rental market information
i. An analysis of voucher and certificates available in the market area..........................................Page(s) 50
ii. Lease-up history of competitive developments in the market area. ............................................Page(s) 44,
iii. Tenant profile and waiting list of existing phase (if applicable) ...................................................Page(s) N/A
iv. Competitive data for single-family rentals, mobile homes, etc. in rural areas if
lacking sufficient comparables (if applicable). .............................................................................Page(s) N/A
8. Map showing competitive projects in relation to the subject property. Page(s) 44, 47
9. Description of proposed amenities for the subject property and assessment of
quality and compatibility with competitive rental communities. ...........................................................Page(s) 45
10. For senior communities, an overview / evaluation of family properties in the PMA. ...........................Page(s) 46
11. Subject property’s long-term impact on competitive rental communities in the PMA..........................Page(s) 66
12. Competitive units planned or under construction the market area
i. Name, address/location, owner, number of units, configuration, rent structure,
estimated date of market entry, and any other relevant information. ..........................................Page(s) 49
13. Narrative or chart discussing how competitive properties compare with the proposed
development with respect to total units, rents, occupancy, location, etc.............................................Page(s) 63
i. Average market rent and rent advantage....................................................................................Page(s) 49
14. Discussion of demand as it relates to the subject property and all comparable DCA
funded projects in the market area......................................................................................................Page(s) 59-63
15. Rental trends in the PMA for the last five years including average occupancy trends
and projection for the next two years. ..........................................................................................Page(s) N/A
16. Impact of foreclosed, abandoned, and vacant single and multi-family homes as well
commercial properties in the market area. ..........................................................................................Page(s) 78
17. Discussion of primary housing voids in the PMA as they relate to the subject property. ....................Page(s) N/A
H. Absorption and Stabilization Rates
1. Anticipated absorption rate of the subject property.............................................................................Page(s) 66
2. Stabilization period. .............................................................................................................................Page(s) 66
I. Interviews..............................................................................................................................................Page(s) 49
High Rise Senior Apartments | Appendix 5 DCA Checklist
Page 79
J. Conclusions and Recommendations
1. Conclusion as to the impact of the subject property on PMA..............................................................Page(s) 66
2. Recommendation as the subject property’s viability in PMA...............................................................Page(s) 67
K. Signed Statement Requirements.............................................................................................................Page(s) App.
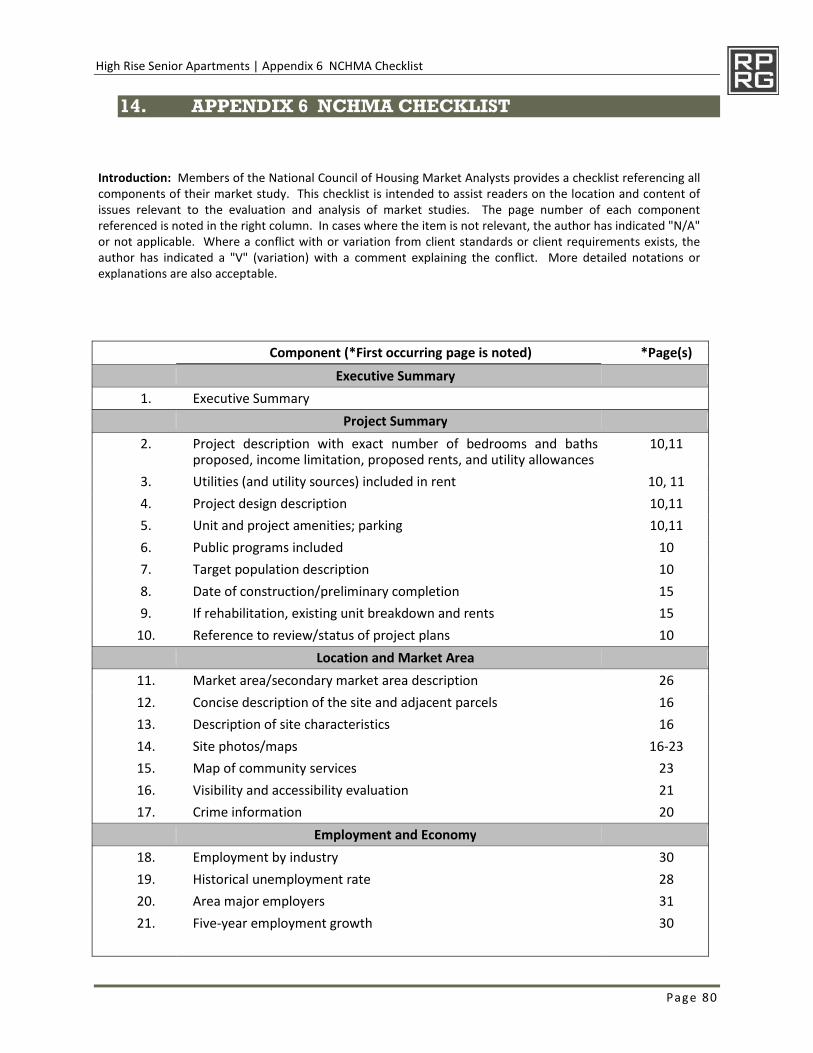
High Rise Senior Apartments | Appendix 6 NCHMA Checklist
Page 80
14. APPENDIX 6 NCHMA CHECKLIST
Introduction: Members of the National Council of Housing Market Analysts provides a checklist referencing allcomponents of their market study. This checklist is intended to assist readers on the location and content ofissues relevant to the evaluation and analysis of market studies. The page number of each componentreferenced is noted in the right column. In cases where the item is not relevant, the author has indicated "N/A"or not applicable. Where a conflict with or variation from client standards or client requirements exists, theauthor has indicated a "V" (variation) with a comment explaining the conflict. More detailed notations orexplanations are also acceptable.
Component (*First occurring page is noted) *Page(s)
Executive Summary
1. Executive Summary
Project Summary
2. Project description with exact number of bedrooms and bathsproposed, income limitation, proposed rents, and utility allowances
10,11
3. Utilities (and utility sources) included in rent 10, 11
4. Project design description 10,11
5. Unit and project amenities; parking 10,11
6. Public programs included 10
7. Target population description 10
8. Date of construction/preliminary completion 15
9. If rehabilitation, existing unit breakdown and rents 15
10. Reference to review/status of project plans 10
Location and Market Area
11. Market area/secondary market area description 26
12. Concise description of the site and adjacent parcels 16
13. Description of site characteristics 16
14. Site photos/maps 16-23
15. Map of community services 23
16. Visibility and accessibility evaluation 21
17. Crime information 20
Employment and Economy
18. Employment by industry 30
19. Historical unemployment rate 28
20. Area major employers 31
21. Five-year employment growth 30
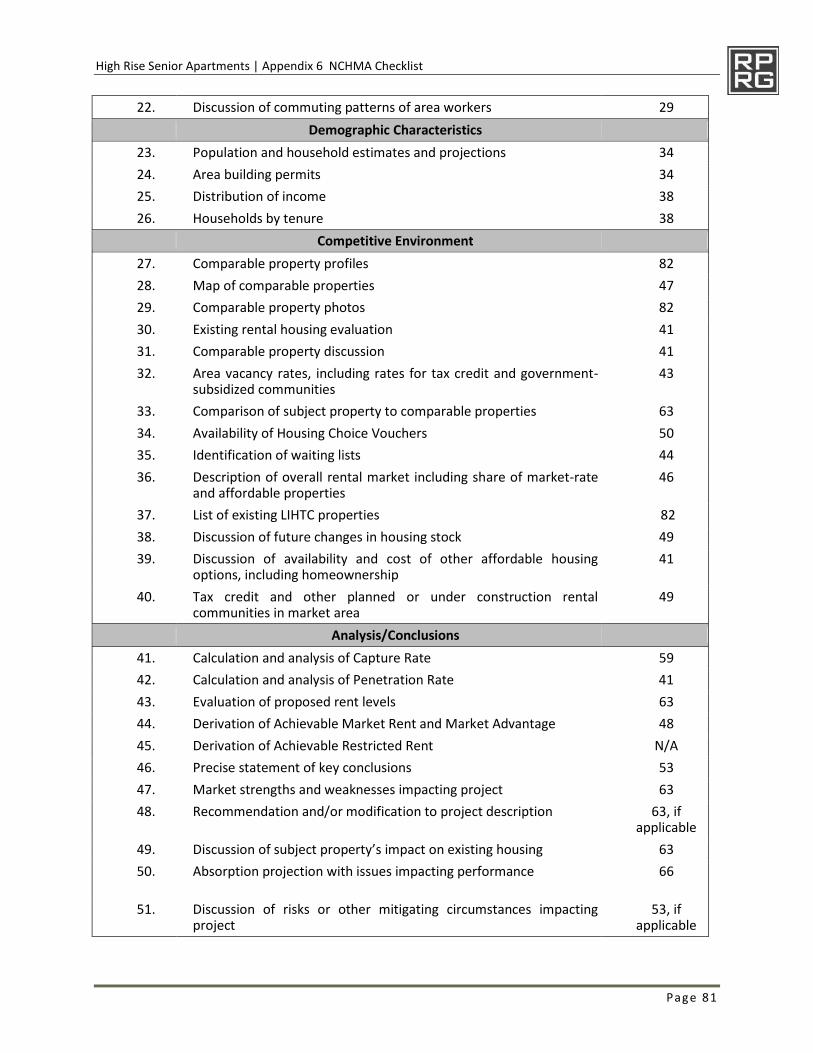
High Rise Senior Apartments | Appendix 6 NCHMA Checklist
Page 81
22. Discussion of commuting patterns of area workers 29
Demographic Characteristics
23. Population and household estimates and projections 34
24. Area building permits 34
25. Distribution of income 38
26. Households by tenure 38
Competitive Environment
27. Comparable property profiles 82
28. Map of comparable properties 47
29. Comparable property photos 82
30. Existing rental housing evaluation 41
31. Comparable property discussion 41
32. Area vacancy rates, including rates for tax credit and government-subsidized communities
43
33. Comparison of subject property to comparable properties 63
34. Availability of Housing Choice Vouchers 50
35. Identification of waiting lists 44
36. Description of overall rental market including share of market-rateand affordable properties
46
37. List of existing LIHTC properties 82
38. Discussion of future changes in housing stock 49
39. Discussion of availability and cost of other affordable housingoptions, including homeownership
41
40. Tax credit and other planned or under construction rentalcommunities in market area
49
Analysis/Conclusions
41. Calculation and analysis of Capture Rate 59
42. Calculation and analysis of Penetration Rate 41
43. Evaluation of proposed rent levels 63
44. Derivation of Achievable Market Rent and Market Advantage 48
45. Derivation of Achievable Restricted Rent N/A
46. Precise statement of key conclusions 53
47. Market strengths and weaknesses impacting project 63
48. Recommendation and/or modification to project description 63, ifapplicable
49. Discussion of subject property’s impact on existing housing 63
50. Absorption projection with issues impacting performance 66
51. Discussion of risks or other mitigating circumstances impactingproject
53, ifapplicable
High Rise Senior Apartments | Appendix 6 NCHMA Checklist
Page 82
52. Interviews with area housing stakeholders 49
Certifications
53. Preparation date of report Cover
54. Date of field work 8
55. Certifications 74
56. Statement of qualifications 71
57. Sources of data not otherwise identified N/A
58. Utility allowance schedule N/A
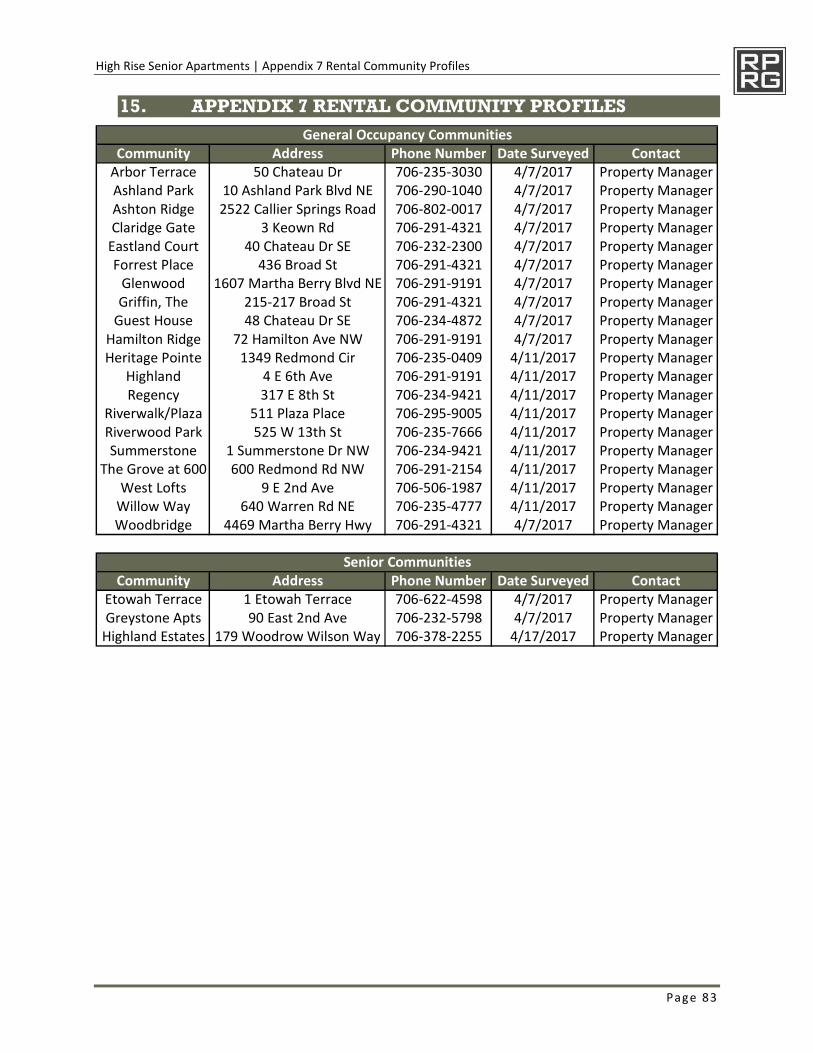
High Rise Senior Apartments | Appendix 7 Rental Community Profiles
Page 83
15. APPENDIX 7 RENTAL COMMUNITY PROFILES
Community Address Phone Number Date Surveyed ContactArbor Terrace 50 Chateau Dr 706-235-3030 4/7/2017 Property ManagerAshland Park 10 Ashland Park Blvd NE 706-290-1040 4/7/2017 Property ManagerAshton Ridge 2522 Callier Springs Road 706-802-0017 4/7/2017 Property ManagerClaridge Gate 3 Keown Rd 706-291-4321 4/7/2017 Property Manager
Eastland Court 40 Chateau Dr SE 706-232-2300 4/7/2017 Property ManagerForrest Place 436 Broad St 706-291-4321 4/7/2017 Property Manager
Glenwood 1607 Martha Berry Blvd NE 706-291-9191 4/7/2017 Property ManagerGriffin, The 215-217 Broad St 706-291-4321 4/7/2017 Property Manager
Guest House 48 Chateau Dr SE 706-234-4872 4/7/2017 Property ManagerHamilton Ridge 72 Hamilton Ave NW 706-291-9191 4/7/2017 Property ManagerHeritage Pointe 1349 Redmond Cir 706-235-0409 4/11/2017 Property Manager
Highland 4 E 6th Ave 706-291-9191 4/11/2017 Property ManagerRegency 317 E 8th St 706-234-9421 4/11/2017 Property Manager
Riverwalk/Plaza 511 Plaza Place 706-295-9005 4/11/2017 Property ManagerRiverwood Park 525 W 13th St 706-235-7666 4/11/2017 Property ManagerSummerstone 1 Summerstone Dr NW 706-234-9421 4/11/2017 Property Manager
The Grove at 600 600 Redmond Rd NW 706-291-2154 4/11/2017 Property ManagerWest Lofts 9 E 2nd Ave 706-506-1987 4/11/2017 Property Manager
Willow Way 640 Warren Rd NE 706-235-4777 4/11/2017 Property ManagerWoodbridge 4469 Martha Berry Hwy 706-291-4321 4/7/2017 Property Manager
Community Address Phone Number Date Surveyed ContactEtowah Terrace 1 Etowah Terrace 706-622-4598 4/7/2017 Property ManagerGreystone Apts 90 East 2nd Ave 706-232-5798 4/7/2017 Property Manager
Highland Estates 179 Woodrow Wilson Way 706-378-2255 4/17/2017 Property Manager
Senior Communities
General Occupancy Communities
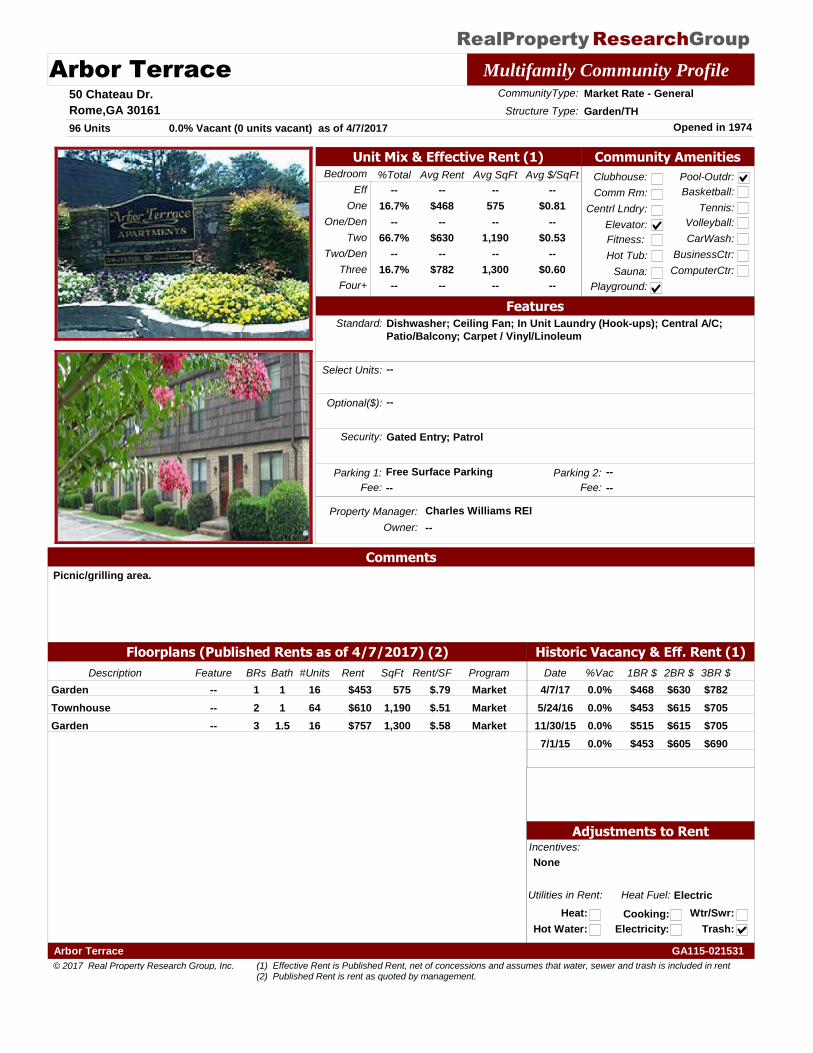
RealProperty GroupResearch
Arbor Terrace Multifamily Community Profile50 Chateau Dr.
Rome,GA 30161
Property Manager: Charles Williams REI
Opened in 1974
CommunityType: Market Rate - General
96 Units
Structure Type: Garden/TH
Owner: --
Historic Vacancy & Eff. Rent (1)
Bedroom Avg $/SqFtAvg SqFt%Total Avg Rent
Eff
One
Two
Three
Four+
One/Den
Two/Den
--
$468
--
$630
--
$782
--
--
575
--
1,190
--
1,300
--
--
$0.81
--
$0.53
--
$0.60
--
--
16.7%
--
66.7%
--
16.7%
--
Utilities in Rent:
Heat:
Heat Fuel: Electric
Hot Water:
Cooking:
Electricity:
Wtr/Swr:
Trash:
Community Amenities
Clubhouse:
Comm Rm:
Centrl Lndry:
Fitness:
Hot Tub:
Sauna:
Pool-Outdr:
Playground:
Basketball:
Tennis:
Volleyball:
CarWash:
BusinessCtr:
ComputerCtr:
Floorplans (Published Rents as of 4/7/2017) (2)
Elevator:
0.0% Vacant (0 units vacant) as of 4/7/2017
FeaturesStandard: Dishwasher; Ceiling Fan; In Unit Laundry (Hook-ups); Central A/C;
Patio/Balcony; Carpet / Vinyl/Linoleum
Select Units: --
Optional($): --
Incentives:
None
Security: Gated Entry; Patrol
Unit Mix & Effective Rent (1)
Adjustments to Rent
Parking 1: Free Surface Parking
Comments
Picnic/grilling area.
Parking 2: --
Fee: -- Fee: --
Date %Vac 1BR $ 2BR $ 3BR $
0.0%4/7/17 $468 $630 $782
0.0%5/24/16 $453 $615 $705
0.0%11/30/15 $515 $615 $705
0.0%7/1/15 $453 $605 $690
Description BRs Bath Rent SqFt ProgramRent/SF#UnitsFeature
1 1Garden $453 575 Market$.7916--
2 1Townhouse $610 1,190 Market$.5164--
3 1.5Garden $757 1,300 Market$.5816--
© 2017 Real Property Research Group, Inc.
GA115-021531Arbor Terrace
(1) Effective Rent is Published Rent, net of concessions and assumes that water, sewer and trash is included in rent(2) Published Rent is rent as quoted by management.
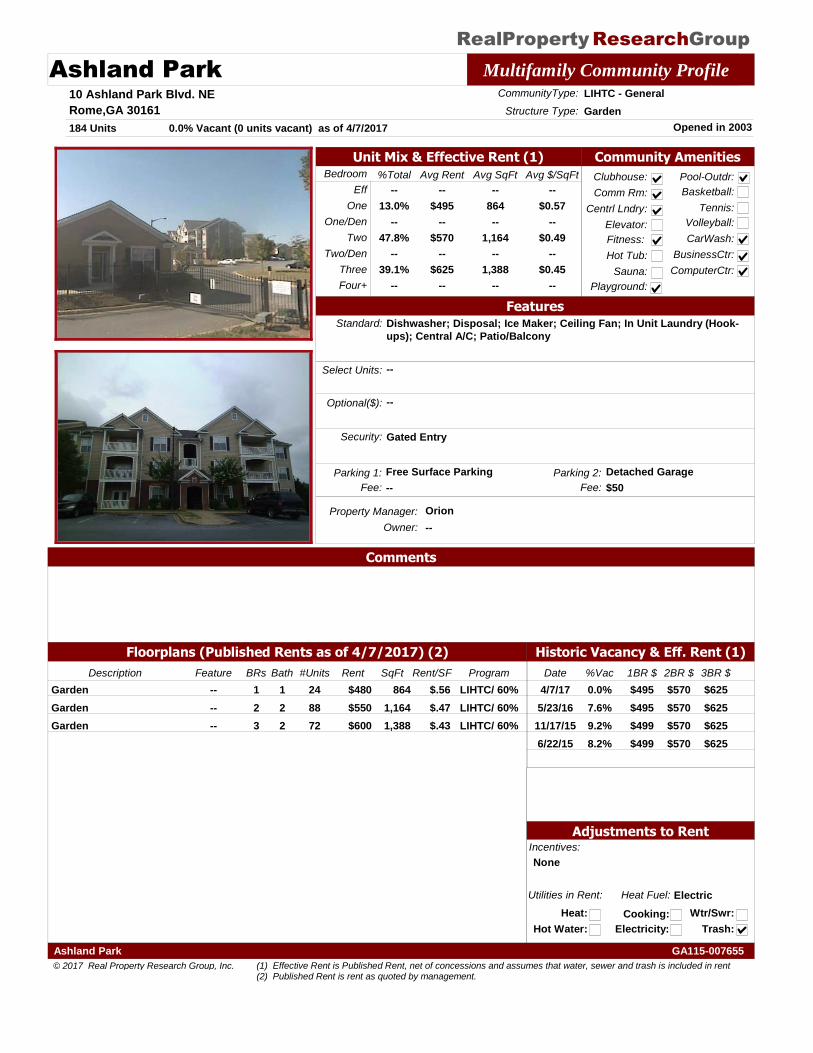
RealProperty GroupResearch
Ashland Park Multifamily Community Profile10 Ashland Park Blvd. NE
Rome,GA 30161
Property Manager: Orion
Opened in 2003
CommunityType: LIHTC - General
184 Units
Structure Type: Garden
Owner: --
Historic Vacancy & Eff. Rent (1)
Bedroom Avg $/SqFtAvg SqFt%Total Avg Rent
Eff
One
Two
Three
Four+
One/Den
Two/Den
--
$495
--
$570
--
$625
--
--
864
--
1,164
--
1,388
--
--
$0.57
--
$0.49
--
$0.45
--
--
13.0%
--
47.8%
--
39.1%
--
Utilities in Rent:
Heat:
Heat Fuel: Electric
Hot Water:
Cooking:
Electricity:
Wtr/Swr:
Trash:
Community Amenities
Clubhouse:
Comm Rm:
Centrl Lndry:
Fitness:
Hot Tub:
Sauna:
Pool-Outdr:
Playground:
Basketball:
Tennis:
Volleyball:
CarWash:
BusinessCtr:
ComputerCtr:
Floorplans (Published Rents as of 4/7/2017) (2)
Elevator:
0.0% Vacant (0 units vacant) as of 4/7/2017
FeaturesStandard: Dishwasher; Disposal; Ice Maker; Ceiling Fan; In Unit Laundry (Hook-
ups); Central A/C; Patio/Balcony
Select Units: --
Optional($): --
Incentives:
None
Security: Gated Entry
Unit Mix & Effective Rent (1)
Adjustments to Rent
Parking 1: Free Surface Parking
Comments
Parking 2: Detached Garage
Fee: -- Fee: $50
Date %Vac 1BR $ 2BR $ 3BR $
0.0%4/7/17 $495 $570 $625
7.6%5/23/16 $495 $570 $625
9.2%11/17/15 $499 $570 $625
8.2%6/22/15 $499 $570 $625
Description BRs Bath Rent SqFt ProgramRent/SF#UnitsFeature
1 1Garden $480 864 LIHTC/ 60%$.5624--
2 2Garden $550 1,164 LIHTC/ 60%$.4788--
3 2Garden $600 1,388 LIHTC/ 60%$.4372--
© 2017 Real Property Research Group, Inc.
GA115-007655Ashland Park
(1) Effective Rent is Published Rent, net of concessions and assumes that water, sewer and trash is included in rent(2) Published Rent is rent as quoted by management.
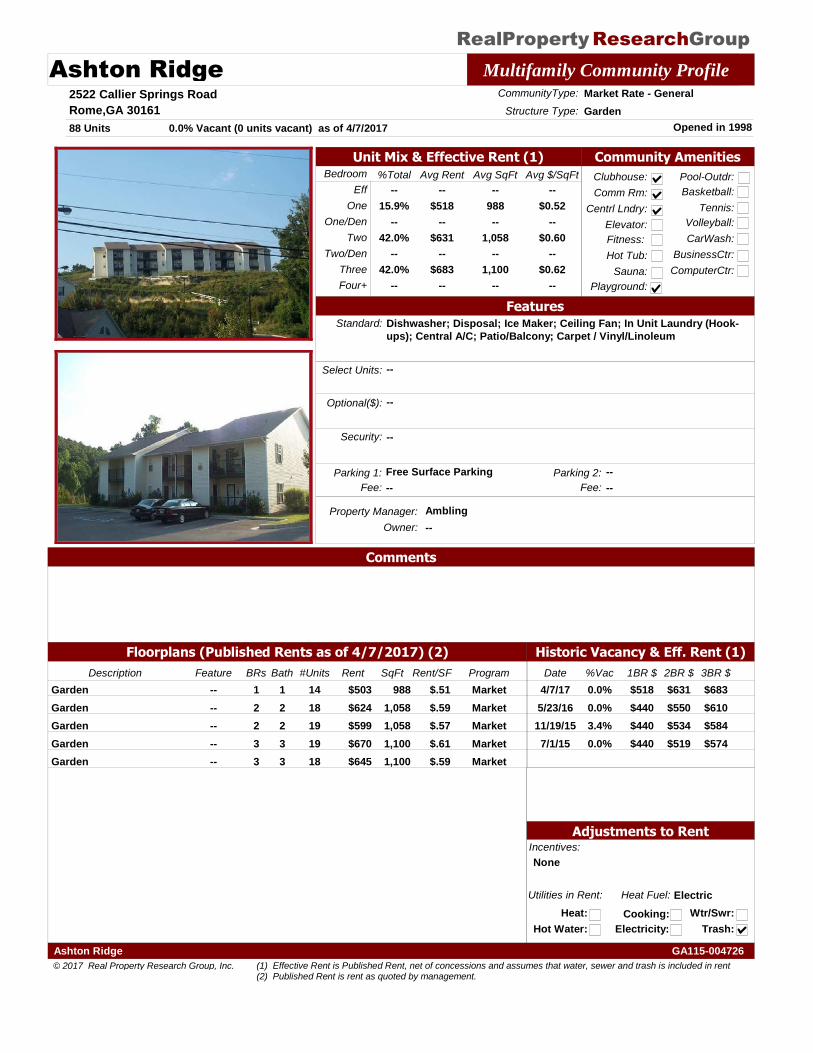
RealProperty GroupResearch
Ashton Ridge Multifamily Community Profile2522 Callier Springs Road
Rome,GA 30161
Property Manager: Ambling
Opened in 1998
CommunityType: Market Rate - General
88 Units
Structure Type: Garden
Owner: --
Historic Vacancy & Eff. Rent (1)
Bedroom Avg $/SqFtAvg SqFt%Total Avg Rent
Eff
One
Two
Three
Four+
One/Den
Two/Den
--
$518
--
$631
--
$683
--
--
988
--
1,058
--
1,100
--
--
$0.52
--
$0.60
--
$0.62
--
--
15.9%
--
42.0%
--
42.0%
--
Utilities in Rent:
Heat:
Heat Fuel: Electric
Hot Water:
Cooking:
Electricity:
Wtr/Swr:
Trash:
Community Amenities
Clubhouse:
Comm Rm:
Centrl Lndry:
Fitness:
Hot Tub:
Sauna:
Pool-Outdr:
Playground:
Basketball:
Tennis:
Volleyball:
CarWash:
BusinessCtr:
ComputerCtr:
Floorplans (Published Rents as of 4/7/2017) (2)
Elevator:
0.0% Vacant (0 units vacant) as of 4/7/2017
FeaturesStandard: Dishwasher; Disposal; Ice Maker; Ceiling Fan; In Unit Laundry (Hook-
ups); Central A/C; Patio/Balcony; Carpet / Vinyl/Linoleum
Select Units: --
Optional($): --
Incentives:
None
Security: --
Unit Mix & Effective Rent (1)
Adjustments to Rent
Parking 1: Free Surface Parking
Comments
Parking 2: --
Fee: -- Fee: --
Date %Vac 1BR $ 2BR $ 3BR $
0.0%4/7/17 $518 $631 $683
0.0%5/23/16 $440 $550 $610
3.4%11/19/15 $440 $534 $584
0.0%7/1/15 $440 $519 $574
Description BRs Bath Rent SqFt ProgramRent/SF#UnitsFeature
1 1Garden $503 988 Market$.5114--
2 2Garden $624 1,058 Market$.5918--
2 2Garden $599 1,058 Market$.5719--
3 3Garden $670 1,100 Market$.6119--
3 3Garden $645 1,100 Market$.5918--
© 2017 Real Property Research Group, Inc.
GA115-004726Ashton Ridge
(1) Effective Rent is Published Rent, net of concessions and assumes that water, sewer and trash is included in rent(2) Published Rent is rent as quoted by management.
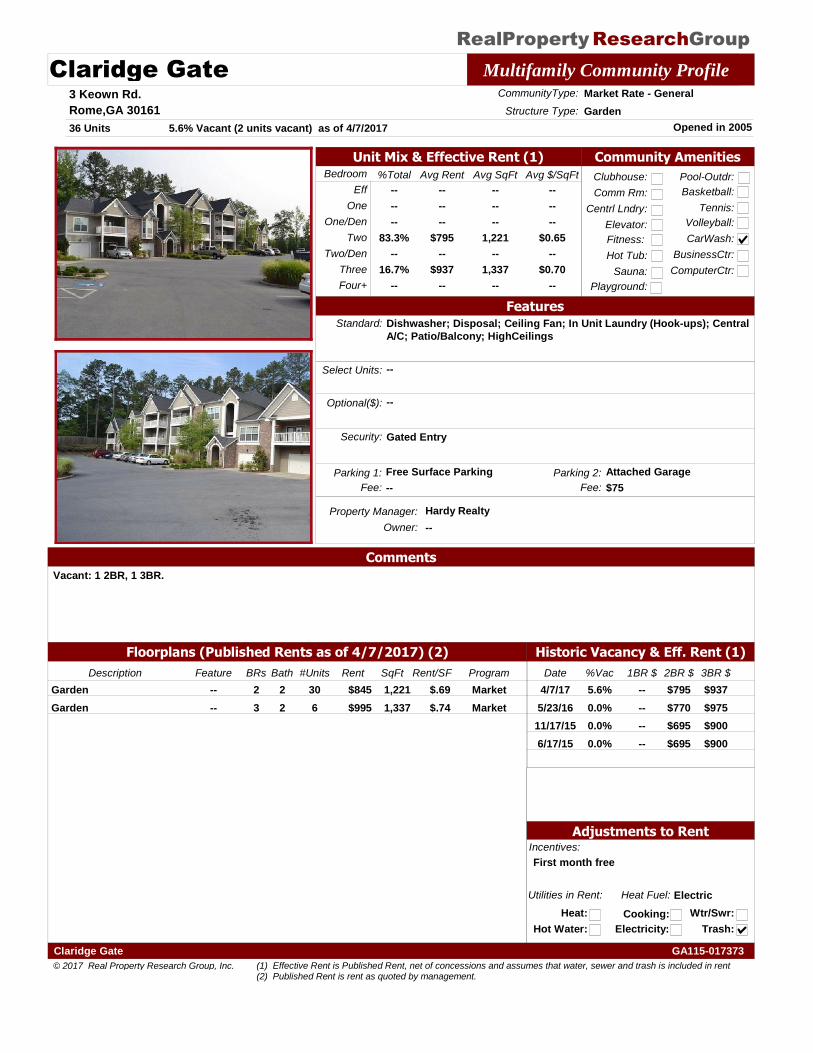
RealProperty GroupResearch
Claridge Gate Multifamily Community Profile3 Keown Rd.
Rome,GA 30161
Property Manager: Hardy Realty
Opened in 2005
CommunityType: Market Rate - General
36 Units
Structure Type: Garden
Owner: --
Historic Vacancy & Eff. Rent (1)
Bedroom Avg $/SqFtAvg SqFt%Total Avg Rent
Eff
One
Two
Three
Four+
One/Den
Two/Den
--
--
--
$795
--
$937
--
--
--
--
1,221
--
1,337
--
--
--
--
$0.65
--
$0.70
--
--
--
--
83.3%
--
16.7%
--
Utilities in Rent:
Heat:
Heat Fuel: Electric
Hot Water:
Cooking:
Electricity:
Wtr/Swr:
Trash:
Community Amenities
Clubhouse:
Comm Rm:
Centrl Lndry:
Fitness:
Hot Tub:
Sauna:
Pool-Outdr:
Playground:
Basketball:
Tennis:
Volleyball:
CarWash:
BusinessCtr:
ComputerCtr:
Floorplans (Published Rents as of 4/7/2017) (2)
Elevator:
5.6% Vacant (2 units vacant) as of 4/7/2017
FeaturesStandard: Dishwasher; Disposal; Ceiling Fan; In Unit Laundry (Hook-ups); Central
A/C; Patio/Balcony; HighCeilings
Select Units: --
Optional($): --
Incentives:
First month free
Security: Gated Entry
Unit Mix & Effective Rent (1)
Adjustments to Rent
Parking 1: Free Surface Parking
Comments
Vacant: 1 2BR, 1 3BR.
Parking 2: Attached Garage
Fee: -- Fee: $75
Date %Vac 1BR $ 2BR $ 3BR $
5.6%4/7/17 -- $795 $937
0.0%5/23/16 -- $770 $975
0.0%11/17/15 -- $695 $900
0.0%6/17/15 -- $695 $900
Description BRs Bath Rent SqFt ProgramRent/SF#UnitsFeature
2 2Garden $845 1,221 Market$.6930--
3 2Garden $995 1,337 Market$.746--
© 2017 Real Property Research Group, Inc.
GA115-017373Claridge Gate
(1) Effective Rent is Published Rent, net of concessions and assumes that water, sewer and trash is included in rent(2) Published Rent is rent as quoted by management.
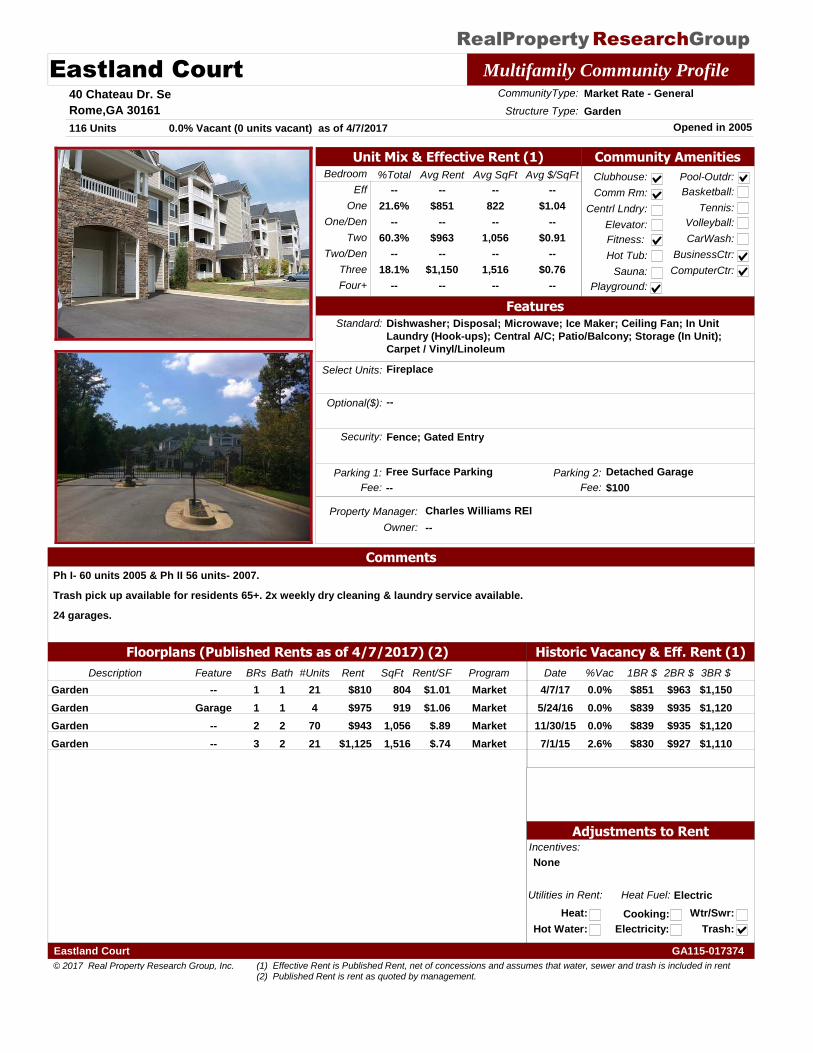
RealProperty GroupResearch
Eastland Court Multifamily Community Profile40 Chateau Dr. Se
Rome,GA 30161
Property Manager: Charles Williams REI
Opened in 2005
CommunityType: Market Rate - General
116 Units
Structure Type: Garden
Owner: --
Historic Vacancy & Eff. Rent (1)
Bedroom Avg $/SqFtAvg SqFt%Total Avg Rent
Eff
One
Two
Three
Four+
One/Den
Two/Den
--
$851
--
$963
--
$1,150
--
--
822
--
1,056
--
1,516
--
--
$1.04
--
$0.91
--
$0.76
--
--
21.6%
--
60.3%
--
18.1%
--
Utilities in Rent:
Heat:
Heat Fuel: Electric
Hot Water:
Cooking:
Electricity:
Wtr/Swr:
Trash:
Community Amenities
Clubhouse:
Comm Rm:
Centrl Lndry:
Fitness:
Hot Tub:
Sauna:
Pool-Outdr:
Playground:
Basketball:
Tennis:
Volleyball:
CarWash:
BusinessCtr:
ComputerCtr:
Floorplans (Published Rents as of 4/7/2017) (2)
Elevator:
0.0% Vacant (0 units vacant) as of 4/7/2017
FeaturesStandard: Dishwasher; Disposal; Microwave; Ice Maker; Ceiling Fan; In Unit
Laundry (Hook-ups); Central A/C; Patio/Balcony; Storage (In Unit);Carpet / Vinyl/Linoleum
Select Units: Fireplace
Optional($): --
Incentives:
None
Security: Fence; Gated Entry
Unit Mix & Effective Rent (1)
Adjustments to Rent
Parking 1: Free Surface Parking
Comments
Ph I- 60 units 2005 & Ph II 56 units- 2007.
Trash pick up available for residents 65+. 2x weekly dry cleaning & laundry service available.
24 garages.
Parking 2: Detached Garage
Fee: -- Fee: $100
Date %Vac 1BR $ 2BR $ 3BR $
0.0%4/7/17 $851 $963 $1,150
0.0%5/24/16 $839 $935 $1,120
0.0%11/30/15 $839 $935 $1,120
2.6%7/1/15 $830 $927 $1,110
Description BRs Bath Rent SqFt ProgramRent/SF#UnitsFeature
1 1Garden $810 804 Market$1.0121--
1 1Garden $975 919 Market$1.064Garage
2 2Garden $943 1,056 Market$.8970--
3 2Garden $1,125 1,516 Market$.7421--
© 2017 Real Property Research Group, Inc.
GA115-017374Eastland Court
(1) Effective Rent is Published Rent, net of concessions and assumes that water, sewer and trash is included in rent(2) Published Rent is rent as quoted by management.
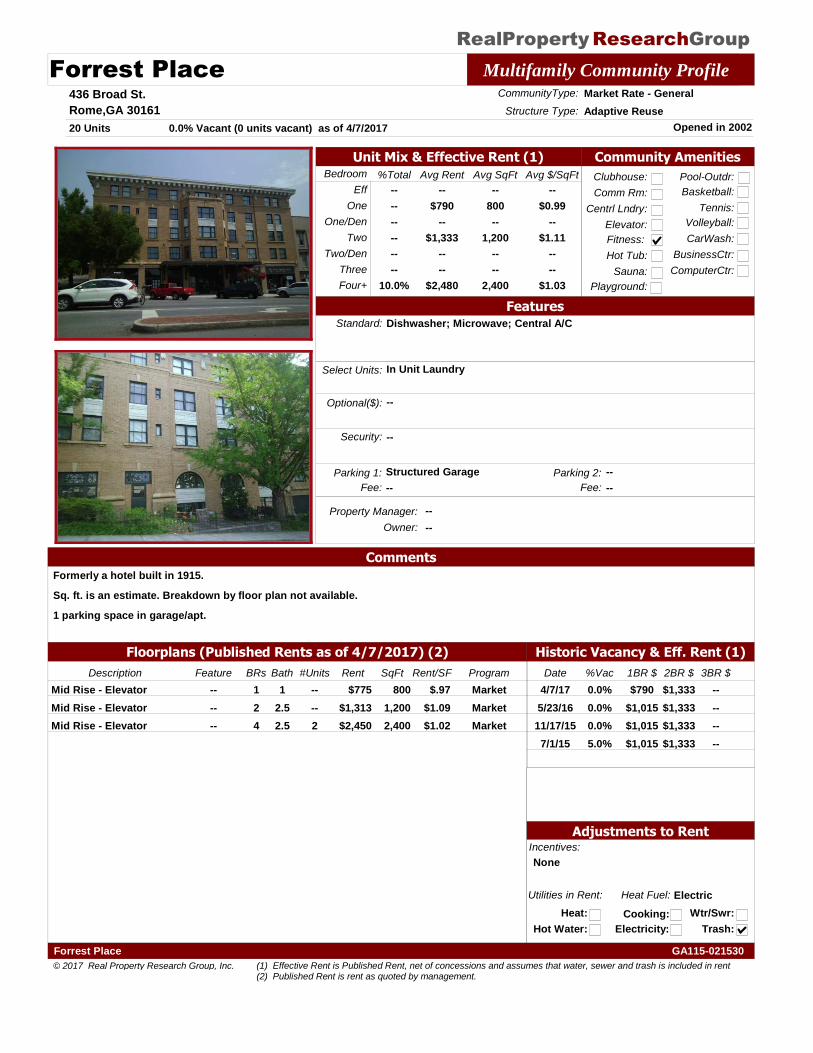
RealProperty GroupResearch
Forrest Place Multifamily Community Profile436 Broad St.
Rome,GA 30161
Property Manager: --
Opened in 2002
CommunityType: Market Rate - General
20 Units
Structure Type: Adaptive Reuse
Owner: --
Historic Vacancy & Eff. Rent (1)
Bedroom Avg $/SqFtAvg SqFt%Total Avg Rent
Eff
One
Two
Three
Four+
One/Den
Two/Den
--
$790
--
$1,333
--
--
$2,480
--
800
--
1,200
--
--
2,400
--
$0.99
--
$1.11
--
--
$1.03
--
--
--
--
--
--
10.0%
Utilities in Rent:
Heat:
Heat Fuel: Electric
Hot Water:
Cooking:
Electricity:
Wtr/Swr:
Trash:
Community Amenities
Clubhouse:
Comm Rm:
Centrl Lndry:
Fitness:
Hot Tub:
Sauna:
Pool-Outdr:
Playground:
Basketball:
Tennis:
Volleyball:
CarWash:
BusinessCtr:
ComputerCtr:
Floorplans (Published Rents as of 4/7/2017) (2)
Elevator:
0.0% Vacant (0 units vacant) as of 4/7/2017
FeaturesStandard: Dishwasher; Microwave; Central A/C
Select Units: In Unit Laundry
Optional($): --
Incentives:
None
Security: --
Unit Mix & Effective Rent (1)
Adjustments to Rent
Parking 1: Structured Garage
Comments
Formerly a hotel built in 1915.
Sq. ft. is an estimate. Breakdown by floor plan not available.
1 parking space in garage/apt.
Parking 2: --
Fee: -- Fee: --
Date %Vac 1BR $ 2BR $ 3BR $
0.0%4/7/17 $790 $1,333 --
0.0%5/23/16 $1,015 $1,333 --
0.0%11/17/15 $1,015 $1,333 --
5.0%7/1/15 $1,015 $1,333 --
Description BRs Bath Rent SqFt ProgramRent/SF#UnitsFeature
1 1Mid Rise - Elevator $775 800 Market$.97----
2 2.5Mid Rise - Elevator $1,313 1,200 Market$1.09----
4 2.5Mid Rise - Elevator $2,450 2,400 Market$1.022--
© 2017 Real Property Research Group, Inc.
GA115-021530Forrest Place
(1) Effective Rent is Published Rent, net of concessions and assumes that water, sewer and trash is included in rent(2) Published Rent is rent as quoted by management.
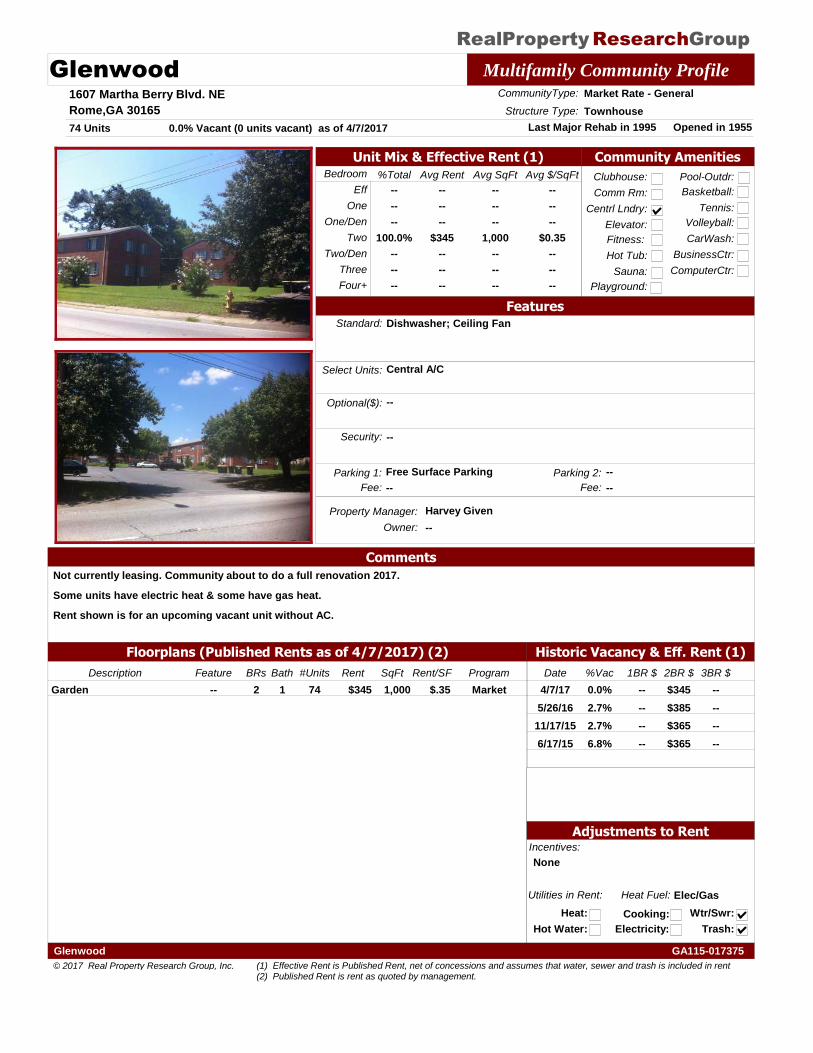
RealProperty GroupResearch
Glenwood Multifamily Community Profile1607 Martha Berry Blvd. NE
Rome,GA 30165
Property Manager: Harvey Given
Opened in 1955Last Major Rehab in 1995
CommunityType: Market Rate - General
74 Units
Structure Type: Townhouse
Owner: --
Historic Vacancy & Eff. Rent (1)
Bedroom Avg $/SqFtAvg SqFt%Total Avg Rent
Eff
One
Two
Three
Four+
One/Den
Two/Den
--
--
--
$345
--
--
--
--
--
--
1,000
--
--
--
--
--
--
$0.35
--
--
--
--
--
--
100.0%
--
--
--
Utilities in Rent:
Heat:
Heat Fuel: Elec/Gas
Hot Water:
Cooking:
Electricity:
Wtr/Swr:
Trash:
Community Amenities
Clubhouse:
Comm Rm:
Centrl Lndry:
Fitness:
Hot Tub:
Sauna:
Pool-Outdr:
Playground:
Basketball:
Tennis:
Volleyball:
CarWash:
BusinessCtr:
ComputerCtr:
Floorplans (Published Rents as of 4/7/2017) (2)
Elevator:
0.0% Vacant (0 units vacant) as of 4/7/2017
FeaturesStandard: Dishwasher; Ceiling Fan
Select Units: Central A/C
Optional($): --
Incentives:
None
Security: --
Unit Mix & Effective Rent (1)
Adjustments to Rent
Parking 1: Free Surface Parking
Comments
Not currently leasing. Community about to do a full renovation 2017.
Some units have electric heat & some have gas heat.
Rent shown is for an upcoming vacant unit without AC.
Parking 2: --
Fee: -- Fee: --
Date %Vac 1BR $ 2BR $ 3BR $
0.0%4/7/17 -- $345 --
2.7%5/26/16 -- $385 --
2.7%11/17/15 -- $365 --
6.8%6/17/15 -- $365 --
Description BRs Bath Rent SqFt ProgramRent/SF#UnitsFeature
2 1Garden $345 1,000 Market$.3574--
© 2017 Real Property Research Group, Inc.
GA115-017375Glenwood
(1) Effective Rent is Published Rent, net of concessions and assumes that water, sewer and trash is included in rent(2) Published Rent is rent as quoted by management.
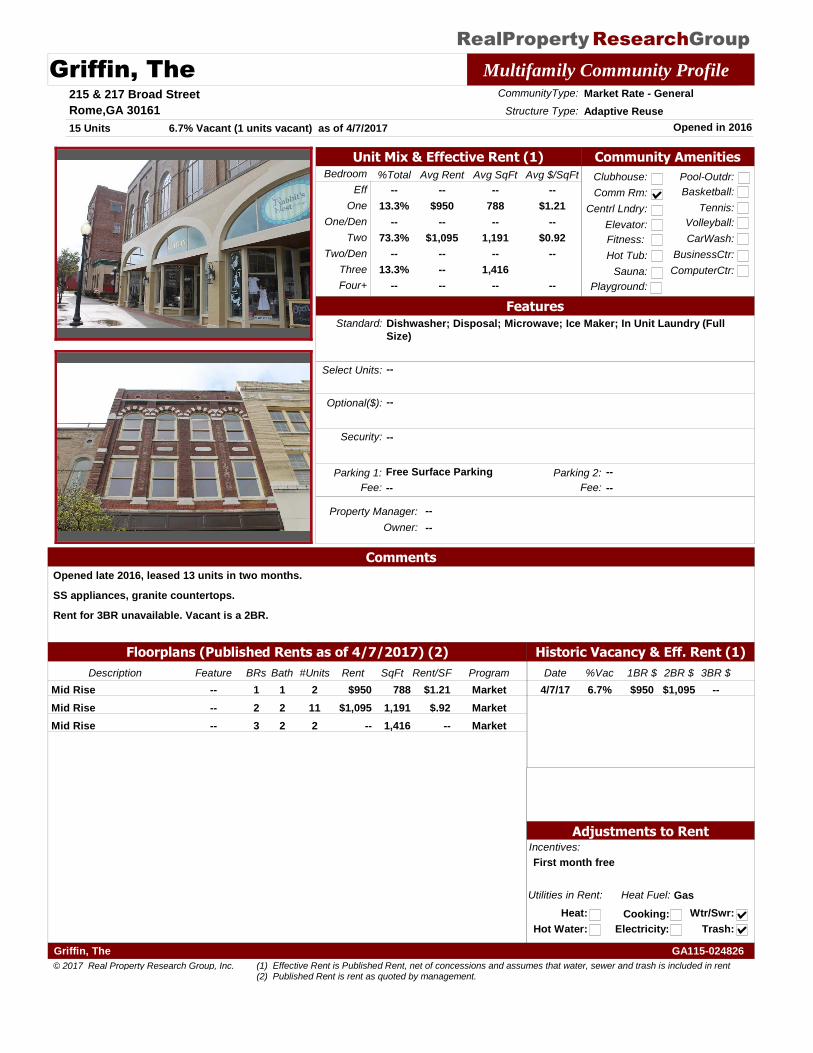
RealProperty GroupResearch
Griffin, The Multifamily Community Profile215 & 217 Broad Street
Rome,GA 30161
Property Manager: --
Opened in 2016
CommunityType: Market Rate - General
15 Units
Structure Type: Adaptive Reuse
Owner: --
Historic Vacancy & Eff. Rent (1)
Bedroom Avg $/SqFtAvg SqFt%Total Avg Rent
Eff
One
Two
Three
Four+
One/Den
Two/Den
--
$950
--
$1,095
--
--
--
--
788
--
1,191
--
1,416
--
--
$1.21
--
$0.92
--
--
--
13.3%
--
73.3%
--
13.3%
--
Utilities in Rent:
Heat:
Heat Fuel: Gas
Hot Water:
Cooking:
Electricity:
Wtr/Swr:
Trash:
Community Amenities
Clubhouse:
Comm Rm:
Centrl Lndry:
Fitness:
Hot Tub:
Sauna:
Pool-Outdr:
Playground:
Basketball:
Tennis:
Volleyball:
CarWash:
BusinessCtr:
ComputerCtr:
Floorplans (Published Rents as of 4/7/2017) (2)
Elevator:
6.7% Vacant (1 units vacant) as of 4/7/2017
FeaturesStandard: Dishwasher; Disposal; Microwave; Ice Maker; In Unit Laundry (Full
Size)
Select Units: --
Optional($): --
Incentives:
First month free
Security: --
Unit Mix & Effective Rent (1)
Adjustments to Rent
Parking 1: Free Surface Parking
Comments
Opened late 2016, leased 13 units in two months.
SS appliances, granite countertops.
Rent for 3BR unavailable. Vacant is a 2BR.
Parking 2: --
Fee: -- Fee: --
Date %Vac 1BR $ 2BR $ 3BR $
6.7%4/7/17 $950 $1,095 --
Description BRs Bath Rent SqFt ProgramRent/SF#UnitsFeature
1 1Mid Rise $950 788 Market$1.212--
2 2Mid Rise $1,095 1,191 Market$.9211--
3 2Mid Rise -- 1,416 Market--2--
© 2017 Real Property Research Group, Inc.
GA115-024826Griffin, The
(1) Effective Rent is Published Rent, net of concessions and assumes that water, sewer and trash is included in rent(2) Published Rent is rent as quoted by management.
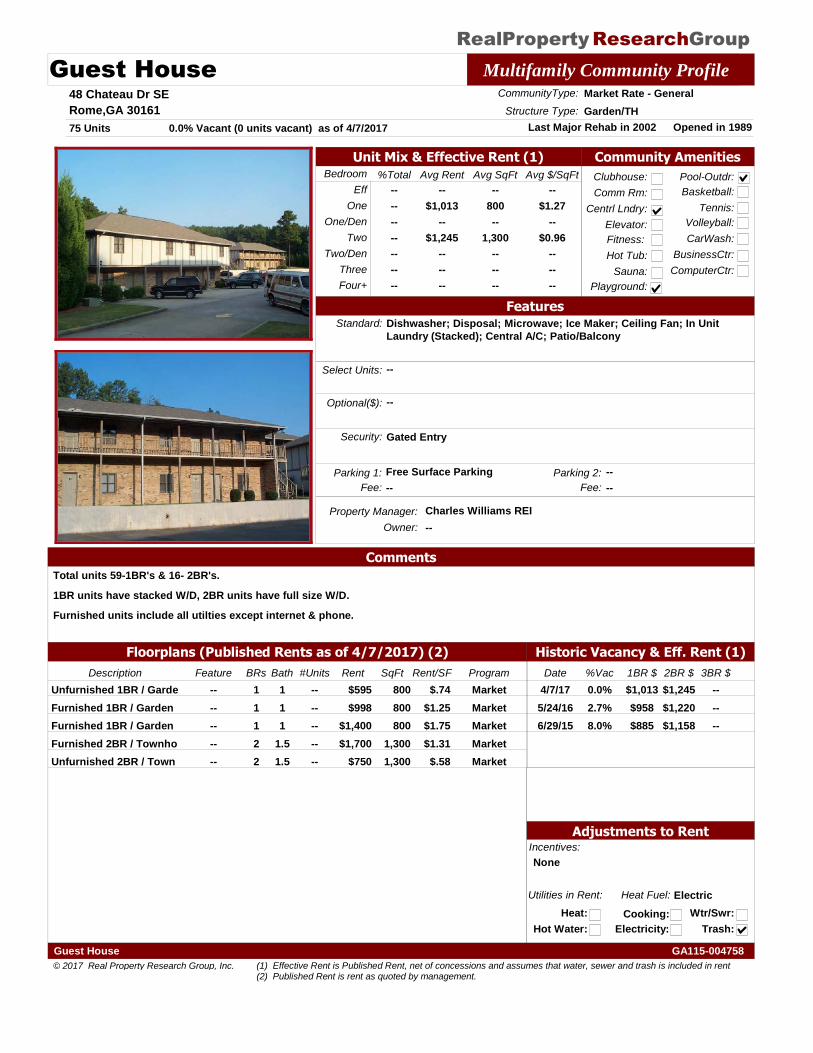
RealProperty GroupResearch
Guest House Multifamily Community Profile48 Chateau Dr SE
Rome,GA 30161
Property Manager: Charles Williams REI
Opened in 1989Last Major Rehab in 2002
CommunityType: Market Rate - General
75 Units
Structure Type: Garden/TH
Owner: --
Historic Vacancy & Eff. Rent (1)
Bedroom Avg $/SqFtAvg SqFt%Total Avg Rent
Eff
One
Two
Three
Four+
One/Den
Two/Den
--
$1,013
--
$1,245
--
--
--
--
800
--
1,300
--
--
--
--
$1.27
--
$0.96
--
--
--
--
--
--
--
--
--
--
Utilities in Rent:
Heat:
Heat Fuel: Electric
Hot Water:
Cooking:
Electricity:
Wtr/Swr:
Trash:
Community Amenities
Clubhouse:
Comm Rm:
Centrl Lndry:
Fitness:
Hot Tub:
Sauna:
Pool-Outdr:
Playground:
Basketball:
Tennis:
Volleyball:
CarWash:
BusinessCtr:
ComputerCtr:
Floorplans (Published Rents as of 4/7/2017) (2)
Elevator:
0.0% Vacant (0 units vacant) as of 4/7/2017
FeaturesStandard: Dishwasher; Disposal; Microwave; Ice Maker; Ceiling Fan; In Unit
Laundry (Stacked); Central A/C; Patio/Balcony
Select Units: --
Optional($): --
Incentives:
None
Security: Gated Entry
Unit Mix & Effective Rent (1)
Adjustments to Rent
Parking 1: Free Surface Parking
Comments
Total units 59-1BR's & 16- 2BR's.
1BR units have stacked W/D, 2BR units have full size W/D.
Furnished units include all utilties except internet & phone.
Parking 2: --
Fee: -- Fee: --
Date %Vac 1BR $ 2BR $ 3BR $
0.0%4/7/17 $1,013 $1,245 --
2.7%5/24/16 $958 $1,220 --
8.0%6/29/15 $885 $1,158 --
Description BRs Bath Rent SqFt ProgramRent/SF#UnitsFeature
1 1Unfurnished 1BR / Garde $595 800 Market$.74----
1 1Furnished 1BR / Garden $998 800 Market$1.25----
1 1Furnished 1BR / Garden $1,400 800 Market$1.75----
2 1.5Furnished 2BR / Townho $1,700 1,300 Market$1.31----
2 1.5Unfurnished 2BR / Town $750 1,300 Market$.58----
© 2017 Real Property Research Group, Inc.
GA115-004758Guest House
(1) Effective Rent is Published Rent, net of concessions and assumes that water, sewer and trash is included in rent(2) Published Rent is rent as quoted by management.
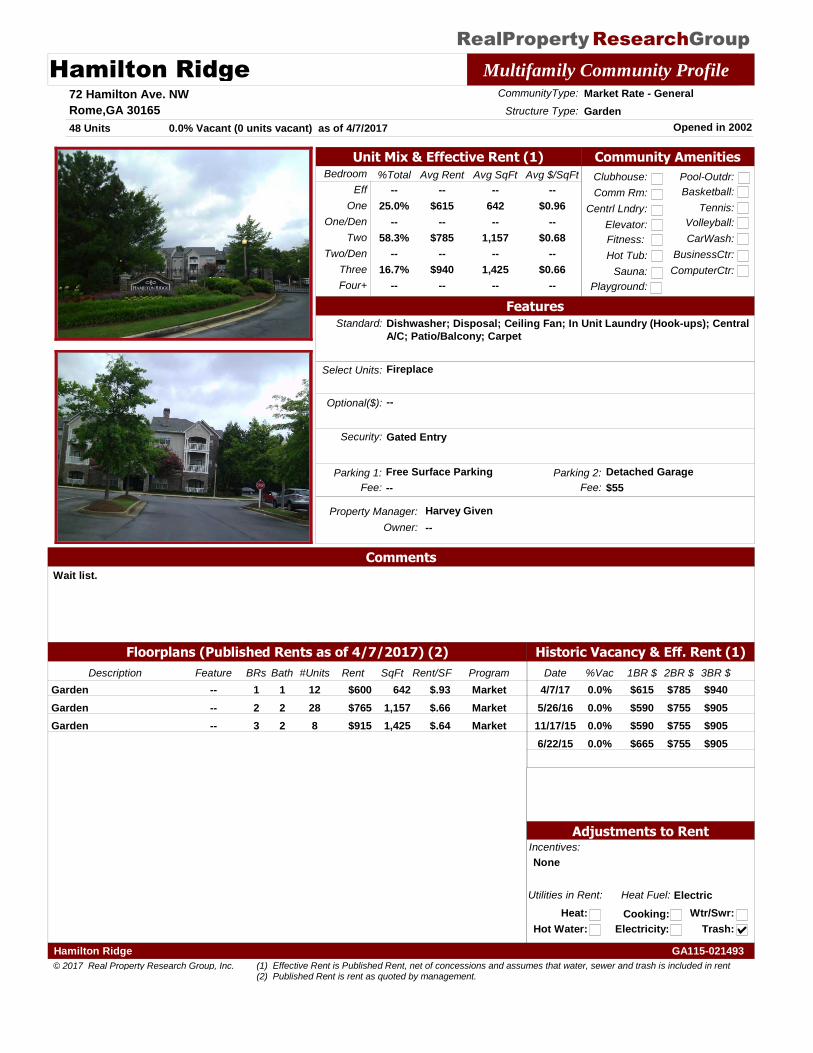
RealProperty GroupResearch
Hamilton Ridge Multifamily Community Profile72 Hamilton Ave. NW
Rome,GA 30165
Property Manager: Harvey Given
Opened in 2002
CommunityType: Market Rate - General
48 Units
Structure Type: Garden
Owner: --
Historic Vacancy & Eff. Rent (1)
Bedroom Avg $/SqFtAvg SqFt%Total Avg Rent
Eff
One
Two
Three
Four+
One/Den
Two/Den
--
$615
--
$785
--
$940
--
--
642
--
1,157
--
1,425
--
--
$0.96
--
$0.68
--
$0.66
--
--
25.0%
--
58.3%
--
16.7%
--
Utilities in Rent:
Heat:
Heat Fuel: Electric
Hot Water:
Cooking:
Electricity:
Wtr/Swr:
Trash:
Community Amenities
Clubhouse:
Comm Rm:
Centrl Lndry:
Fitness:
Hot Tub:
Sauna:
Pool-Outdr:
Playground:
Basketball:
Tennis:
Volleyball:
CarWash:
BusinessCtr:
ComputerCtr:
Floorplans (Published Rents as of 4/7/2017) (2)
Elevator:
0.0% Vacant (0 units vacant) as of 4/7/2017
FeaturesStandard: Dishwasher; Disposal; Ceiling Fan; In Unit Laundry (Hook-ups); Central
A/C; Patio/Balcony; Carpet
Select Units: Fireplace
Optional($): --
Incentives:
None
Security: Gated Entry
Unit Mix & Effective Rent (1)
Adjustments to Rent
Parking 1: Free Surface Parking
Comments
Wait list.
Parking 2: Detached Garage
Fee: -- Fee: $55
Date %Vac 1BR $ 2BR $ 3BR $
0.0%4/7/17 $615 $785 $940
0.0%5/26/16 $590 $755 $905
0.0%11/17/15 $590 $755 $905
0.0%6/22/15 $665 $755 $905
Description BRs Bath Rent SqFt ProgramRent/SF#UnitsFeature
1 1Garden $600 642 Market$.9312--
2 2Garden $765 1,157 Market$.6628--
3 2Garden $915 1,425 Market$.648--
© 2017 Real Property Research Group, Inc.
GA115-021493Hamilton Ridge
(1) Effective Rent is Published Rent, net of concessions and assumes that water, sewer and trash is included in rent(2) Published Rent is rent as quoted by management.
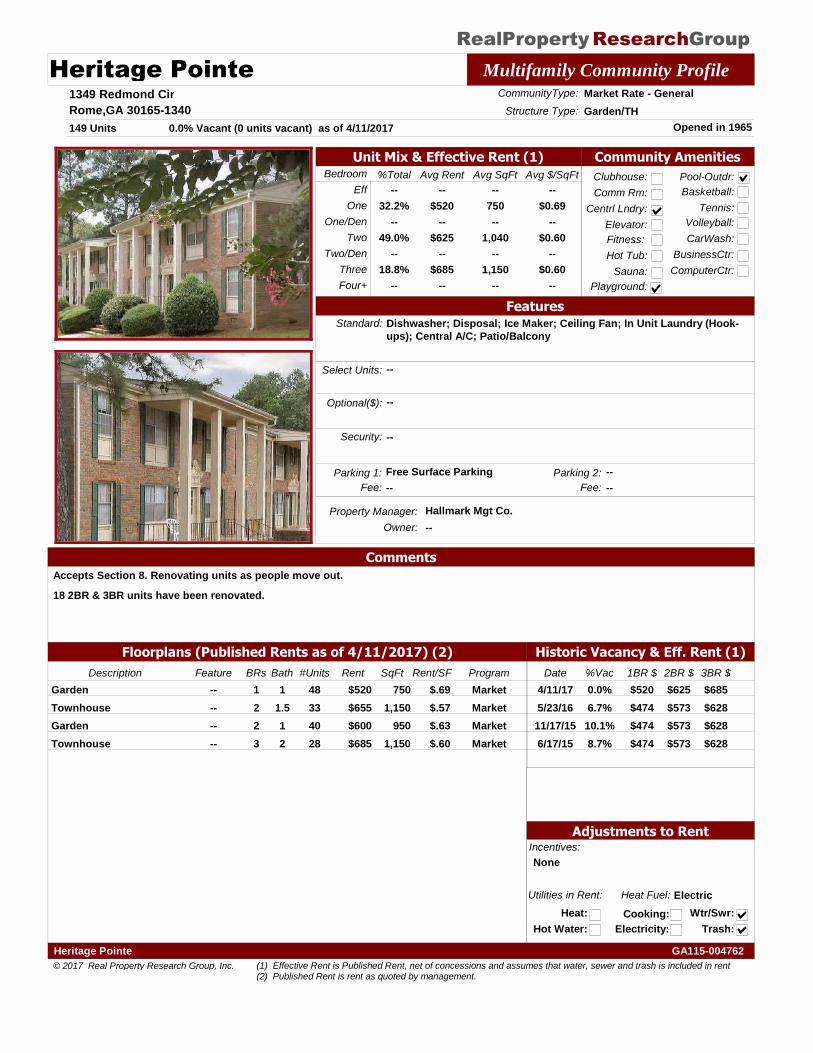
RealProperty GroupResearch
Heritage Pointe Multifamily Community Profile1349 Redmond Cir
Rome,GA 30165-1340
Property Manager: Hallmark Mgt Co.
Opened in 1965
CommunityType: Market Rate - General
149 Units
Structure Type: Garden/TH
Owner: --
Historic Vacancy & Eff. Rent (1)
Bedroom Avg $/SqFtAvg SqFt%Total Avg Rent
Eff
One
Two
Three
Four+
One/Den
Two/Den
--
$520
--
$625
--
$685
--
--
750
--
1,040
--
1,150
--
--
$0.69
--
$0.60
--
$0.60
--
--
32.2%
--
49.0%
--
18.8%
--
Utilities in Rent:
Heat:
Heat Fuel: Electric
Hot Water:
Cooking:
Electricity:
Wtr/Swr:
Trash:
Community Amenities
Clubhouse:
Comm Rm:
Centrl Lndry:
Fitness:
Hot Tub:
Sauna:
Pool-Outdr:
Playground:
Basketball:
Tennis:
Volleyball:
CarWash:
BusinessCtr:
ComputerCtr:
Floorplans (Published Rents as of 4/11/2017) (2)
Elevator:
0.0% Vacant (0 units vacant) as of 4/11/2017
FeaturesStandard: Dishwasher; Disposal; Ice Maker; Ceiling Fan; In Unit Laundry (Hook-
ups); Central A/C; Patio/Balcony
Select Units: --
Optional($): --
Incentives:
None
Security: --
Unit Mix & Effective Rent (1)
Adjustments to Rent
Parking 1: Free Surface Parking
Comments
Accepts Section 8. Renovating units as people move out.
18 2BR & 3BR units have been renovated.
Parking 2: --
Fee: -- Fee: --
Date %Vac 1BR $ 2BR $ 3BR $
0.0%4/11/17 $520 $625 $685
6.7%5/23/16 $474 $573 $628
10.1%11/17/15 $474 $573 $628
8.7%6/17/15 $474 $573 $628
Description BRs Bath Rent SqFt ProgramRent/SF#UnitsFeature
1 1Garden $520 750 Market$.6948--
2 1.5Townhouse $655 1,150 Market$.5733--
2 1Garden $600 950 Market$.6340--
3 2Townhouse $685 1,150 Market$.6028--
© 2017 Real Property Research Group, Inc.
GA115-004762Heritage Pointe
(1) Effective Rent is Published Rent, net of concessions and assumes that water, sewer and trash is included in rent(2) Published Rent is rent as quoted by management.
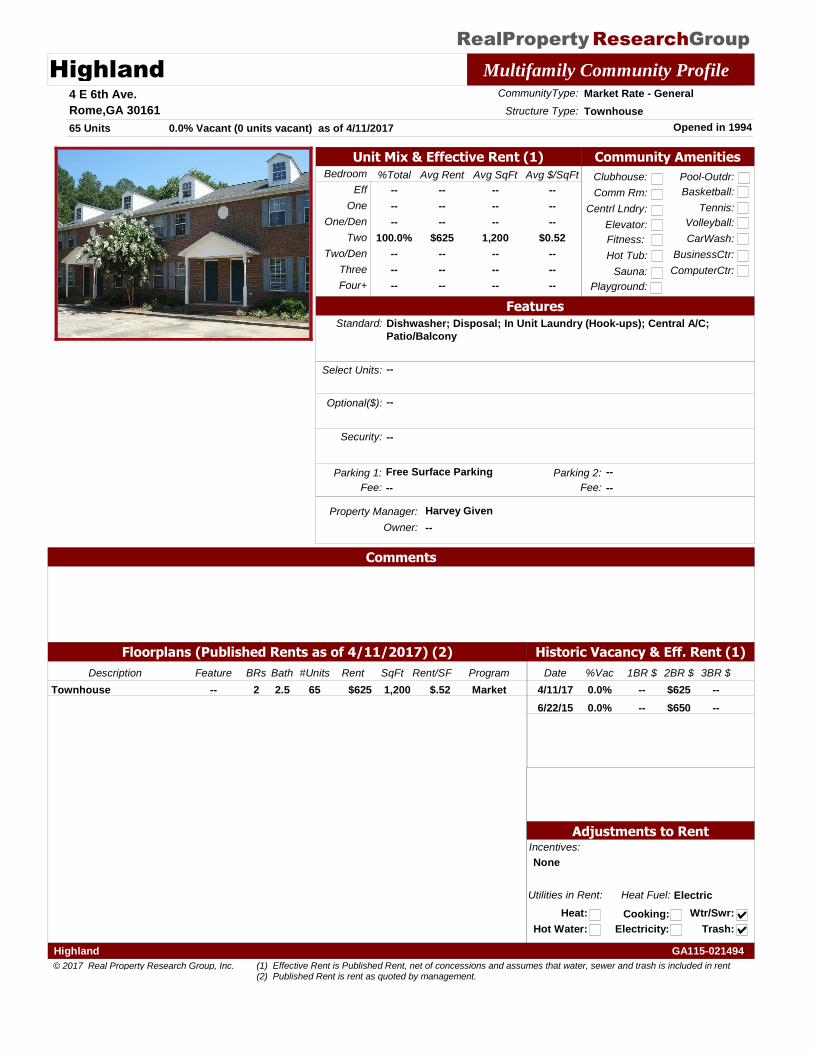
RealProperty GroupResearch
Highland Multifamily Community Profile4 E 6th Ave.
Rome,GA 30161
Property Manager: Harvey Given
Opened in 1994
CommunityType: Market Rate - General
65 Units
Structure Type: Townhouse
Owner: --
Historic Vacancy & Eff. Rent (1)
Bedroom Avg $/SqFtAvg SqFt%Total Avg Rent
Eff
One
Two
Three
Four+
One/Den
Two/Den
--
--
--
$625
--
--
--
--
--
--
1,200
--
--
--
--
--
--
$0.52
--
--
--
--
--
--
100.0%
--
--
--
Utilities in Rent:
Heat:
Heat Fuel: Electric
Hot Water:
Cooking:
Electricity:
Wtr/Swr:
Trash:
Community Amenities
Clubhouse:
Comm Rm:
Centrl Lndry:
Fitness:
Hot Tub:
Sauna:
Pool-Outdr:
Playground:
Basketball:
Tennis:
Volleyball:
CarWash:
BusinessCtr:
ComputerCtr:
Floorplans (Published Rents as of 4/11/2017) (2)
Elevator:
0.0% Vacant (0 units vacant) as of 4/11/2017
FeaturesStandard: Dishwasher; Disposal; In Unit Laundry (Hook-ups); Central A/C;
Patio/Balcony
Select Units: --
Optional($): --
Incentives:
None
Security: --
Unit Mix & Effective Rent (1)
Adjustments to Rent
Parking 1: Free Surface Parking
Comments
Parking 2: --
Fee: -- Fee: --
Date %Vac 1BR $ 2BR $ 3BR $
0.0%4/11/17 -- $625 --
0.0%6/22/15 -- $650 --
Description BRs Bath Rent SqFt ProgramRent/SF#UnitsFeature
2 2.5Townhouse $625 1,200 Market$.5265--
© 2017 Real Property Research Group, Inc.
GA115-021494Highland
(1) Effective Rent is Published Rent, net of concessions and assumes that water, sewer and trash is included in rent(2) Published Rent is rent as quoted by management.
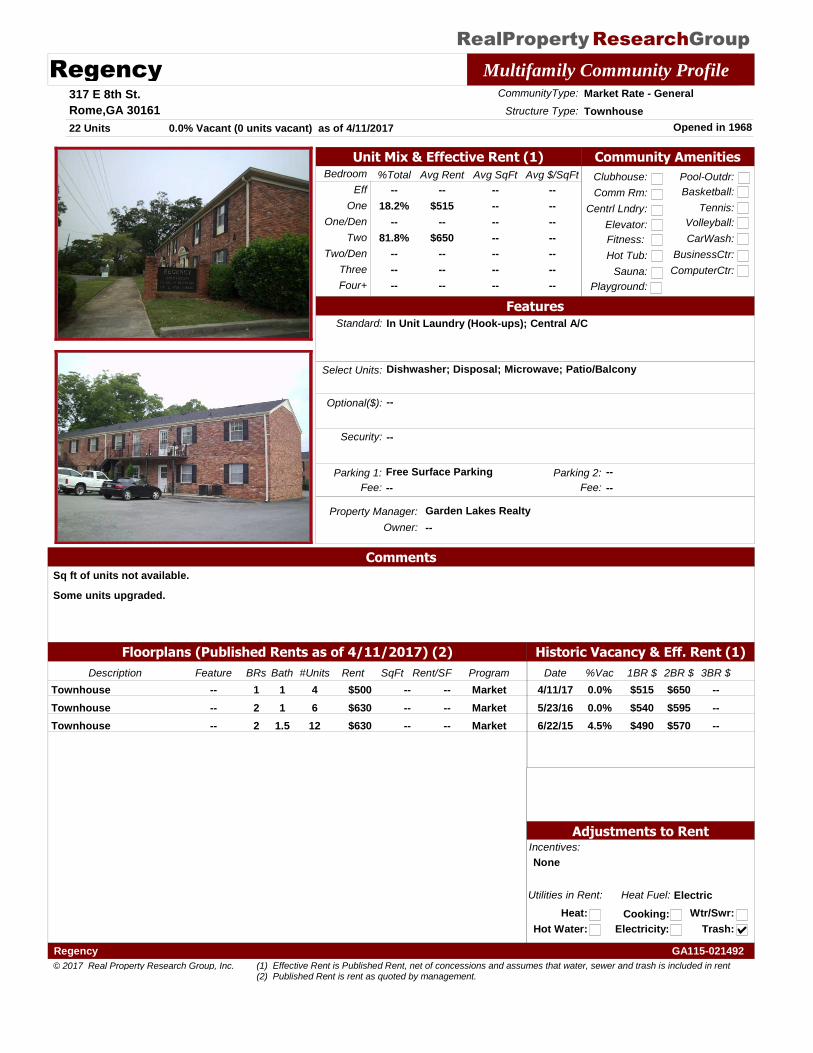
RealProperty GroupResearch
Regency Multifamily Community Profile317 E 8th St.
Rome,GA 30161
Property Manager: Garden Lakes Realty
Opened in 1968
CommunityType: Market Rate - General
22 Units
Structure Type: Townhouse
Owner: --
Historic Vacancy & Eff. Rent (1)
Bedroom Avg $/SqFtAvg SqFt%Total Avg Rent
Eff
One
Two
Three
Four+
One/Den
Two/Den
--
$515
--
$650
--
--
--
--
--
--
--
--
--
--
--
--
--
--
--
--
--
--
18.2%
--
81.8%
--
--
--
Utilities in Rent:
Heat:
Heat Fuel: Electric
Hot Water:
Cooking:
Electricity:
Wtr/Swr:
Trash:
Community Amenities
Clubhouse:
Comm Rm:
Centrl Lndry:
Fitness:
Hot Tub:
Sauna:
Pool-Outdr:
Playground:
Basketball:
Tennis:
Volleyball:
CarWash:
BusinessCtr:
ComputerCtr:
Floorplans (Published Rents as of 4/11/2017) (2)
Elevator:
0.0% Vacant (0 units vacant) as of 4/11/2017
FeaturesStandard: In Unit Laundry (Hook-ups); Central A/C
Select Units: Dishwasher; Disposal; Microwave; Patio/Balcony
Optional($): --
Incentives:
None
Security: --
Unit Mix & Effective Rent (1)
Adjustments to Rent
Parking 1: Free Surface Parking
Comments
Sq ft of units not available.
Some units upgraded.
Parking 2: --
Fee: -- Fee: --
Date %Vac 1BR $ 2BR $ 3BR $
0.0%4/11/17 $515 $650 --
0.0%5/23/16 $540 $595 --
4.5%6/22/15 $490 $570 --
Description BRs Bath Rent SqFt ProgramRent/SF#UnitsFeature
1 1Townhouse $500 -- Market--4--
2 1Townhouse $630 -- Market--6--
2 1.5Townhouse $630 -- Market--12--
© 2017 Real Property Research Group, Inc.
GA115-021492Regency
(1) Effective Rent is Published Rent, net of concessions and assumes that water, sewer and trash is included in rent(2) Published Rent is rent as quoted by management.
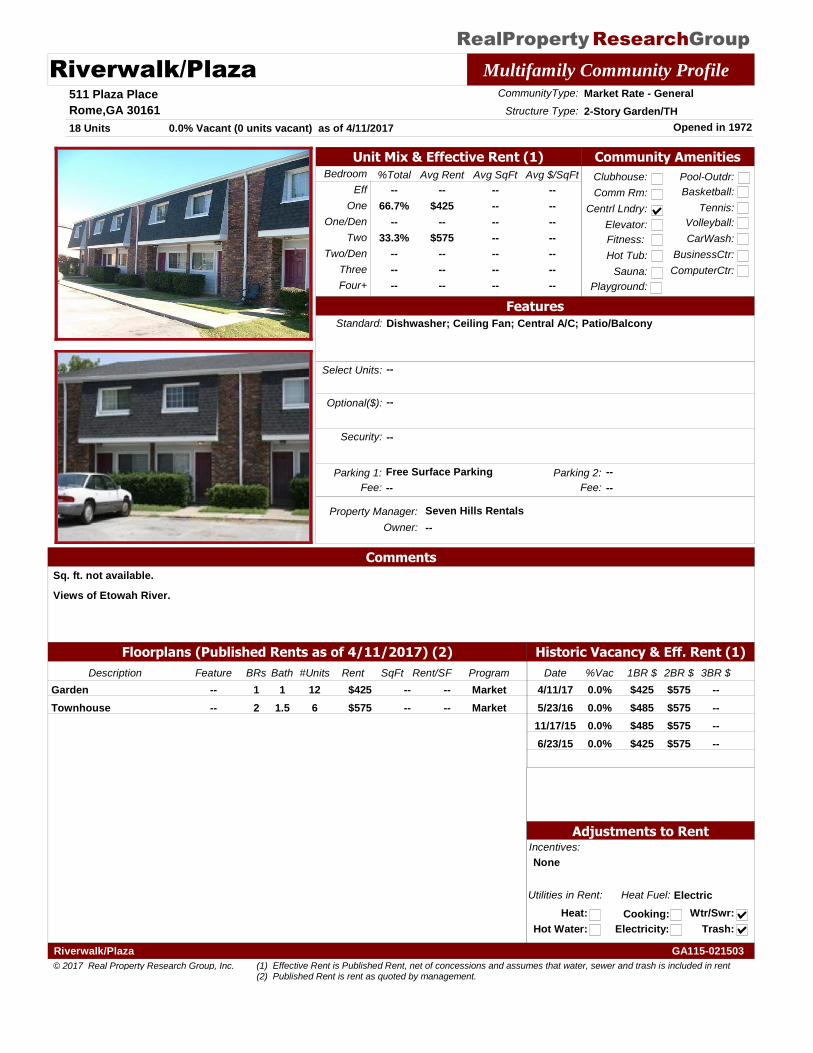
RealProperty GroupResearch
Riverwalk/Plaza Multifamily Community Profile511 Plaza Place
Rome,GA 30161
Property Manager: Seven Hills Rentals
Opened in 1972
CommunityType: Market Rate - General
18 Units
Structure Type: 2-Story Garden/TH
Owner: --
Historic Vacancy & Eff. Rent (1)
Bedroom Avg $/SqFtAvg SqFt%Total Avg Rent
Eff
One
Two
Three
Four+
One/Den
Two/Den
--
$425
--
$575
--
--
--
--
--
--
--
--
--
--
--
--
--
--
--
--
--
--
66.7%
--
33.3%
--
--
--
Utilities in Rent:
Heat:
Heat Fuel: Electric
Hot Water:
Cooking:
Electricity:
Wtr/Swr:
Trash:
Community Amenities
Clubhouse:
Comm Rm:
Centrl Lndry:
Fitness:
Hot Tub:
Sauna:
Pool-Outdr:
Playground:
Basketball:
Tennis:
Volleyball:
CarWash:
BusinessCtr:
ComputerCtr:
Floorplans (Published Rents as of 4/11/2017) (2)
Elevator:
0.0% Vacant (0 units vacant) as of 4/11/2017
FeaturesStandard: Dishwasher; Ceiling Fan; Central A/C; Patio/Balcony
Select Units: --
Optional($): --
Incentives:
None
Security: --
Unit Mix & Effective Rent (1)
Adjustments to Rent
Parking 1: Free Surface Parking
Comments
Sq. ft. not available.
Views of Etowah River.
Parking 2: --
Fee: -- Fee: --
Date %Vac 1BR $ 2BR $ 3BR $
0.0%4/11/17 $425 $575 --
0.0%5/23/16 $485 $575 --
0.0%11/17/15 $485 $575 --
0.0%6/23/15 $425 $575 --
Description BRs Bath Rent SqFt ProgramRent/SF#UnitsFeature
1 1Garden $425 -- Market--12--
2 1.5Townhouse $575 -- Market--6--
© 2017 Real Property Research Group, Inc.
GA115-021503Riverwalk/Plaza
(1) Effective Rent is Published Rent, net of concessions and assumes that water, sewer and trash is included in rent(2) Published Rent is rent as quoted by management.
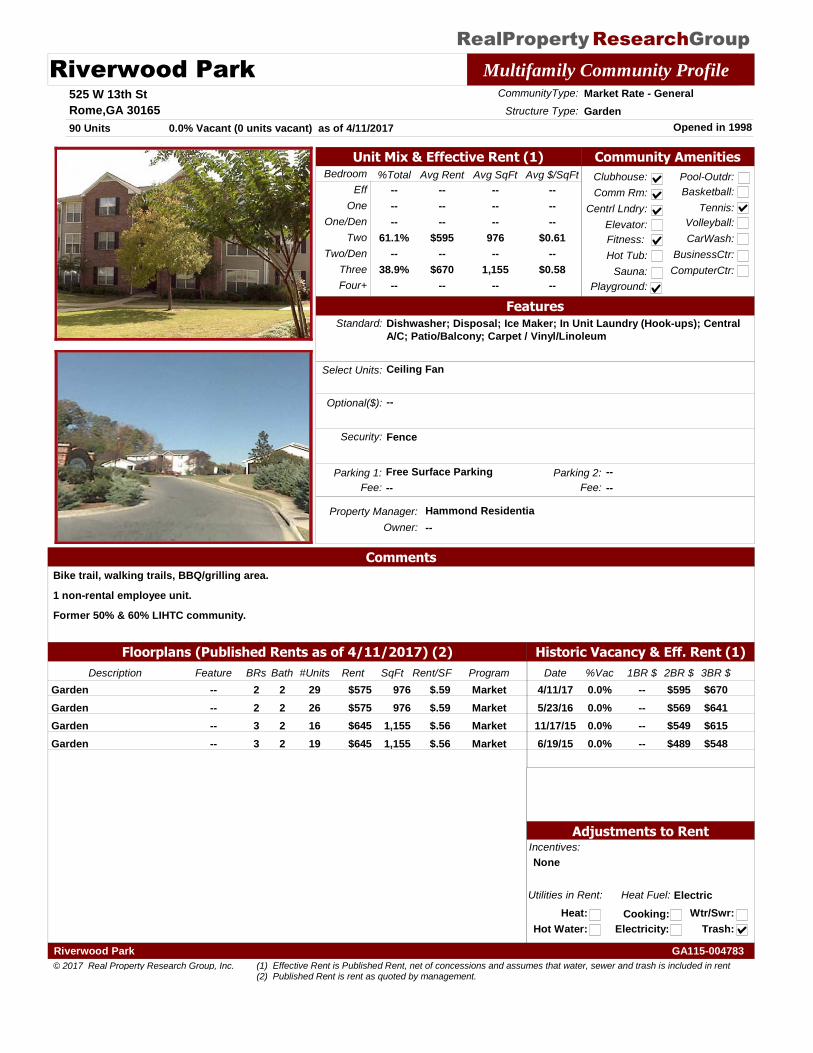
RealProperty GroupResearch
Riverwood Park Multifamily Community Profile525 W 13th St
Rome,GA 30165
Property Manager: Hammond Residentia
Opened in 1998
CommunityType: Market Rate - General
90 Units
Structure Type: Garden
Owner: --
Historic Vacancy & Eff. Rent (1)
Bedroom Avg $/SqFtAvg SqFt%Total Avg Rent
Eff
One
Two
Three
Four+
One/Den
Two/Den
--
--
--
$595
--
$670
--
--
--
--
976
--
1,155
--
--
--
--
$0.61
--
$0.58
--
--
--
--
61.1%
--
38.9%
--
Utilities in Rent:
Heat:
Heat Fuel: Electric
Hot Water:
Cooking:
Electricity:
Wtr/Swr:
Trash:
Community Amenities
Clubhouse:
Comm Rm:
Centrl Lndry:
Fitness:
Hot Tub:
Sauna:
Pool-Outdr:
Playground:
Basketball:
Tennis:
Volleyball:
CarWash:
BusinessCtr:
ComputerCtr:
Floorplans (Published Rents as of 4/11/2017) (2)
Elevator:
0.0% Vacant (0 units vacant) as of 4/11/2017
FeaturesStandard: Dishwasher; Disposal; Ice Maker; In Unit Laundry (Hook-ups); Central
A/C; Patio/Balcony; Carpet / Vinyl/Linoleum
Select Units: Ceiling Fan
Optional($): --
Incentives:
None
Security: Fence
Unit Mix & Effective Rent (1)
Adjustments to Rent
Parking 1: Free Surface Parking
Comments
Bike trail, walking trails, BBQ/grilling area.
1 non-rental employee unit.
Former 50% & 60% LIHTC community.
Parking 2: --
Fee: -- Fee: --
Date %Vac 1BR $ 2BR $ 3BR $
0.0%4/11/17 -- $595 $670
0.0%5/23/16 -- $569 $641
0.0%11/17/15 -- $549 $615
0.0%6/19/15 -- $489 $548
Description BRs Bath Rent SqFt ProgramRent/SF#UnitsFeature
2 2Garden $575 976 Market$.5929--
2 2Garden $575 976 Market$.5926--
3 2Garden $645 1,155 Market$.5616--
3 2Garden $645 1,155 Market$.5619--
© 2017 Real Property Research Group, Inc.
GA115-004783Riverwood Park
(1) Effective Rent is Published Rent, net of concessions and assumes that water, sewer and trash is included in rent(2) Published Rent is rent as quoted by management.
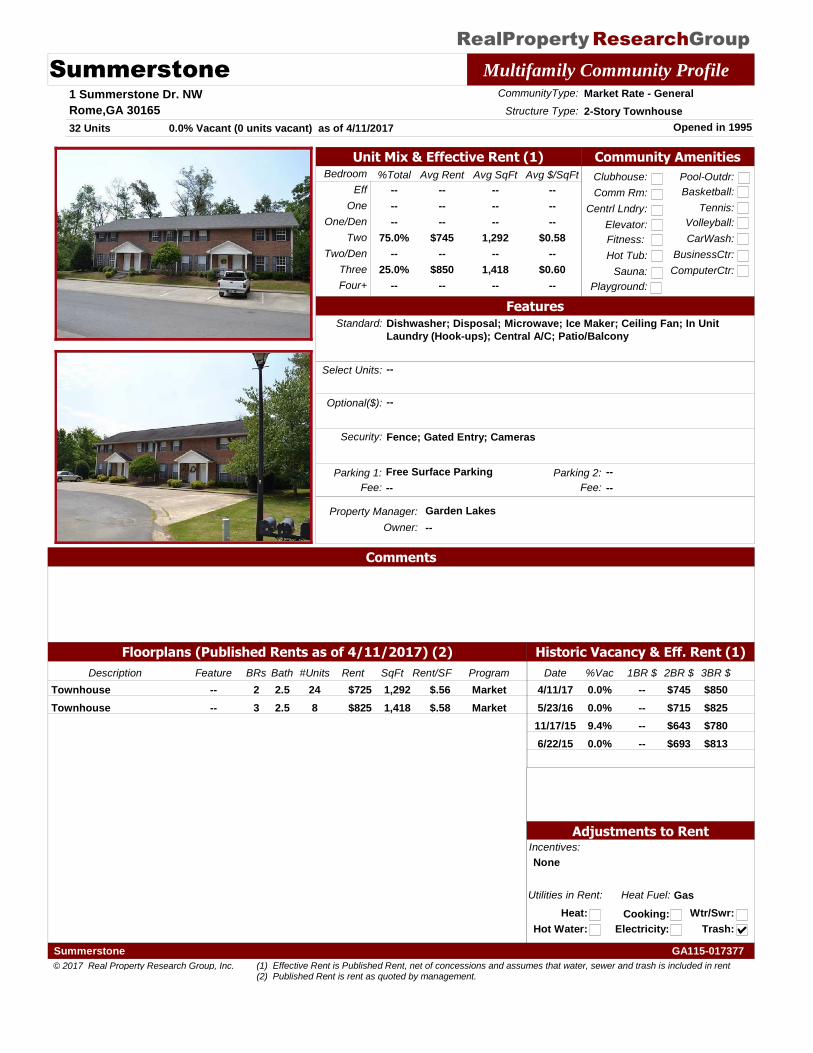
RealProperty GroupResearch
Summerstone Multifamily Community Profile1 Summerstone Dr. NW
Rome,GA 30165
Property Manager: Garden Lakes
Opened in 1995
CommunityType: Market Rate - General
32 Units
Structure Type: 2-Story Townhouse
Owner: --
Historic Vacancy & Eff. Rent (1)
Bedroom Avg $/SqFtAvg SqFt%Total Avg Rent
Eff
One
Two
Three
Four+
One/Den
Two/Den
--
--
--
$745
--
$850
--
--
--
--
1,292
--
1,418
--
--
--
--
$0.58
--
$0.60
--
--
--
--
75.0%
--
25.0%
--
Utilities in Rent:
Heat:
Heat Fuel: Gas
Hot Water:
Cooking:
Electricity:
Wtr/Swr:
Trash:
Community Amenities
Clubhouse:
Comm Rm:
Centrl Lndry:
Fitness:
Hot Tub:
Sauna:
Pool-Outdr:
Playground:
Basketball:
Tennis:
Volleyball:
CarWash:
BusinessCtr:
ComputerCtr:
Floorplans (Published Rents as of 4/11/2017) (2)
Elevator:
0.0% Vacant (0 units vacant) as of 4/11/2017
FeaturesStandard: Dishwasher; Disposal; Microwave; Ice Maker; Ceiling Fan; In Unit
Laundry (Hook-ups); Central A/C; Patio/Balcony
Select Units: --
Optional($): --
Incentives:
None
Security: Fence; Gated Entry; Cameras
Unit Mix & Effective Rent (1)
Adjustments to Rent
Parking 1: Free Surface Parking
Comments
Parking 2: --
Fee: -- Fee: --
Date %Vac 1BR $ 2BR $ 3BR $
0.0%4/11/17 -- $745 $850
0.0%5/23/16 -- $715 $825
9.4%11/17/15 -- $643 $780
0.0%6/22/15 -- $693 $813
Description BRs Bath Rent SqFt ProgramRent/SF#UnitsFeature
2 2.5Townhouse $725 1,292 Market$.5624--
3 2.5Townhouse $825 1,418 Market$.588--
© 2017 Real Property Research Group, Inc.
GA115-017377Summerstone
(1) Effective Rent is Published Rent, net of concessions and assumes that water, sewer and trash is included in rent(2) Published Rent is rent as quoted by management.
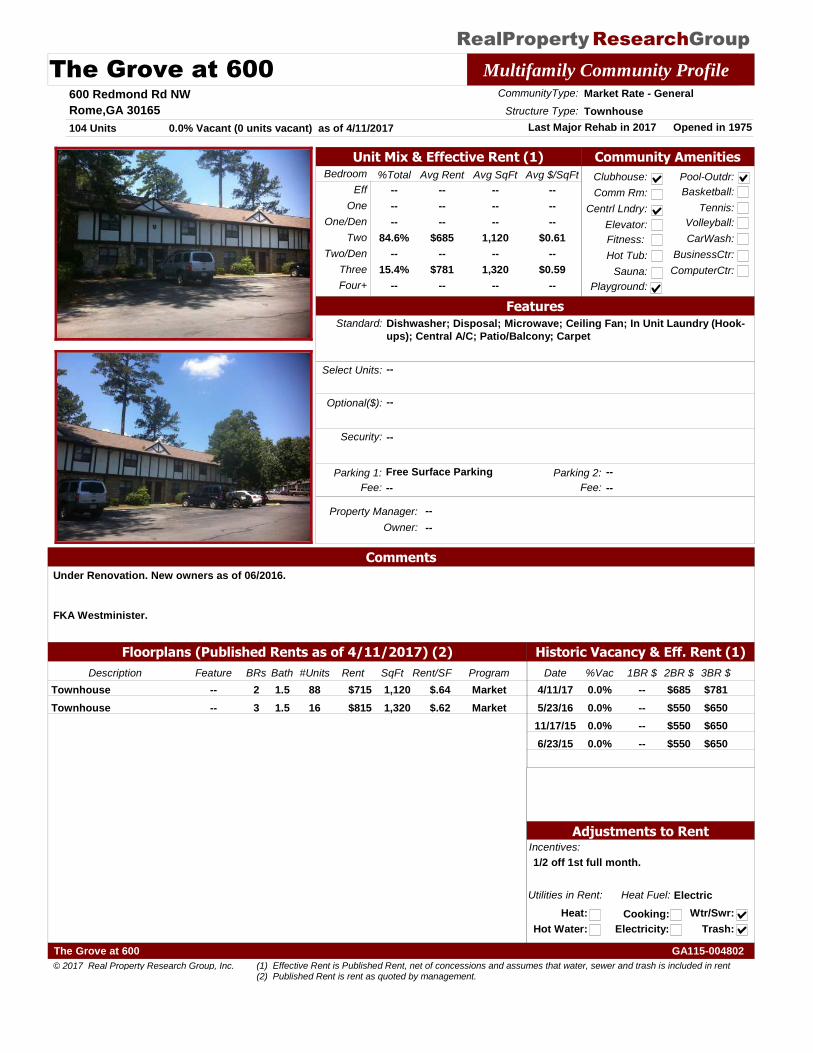
RealProperty GroupResearch
The Grove at 600 Multifamily Community Profile600 Redmond Rd NW
Rome,GA 30165
Property Manager: --
Opened in 1975Last Major Rehab in 2017
CommunityType: Market Rate - General
104 Units
Structure Type: Townhouse
Owner: --
Historic Vacancy & Eff. Rent (1)
Bedroom Avg $/SqFtAvg SqFt%Total Avg Rent
Eff
One
Two
Three
Four+
One/Den
Two/Den
--
--
--
$685
--
$781
--
--
--
--
1,120
--
1,320
--
--
--
--
$0.61
--
$0.59
--
--
--
--
84.6%
--
15.4%
--
Utilities in Rent:
Heat:
Heat Fuel: Electric
Hot Water:
Cooking:
Electricity:
Wtr/Swr:
Trash:
Community Amenities
Clubhouse:
Comm Rm:
Centrl Lndry:
Fitness:
Hot Tub:
Sauna:
Pool-Outdr:
Playground:
Basketball:
Tennis:
Volleyball:
CarWash:
BusinessCtr:
ComputerCtr:
Floorplans (Published Rents as of 4/11/2017) (2)
Elevator:
0.0% Vacant (0 units vacant) as of 4/11/2017
FeaturesStandard: Dishwasher; Disposal; Microwave; Ceiling Fan; In Unit Laundry (Hook-
ups); Central A/C; Patio/Balcony; Carpet
Select Units: --
Optional($): --
Incentives:
1/2 off 1st full month.
Security: --
Unit Mix & Effective Rent (1)
Adjustments to Rent
Parking 1: Free Surface Parking
Comments
Under Renovation. New owners as of 06/2016.
FKA Westminister.
Parking 2: --
Fee: -- Fee: --
Date %Vac 1BR $ 2BR $ 3BR $
0.0%4/11/17 -- $685 $781
0.0%5/23/16 -- $550 $650
0.0%11/17/15 -- $550 $650
0.0%6/23/15 -- $550 $650
Description BRs Bath Rent SqFt ProgramRent/SF#UnitsFeature
2 1.5Townhouse $715 1,120 Market$.6488--
3 1.5Townhouse $815 1,320 Market$.6216--
© 2017 Real Property Research Group, Inc.
GA115-004802The Grove at 600
(1) Effective Rent is Published Rent, net of concessions and assumes that water, sewer and trash is included in rent(2) Published Rent is rent as quoted by management.
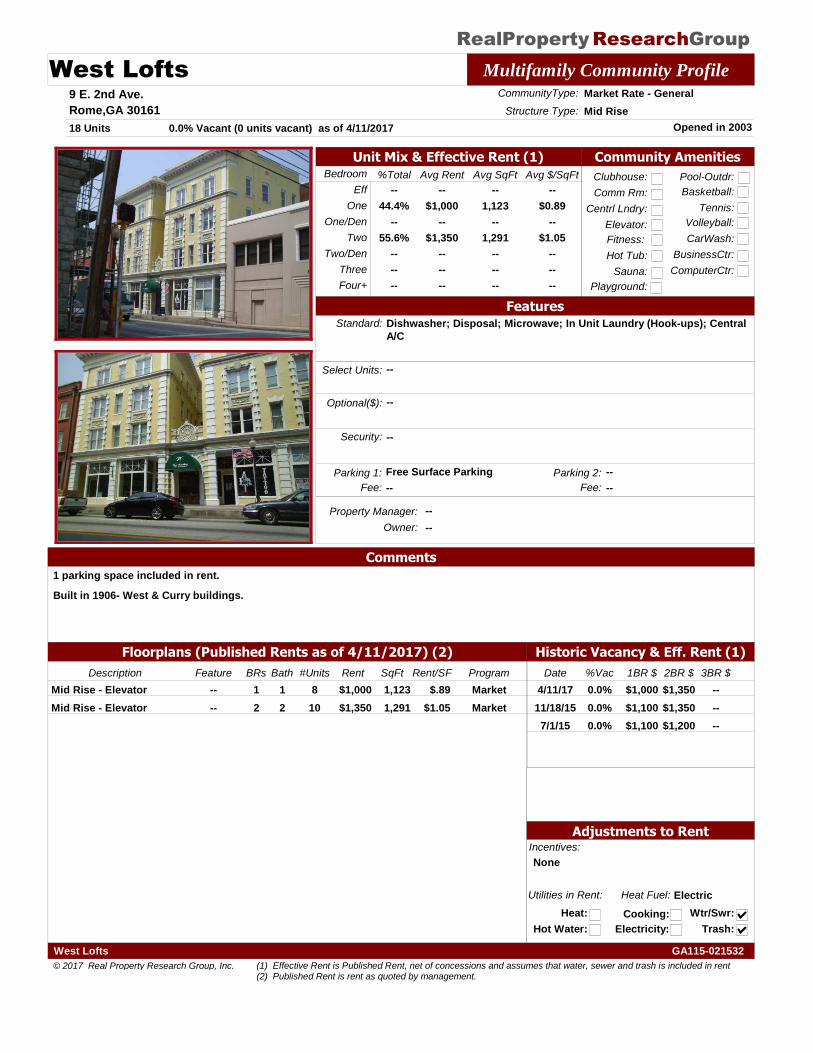
RealProperty GroupResearch
West Lofts Multifamily Community Profile9 E. 2nd Ave.
Rome,GA 30161
Property Manager: --
Opened in 2003
CommunityType: Market Rate - General
18 Units
Structure Type: Mid Rise
Owner: --
Historic Vacancy & Eff. Rent (1)
Bedroom Avg $/SqFtAvg SqFt%Total Avg Rent
Eff
One
Two
Three
Four+
One/Den
Two/Den
--
$1,000
--
$1,350
--
--
--
--
1,123
--
1,291
--
--
--
--
$0.89
--
$1.05
--
--
--
--
44.4%
--
55.6%
--
--
--
Utilities in Rent:
Heat:
Heat Fuel: Electric
Hot Water:
Cooking:
Electricity:
Wtr/Swr:
Trash:
Community Amenities
Clubhouse:
Comm Rm:
Centrl Lndry:
Fitness:
Hot Tub:
Sauna:
Pool-Outdr:
Playground:
Basketball:
Tennis:
Volleyball:
CarWash:
BusinessCtr:
ComputerCtr:
Floorplans (Published Rents as of 4/11/2017) (2)
Elevator:
0.0% Vacant (0 units vacant) as of 4/11/2017
FeaturesStandard: Dishwasher; Disposal; Microwave; In Unit Laundry (Hook-ups); Central
A/C
Select Units: --
Optional($): --
Incentives:
None
Security: --
Unit Mix & Effective Rent (1)
Adjustments to Rent
Parking 1: Free Surface Parking
Comments
1 parking space included in rent.
Built in 1906- West & Curry buildings.
Parking 2: --
Fee: -- Fee: --
Date %Vac 1BR $ 2BR $ 3BR $
0.0%4/11/17 $1,000 $1,350 --
0.0%11/18/15 $1,100 $1,350 --
0.0%7/1/15 $1,100 $1,200 --
Description BRs Bath Rent SqFt ProgramRent/SF#UnitsFeature
1 1Mid Rise - Elevator $1,000 1,123 Market$.898--
2 2Mid Rise - Elevator $1,350 1,291 Market$1.0510--
© 2017 Real Property Research Group, Inc.
GA115-021532West Lofts
(1) Effective Rent is Published Rent, net of concessions and assumes that water, sewer and trash is included in rent(2) Published Rent is rent as quoted by management.
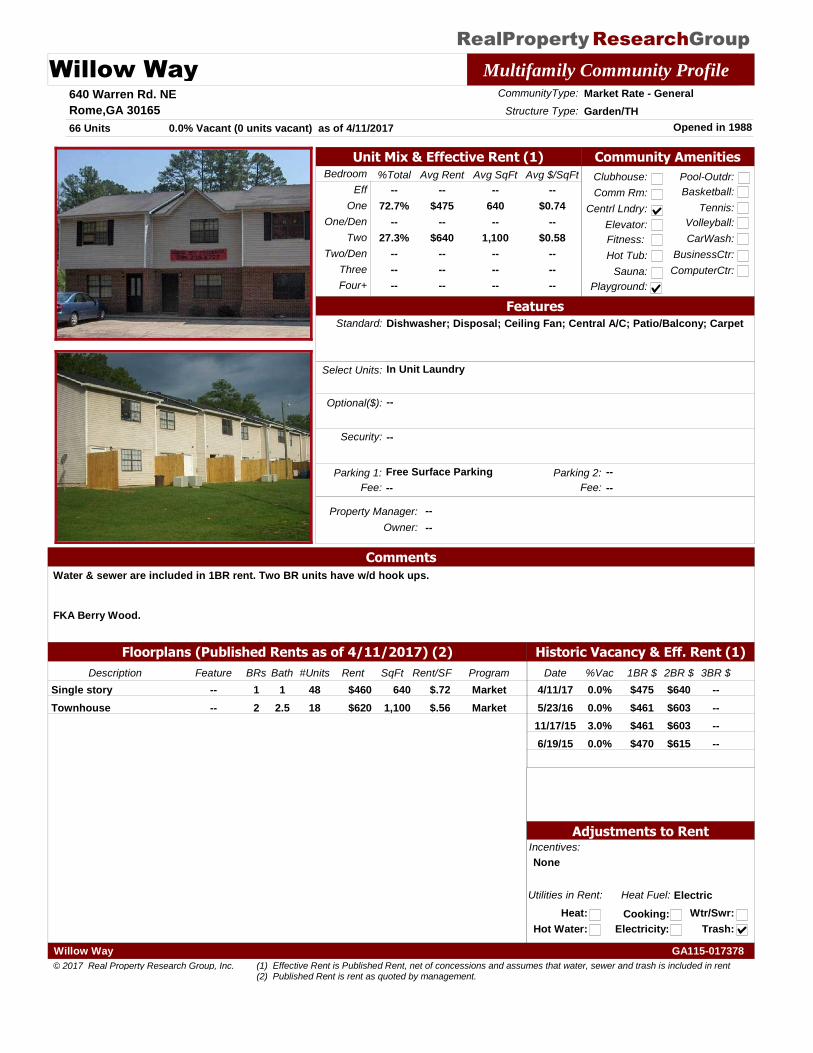
RealProperty GroupResearch
Willow Way Multifamily Community Profile640 Warren Rd. NE
Rome,GA 30165
Property Manager: --
Opened in 1988
CommunityType: Market Rate - General
66 Units
Structure Type: Garden/TH
Owner: --
Historic Vacancy & Eff. Rent (1)
Bedroom Avg $/SqFtAvg SqFt%Total Avg Rent
Eff
One
Two
Three
Four+
One/Den
Two/Den
--
$475
--
$640
--
--
--
--
640
--
1,100
--
--
--
--
$0.74
--
$0.58
--
--
--
--
72.7%
--
27.3%
--
--
--
Utilities in Rent:
Heat:
Heat Fuel: Electric
Hot Water:
Cooking:
Electricity:
Wtr/Swr:
Trash:
Community Amenities
Clubhouse:
Comm Rm:
Centrl Lndry:
Fitness:
Hot Tub:
Sauna:
Pool-Outdr:
Playground:
Basketball:
Tennis:
Volleyball:
CarWash:
BusinessCtr:
ComputerCtr:
Floorplans (Published Rents as of 4/11/2017) (2)
Elevator:
0.0% Vacant (0 units vacant) as of 4/11/2017
FeaturesStandard: Dishwasher; Disposal; Ceiling Fan; Central A/C; Patio/Balcony; Carpet
Select Units: In Unit Laundry
Optional($): --
Incentives:
None
Security: --
Unit Mix & Effective Rent (1)
Adjustments to Rent
Parking 1: Free Surface Parking
Comments
Water & sewer are included in 1BR rent. Two BR units have w/d hook ups.
FKA Berry Wood.
Parking 2: --
Fee: -- Fee: --
Date %Vac 1BR $ 2BR $ 3BR $
0.0%4/11/17 $475 $640 --
0.0%5/23/16 $461 $603 --
3.0%11/17/15 $461 $603 --
0.0%6/19/15 $470 $615 --
Description BRs Bath Rent SqFt ProgramRent/SF#UnitsFeature
1 1Single story $460 640 Market$.7248--
2 2.5Townhouse $620 1,100 Market$.5618--
© 2017 Real Property Research Group, Inc.
GA115-017378Willow Way
(1) Effective Rent is Published Rent, net of concessions and assumes that water, sewer and trash is included in rent(2) Published Rent is rent as quoted by management.
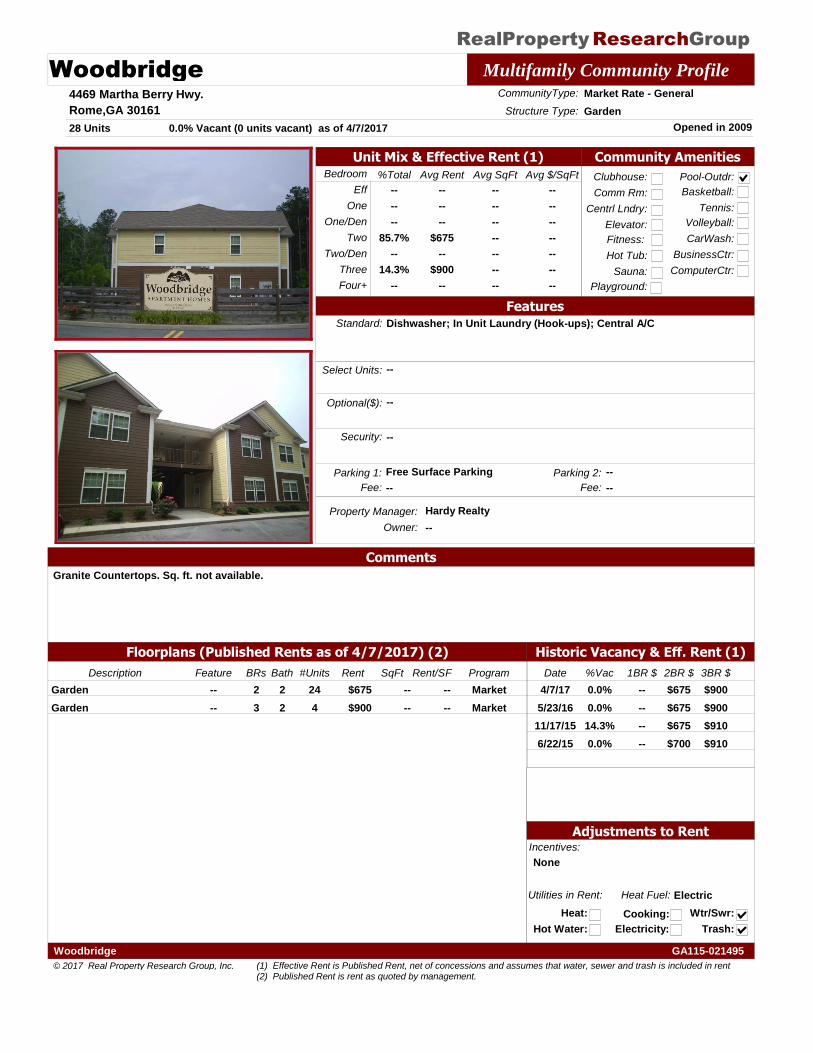
RealProperty GroupResearch
Woodbridge Multifamily Community Profile4469 Martha Berry Hwy.
Rome,GA 30161
Property Manager: Hardy Realty
Opened in 2009
CommunityType: Market Rate - General
28 Units
Structure Type: Garden
Owner: --
Historic Vacancy & Eff. Rent (1)
Bedroom Avg $/SqFtAvg SqFt%Total Avg Rent
Eff
One
Two
Three
Four+
One/Den
Two/Den
--
--
--
$675
--
$900
--
--
--
--
--
--
--
--
--
--
--
--
--
--
--
--
--
--
85.7%
--
14.3%
--
Utilities in Rent:
Heat:
Heat Fuel: Electric
Hot Water:
Cooking:
Electricity:
Wtr/Swr:
Trash:
Community Amenities
Clubhouse:
Comm Rm:
Centrl Lndry:
Fitness:
Hot Tub:
Sauna:
Pool-Outdr:
Playground:
Basketball:
Tennis:
Volleyball:
CarWash:
BusinessCtr:
ComputerCtr:
Floorplans (Published Rents as of 4/7/2017) (2)
Elevator:
0.0% Vacant (0 units vacant) as of 4/7/2017
FeaturesStandard: Dishwasher; In Unit Laundry (Hook-ups); Central A/C
Select Units: --
Optional($): --
Incentives:
None
Security: --
Unit Mix & Effective Rent (1)
Adjustments to Rent
Parking 1: Free Surface Parking
Comments
Granite Countertops. Sq. ft. not available.
Parking 2: --
Fee: -- Fee: --
Date %Vac 1BR $ 2BR $ 3BR $
0.0%4/7/17 -- $675 $900
0.0%5/23/16 -- $675 $900
14.3%11/17/15 -- $675 $910
0.0%6/22/15 -- $700 $910
Description BRs Bath Rent SqFt ProgramRent/SF#UnitsFeature
2 2Garden $675 -- Market--24--
3 2Garden $900 -- Market--4--
© 2017 Real Property Research Group, Inc.
GA115-021495Woodbridge
(1) Effective Rent is Published Rent, net of concessions and assumes that water, sewer and trash is included in rent(2) Published Rent is rent as quoted by management.
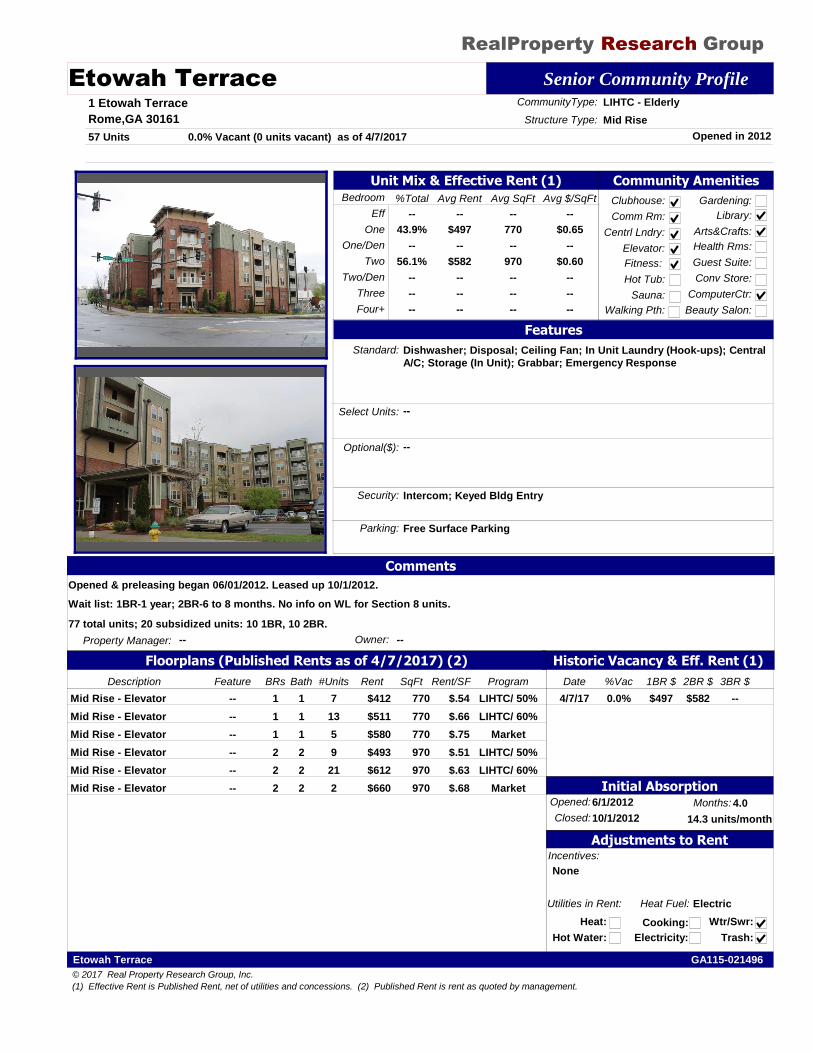
RealProperty Research Group
Etowah Terrace Senior Community Profile1 Etowah Terrace
Rome,GA 30161
Property Manager: --
Opened in 2012
CommunityType: LIHTC - Elderly
57 Units
Structure Type: Mid Rise
Owner: --
Historic Vacancy & Eff. Rent (1)
Bedroom Avg $/SqFtAvg SqFt%Total Avg Rent
Eff
One
Two
Three
Four+
One/Den
Two/Den
--
$497
--
$582
--
--
--
--
770
--
970
--
--
--
--
$0.65
--
$0.60
--
--
--
--
43.9%
--
56.1%
--
--
--
Utilities in Rent:
Heat:
Heat Fuel: Electric
Hot Water:
Cooking:
Electricity:
Wtr/Swr:
Trash:
Community Amenities
Clubhouse:
Comm Rm:
Centrl Lndry:
Fitness:
Hot Tub:
Sauna:
Gardening:
Walking Pth:
Library:
Arts&Crafts:
Health Rms:
Guest Suite:
Conv Store:
ComputerCtr:
Floorplans (Published Rents as of 4/7/2017) (2)
Elevator:
0.0% Vacant (0 units vacant) as of 4/7/2017
Features
Standard: Dishwasher; Disposal; Ceiling Fan; In Unit Laundry (Hook-ups); CentralA/C; Storage (In Unit); Grabbar; Emergency Response
Select Units: --
Optional($): --
Incentives:
None
Security: Intercom; Keyed Bldg Entry
Unit Mix & Effective Rent (1)
Opened:6/1/2012
Initial Absorption
Closed:10/1/2012
Months: 4.0
14.3 units/month
Adjustments to Rent
Parking: Free Surface Parking
Comments
Opened & preleasing began 06/01/2012. Leased up 10/1/2012.
Wait list: 1BR-1 year; 2BR-6 to 8 months. No info on WL for Section 8 units.
77 total units; 20 subsidized units: 10 1BR, 10 2BR.
Beauty Salon:
Date %Vac 1BR $ 2BR $ 3BR $
0.0%4/7/17 $497 $582 --
Description BRs Bath Rent SqFt ProgramRent/SF#UnitsFeature
1 1Mid Rise - Elevator $412 770 LIHTC/ 50%$.547--
1 1Mid Rise - Elevator $511 770 LIHTC/ 60%$.6613--
1 1Mid Rise - Elevator $580 770 Market$.755--
2 2Mid Rise - Elevator $493 970 LIHTC/ 50%$.519--
2 2Mid Rise - Elevator $612 970 LIHTC/ 60%$.6321--
2 2Mid Rise - Elevator $660 970 Market$.682--
© 2017 Real Property Research Group, Inc.
GA115-021496Etowah Terrace
(1) Effective Rent is Published Rent, net of utilities and concessions. (2) Published Rent is rent as quoted by management.
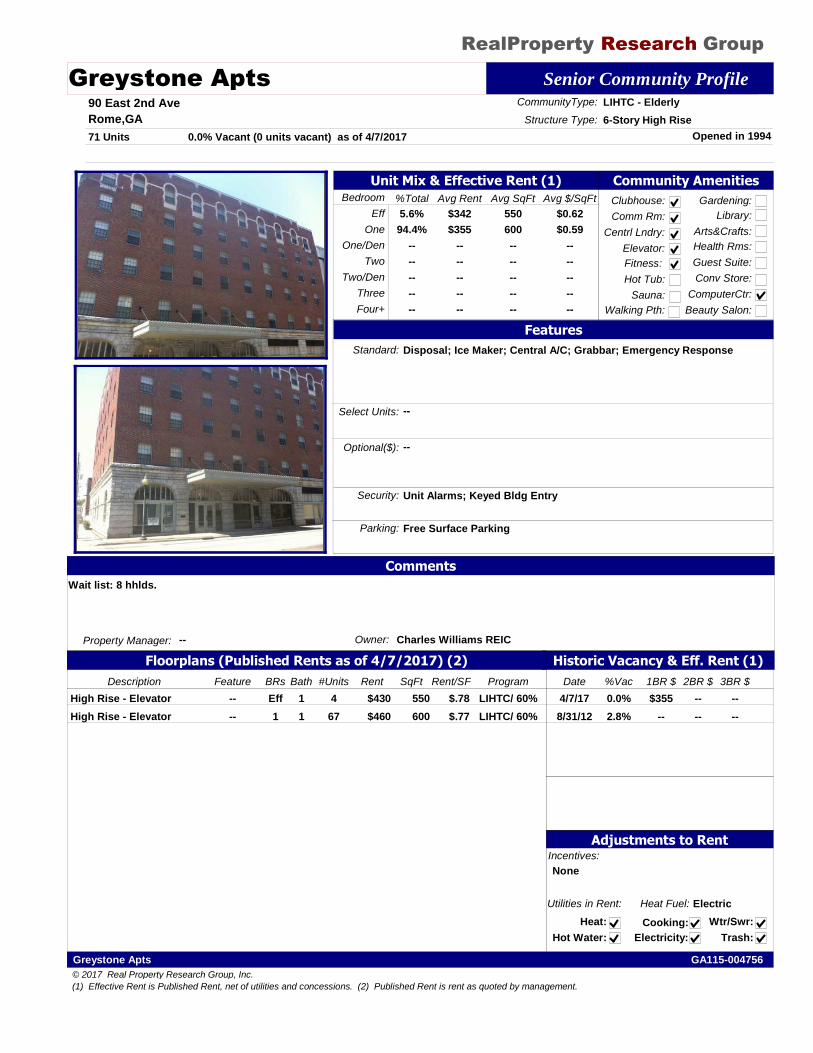
RealProperty Research Group
Greystone Apts Senior Community Profile90 East 2nd Ave
Rome,GA
Property Manager: --
Opened in 1994
CommunityType: LIHTC - Elderly
71 Units
Structure Type: 6-Story High Rise
Owner: Charles Williams REIC
Historic Vacancy & Eff. Rent (1)
Bedroom Avg $/SqFtAvg SqFt%Total Avg Rent
Eff
One
Two
Three
Four+
One/Den
Two/Den
$342
$355
--
--
--
--
--
550
600
--
--
--
--
--
$0.62
$0.59
--
--
--
--
--
5.6%
94.4%
--
--
--
--
--
Utilities in Rent:
Heat:
Heat Fuel: Electric
Hot Water:
Cooking:
Electricity:
Wtr/Swr:
Trash:
Community Amenities
Clubhouse:
Comm Rm:
Centrl Lndry:
Fitness:
Hot Tub:
Sauna:
Gardening:
Walking Pth:
Library:
Arts&Crafts:
Health Rms:
Guest Suite:
Conv Store:
ComputerCtr:
Floorplans (Published Rents as of 4/7/2017) (2)
Elevator:
0.0% Vacant (0 units vacant) as of 4/7/2017
Features
Standard: Disposal; Ice Maker; Central A/C; Grabbar; Emergency Response
Select Units: --
Optional($): --
Incentives:
None
Security: Unit Alarms; Keyed Bldg Entry
Unit Mix & Effective Rent (1)
Adjustments to Rent
Parking: Free Surface Parking
Comments
Wait list: 8 hhlds.
Beauty Salon:
Date %Vac 1BR $ 2BR $ 3BR $
0.0%4/7/17 $355 -- --
2.8%8/31/12 -- -- --
Description BRs Bath Rent SqFt ProgramRent/SF#UnitsFeature
Eff 1High Rise - Elevator $430 550 LIHTC/ 60%$.784--
1 1High Rise - Elevator $460 600 LIHTC/ 60%$.7767--
© 2017 Real Property Research Group, Inc.
GA115-004756Greystone Apts
(1) Effective Rent is Published Rent, net of utilities and concessions. (2) Published Rent is rent as quoted by management.
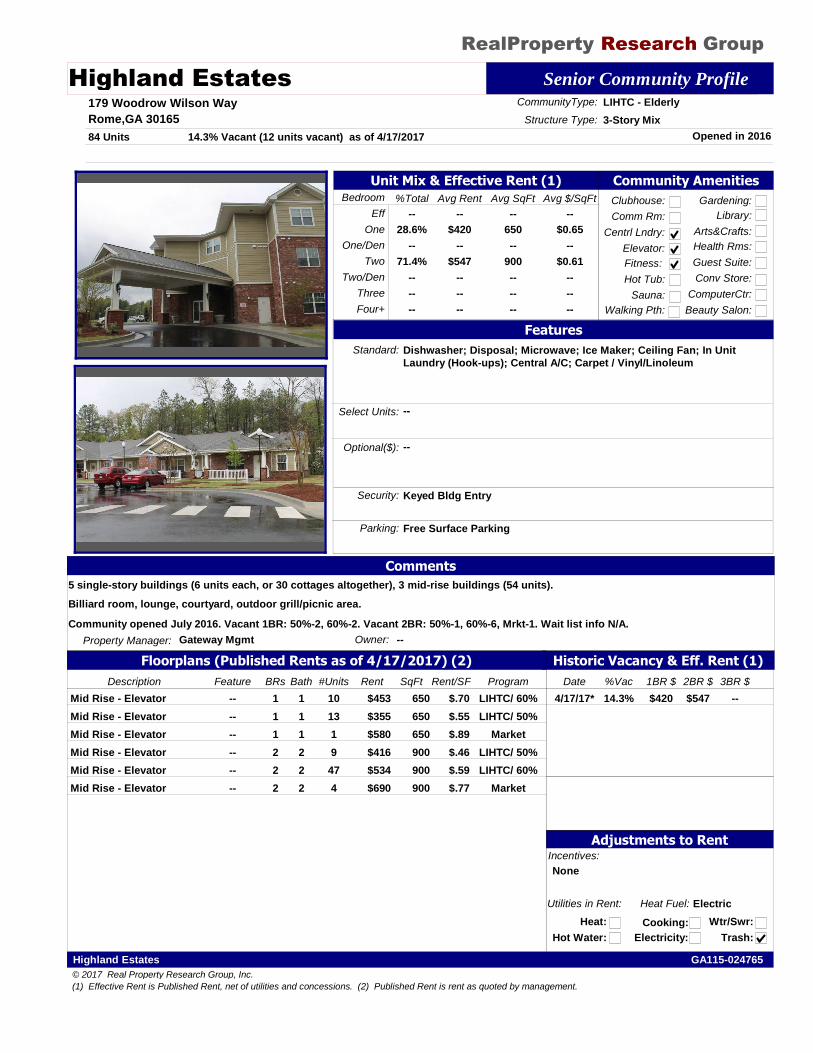
RealProperty Research Group
Highland Estates Senior Community Profile179 Woodrow Wilson Way
Rome,GA 30165
Property Manager: Gateway Mgmt
Opened in 2016
CommunityType: LIHTC - Elderly
84 Units
Structure Type: 3-Story Mix
Owner: --
Historic Vacancy & Eff. Rent (1)
Bedroom Avg $/SqFtAvg SqFt%Total Avg Rent
Eff
One
Two
Three
Four+
One/Den
Two/Den
--
$420
--
$547
--
--
--
--
650
--
900
--
--
--
--
$0.65
--
$0.61
--
--
--
--
28.6%
--
71.4%
--
--
--
Utilities in Rent:
Heat:
Heat Fuel: Electric
Hot Water:
Cooking:
Electricity:
Wtr/Swr:
Trash:
Community Amenities
Clubhouse:
Comm Rm:
Centrl Lndry:
Fitness:
Hot Tub:
Sauna:
Gardening:
Walking Pth:
Library:
Arts&Crafts:
Health Rms:
Guest Suite:
Conv Store:
ComputerCtr:
Floorplans (Published Rents as of 4/17/2017) (2)
Elevator:
14.3% Vacant (12 units vacant) as of 4/17/2017
Features
Standard: Dishwasher; Disposal; Microwave; Ice Maker; Ceiling Fan; In UnitLaundry (Hook-ups); Central A/C; Carpet / Vinyl/Linoleum
Select Units: --
Optional($): --
Incentives:
None
Security: Keyed Bldg Entry
Unit Mix & Effective Rent (1)
Adjustments to Rent
Parking: Free Surface Parking
Comments
5 single-story buildings (6 units each, or 30 cottages altogether), 3 mid-rise buildings (54 units).
Billiard room, lounge, courtyard, outdoor grill/picnic area.
Community opened July 2016. Vacant 1BR: 50%-2, 60%-2. Vacant 2BR: 50%-1, 60%-6, Mrkt-1. Wait list info N/A.
Beauty Salon:
Date %Vac 1BR $ 2BR $ 3BR $
14.3%4/17/17* $420 $547 --
Description BRs Bath Rent SqFt ProgramRent/SF#UnitsFeature
1 1Mid Rise - Elevator $453 650 LIHTC/ 60%$.7010--
1 1Mid Rise - Elevator $355 650 LIHTC/ 50%$.5513--
1 1Mid Rise - Elevator $580 650 Market$.891--
2 2Mid Rise - Elevator $416 900 LIHTC/ 50%$.469--
2 2Mid Rise - Elevator $534 900 LIHTC/ 60%$.5947--
2 2Mid Rise - Elevator $690 900 Market$.774--
© 2017 Real Property Research Group, Inc.
GA115-024765Highland Estates
(1) Effective Rent is Published Rent, net of utilities and concessions. (2) Published Rent is rent as quoted by management.

High Rise Senior Apartments | Appendix 8 Tenant Relocation Spreadsheet
Page 84
16. APPENDIX 8 TENANT RELOCATION SPREADSHEET
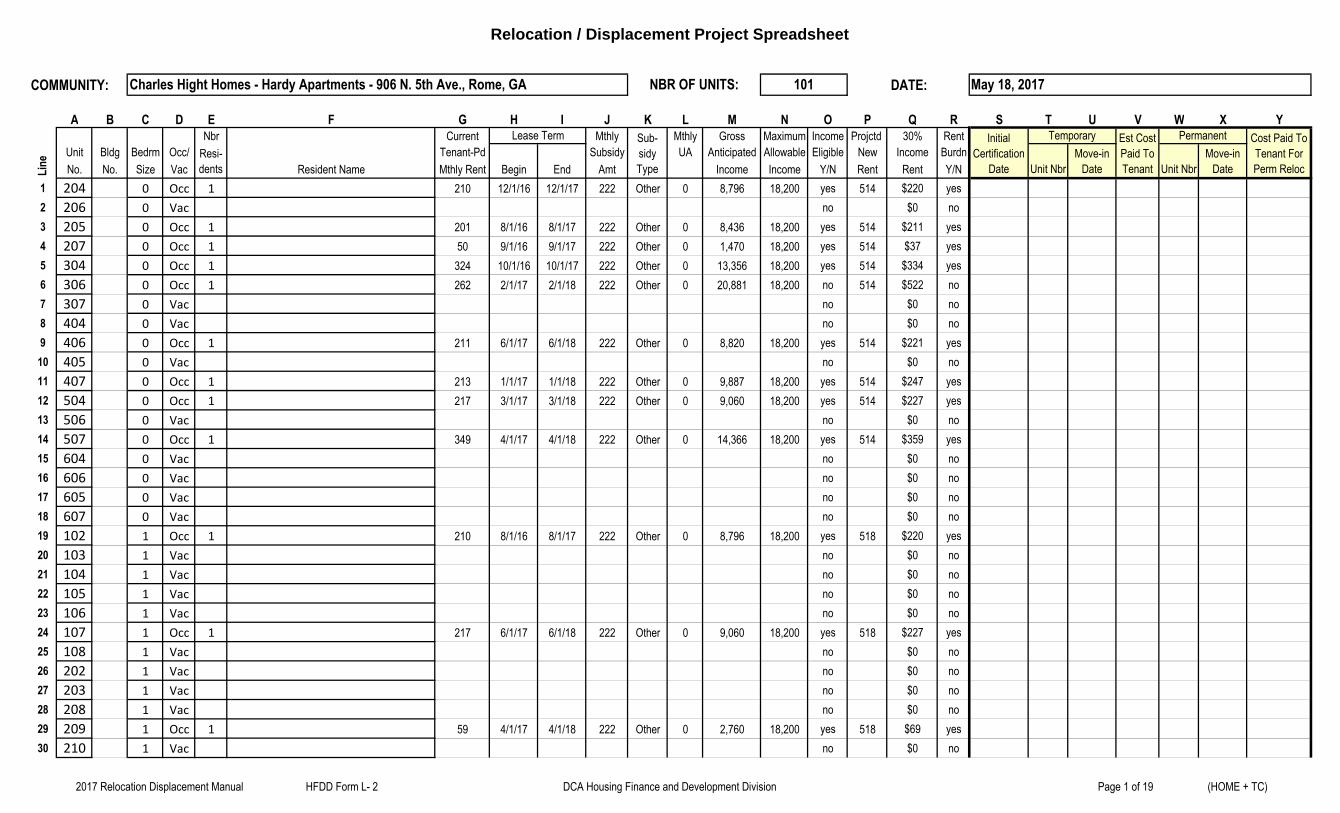
Relocation / Displacement Project Spreadsheet
COMMUNITY: DATE:
A B C D E F G H I J K L M N O P Q R S T U V W X YNbr Current Mthly Mthly Gross Maximum Income Projctd 30% Rent
Unit Bldg Bedrm Occ/ Tenant-Pd Subsidy UA Anticipated Allowable Eligible New Income Burdn
No. No. Size Vac Resident Name Mthly Rent Begin End Amt Income Income Y/N Rent Rent Y/N
1 204 0 Occ 1 210 12/1/16 12/1/17 222 Other 0 8,796 18,200 yes 514 $220 yes
2 206 0 Vac no $0 no
3 205 0 Occ 1 201 8/1/16 8/1/17 222 Other 0 8,436 18,200 yes 514 $211 yes
4 207 0 Occ 1 50 9/1/16 9/1/17 222 Other 0 1,470 18,200 yes 514 $37 yes
5 304 0 Occ 1 324 10/1/16 10/1/17 222 Other 0 13,356 18,200 yes 514 $334 yes
6 306 0 Occ 1 262 2/1/17 2/1/18 222 Other 0 20,881 18,200 no 514 $522 no
7 307 0 Vac no $0 no
8 404 0 Vac no $0 no
9 406 0 Occ 1 211 6/1/17 6/1/18 222 Other 0 8,820 18,200 yes 514 $221 yes
10 405 0 Vac no $0 no
11 407 0 Occ 1 213 1/1/17 1/1/18 222 Other 0 9,887 18,200 yes 514 $247 yes
12 504 0 Occ 1 217 3/1/17 3/1/18 222 Other 0 9,060 18,200 yes 514 $227 yes
13 506 0 Vac no $0 no
14 507 0 Occ 1 349 4/1/17 4/1/18 222 Other 0 14,366 18,200 yes 514 $359 yes
15 604 0 Vac no $0 no
16 606 0 Vac no $0 no
17 605 0 Vac no $0 no
18 607 0 Vac no $0 no
19 102 1 Occ 1 210 8/1/16 8/1/17 222 Other 0 8,796 18,200 yes 518 $220 yes
20 103 1 Vac no $0 no
21 104 1 Vac no $0 no
22 105 1 Vac no $0 no
23 106 1 Vac no $0 no
24 107 1 Occ 1 217 6/1/17 6/1/18 222 Other 0 9,060 18,200 yes 518 $227 yes
25 108 1 Vac no $0 no
26 202 1 Vac no $0 no
27 203 1 Vac no $0 no
28 208 1 Vac no $0 no
29 209 1 Occ 1 59 4/1/17 4/1/18 222 Other 0 2,760 18,200 yes 518 $69 yes
30 210 1 Vac no $0 no
Move-in
Date
Charles Hight Homes - Hardy Apartments - 906 N. 5th Ave., Rome, GA NBR OF UNITS: 101 May 18, 2017
Est Cost
Paid To
Tenant
Permanent Cost Paid To
Tenant For
Perm RelocUnit NbrLin
e
Lease Term Sub-
sidy
Type
Initial
Certification
Date
Temporaryof
Resi-
dents Unit Nbr
Move-in
Date
2017 Relocation Displacement Manual HFDD Form L- 2 DCA Housing Finance and Development Division Page 1 of 19 (HOME + TC)
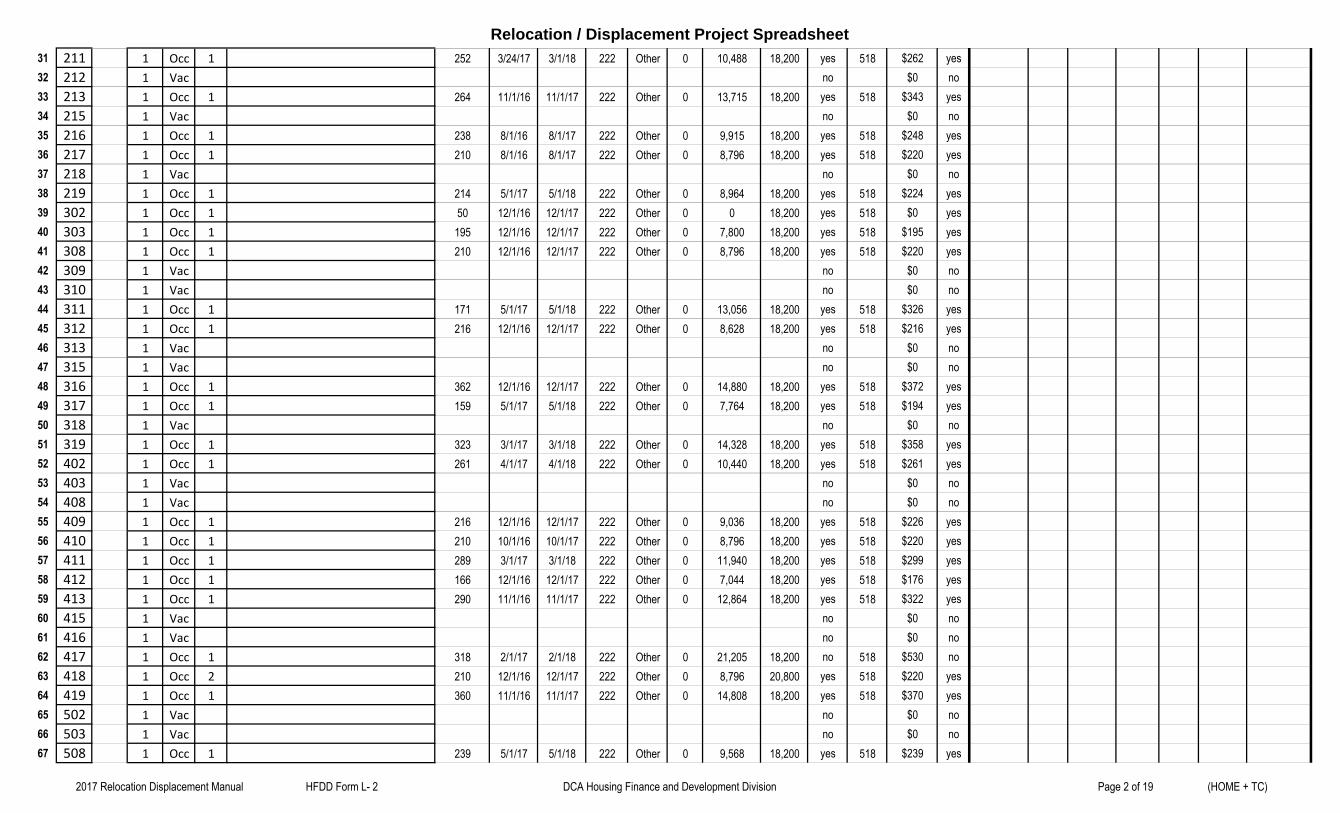
Relocation / Displacement Project Spreadsheet
31 211 1 Occ 1 252 3/24/17 3/1/18 222 Other 0 10,488 18,200 yes 518 $262 yes
32 212 1 Vac no $0 no
33 213 1 Occ 1 264 11/1/16 11/1/17 222 Other 0 13,715 18,200 yes 518 $343 yes
34 215 1 Vac no $0 no
35 216 1 Occ 1 238 8/1/16 8/1/17 222 Other 0 9,915 18,200 yes 518 $248 yes
36 217 1 Occ 1 210 8/1/16 8/1/17 222 Other 0 8,796 18,200 yes 518 $220 yes
37 218 1 Vac no $0 no
38 219 1 Occ 1 214 5/1/17 5/1/18 222 Other 0 8,964 18,200 yes 518 $224 yes
39 302 1 Occ 1 50 12/1/16 12/1/17 222 Other 0 0 18,200 yes 518 $0 yes
40 303 1 Occ 1 195 12/1/16 12/1/17 222 Other 0 7,800 18,200 yes 518 $195 yes
41 308 1 Occ 1 210 12/1/16 12/1/17 222 Other 0 8,796 18,200 yes 518 $220 yes
42 309 1 Vac no $0 no
43 310 1 Vac no $0 no
44 311 1 Occ 1 171 5/1/17 5/1/18 222 Other 0 13,056 18,200 yes 518 $326 yes
45 312 1 Occ 1 216 12/1/16 12/1/17 222 Other 0 8,628 18,200 yes 518 $216 yes
46 313 1 Vac no $0 no
47 315 1 Vac no $0 no
48 316 1 Occ 1 362 12/1/16 12/1/17 222 Other 0 14,880 18,200 yes 518 $372 yes
49 317 1 Occ 1 159 5/1/17 5/1/18 222 Other 0 7,764 18,200 yes 518 $194 yes
50 318 1 Vac no $0 no
51 319 1 Occ 1 323 3/1/17 3/1/18 222 Other 0 14,328 18,200 yes 518 $358 yes
52 402 1 Occ 1 261 4/1/17 4/1/18 222 Other 0 10,440 18,200 yes 518 $261 yes
53 403 1 Vac no $0 no
54 408 1 Vac no $0 no
55 409 1 Occ 1 216 12/1/16 12/1/17 222 Other 0 9,036 18,200 yes 518 $226 yes
56 410 1 Occ 1 210 10/1/16 10/1/17 222 Other 0 8,796 18,200 yes 518 $220 yes
57 411 1 Occ 1 289 3/1/17 3/1/18 222 Other 0 11,940 18,200 yes 518 $299 yes
58 412 1 Occ 1 166 12/1/16 12/1/17 222 Other 0 7,044 18,200 yes 518 $176 yes
59 413 1 Occ 1 290 11/1/16 11/1/17 222 Other 0 12,864 18,200 yes 518 $322 yes
60 415 1 Vac no $0 no
61 416 1 Vac no $0 no
62 417 1 Occ 1 318 2/1/17 2/1/18 222 Other 0 21,205 18,200 no 518 $530 no
63 418 1 Occ 2 210 12/1/16 12/1/17 222 Other 0 8,796 20,800 yes 518 $220 yes
64 419 1 Occ 1 360 11/1/16 11/1/17 222 Other 0 14,808 18,200 yes 518 $370 yes
65 502 1 Vac no $0 no
66 503 1 Vac no $0 no
67 508 1 Occ 1 239 5/1/17 5/1/18 222 Other 0 9,568 18,200 yes 518 $239 yes
2017 Relocation Displacement Manual HFDD Form L- 2 DCA Housing Finance and Development Division Page 2 of 19 (HOME + TC)
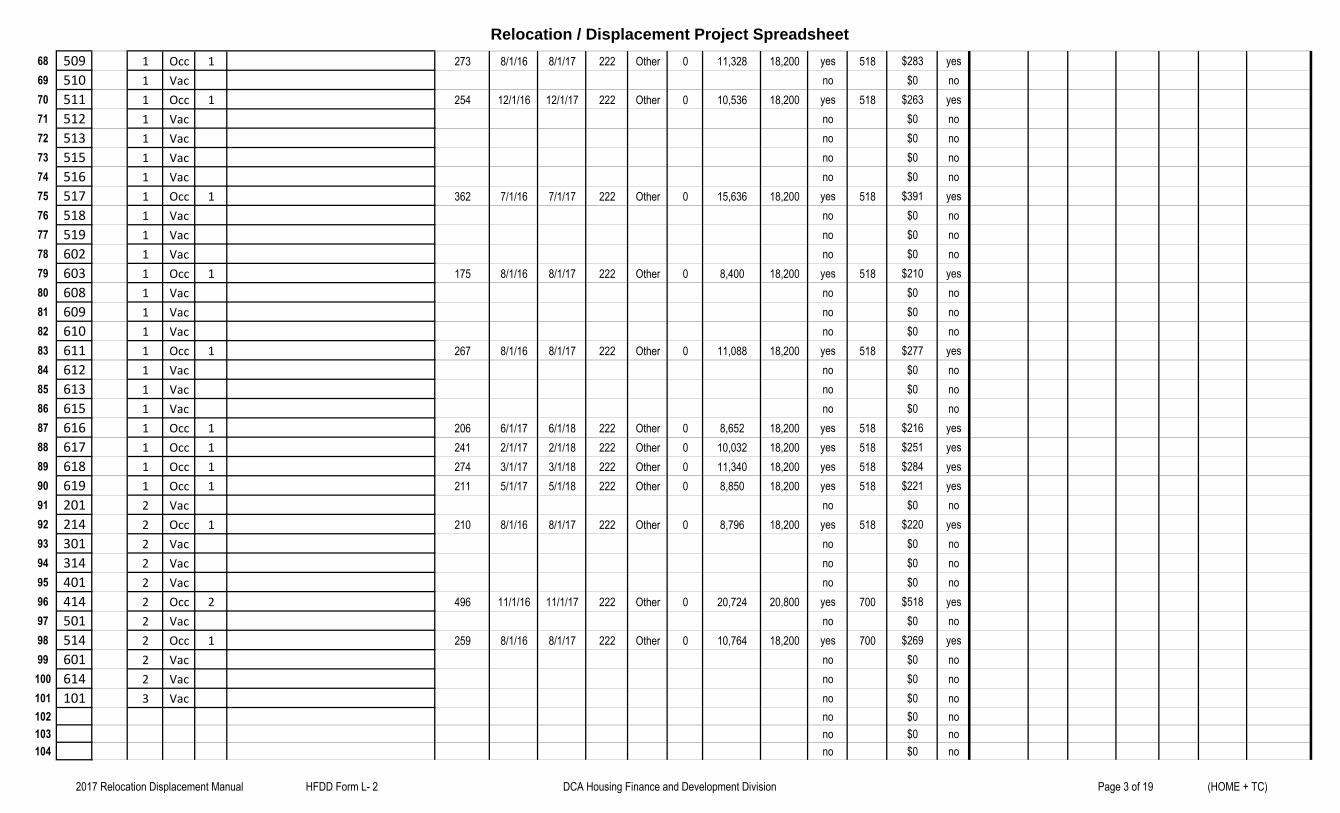
Relocation / Displacement Project Spreadsheet
68 509 1 Occ 1 273 8/1/16 8/1/17 222 Other 0 11,328 18,200 yes 518 $283 yes
69 510 1 Vac no $0 no
70 511 1 Occ 1 254 12/1/16 12/1/17 222 Other 0 10,536 18,200 yes 518 $263 yes
71 512 1 Vac no $0 no
72 513 1 Vac no $0 no
73 515 1 Vac no $0 no
74 516 1 Vac no $0 no
75 517 1 Occ 1 362 7/1/16 7/1/17 222 Other 0 15,636 18,200 yes 518 $391 yes
76 518 1 Vac no $0 no
77 519 1 Vac no $0 no
78 602 1 Vac no $0 no
79 603 1 Occ 1 175 8/1/16 8/1/17 222 Other 0 8,400 18,200 yes 518 $210 yes
80 608 1 Vac no $0 no
81 609 1 Vac no $0 no
82 610 1 Vac no $0 no
83 611 1 Occ 1 267 8/1/16 8/1/17 222 Other 0 11,088 18,200 yes 518 $277 yes
84 612 1 Vac no $0 no
85 613 1 Vac no $0 no
86 615 1 Vac no $0 no
87 616 1 Occ 1 206 6/1/17 6/1/18 222 Other 0 8,652 18,200 yes 518 $216 yes
88 617 1 Occ 1 241 2/1/17 2/1/18 222 Other 0 10,032 18,200 yes 518 $251 yes
89 618 1 Occ 1 274 3/1/17 3/1/18 222 Other 0 11,340 18,200 yes 518 $284 yes
90 619 1 Occ 1 211 5/1/17 5/1/18 222 Other 0 8,850 18,200 yes 518 $221 yes
91 201 2 Vac no $0 no
92 214 2 Occ 1 210 8/1/16 8/1/17 222 Other 0 8,796 18,200 yes 518 $220 yes
93 301 2 Vac no $0 no
94 314 2 Vac no $0 no
95 401 2 Vac no $0 no
96 414 2 Occ 2 496 11/1/16 11/1/17 222 Other 0 20,724 20,800 yes 700 $518 yes
97 501 2 Vac no $0 no
98 514 2 Occ 1 259 8/1/16 8/1/17 222 Other 0 10,764 18,200 yes 700 $269 yes
99 601 2 Vac no $0 no
100 614 2 Vac no $0 no
101 101 3 Vac no $0 no
102 no $0 no
103 no $0 no
104 no $0 no
2017 Relocation Displacement Manual HFDD Form L- 2 DCA Housing Finance and Development Division Page 3 of 19 (HOME + TC)
Relocation / Displacement Project Spreadsheet
105 no $0 no
106 no $0 no
107 no $0 no
108 no $0 no
109 no $0 no
110 no $0 no
111 no $0 no
112 no $0 no
113 no $0 no
114 no $0 no
115 no $0 no
116 no $0 no
117 no $0 no
118 no $0 no
119 no $0 no
120 no $0 no
121 no $0 no
122 no $0 no
123 no $0 no
124 no $0 no
125 no $0 no
126 no $0 no
127 no $0 no
128 no $0 no
129 no $0 no
130 no $0 no
131 no $0 no
132 no $0 no
133 no $0 no
134 no $0 no
135 no $0 no
136 no $0 no
137 no $0 no
138 no $0 no
139 no $0 no
140 no $0 no
141 no $0 no
142 no $0 no
143 no $0 no
144 no $0 no
145 no $0 no
2017 Relocation Displacement Manual HFDD Form L- 2 DCA Housing Finance and Development Division Page 4 of 19 (HOME + TC)

Relocation / Displacement Project Spreadsheet
146 no $0 no
147 no $0 no
148 no $0 no
149 no $0 no
150 no $0 no
151 no $0 no
152 no $0 no
153 no $0 no
154 no $0 no
155 no $0 no
156 no $0 no
157 no $0 no
158 no $0 no
159 no $0 no
160 no $0 no
161 no $0 no
162 no $0 no
163 no $0 no
164 no $0 no
165 no $0 no
166 no $0 no
167 no $0 no
168 no $0 no
169 no $0 no
170 no $0 no
171 no $0 no
172 no $0 no
173 no $0 no
174 no $0 no
175 no $0 no
176 no $0 no
177 no $0 no
178 no $0 no
179 no $0 no
180 no $0 no
181 no $0 no
182 no $0 no
183 no $0 no
184 no $0 no
185 no $0 no
186 no $0 no
2017 Relocation Displacement Manual HFDD Form L- 2 DCA Housing Finance and Development Division Page 5 of 19 (HOME + TC)
Relocation / Displacement Project Spreadsheet
187 no $0 no
188 no $0 no
189 no $0 no
190 no $0 no
191 no $0 no
192 no $0 no
193 no $0 no
194 no $0 no
195 no $0 no
196 no $0 no
197 no $0 no
198 no $0 no
199 no $0 no
200 no $0 no
201 no $0 no
202 no $0 no
203 no $0 no
204 no $0 no
205 no $0 no
206 no $0 no
207 no $0 no
208 no $0 no
209 no $0 no
210 no $0 no
211 no $0 no
212 no $0 no
213 no $0 no
214 no $0 no
215 no $0 no
216 no $0 no
217 no $0 no
218 no $0 no
219 no $0 no
220 no $0 no
221 no $0 no
222 no $0 no
223 no $0 no
224 no $0 no
225 no $0 no
226 no $0 no
227 no $0 no
2017 Relocation Displacement Manual HFDD Form L- 2 DCA Housing Finance and Development Division Page 6 of 19 (HOME + TC)
Relocation / Displacement Project Spreadsheet
228 no $0 no
229 no $0 no
230 no $0 no
231 no $0 no
232 no $0 no
233 no $0 no
234 no $0 no
235 no $0 no
236 no $0 no
237 no $0 no
238 no $0 no
239 no $0 no
240 no $0 no
241 no $0 no
242 no $0 no
243 no $0 no
244 no $0 no
245 no $0 no
246 no $0 no
247 no $0 no
248 no $0 no
249 no $0 no
250 no $0 no
251 no $0 no
252 no $0 no
253 no $0 no
254 no $0 no
255 no $0 no
256 no $0 no
257 no $0 no
258 no $0 no
259 no $0 no
260 no $0 no
261 no $0 no
262 no $0 no
263 no $0 no
264 no $0 no
265 no $0 no
266 no $0 no
267 no $0 no
268 no $0 no
2017 Relocation Displacement Manual HFDD Form L- 2 DCA Housing Finance and Development Division Page 7 of 19 (HOME + TC)
Relocation / Displacement Project Spreadsheet
269 no $0 no
270 no $0 no
271 no $0 no
272 no $0 no
273 no $0 no
274 no $0 no
275 no $0 no
276 no $0 no
277 no $0 no
278 no $0 no
279 no $0 no
280 no $0 no
281 no $0 no
282 no $0 no
283 no $0 no
284 no $0 no
285 no $0 no
286 no $0 no
287 no $0 no
288 no $0 no
289 no $0 no
290 no $0 no
291 no $0 no
292 no $0 no
293 no $0 no
294 no $0 no
295 no $0 no
296 no $0 no
297 no $0 no
298 no $0 no
299 no $0 no
300 no $0 no
301 no $0 no
302 no $0 no
303 no $0 no
304 no $0 no
305 no $0 no
306 no $0 no
307 no $0 no
308 no $0 no
309 no $0 no
2017 Relocation Displacement Manual HFDD Form L- 2 DCA Housing Finance and Development Division Page 8 of 19 (HOME + TC)

Relocation / Displacement Project Spreadsheet
310 no $0 no
311 no $0 no
312 no $0 no
313 no $0 no
314 no $0 no
315 no $0 no
316 no $0 no
317 no $0 no
318 no $0 no
319 no $0 no
320 no $0 no
321 no $0 no
322 no $0 no
323 no $0 no
324 no $0 no
325 no $0 no
326 no $0 no
327 no $0 no
328 no $0 no
329 no $0 no
330 no $0 no
331 no $0 no
332 no $0 no
333 no $0 no
334 no $0 no
335 no $0 no
336 no $0 no
337 no $0 no
338 no $0 no
339 no $0 no
340 no $0 no
341 no $0 no
342 no $0 no
343 no $0 no
344 no $0 no
345 no $0 no
346 no $0 no
347 no $0 no
348 no $0 no
349 no $0 no
350 no $0 no
2017 Relocation Displacement Manual HFDD Form L- 2 DCA Housing Finance and Development Division Page 9 of 19 (HOME + TC)
Relocation / Displacement Project Spreadsheet
351 no $0 no
352 no $0 no
353 no $0 no
354 no $0 no
355 no $0 no
356 no $0 no
357 no $0 no
358 no $0 no
359 no $0 no
360 no $0 no
361 no $0 no
362 no $0 no
363 no $0 no
364 no $0 no
365 no $0 no
366 no $0 no
367 no $0 no
368 no $0 no
369 no $0 no
370 no $0 no
371 no $0 no
372 no $0 no
373 no $0 no
374 no $0 no
375 no $0 no
376 no $0 no
377 no $0 no
378 no $0 no
379 no $0 no
380 no $0 no
381 no $0 no
382 no $0 no
383 no $0 no
384 no $0 no
385 no $0 no
386 no $0 no
387 no $0 no
388 no $0 no
389 no $0 no
390 no $0 no
391 no $0 no
2017 Relocation Displacement Manual HFDD Form L- 2 DCA Housing Finance and Development Division Page 10 of 19 (HOME + TC)

Relocation / Displacement Project Spreadsheet
392 no $0 no
393 no $0 no
394 no $0 no
395 no $0 no
396 no $0 no
397 no $0 no
398 no $0 no
399 no $0 no
400 no $0 no
401 no $0 no
402 no $0 no
403 no $0 no
404 no $0 no
405 no $0 no
406 no $0 no
407 no $0 no
408 no $0 no
409 no $0 no
410 no $0 no
411 no $0 no
412 no $0 no
413 no $0 no
414 no $0 no
415 no $0 no
416 no $0 no
417 no $0 no
418 no $0 no
419 no $0 no
420 no $0 no
421 no $0 no
422 no $0 no
423 no $0 no
424 no $0 no
425 no $0 no
426 no $0 no
427 no $0 no
428 no $0 no
429 no $0 no
430 no $0 no
431 no $0 no
432 no $0 no
2017 Relocation Displacement Manual HFDD Form L- 2 DCA Housing Finance and Development Division Page 11 of 19 (HOME + TC)
Relocation / Displacement Project Spreadsheet
433 no $0 no
434 no $0 no
435 no $0 no
436 no $0 no
437 no $0 no
438 no $0 no
439 no $0 no
440 no $0 no
441 no $0 no
442 no $0 no
443 no $0 no
444 no $0 no
445 no $0 no
446 no $0 no
447 no $0 no
448 no $0 no
449 no $0 no
450 no $0 no
451 no $0 no
452 no $0 no
453 no $0 no
454 no $0 no
455 no $0 no
456 no $0 no
457 no $0 no
458 no $0 no
459 no $0 no
460 no $0 no
461 no $0 no
462 no $0 no
463 no $0 no
464 no $0 no
465 no $0 no
466 no $0 no
467 no $0 no
468 no $0 no
469 no $0 no
470 no $0 no
471 no $0 no
472 no $0 no
473 no $0 no
2017 Relocation Displacement Manual HFDD Form L- 2 DCA Housing Finance and Development Division Page 12 of 19 (HOME + TC)

Relocation / Displacement Project Spreadsheet
474 no $0 no
475 no $0 no
476 no $0 no
477 no $0 no
478 no $0 no
479 no $0 no
480 no $0 no
481 no $0 no
482 no $0 no
483 no $0 no
484 no $0 no
485 no $0 no
486 no $0 no
487 no $0 no
488 no $0 no
489 no $0 no
490 no $0 no
491 no $0 no
492 no $0 no
493 no $0 no
494 no $0 no
495 no $0 no
496 no $0 no
497 no $0 no
498 no $0 no
499 no $0 no
500 no $0 no
501 no $0 no
502 no $0 no
503 no $0 no
504 no $0 no
505 no $0 no
506 no $0 no
507 no $0 no
508 no $0 no
509 no $0 no
510 no $0 no
511 no $0 no
512 no $0 no
513 no $0 no
514 no $0 no
2017 Relocation Displacement Manual HFDD Form L- 2 DCA Housing Finance and Development Division Page 13 of 19 (HOME + TC)

Relocation / Displacement Project Spreadsheet
515 no $0 no
516 no $0 no
517 no $0 no
518 no $0 no
519 no $0 no
520 no $0 no
521 no $0 no
522 no $0 no
523 no $0 no
524 no $0 no
525 no $0 no
526 no $0 no
527 no $0 no
528 no $0 no
529 no $0 no
530 no $0 no
531 no $0 no
532 no $0 no
533 no $0 no
534 no $0 no
535 no $0 no
536 no $0 no
537 no $0 no
538 no $0 no
539 no $0 no
540 no $0 no
541 no $0 no
542 no $0 no
543 no $0 no
544 no $0 no
545 no $0 no
546 no $0 no
547 no $0 no
548 no $0 no
549 no $0 no
550 no $0 no
551 no $0 no
552 no $0 no
553 no $0 no
554 no $0 no
555 no $0 no
2017 Relocation Displacement Manual HFDD Form L- 2 DCA Housing Finance and Development Division Page 14 of 19 (HOME + TC)
Relocation / Displacement Project Spreadsheet
556 no $0 no
557 no $0 no
558 no $0 no
559 no $0 no
560 no $0 no
561 no $0 no
562 no $0 no
563 no $0 no
564 no $0 no
565 no $0 no
566 no $0 no
567 no $0 no
568 no $0 no
569 no $0 no
570 no $0 no
571 no $0 no
572 no $0 no
573 no $0 no
574 no $0 no
575 no $0 no
576 no $0 no
2017 Relocation Displacement Manual HFDD Form L- 2 DCA Housing Finance and Development Division Page 15 of 19 (HOME + TC)

Relocation / Displacement Project Spreadsheet
2017 Relocation Displacement Manual HFDD Form L- 2 DCA Housing Finance and Development Division Page 16 of 19 (HOME + TC)
Relocation / Displacement Project Spreadsheet
2017 Relocation Displacement Manual HFDD Form L- 2 DCA Housing Finance and Development Division Page 17 of 19 (HOME + TC)

Relocation / Displacement Project Spreadsheet
2017 Relocation Displacement Manual HFDD Form L- 2 DCA Housing Finance and Development Division Page 18 of 19 (HOME + TC)

Relocation / Displacement Project Spreadsheet
2017 Relocation Displacement Manual HFDD Form L- 2 DCA Housing Finance and Development Division Page 19 of 19 (HOME + TC)


