Page 1 of 84
SEAMAN CORPORATION
Improved Polyurethane Storage Tank Performance
Contract No. SP0600-04-D-5442, Delivery Order 1017
FY2008 Final Report Revision 3
12/15/2010

Report Documentation Page Form ApprovedOMB No. 0704-0188
Public reporting burden for the collection of information is estimated to average 1 hour per response, including the time for reviewing instructions, searching existing data sources, gathering andmaintaining the data needed, and completing and reviewing the collection of information. Send comments regarding this burden estimate or any other aspect of this collection of information,including suggestions for reducing this burden, to Washington Headquarters Services, Directorate for Information Operations and Reports, 1215 Jefferson Davis Highway, Suite 1204, ArlingtonVA 22202-4302. Respondents should be aware that notwithstanding any other provision of law, no person shall be subject to a penalty for failing to comply with a collection of information if itdoes not display a currently valid OMB control number.
1. REPORT DATE 28 DEC 2010 2. REPORT TYPE
3. DATES COVERED 06-07-2008 to 28-12-2010
4. TITLE AND SUBTITLE Improved Polyurethane Storage Tank Performance
5a. CONTRACT NUMBER
5b. GRANT NUMBER
5c. PROGRAM ELEMENT NUMBER
6. AUTHOR(S) 5d. PROJECT NUMBER
5e. TASK NUMBER
5f. WORK UNIT NUMBER
7. PERFORMING ORGANIZATION NAME(S) AND ADDRESS(ES) Seaman Corporation,1000 Venture Boulevard,Wooster,OH,44691
8. PERFORMING ORGANIZATIONREPORT NUMBER
9. SPONSORING/MONITORING AGENCY NAME(S) AND ADDRESS(ES) Defense Logistics Agency Energy, 8725 John J. Kingman Road, Suite4950, Fort Belvoir, VA, 22060-6222
10. SPONSOR/MONITOR’S ACRONYM(S)
11. SPONSOR/MONITOR’S REPORT NUMBER(S)
12. DISTRIBUTION/AVAILABILITY STATEMENT Approved for public release; distribution unlimited
13. SUPPLEMENTARY NOTES
14. ABSTRACT o allow for maximum mobility and flexibility in the field, the US Armed Services rely extensively on the useof Collapsible Fuel Tanks (CFT) for refueling. The Services have experienced a large number of failures ofthese CFTs in the field. These failures have created a concern that polyurethane collapsible fuel tanks willnot be able to meet the service life requirement of 3 years as specified in MIL-PRF-32233. To proactivelyaddress these problems, a congressionally mandated research project was undertaken to studypolyurethane coated fabric systems and fabrication processes that are or may be used, in the production of CFTs.
15. SUBJECT TERMS
16. SECURITY CLASSIFICATION OF: 17. LIMITATION OF ABSTRACT Same as
Report (SAR)
18. NUMBEROF PAGES
84
19a. NAME OFRESPONSIBLE PERSON
a. REPORT unclassified
b. ABSTRACT unclassified
c. THIS PAGE unclassified
Standard Form 298 (Rev. 8-98) Prescribed by ANSI Std Z39-18
Improved Polyurethane Storage Tank Performance FY2008 Final Report – Revision 3 Seaman Corporation
Page 2 of 84
Table of Contents Page Table of Contents …………………………………………………………………… 2
Appendices ……………………………………………………………………………. 4
Acronyms and Units …………………………………………………………………… 5
Executive Summary ………………………………………………………………….... 6
1.0 Introduction …………………………………………………………………… 10
2.0 Seam Review ………………………………………………………………….... 11
3.0 FEA Analysis …………………………………………………………………… 13
3.1 Seam Analysis FEA ………………………………………………………….. 13
3.2 Lap Seam FEA ………………………………………………………….. 14
3.2.1 Right Hand Side of Seam ……………………………………….... 14
3.2.2 Left Hand Side of Seam ………………………………………… 15
3.3 Double Strap Butt Seam FEA ………………………………………… 15
3.3.1 Right Hand Side of Seam ………………………………………... 16
3.3.2 Middle of Seam ………………………………………………… 16
3.3.3 Left Hand Side of Seam ………………………………………... 17
3.4 FEA Summary ………………………………………………………….. 17
4.0 Welding Equipment/Methods …………………………………………………. 19
4.1 Impulse Welding ………………………………………………………...... 21
4.1.1 Data Analysis …………………………………………………. 23
4.2 Radio Frequency (RF) Welding ………………………………………… 30
4.2.1 Data Analysis …………………………………………………. 32
4.3 Hot Air Welding ………………………………………………………….. 34
4.3.1 Data Analysis …………………………………………………. 37
4.4 Hot Bar Welding ………………………………………………………...... 39
4.4.1 Data Analysis …………………………………………………. 41
5.0 Manufacturing Variability ………………………………………………………….. 43
5.1 Impulse Welding ………………………………………………………….. 43
5.2 RF Welding ………………………………………………………….. 43
5.3 Hot Bar Welding ………………………………………………………….. 44
5.4 Hot Air Welding ………………………………………………………….. 45
5.5 Seam Failure Review …………………………………………………. 46
5.5.1 Failure Definitions ………………………………………… 47
5.5.1.1 Non-Failure ………………………………………… 47
5.5.1.2 Seam Opened-Up Failures ……………………….. 47
5.5.1.3 Designated Failures ………………………………… 50
5.5.1.4 Other Failures …………………………………………. 51
5.5.2 Failure Data Summary Review ………………………………… 53
5.5.3 Failure Trends Observed in Different Fabrication Methods ……. 56
5.5.4 Failure Predictability …………………………………………. 57
5.6 Summary ………………………………………………………………….... 58
6.0 Process Control ………………………………………………………………….... 62
6.1 Process Control Plans ………………………………………………….. 65
6.2 Additional Testing – Process Control ……………………………….... 69
7.0 Quality Control ………………………………………………………………….... 70
7.1 Raw Materials …………………………………………………………... 70
7.2 General Testing …………………………………………………………... 70
7.3 Set Up …………………………………………………………………… 71
7.4 Manufacturing …………………………………………………………... 72

Improved Polyurethane Storage Tank Performance FY2008 Final Report – Revision 3 Seaman Corporation
Page 3 of 84
8.0 Model Tank …………………………………………………………………… 73
8.1 Preparation …………………………………………………………………… 73
8.2 Tank Manufacturing …………………………………………………. 74
8.3 Tank 1 Analysis ………………………………………………………….. 76
8.4 Tank 1 – Tank 2 Comparison ………………………………………… 79
8.5 Conclusion ………………………………………………………………….... 82
9.0 Testing Program Summary ………………………………………………………....... 83
9.1 FEA Evaluation …………………………………………………………... 83
9.2 Welding Equipment Evaluation ………………………………………… 83
9.3 Model Tank ………………………………………………………….. 84
Improved Polyurethane Storage Tank Performance FY2008 Final Report – Revision 3 Seaman Corporation
Page 4 of 84
Appendices Appendix A – Seaman Seam FEA REVA
Appendix B – Fuel Analysis
Appendix B1 – Material Specification
Appendix C – Weld Sample Layout
Appendix D – Dead-Load Test Chamber
Appendix E – DSC Analysis
Appendix E1 – TGA Analysis
Appendix F – Southwest Research Institute Final Report 03-06149
Appendix G – Impulse Welder
Appendix I – Impulse Welder Set Up Data
Appendix J – Impulse Welding Data
Appendix K – Impulse Welding DOE
Appendix L – Scarborough Averages
Appendix L1 – Scarborough Averages Less No. 4
Appendix M – RF Welder Specification
Appendix N – Full Data RF
Appendix N1 – RF DOE
Appendix O – Seaman DOE RF (avg 99)
Appendix O1 – Seaman DOE RF EC Mode (avg 99)
Appendix S – Hot Air 1 Welder
Appendix T – HAW 1 DOE
Appendix T1 – Hot Air 1 Data
Appendix T2 – HAW 1 PU weld test notes
Appendix U – Hot Air 1 DOE Analysis, 800 F
Appendix U1 – Hot Air 1 DOE Analysis, 850 F
Appendix U2 – Hot Air 1 DOE Analysis, 900 F
Appendix V – HBW Full Data
Appendix W – Hot Bar DOE Analysis, 2 inch overlap
Appendix W1 – Hot Bar DOE Analysis, 6 inch butt seam
Appendix X – Additional HAW Data
Appendix X1 – Hot Wedge Data
Appendix Z – Biaxial Test
Appendix Z1 – 3K Tank 1Data
Appendix Z2 – 3K Tank 1 Stretch
Appendix Z3 – 3K Tank 2 Data
Improved Polyurethane Storage Tank Performance FY2008 Final Report – Revision 3 Seaman Corporation
Page 5 of 84
Acronyms
CFT – Collapsible Fuel Tank
DLA – Defense Logistics Agency Energy
DOE – Design of Experiments
F/B – face/back – referring to face and back side polyurethane coatings
FEA – Finite Element Analysis
HAW – hot air welding
HBW – hot bar welding
HTF – high temperature fuel
RF – Radio Frequency welding
SwRI – Southwest Research Institute
2 MP – two minute peak
Units
ft/min – feet per minute
lbsf/in – pounds force per inch
psf – pounds per square foot
psi – pounds per square inch
°F – degrees Fahrenheit

Improved Polyurethane Storage Tank Performance FY2008 Final Report – Revision 3 Seaman Corporation
Page 6 of 84
Executive Summary
Problem Statement
To allow for maximum mobility and flexibility in the field, the US Armed Services rely
extensively on the use of Collapsible Fuel Tanks (CFT) for refueling. Tank requirements
are specified in MIL-PRF-32233, Performance Specification – Tanks, Collapsible, 3,000,
10,000, 20,000, 50,000 & 210,000 U.S. gallon capacity, collapsible fuel tank storage
assemblies. The Services have experienced a large number of failures of these CFTs in
the field. While some failures have been material-related, the majority are due to either
seam separations/tears or seam leaks in the tanks. These failures have created a concern
that polyurethane collapsible fuel tanks will not be able to meet the service life
requirement of 3 years, when operated in an environment from -25o to +120
oF, as
specified in MIL-PRF-32233. To proactively address these problems, a congressionally
mandated research project was undertaken to study polyurethane coated fabric systems
and fabrication processes that are or may be used, in the production of CFTs.
Technical Approach
This study includes review of seam design and seam fabrication techniques that are
commonly used for CFTs, suggested manufacturing process control, and quality control
requirements, with tank seam performance being the focus. The major seam related
characteristics investigated were: catastrophic seam failure, seam integrity and seam
longevity.
Both empirical testing and computer-based structural modeling were conducted through
ILC Dover. ILC Dover was the first manufacturer of CFTs and has multi-discipline
expertise in the design, evaluation and fabrication of soft goods made with flexible
membranes. Testing was performed on nylon based, polyurethane coating compounds,
polyurethane coated fabric, and fabric seams. The testing provided information that was
used to determine the longevity of fabric seams and to provide inputs for Finite Element
Analysis (FEA) that was more representative of actual fabric and seams. FEA was used
to provide an understanding of stresses in seams at peak service loads. ILC Dover
experimentally established a material performance baseline (load vs. elongation) for both
Seaman Style 1940 coated fabric and typical welds (lap and double strap butt seams). A
performance comparison between the coated fabric and welded joints of coated fabric
was also completed.
Seam design, the weld technique employed, and variables inherent in the manufacturing
process all contribute to fuel storage tank reliability. These factors were studied with
respect to their application in the seams. Seam welding techniques include hot air, hot
bar, impulse, and dielectric (RF or HF). Specific manufacturing process variables for
each of the welding methods were investigated. This included, where applicable, energy
input (in terms of heat or power), welding pressure, process steps, and process speed or
cycle time.

Improved Polyurethane Storage Tank Performance FY2008 Final Report – Revision 3 Seaman Corporation
Page 7 of 84
Seams were prepared and laboratory testing was conducted at Seaman Corporation to
establish performance of seams manufactured by different methods and across a range of
process variables. A dead-load test chamber was designed to handle up to 120 seam
samples, simultaneously, for an extended period of time. All samples were immersed in
high temperature fuel (HTF) under dead-load. A Design of Experiments (DOE) was
conducted to define and determine the significance of contributing manufacturing process
variables.
All of the dead-load samples were visually inspected to determine the mechanism by
which failure occurred. The failures were classified based on type, in an effort to
determine most probable root cause.
Based on this study, recommendations were made for manufacturing process quality
control, including appropriate test methods and documentation for end product
qualification, to ensure improved tank reliability and performance. This included
identifying and establishing statistical process control for each critical fabrication process
parameter.
Two 3,000 gallon model tanks were fabricated utilizing a Fiab RF welder. One tank was
designed with narrower 34” panels (1/2 width) to increase the number of seams for
evaluation. The second tank was fabricated with 68” panels, for comparison. The tanks
height, warp and fill peak stretch were measured for various fill volumes and compared
to the biaxial stress-strain curves for the fabric. This was done to determine if controlled
overfill of a small tank could be used to approximate the stresses typically seen in large
tanks.
Findings and Conclusions
The work completed by ILC Dover contributed greatly to the understanding of the
properties of the polyurethane coated, nylon woven fabric, as well as the seam welded
material. Previously published work assumed a linear material response for the coated
material, creating a source of potential model error. The initial material testing provided
critical load versus elongation data that allowed for the development of a more
representative, non-linear finite element model. Three material configurations were
tested: 1) un-seamed Seaman Style 1940 coated fabric, 2) lap seams, and 3) double strap
butt seams. The strain results after load cycling were documented for comparisons with
the analytical model. Stiffness measurements made over the top of the bonded areas of
both the lap and butt seams were approximately two times stiffer than the parent Style
1940 coated fabric.
The FEA hyper-elastic material model was used to predict the tensile behavior of two
Fuel Tank seam configurations. From this model it was possible to develop force /
extension curves for both the lap seam and butt seam configurations. These curves
predicted a significantly stiffer result for the butt seam.

Improved Polyurethane Storage Tank Performance FY2008 Final Report – Revision 3 Seaman Corporation
Page 8 of 84
Experimental work was performed on the four welding methods (impulse, hot air, hot bar
and RF) to identify critical welding control parameters. Based on these parameters,
samples were fabricated and evaluated for performance in hot temperature fuel (JP8)
under dead-load, per the MIL-PRF-32233 requirements. A DOE was constructed to
minimize the number of samples necessary for test while still identifying the variables
that contribute to sample failure. The dead-load test chamber was constructed for
repeatable control of these test variables. In summary, it was found that any of the four
different types of welding equipment could be used to manufacture a successful seam,
able to withstand the HTF dead-load test. Regardless of the welding process, the ability
to get the polyurethane coated fabric to a high enough melt temperature was the key to a
successful weld.
Failure analysis of exposed samples resulted in two primary types, those where the weld
was inadequate, or those where damage occurred to the underlying fabric layer. In the
case of the inadequate weld, under or overheating the weld area probably led to the
separation in the weld area. In some cases, overheating or too much power probably was
delivered to the weld area, possibly damaging the yarns. This effort verified that the
fundamental physical and material interaction during the weld process needs to be further
understood and would be the basis for future study. This also emphasizes the critical need
for appropriate process control.
The model tanks were fabricated from the Seaman Style 1940 coated fabric. The biaxial
stretch characteristics (warp and fill stretch % as a function of the applied load) of the
fabric were determined. The load applied was up to 75lbsf/inch, creating in-plane stress
representative of maximums encountered in large fuel tanks. After fabrication, the tanks
were filled with water and the warp and fill peak stretch measured as a function of tank
height and water volume. The model tank results suggest that a 3,000 gallon tank with a
controlled fuel overfill should undergo the same stresses as seen in a 50,000 gallon tank.
This will allow us to further study the different welding techniques and tank designs in
the field, using a smaller scale tank.
No matter what the welding process was, the ability to get the urethane coated fabric to a
high enough melt temperature was the key to a successful weld. It was demonstrated that
any of the four different types of welding equipment could be used to manufacture a
successful seam, as defined as being able to withstand the high temperature fuel dead-
load test.
Improved Polyurethane Storage Tank Performance FY2008 Final Report – Revision 3 Seaman Corporation
Page 9 of 84
For defining manufacturing repeatability and control, a number of critical performance
parameters were identified. It was determined through testing that the initial weld
adhesion and weld adhesion after high temperature fuel (HTF) immersion have a linear
relationship. Unfortunately, the relationship between HTF weld adhesion and HTF dead-
load performance is not as predictive. From 30 to approximately 45 lbsf/inch, the data
shows a steep increase in dead-load performance with associated increase in seam
adhesion. Beyond the 45 lbsf/in., the dead-load performance is relatively flat, with no
relative increase in dead-load performance as weld adhesion increases. The data indicates
that a 29 day dead-load value (equivalent to a 3 year service life) can be obtained at a
minimum HTF seam adhesion of 39 lbsf/in. A 45 lbsf/inch HTF seam adhesion (~15%
above the minimum), translates into a 55 lbsf/in. initial seam adhesion, which is
considered the target for the seam specification. A process control plan was developed for
each of the welding methods utilized in the experimental evaluation: Impulse, RF, Hot
Air and Hot Bar.
Recommendations
Based on the dead-load test results it was noted that samples exposed to high temperature
fuel that did not fail by 4 days would typically last until 29 days. Hence, the current
specification of 70 hours might not be an adequate predictor of success in the field (MIL-
PRF-32233, section 4.5.2.8). A limit of 96 hours with a constant dead load tension force
equivalent to a 2.5 safety factor in JP-8 at 160 °F should increase the probability of
success in the field.
Additional study should be considered before a fabricator selects a welding technology.
An examination of other variables, such as throughput speed and cost of each welding
process, in production, should be performed. Testing that focuses on the repeatability of
producing fuel tight seams with any of the welding systems, should also be investigated.
Studying model tanks is the best way to determine the ability of a welding method to
minimize or eliminate seam leaks. This work will be continued under actual
environmental field conditions, in the FY2009 Improved Polyurethane Fuel Tank study.
Improved Polyurethane Storage Tank Performance FY2008 Final Report – Revision 3 Seaman Corporation
Page 10 of 84
1.0 Introduction
The Services have experienced a large number of failures of collapsible fuel tanks in the
field. While there have been some failures that are material related, the majority have
been the result of either seam separations/tears or leaks in the tanks, primarily at the
seams. These failures have created a concern in the services that urethane collapsible
fuel tanks will not be able to provide the 3 year service life that is required by MIL-PRF-
32233.
In 2003, a study was done and a report was prepared by Southwest Research Institute
(SwRI) project 03-06149, March 2003, on “Failure Analysis and Alternative Solutions
for Collapsible Fabric Tanks” (Appendix F). The goal of the study was to collect and
analyze data from a variety of sources for the purpose of identifying and describing
common failure mechanisms for collapsible tanks and to make recommendations that
would lead to the improvement of tank quality and design. A portion of the analysis
related to the structural integrity of seams, which is the focus of this study. A Finite
Element Analysis (FEA) was performed on a 50,000 gallon fuel tank, configured per
specification ATPD-2266, in order to understand the peak stress regions of the tank wall.
The analysis yielded a visualization of the shape of the collapsible fuel tank at its full fill
height and a contour plot of the in-plane stresses that were present. The maximum in-
plane stress data is useful since it provides the largest stress values that occur in the plane
of the fabric and allow an evaluation of the breaking strength requirements of the
membrane. The results of the study showed a maximum in-plane stress of 14610 psf.
Adjusting this number for the thickness of the fabric, the load in the fabric is
approximately 50 lbsf/in. This load was used as the baseline load for the seam studies that
follow.
The purpose of the work performed by Seaman Corporation, under the contract with
DLA, is to study the fabrication of collapsible fuel tanks made with polyurethane coated
fabrics. This work focused on seaming methods that are or may be used in the fabrication
of tanks, to provide insight into the following:
1) Seam design options and an FEA analysis of seams
2) Review of welding methods including an evaluation of performance and ease
of manufacturing
3) Quality and Process control requirements for welding of fabric seams
4) Model Tank Investigation to determine if small scale tanks can be used to
simulate the performance of larger tanks.

Improved Polyurethane Storage Tank Performance FY2008 Final Report – Revision 3 Seaman Corporation
Page 11 of 84
2.0 Seam Review
Coated fabrics are multilayer composites. In the case of collapsible fuel tanks under
investigation in this study, the composite is made with a high strength woven fabric that
is coated with a polyurethane resin. The fabric is designed to carry the loads that the tank
is subjected to with a safety factor greater than the 2.5 designated in MIL-PRF-32233.
The urethane coating is linked to and forms a matrix surrounding the fiber of the coated
fabric. The matrix material, a thermoplastic polyurethane, is where heat-bonded seams
are made to construct the fuel tanks and the urethane is the medium by which seams can
transfer loads across the joints in the fabric.
Heat bonded seams are made by a variety of methods. There are a number of different
seam designs that can be used for homogenous materials. However, seam designs for
coated fabrics, where the seams need to be liquid tight and the seam shear strength needs
to be as great as the strength of the fabric, are limited to lap designs. These will be
discussed in more detail in the section on seaming methods. For lap seams, the seam
shear strength is directly proportional to the seam width, up to a limit. By adjustment of
the seam width, these seams can be made to be stronger than the coated fabric; seam
efficiency equals 100%.
There are three common types of joints possible for fabricating collapsible fuel tanks: the
single lap joint or modified lap joints - the single strap (-butt) joint, or the double strap (-
butt) joint.

Improved Polyurethane Storage Tank Performance FY2008 Final Report – Revision 3 Seaman Corporation
Page 12 of 84
Others include end, corner and fitting seams. These seams are not as standard as the panel
- warp seams and vary from fabricator to fabricator as well as from one tank design to the
next. In some instances, the fabricator may consider these seams proprietary. In addition,
the FEA analysis, both in the SwRI and the ILC Dover reports, indicated that the area of
highest stress occurs at the top of the tank, at the panel - warp weld seams. Since these
seams should then see the "worst case stress concentration", they are the focal point of
this investigation. Further investigation into end closure, fitting and corner seams will be
undertaken in the future.
The single lap joint is the most commonly used joint for seaming thermoplastic
membranes because it is simple to fabricate and, under load, it stresses the bond area in
shear. Shear stress is caused by forces applied parallel or tangential to the bond, such as
in a dead-load test. There is a slight misalignment of load when the single lap seam is
loaded in shear which can result in some cleavage stress at the ends of the joint. This
seam is used by a number of fabricators of collapsible fuel tanks.
The single strap joint is generally used only when the single lap joint is impractical. It is
subject to cleavage stress under bending forces. It is not currently being used by any
fabricator for collapsible fuel tanks.
The double strap joint has lower cleavage stress under bending forces than either of the
other seams. In addition, for the same overlap width, it has twice the weld area, and
consequently, will handle a higher (theoretically double) shear load. This weld joint is
currently being used to fabricate collapsible fuel tanks.

Improved Polyurethane Storage Tank Performance FY2008 Final Report – Revision 3 Seaman Corporation
Page 13 of 84
3.0 FEA Analysis
As a prelude to FEA analysis on seams that might be used in normal tank construction,
ILC Dover was asked to perform testing on Seaman’s fuel tank fabric to help define
linear elastic Hooke’s Law constitutive constants to be used for finite element modeling.
The report for the work is shown in Appendix A1. The testing on the 1940 fabric showed
very good agreement with the fill yarn properties used by SwRI in their analysis. It did
not show the best agreement with the warp direction properties used by SwRI. The 1940
warp stiffness data was higher than the warp stiffness assumed by SwRI. However, the
differences seen in the warp direction stiffness were not so great that it would
significantly affect the tank geometry. Consequently, the maximum in-plane stress data
from the report was used as the basis for the balance of the testing at Seaman
Corporation.
With the SwRI report validated, the focus shifted to modeling stresses in seams. In order
to better understand the value of the two seams that are currently being used to fabricate
fuel tanks, a FEA was performed for each. The entire finite element analysis is shown in
Appendix A. The analysis is reviewed below:
3.1 Seam Analysis FEA
1) The nylon base cloth and the urethane coating compound used on the 1940 PTFF
were subjected to engineering tests to determine their structural properties. These
were used to develop hyperelastic models to use in the finite element analysis. A
two parameter Mooney-Rivlin model was used for the urethane and two - five
parameter Mooney-Rivlin models were used for the nylon.
2) Models of the coated fabric were prepared using the material models. The model
assumed a 0.020 in. thick fabric layer sandwiched between two 0.015 in. thick
coating compound layers. Stress strain results from the model were compared
with actual test results for the fabric with reasonable agreement. The fill direction
model showed good agreement with the test data. The warp direction model
predicted lower stress at a given strain than was seen in actual testing of the
fabric. No attempt was made to refine the warp model to reconcile this
difference, since the maximum in-plane stress on the tank occurs in areas where
the fabric heads into the seams in the fill direction.
3) Models were developed for the overlap and double strap butt seam based on
samples provided by Seaman Corporation. The geometry of the seam samples
were approximated using high magnification images of the seam. These were the
basis for establishing the geometry of the seam types.

Improved Polyurethane Storage Tank Performance FY2008 Final Report – Revision 3 Seaman Corporation
Page 14 of 84
4) Models were prepared and minor adjustment made to geometry to improve the
models. These results were compared to the actual test results. The overlap model
appeared to be in good agreement with load extension data generated on samples.
The double strap butt seam model did not show as good agreement with the actual
test results. It over predicts the stiffness by about 30%.
5) The models were used to examine the x direction normal stress (loads in the fabric
layer), the y direction normal stress (peel loads of the polyurethane coating at the
fabric interface), and the xy shear stress loads (shear in the coating layer). This
was done for both the lap seam and the double strap butt seam at the maximum in-
plane stress that was developed in the SwRI study. Contour plots of these stresses
are shown in the report.
3.2 Lap Seam FEA
An approximation of the geometry used by the lap seam model is shown below. It should
be noted that the lap seam used for this evaluation was made on a hot bar welder, and
other welding methods may give slightly different geometries. The fabric makes a step on
one side of the seam leaving a small groove in the coating compound and the fabric goes
directly into the seam on the other side of the seam. There is some flow of compound
into areas where there is a step.
Because the geometry is different at each end of the seam, the stress contours are
different for each end of the seam.
3.2.1 Right Hand Side of Seam
The stress in the fabric layer is at the maximum in-plane stress value as it approaches the
seam area – 2400 to 2700 psi. This stress comes from a load of approximately 50 lbsf/in.
As the urethane thickness increases, the stress in the fabric decreases. It decreases further
once it reaches the overlapping fabric layer. It ultimately goes to 0 at the cut edge.
The peel stress resulting from the normal force in the coating compound shows a
maximum of 27 to 36 psi between the fabric layers right at the cut edge of the upper layer
of fabric. The area of concentration is very small and the resultant peel force is very low
compared to the peel adhesion of the fabric.
The shear contours in the coating show nothing of interest as the impact is negligible.
Improved Polyurethane Storage Tank Performance FY2008 Final Report – Revision 3 Seaman Corporation
Page 15 of 84
3.2.2 Left Hand Side of Seam
The stress in the fabric layer is at the maximum in-plane stress value as it approaches the
bend in the fabric– 2400 to 2800 psi. This stress corresponds to a load of approximately
50 lbsf/in. As the fabric transitions through the bend in the fabric, the stress on one side
of the fabric drops while the stress on the other side of the fabric increases. The same
thing occurs at the next bend as it approaches the overlap, but to a lesser extent. The
increase in stress is from a range of 2400 to 2800 psi to a range of 3200 to 3600 psi. The
magnitude of the increase on average is about 30% or an increase in the load in the fabric
just outside the seam area to 65 lbs/in. At 65 lbs/in, the stress in the fabric is < 20% of
the ultimate tensile strength of the fabric at 158°F and represents no threat to
performance. The stress in the fabric decreases once it reaches the overlapping fabric
layer at the seam. It ultimately goes to 0 at the cut edge.
The normal force or peel stress in the coating compound shows a maximum of 220 to 270
psi between the fabric layers right at the cut edge of the upper layer of fabric. The area of
concentration is very small. If the area of concentration is overestimated and is taken as
0.020 in., the thickness of the fabric, the resultant peel force is only 5.4 lbsf/in. This is
much lower than the peel adhesion of the fabric.
The shear contours in the coating show some stress concentration at the cut edge of the
fabric on the bottom of the seam. The stress concentrations are low (shear stress ≤ 90
psi), the associated area small and the impact of the local geometry on the weld is not
significant.
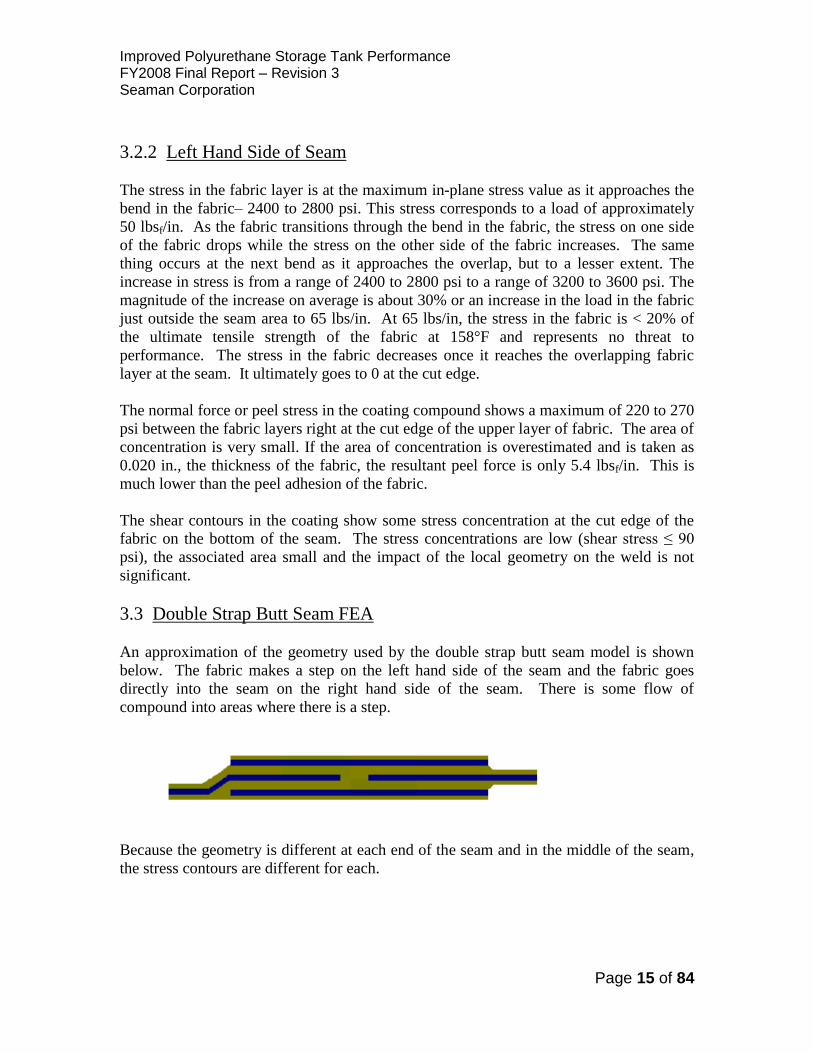
3.3 Double Strap Butt Seam FEA
An approximation of the geometry used by the double strap butt seam model is shown
below. The fabric makes a step on the left hand side of the seam and the fabric goes
directly into the seam on the right hand side of the seam. There is some flow of
compound into areas where there is a step.
Because the geometry is different at each end of the seam and in the middle of the seam,
the stress contours are different for each.

Improved Polyurethane Storage Tank Performance FY2008 Final Report – Revision 3 Seaman Corporation
Page 16 of 84
3.3.1 Right Hand Side of Seam
The stress in the center fabric layer is at the maximum in-plane stress value as it
approaches the seam area, 2400 to 2700 psi. This stress corresponds to the load of
approximately 50 lbsf/in. As the urethane thickness increases, the stress in the fabric
decreases. It decreases further once it reaches the overlapping fabric layer. The stress in
both the strapping fabrics starts at 0 at the cut edge and increases as it moves into the
seam.
The peel stress resulting from the normal force in the coating compound shows a
maximum of 150 to 180 psi between the fabric layers in the fillet areas between the fabric
layers. The normal or peel force at the fabric compound interface is a maximum of 60 to
90 psi. The area of concentration is small. If we assume an area equal to the thickness of
the fabric, the maximum peel force would be 1.8 lbsf/in which is much lower than the
peel adhesion of the fabric.
The shear contours in the coating show some stress increase at the cut edge of the strap
fabric on the bottom of the seam and some compression at the cut edge of the strap fabric
on the top of the seam. The area and the stress concentration are low at the fabric
compound interface where peel would occur and the resultant impact would be minimal.
3.3.2 Middle of Seam
The stress in the center fabric layer declines as the fabric moves to the center of the
double strap butt seam, ultimately reaching zero at the cut edge. The stress in the
strapping fabrics increases steadily as it moves along the fabric toward the center of the
seam. The stress in the strapping fabric at the center of the seam is, as expected, about
half of the maximum in-plane stress.
The peel stress in the coating compound shows a maximum of 56 to 72 psi at the cut
edges of the center fabric. There is no peel force at the fabric compound interface where
peel would occur.
The shear contours in the coating compound show some stress increase at the cut edges
of the center fabric. The area and stress concentrations are minimal.
Improved Polyurethane Storage Tank Performance FY2008 Final Report – Revision 3 Seaman Corporation
Page 17 of 84
3.3.3 Left Hand Side of Seam
The stress in the fabric layer is the at the maximum in-plane stress value as it approaches
the bend in the fabric. It is 2400 psi corresponding to a load of approximately 50 lbsf/in.
As the fabric transitions through the bend in the fabric layer, the stress on one side of the
fabric drops and the stress on the other side of the fabric increases. The same thing
occurs at the next bend as it approaches the overlap, but to a lesser extent. The increase in
stress is from a range of 2400 to 2800 psi to a range of 3200 to 3600 psi. The magnitude
of the increase on average is about 30% or an increase in the load in the fabric just
outside the seam area to 65 lbs/in. At 65 lbs/in, the stress in the fabric is <20% of the
ultimate tensile strength of the fabric at 158 °F and represents no threat to performance.
The stress in the fabric decreases once it reaches the overlapping fabric layer at the seam.
It ultimately goes to 0 at the cut edge.
The peel stress resulting from the normal force in the coating compound shows a
maximum of 360 to 480 psi between the fabric layers right at the cut edge of the lower
layer of strapping. This is not an area that would be subject to peel failure. The peel
stress in the area between the upper strapping tape and the center fabric and the lower
strapping tape and the center fabric in the bend areas are 0 to 120 psi. Assuming the
width of the areas to be equal to the overall thickness of the fabric, the resulting peel
force at the fabric compound interfaces would be 6 lbsf/in. This is lower than the peel
adhesion of the fabric.
The shear contours in the coating show some stress increase at the cut edge of the strap
fabric on the bottom of the seam. The area and the stress concentration are low and the
resultant impact would be minimal.
3.4 FEA Summary
1) In general, the stress in the tank fabric falls as it enters the seam area decaying to
0 at the cut edge. In the double strap butt seam, the stress in the strapping fabric
increases from 0 at the edge of the seam to about half of the maximum in-plane
stress at the center of the seam (i.e., 1200 – 1350 psi).
2) There appears to be some stress concentration in the fabric where there is a bend
in the fabric plane as a result of the welding process. The stress concentration
would be eliminated if the fabric does not step down at the edge of the weld. The
magnitude of the stress concentration was much greater in the double strap butt
seam than in the overlap seam. In either case, the stress concentration did not
result in a stress in the fabric that was greater than 33% of the ultimate tensile
strength at elevated temperature, or a safety factor of 3.0.
Improved Polyurethane Storage Tank Performance FY2008 Final Report – Revision 3 Seaman Corporation
Page 18 of 84
3) Peel forces were highest at the cut edges of the fabric or the strapping tape in the
seam areas where there was a bend in the fabric. The peel forces were in all cases
much lower than the peel adhesion of the fabric.
4) The stress contours of the coating compounds were all within the required
specification for the coated fabric. Both seams were made with a hot bar welder,
which may result in geometries that are not seen in all welding methods. Neither
of the seam models had an edge tape included. Edge tape is needed to prevent
liquid from pressure transferring through the base fabric. If fuel is able to make it
to the scrim by a breach in the coating compound on the interior of the tank or
because of an exposed edge, it can flow under the head pressure in the tank,
through the scrim and out a breach in the coating on the exterior of the tank or to
an exposed edge.

Improved Polyurethane Storage Tank Performance FY2008 Final Report – Revision 3 Seaman Corporation
Page 19 of 84
4.0 Welding Equipment/Methods
Heat sealing equipment applies a measured amount of heat and pressure to fabric seams
to fuse them together. There is commercially available heat sealing equipment that seams
the fabric in a discrete type process where a length of seam is held under pressure while
heat is applied or while the seam is cooling. This type of equipment would include hot
bar, impulse and dielectric welders. Other welders make seams in a continuous process
where the fabric pieces to be seamed move through the weld area, generally pulled along
by some type of drive wheel. This type of equipment would include rotary hot air and
hot wedge welding. All of these types of equipment have been used over the years to
produce collapsible fuel tanks.
In order to understand the strengths and weaknesses of each welding method, the
following experimental work was performed:
1) A single lot of Seaman 19401600A68, 1940 PTFF MS337 68 inch (in.) fabric was
dedicated for seam sample fabrication using the various weld methods. The lot
number was 83264. The lot was characterized and tested within the lot to assure
consistency. A single lot was chosen for the work to minimize the impact that
fabric variability might have on weld method performance evaluation. The test
data on the initial lot is shown in Appendix B1.
2) A test plan was established and a standard sample was designed that would be
used for all of the weld method evaluations. All seams were made with the fill
yarn running perpendicular to the weld. This is the fiber orientation that is
present in the peak stress areas of the tank. The sample was designed to allow
collection of test specimens along the length of the seam to quantify position
variability. It was also designed and match marked to provide for alignment of
fill yarns and to minimize misalignment issues during welding. The sample design
is shown in Appendix C. Testing to be performed included the following:
Test Timing Test Method Units
Adhesion of coating to fabric, F/B Initial ASTM
D751
lbsf/in.
Adhesion of coating to fabric, F/B After high temp
fuel immersion
ASTM
D751
lbsf/in.
Weld adhesion, 3 samples Initial ASTM
D751
lbsf/in.
Weld adhesion, 3 samples After high temp
fuel immersion
ASTM
D751
lbsf/in.
Dead-load, 3 samples After high temp
fuel immersion
MIL-PRF-
32233
days
Improved Polyurethane Storage Tank Performance FY2008 Final Report – Revision 3 Seaman Corporation
Page 20 of 84
*(lbsf/in. – pound-force per inch)
High temperature dead-load testing of seam samples, while immersed in Jet
Petroleum 8 (JP8) was performed. For the dead-load testing, the MIL-PRF-32233
procedure was used where the fuel temperature and load were controlled. A
special test chamber was constructed to perform the dead-load testing. The
chamber and the specifics of the dead-load testing are discussed in more detail in
Appendix D. The days to failure, either by separation or by tear, was chosen as
the continuous indicator in dead-load shear resistance.
3) Thermo Gravimetric Analysis (TGA) and Differential Scanning Calorimetry
(DSC) analysis was performed on the 1940 fabric by ILC Dover to understand the
degradation characteristics and the melt profile for the coatings. The degradation
onset for the coating was determined to be 290o Celsius (C) (554
o Fahrenheit (F)).
The DSC analysis was performed from room temperature to 275o C (527
o F).
The DSC analysis showed three melt transitions; at about 70o C (158
o F), melting
of minor crystallinity in the soft segment, at about 140o C (284
o F), less organized
crystalline melting point, and at 172o C (342
o F), amorphous phase melting. The
data is presented in Appendices E and E1.
4) For each welding method, experimental work was performed, in advance of the
welding for long term testing in order to identify critical welding control
parameters, to determine heat or energy values that gave target bond-line
temperatures (where possible) and to establish ranges for control parameters that
provided welds with acceptable initial properties. These ranges would be used to
set the upper and lower limits of the experimental design space. Initial properties
monitored included weld adhesion and the appearance of the weld during testing.
The seam needed to pull to the base fabric across the full width of the seam during
adhesion testing. The critical control parameters that were used were based on
ones commonly used by the fabricators for welding of urethane tanks.
5) Once the preliminary work was completed, the Design of Experiments (DOE) was
laid out, levels of the weld control parameters were selected, and seam samples
were generated for long term testing. The specific DOE that was used depended
on the number of control parameters to be studied and the ability to choose ranges
for parameters that were broad enough to allow study. All processes were to be
run through several warm-up cycles so as to be at steady state operation before
samples were produced for the DOE study. The seam area for all of the samples
was wiped with a cleaning solvent prior to the weld work to insure the surface
was free from contamination. The expectation of the long term dead-load testing
was that all specimens would fail at some point during a 60 day test period so that
a response surface, showing the most robust processing conditions, could be
established.
Improved Polyurethane Storage Tank Performance FY2008 Final Report – Revision 3 Seaman Corporation
Page 21 of 84
The work performed on each of the welding methods is discussed in detail in the
following section.
4.1 Impulse Welding
Impulse welding is a form of hot bar welding in which both the heating and the cooling
regimes are controlled while the seam is held under pressure. In impulse welding, the
coated fabrics to be seamed are placed between two bars, one of which contains a nickel
chromium wire strip or analogous material for generating the energy for welding. This
element would be specific to the impulse welder’s equipment design. The strip is covered
on both sides with a non stick layer, such as Teflon coated fiberglass, to keep molten
materials from sticking to it and to separate it from the bar. The bars are pressurized
together to hold the seam area in place and a pulse of electrical energy is passed through
the wire, causing the temperature to increase rapidly and transfer heat to the fabric. The
coating compounds melt at the interfaces and co-solidify during the cooling cycle to form
a weld. Pressure is applied throughout the process to insure the molten surfaces are in
intimate contact during both the heating and cooling phases. For this study, controlled
impulse welding was used, where the heating was set to a precise set temperature, the
pressure was controlled to ensure that a constant welding force was applied to the fabric,
and there was controlled cooling under pressure.
The impulse welding work done for this study was performed at ILC Dover. ILC Dover
was one of the first companies to manufacture collapsible fuel tanks made with urethane
coated fabrics using impulse welding. Based on the ILC Dover experience, the following
parameters were identified as the critical control parameters for the welding trials:
1) Pressure
2) Peak temperature between the upper and lower bar at 2 minutes (2MP
temperature)
3) Dwell time
4) Cooling temperature
The following is a general schematic of the bars that were used on the welder:

Improved Polyurethane Storage Tank Performance FY2008 Final Report – Revision 3 Seaman Corporation
Page 22 of 84
Warm water was circulated through the bars to keep the heat loss from the bars at a
constant level. A thermocouple was located in the bottom bar, near the upper surface of
the bar and was used as the set-point for temperature control. The unit used at ILC Dover
was their TP15 machine. A drawing of the unit is shown in Appendix G.
In preparing for the DOE samples, ILC Dover made a number of measurements on the
equipment in order to determine the relationship between the temperature reading in the
thermocouple located in the lower bar and the 2 MP temperatures, the bond-line
temperature on heating, and the bond-line temperature on cooling. These were
determined by placing thermocouples imbedded in capsan between the upper and lower
bars and by inserting the thermocouples in the seam area during the seaming process.
The data generated for these trials is presented in Appendix I. The data indicated that
bond-line temperatures for a DOE would range from 300o F to 370
o F using 2MP
temperatures ranging from 365o F to 405
o F with dwell times ranging from 2 to 5
minutes. Based on the preliminary data on the coated fabric characterization, it was
determined that this would provide an acceptable temperature range for sealing. The
preliminary range for pressure on the cylinders pushing the bars together was set at 30 to
60 psi, based on experience, providing a pressure on the seam of 22.5 to 45 psi. It was
decided to hold the temperature of the bond-line on cooling to a constant for the
experiments to keep the number of variables to 3. The target bond-line temperature was
targeted to be 135o F, below the lowest melting transition and it experimentally
determined that this occurred when the thermocouple in the lower bar reached 110o
F.
This allowed for a 3 factor, 3 level, full factorial experiments as outlined below:
Factor 1 – Pressure setting – 30, 45, 60 psi
Factor 2 – Dwell Time after reaching the desired bar thermocouple temperature
(which correlates with the 2 MP temperature) - 2, 3.5, 5 minutes
Factor 3 – 2 MP temperature (which correlated with the bar thermocouple setting) –
365o, 385
o, 405
o F
The 3 factor, 3 level full factorial designs requires 27 experiments. In addition, 5
replicate experiments were run to provide an estimate of error. Three welds were to be
Improved Polyurethane Storage Tank Performance FY2008 Final Report – Revision 3 Seaman Corporation
Page 23 of 84
tested for each experiment. The total number of specimens for the dead-load testing was
96.
The experimental design data and the data collected while generating the samples is
shown in Appendix J. Review of the data shows the time for the bar to reach the desired
temperature varied by less than 30 seconds, the dwell times were controlled to the target
times, and the cooling times varied from 3.5 to 7 minutes depending on the target
temperature and dwell time. Welding of the DOE samples at ILC Dover took two days to
complete. Several warm up and test seams were made at the start of each day and any
time the machine sat idle for a period of time to insure the welding equipment was at
steady state, prior to preparing the DOE samples. A visual review of the samples showed
some minor discoloration of the samples run at the 405o F 2MP temperature and
significant thinning of the coating compound at the 405o F 2MP temperature.
Samples were returned to Seaman Corporation for testing. Initial properties of the welds
were tested and samples cut for long term fuel immersion testing. The initial load for the
long term dead with fuel immersion was set at 120 lbs. This was chosen based on the
FEA analysis which showed a maximum in-plane stress of about 50 lbsf/in and the MIL-
PRF-32233 requirement of a 2.5 safety factor.
Dead-load testing proceeded as planned. However, after a week, only 3 specimens of 96
had failed. After some discussion, regarding increasing temperature or increasing load to
further accelerate the failure rate, the load was increase to 135 lbs on day 9 of the test.
Only 1 specimen failed over the next 9 days and the load was further increased.
Additional increases in load and 1 increase in temperature were made over the course of
the test (62 days) in an attempt to force the dead-load specimens to fail. At the
completion of the test, the load was at 250 lbsf/in and the temperature at 180o F. A little
over half of the specimens failed during testing. A value of 99 days was arbitrarily chosen
for samples that did not fail during the test period. A number of the specimens failed
due to tear rather than seam separation at the higher loadings. The load and temperature
schedule used during the test and the outcome of the dead-load testing, and a table of all
of the other test results are provided in Appendix K. A 99 value in the table indicates that
no test result could be obtained. In the case of peel adhesion, it means that the film could
not be peeled from the substrate without breaking. In the case of the dead-load, it means
that the sample did not fail during the duration of the test.
4.1.1 Data Analysis
The purpose of the response surface design is to generate formulae that accurately
describe the response of interest (seam duration under dead-load) as functions of the weld
method variables that are under investigation. The output of the DOE would be a model
described by best fit quadratic equations. These formulae can then be used to map
variable space in order to find optimum process conditions and to evaluate how robust the
dead-load outcome is to variations in welding variables. A secondary goal is to
determine the natural variation in the dead-load response.

Improved Polyurethane Storage Tank Performance FY2008 Final Report – Revision 3 Seaman Corporation
Page 24 of 84
A number of specimens did not fail during the duration of the test. As the DOE analysis
requires a numerical value for the time to failure, an arbitrary value of 99 days was
assigned to all non-failed test specimens. In addition to complications arising from the
inability to fail specimens, the need to change the load and temperature conditions during
the test period made it difficult to make projections about the time to failure for the fuel
tank seams. Normalization factors needed to be developed to bring the times that
specimens were exposed to differing conditions back to a baseline value. It is reasonable
to expect that if a sample lasted one day at 250 lbsf/in and 180°F it would last longer at
120 lbsf/in and 160 °F.
ILC Dover was engaged to help develop normalization factors and to perform the DOE
analysis. Two different methods were used to try to produce normalization factors; one
involved investigation of creep factors, an approach that ILC Dover had used
successfully in predicting the performance of fabrics in inflatable structures, the other
utilized time-temperature and stress temperature superposition. DOE analysis was
performed using several different scenarios to determine the best fit. This work is
discussed in Appendix L in detail, along with academic discussion of the techniques, and
is summarized below:
1) Creep Rate Normalization
Short term tensile tests give the load at which an item will creep rupture instantaneously,
100% of the ultimate tensile strength (UTS). However, if the same item is held at a lower
percent of the UTS, it would take much longer for creep rupture to occur. This is because
polymers, like nylon and polyurethane, are viscoelastic materials which show elastic
responses when subjected to rapid loading as is typical in a tensile test, but viscous
responses when subjected to long term static loads. These types of creep tests in real time
could take years for failure to occur. This question is discussed in detail within the study.
It was not possible to get samples to fail by the creep method. A combined time -
temperature-load superposition method was used and found that some samples would not
fail during a lifetime. In this case, an attempt was made to develop normalization factors
based on the creep rate of the fabric at different temperatures. Assumptions were made
that there would be a failure at a consistent amount of total creep and that the time-
temperature superposition principle (TTSP) could be used to accelerate the test and to
predict the time, at a reference temperature, where failure would occur. This approach is
based on the Bailey-Norton Creep model. However, this approach yielded much, much
lower factors than had been generated in prior work for similar materials. It is expected
that the reason for the poor results arises from the fact that ILC Dover was unable to get
any of the creep samples to fail during the accelerated creep testing. Additionally, at the
temperatures used for the tests and with the extended duration to try to fail the samples, it
appeared that the modulus of the material was shifting, similar to strain hardening. This
could be the result of a change in the polymer structure such as a shift in crystallinity.
Improved Polyurethane Storage Tank Performance FY2008 Final Report – Revision 3 Seaman Corporation
Page 25 of 84
Because of this, the technique was abandoned and a time-temperature–stress
superposition methods was investigated.
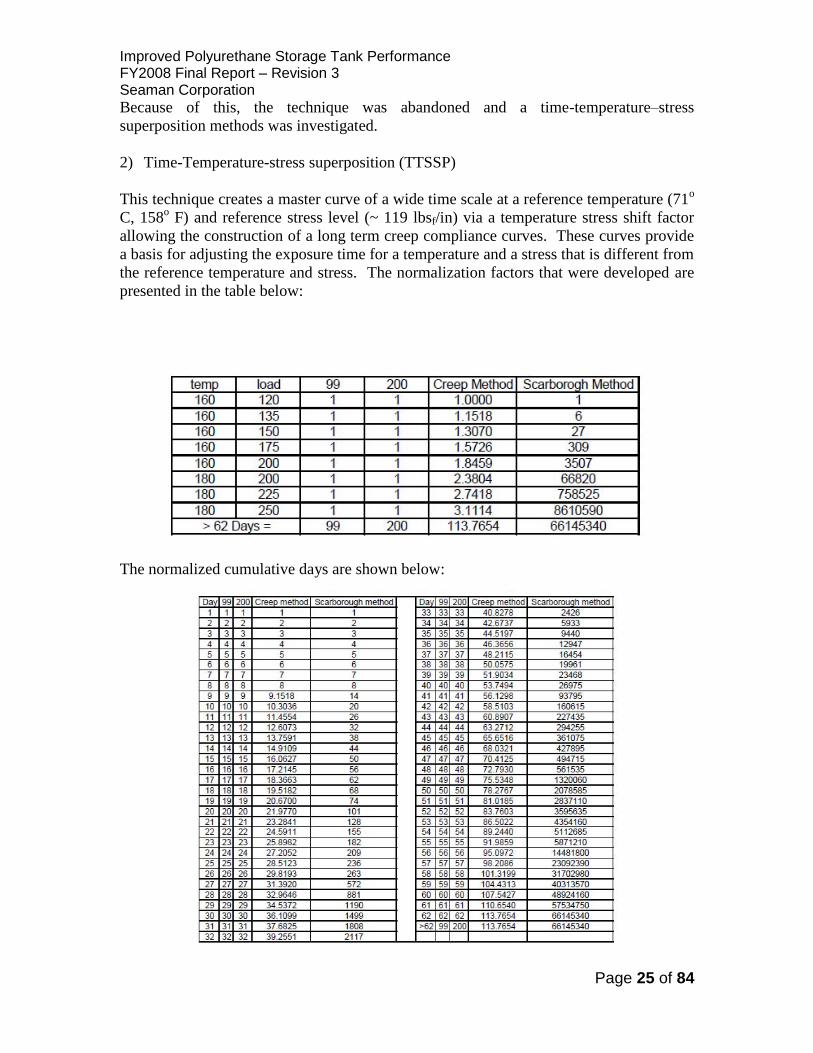
2) Time-Temperature-stress superposition (TTSSP)
This technique creates a master curve of a wide time scale at a reference temperature (71o
C, 158o F) and reference stress level (~ 119 lbsf/in) via a temperature stress shift factor
allowing the construction of a long term creep compliance curves. These curves provide
a basis for adjusting the exposure time for a temperature and a stress that is different from
the reference temperature and stress. The normalization factors that were developed are
presented in the table below:
The normalized cumulative days are shown below:

Improved Polyurethane Storage Tank Performance FY2008 Final Report – Revision 3 Seaman Corporation
Page 26 of 84
The normalization data indicates that samples that survived 29 days using the test
protocol used in this study for the dead-load testing, would have met the 3 year service
requirement at a load that is 2.5x the maximum in-plane stress that occurs in a full 50,000
gallon collapsible fuel tank at a service temperature of 158o F. The data in the table under
the Scarborough Method is the result of the time-temperature-stress superposition study
that was performed. This study is presented in detail in appendix L. The table gives the
number of days at the reference temperature and load that result from the increase
temperature and load that were used in the study.
The table shows that 29 days using the study dead load test protocol is equivalent to 1190
days (3.26 years) at a service temperature of 158°F and 2.5X the maximum in plane
stress.
3) DOE analysis
DOE analysis was performed using a number of different scenarios in order to determine
which approach provided the best fit. The following approaches were examined:
a) Using the lowest of the three times to failure for a given trial as the outcome of
the trial and using the arbitrary 99 day value for specimens that did not fail during
the duration of the test.
b) Using the average of the three times to failure for a given trial as the outcome of
the trial and using the arbitrary 99 day value for specimens that did not fail during
the duration of the test.
c) Using all three times to failure for a given trial as replicates and using the
arbitrary 99 day value for specimens that did not fail during the duration of the
test.
d) Using all three times to failure for a given trial as replicates and using an arbitrary
200 day value for specimens that did not fail during the duration of the test.
e) Using all creep rate normalized values for all three times to failure for a given
trial as replicates with a normalized 99 day value for specimens that did not fail
during the duration of the test.
f) Using all Scarborough normalized values for all three times to failure for a given
trial as replicates with a normalized 99 day value for specimens that did not fail
during the duration of the test.
g) Using Scarborough normalized values for the average of the three times to failure
for a given trial as the outcome for the trial and using the 99 day value for
specimens that did not fail during the duration of the test.

Improved Polyurethane Storage Tank Performance FY2008 Final Report – Revision 3 Seaman Corporation
Page 27 of 84
Copies of several of the DOE analysis are shown in Appendix L. The results of all are summarized in the table below:
Note: “Junk” was a categorical factor added so that all three test specimens from each sample could be treated individually. This factor should not have exhibited any significance.

Improved Polyurethane Storage Tank Performance FY2008 Final Report – Revision 3 Seaman Corporation
Page 28 of 84
The analysis that used the average of the results for the three specimens as the outcome of
the trial provided the best statistical model for the welding process with a low probability
that lack of fit is due to noise, reasonable R2
value and agreement, and adequate
precision. The model developed by the DOE can be used to explore design space, in
terms of actual factors, as follows:
Dead-load Time (Test days duration not normalized) =
-6644.98807
-4.95395 x Pressure
+69.33882 x Dwell Time
+33.91351 x 2MP Temp
+ .005436396 x Pressure2
-1.03385 x Dwell Time2
-.042482 x 2MP Temp2
+.12593 x Pressure x Dwell Time
+.010093 x Pressure x 2 MP Temp
-018333 x Dwell Time x 2 MP Temp
The model provides an optimum setting of 398.4o F for the 2 MP temperature, a 2 minute
dwell time, and a 30 psi pressure. The average dead-load time predicted for these
conditions is 96.2355 days.
However, in the results of all 7 analyses, it is very clear that welding temperature is the
overwhelming contributor to dead-load durability, with slight variation in durability
resulting from the other factors. At a 2 MP temperature of about 400o F, durable seams,
with dead-load test times greater than 75 days, would be produced using any combination
of sealing pressures and dwell times. It is interesting that the 400° F 2 MP temperature
experiments would have resulted in bond-line temperatures at or above the amorphous
phase melt transition for the dwell times used for the trials. Based on the model derived
from the DOE looking at averages, seams with dead-load times greater than 29 days
(more than 3 years projected life based on the normalization data), could be produced
over a broader range of process conditions.
There are two items of interest that should be noted:
1) The predominant mode of failure for samples run at high temperature is tear of the
fabric, rather than separation of the seam. All of the samples that failed using the 405 oF 2 MP temperature failed by tear. At 405°F there is some damage to the base cloth
that results in fabric failure.
2) The model that used the Scarborough transformation of the average of the three times
to failure for a given trial as the outcome for the trial provided a good model except
for its lack of fit. The significant lack of fit was the result of one outlying data point,
at a low temperature, that provided good dead-load results. When this data point was
excluded, the fit was very good. The DOE is shown in Appendix L1.

Improved Polyurethane Storage Tank Performance FY2008 Final Report – Revision 3 Seaman Corporation
Page 29 of 84
The results are summarized below:
The model, with the outlier excluded, makes predictions for optimum conditions that are in line with the model chosen above, with
temperature the overwhelming contributor to dead-load durability in normalized time. A surface plot of the response curve is shown
below:
Improved Polyurethane Storage Tank Performance FY2008 Final Report – Revision 3 Seaman Corporation
Page 30 of 84
4.2 Radio Frequency Welding
High Frequency or Radio Frequency (RF) welding is a form of bar welding that uses high
frequency electromagnetic energy to generate heat in polar materials resulting in melting
and welding after cooling.
The RF welding press has two platens, a moveable one and a fixed one that is also called
a bed. The upper platen is generally connected to an RF generator and the lower platen to
electrical earth. Tooling, for this study was an aluminum welding bar, attached to the
upper platen. The coated fabric to be seamed is overlapped and placed between the
platens and the press is lowered so that a preset amount of pressure is applied to the joint
area. Once the fabric joint is held in place, the RF energy is applied in a controlled
manner and the joint area is heated. This can be applied for a specific time, in which case
it is referred to as the welding or heating time. Once the controlled heat cycle is
complete, the platens continue to hold the joint in place for a preset time allowing the
weld to cool, and the urethane to solidify. This is generally referred to as the cooling
time. Once the cooling time is complete, the press opens. The platens, or sometimes the
tool itself, are generally cooled or temperature regulated.
The RF welding work done for this study was performed at Seaman Corporation.
Seaman Corporation has a long history of using RF welding for the fabrication of
architectural structures including inflatable and tension structures. The equipment used
for the study was a Fiab 922 High Frequency Welder. The control system for the welder
allowed for producing seams under two different modes, an anode control mode (AC
mode) or an energy control mode (EC mode). In the AC mode, the operator selects all of
the process control factors; welding time, anode current, and pressure. When a weld is
initiated in the AC mode, the platens close and apply the preset pressure to the seam,
there is a specified preseal delay and then the anode current is applied and increases up to
its set value. Once the anode current reaches the set value, the welding time starts and
the power is automatically regulated to keep the anode current at the target level. When
the heating time is complete, the power is turned off and the seam is allowed to cool
under pressure. When the cooling time is reached, the pressure is released and the platens
open. In the EC mode, a program calculates the energy required for a specific tool area.
Based on the calculation, it chooses welding time, anode current and pressure. There is an
opportunity using this program to apply factors to the energy and the pressure to vary
these to obtain the desired welding characteristics. The overall cycle for welding in the
EC mode is the same as in the AC mode, except that the energy applied to the weld is
controlled rather than manually setting the anode current and welding time. As noted
above, the preseal time, the time that a seam is held together before any energy input, and
the cooling time, the amount of time that the seam is held together after the energy is shut
off giving the seam an opportunity to cool are manually selected for both welding modes.
A schematic and the spec for the welder are shown in Appendix M.

Improved Polyurethane Storage Tank Performance FY2008 Final Report – Revision 3 Seaman Corporation
Page 31 of 84
Based on Seaman’s experience and with the assistance of Fiab’s manufacturer’s
representative, the following parameters were identified as the critical control parameters
for welding trials:
AC Mode
1) Pressure
2) Anode current
3) Welding time
4) Cooling time
EC Mode
1) Pressure factor
2) Energy factor
3) Cooling time
In preparing for the DOE work, a number of trials were run on the welder in order to
select the correct tool size and configuration for the work, to minimize the number of
control factors, and to develop ranges for the factors.
A variety of bar lengths and widths were investigated, including a bar with grooves in the
surface to allow for flow of molten polyurethane compound. A 2 in. x 33 in. flat bar gave
the best results with seam adhesion values in the target range and seams that pulled to the
base fabric cleanly along the entire length and width of the bar. This aluminum bar was
chosen as the tool for the work.
It was decided to hold the cooling time constant for the experiments to reduce the number
of variables to 3 for the AC mode study. The same cooling time was used for the EC
mode study. Selection of the ranges for the remaining factors was by trial and error.
Factor ranges were chosen that did not appear to damage the fabric, provided good initial
adhesion values and gave clean weld adhesion pulls along the entire tool area. Since
radio frequency energy is used to heat the weld area for dielectric welding, it was not
possible to insert a thermocouple into the weld area to determine bond-line temperatures
that were obtained during heating and cooling. Unsuccessful attempts were made to
determine the peak temperature using a color change temperature indicator tape and using
an Infrared (IR) pyrometer. Based on the flow of compound during welding, it is
expected that most welding conditions gave peak temperatures in excess of the
amorphous phase transition.
For the AC mode study a 3 factor, 3 level, full factorial design was run as outlined below:
Factor 1: Anode current (amperage): 1.5, 1.8, 2.1 amps
Factor 2: Seal Time: 5, 6, 7 seconds
Factor 3: Pressure: 4.5, 5.2, 5.9 bar
Improved Polyurethane Storage Tank Performance FY2008 Final Report – Revision 3 Seaman Corporation
Page 32 of 84
As noted previously, this design requires 27 experiments. In addition, 3 replicates were
run to provide information regarding error. The total number of dead-load specimens for
testing was 90.
For the EC mode study, a 2 factor, 3 level, full factorial design was run as outlined
below:
Factor 1: Energy Factor: 0.8, 1.0, 1.2
Factor 2: Pressure factor: 0.9, 1.0, 1.1 (corresponding to a 4.8, 5.3, 5.8 bar)
This design requires 9 experiments. One replicate was run. The total number of dead-
load specimens for testing was 30.
Welding of the DOE samples took 3 days to complete. Several warm-up and test welds
were made at the start of each day and any time the machine sat idle for a period of time
to insure that the welding equipment was at steady state prior to preparing the DOE
samples. The experimental design and the data collected while generating the samples is
shown in Appendices N and N1. Samples that were prepared for the DOE were tested for
initial properties and for high temperature fuel immersion testing using the exact same
protocol (the same load, temperature, time schedule) as was used for the impulse welding
samples. For the AC mode DOE, about half of the samples failed during the duration of
the test. For the EC mode DOE, about two-thirds of the sample failed during the duration
of the test.
4.2.1 Data Analysis
As was done with the impulse welding study, a value of 99 days was assigned to all
specimens that did not fail during the duration of the test. DOE analysis was performed
using the method that provided the best correlation for the impulse welding study which
used the average of the three times to failure for a given trial as the outcome of the trial.
The DOE analysis is provided in Appendices O and O1.
For the AC mode DOE, the model F value was 3.29 which implied that the model is
significant. The lack of fit F value of 2.14 indicates the lack of fit is not significant
relative to pure error. There was not the best agreement between the actual and predicted
R2
values which may indicate that there is a large block effect due to the run order or
more likely, that the model should be reduced. The signal to noise ratio of 6.95 indicates
adequate signal. Based on these results, the model can be used to explore design space.
In terms of actual factors the model would predict the following:

Improved Polyurethane Storage Tank Performance FY2008 Final Report – Revision 3 Seaman Corporation
Page 33 of 84
Dead-load Time (Test days duration not normalized) =
-800.24734
+630.76465 x Amperage
+269.82990 x Seal Time
-168.42268 x Pressure
-139.77002 x Amperage2
-15.52374 x Seal Time2
+8.56832 x Pressure2
-56.20370 x Amperage x Seal Time
+36.11111 x Amperage x Seal Time
+2.10317 x Seal Time x Pressure
The model provides an optimum setting of 1.62846 amps, 6.01632 second seal time and
4.5 bar pressure. The average dead-load time predicted for these conditions is 98.2664
test days. This has not been normalized for predicted life but is well beyond the 3 year
requirement.
At a 4.5 bar pressure, the operating range that will produce a durable seam, with dead-
load time greater than 75 days, is very large, as can be seen in the response surface for
this experiment. This is provided in Appendix O. Based on the model derived from the
DOE looking at averages, seams with dead-load times greater than 29 days (more than 3
years of projected life), would be produced over the majority of the entire design space.
One item of interest is that at the 7 second seal time and at the maximum anode current,
there appears to be a number of short term failures in the fabric, due to fabric tear, rather
than a separation of the weld. The seal times were restricted to less than 7 seconds to
guard against this issue.
For the EC Mode DOE, the model F value was 14.07 which implied that the model is
significant. The lack of fit F value of 0.12 indicates the lack of fit is not significant
relative to pure error. There was good agreement between the actual and predicted R2
value. The signal to noise ratio of 8.832 indicates adequate signal. Based on these
results, the model can be used to explore design space. In terms of actual factors the
model would predict the following:
Dead-load Time (Test days duration not normalized) =
+303.31889
-203.61111 x Energy
-51.11111 x Pressure
Improved Polyurethane Storage Tank Performance FY2008 Final Report – Revision 3 Seaman Corporation
Page 34 of 84
The model provides an optimum setting of 0.83 for the energy factor and a 0.92 for the
pressure factor. This would correspond roughly to a 1.66 amp anode setting and a 4.8 bar
pressure with seal time varying to achieve the energy target. Seal times varied from 8.5 to
12 seconds for these trials. Aside from the seal times, these conditions are in good
agreement with the optimum setting provided by the AC mode DOE. The average dead-
load time predicted for these conditions is 87.5714 test days. This has not been
normalized for predicted life but is well beyond the 3 year requirement.
The operating range for the EC mode is very restricted as compared to the design space
for the AC mode, with a narrow window of conditions that produce durable seams, with
dead-load times greater than 75 days. Based on the model derived from the DOE looking
at averages, seams with dead-load times greater than 29 days (more than 3 years
projected life based on the normalization data) the operating range is much broader.
At the high energy factor levels, there appears to be a number of immediate or short term
failures in the fabric, due to fabric tear, rather than a separation of the weld. The fabric
failure at the loads used in the study is due to base fabric damage during the welding
process. The energy factor would need to be restricted to 1.1 or less to prevent this being
an issue in achieving expected life requirements. The high seal times chosen by the EC
program mode definitely contributed to the issue.
Based on the study, the best approach for using the RF welder for fuel tank seams is to
use the AC mode of operation.
4.3 Hot Air Welding
Hot air welding, sometimes called rotary welding, is a continuous welding process
where the pieces to be seamed continuously move through the weld area, generally pulled
along by a pair of drive wheels. Hot air is blown into the weld area through a nozzle that
approximates the width of the seam, with the heated air impinging on both of the surfaces
to be welded as the fabric is pulled through driven wheels where a controlled welding
pressure is applied. The air flow rate is fixed and the temperature of the air is controlled.
A second set of driven wheels are located behind the pressure wheels and are used to
control the tension in the fabric. These also apply some pressure to the seam area as the
weld cools. However, the cooling is not controlled in any way.
It was the initial plan for the study to work with fuel tank fabricators to generate samples
for evaluation in the study. However, contract activity at the fabricators prevented using
this approach. Consequently, the work done on hot air welding was performed jointly by
Seaman Corporation personnel and engineering personnel from a local hot air equipment
manufacturer whose welder is most commonly used by fuel tank fabricators. Both
Seaman and the hot air equipment manufacturer have experience in using Hot Air
Welding equipment on a variety of coated fabrics.

Improved Polyurethane Storage Tank Performance FY2008 Final Report – Revision 3 Seaman Corporation
Page 35 of 84
All of the work performed for the study used a T-500 welder. The T-500 welder is used
by several current fuel tank manufacturers. Information on the T-500 welder is provided
in Appendix S. A picture of the weld area is shown below:
When a weld is to be run using the T-500, the edge of one fabric panel is positioned in
the upper part of the guider and the edge of the mating panel is positioned in the lower
part of the guider to help maintain overlap width. The welding wheels are opened and
the fabric is pushed into the nip and then the wheels are closed to a preset pressure. The
upper and lower panels come together in a V at the welding wheel nip. The weld is then
initiated. The nozzle swings into a preset position between the fabric panels and into the
fabric V and begins blowing hot air at a controlled temperature. There is an opportunity
to set a delay so that the fabric preheats slightly before the welding wheels begin to pull
the fabric into the nip at the preset speed. When the weld is complete, the nozzle swings
out of position and the nip rollers are opened.
Based on the experience of the hot air equipment manufacturer, four variables were
identified as critical control parameters for making a good hot air weld. These were as
follows:
1) Hot Air Temperature
2) Speed of welding
3) Type of weld rollers (this relates to the actual pressure and time in the nip area)
4) The location of the air nozzle in relation to the nip of the welding wheels
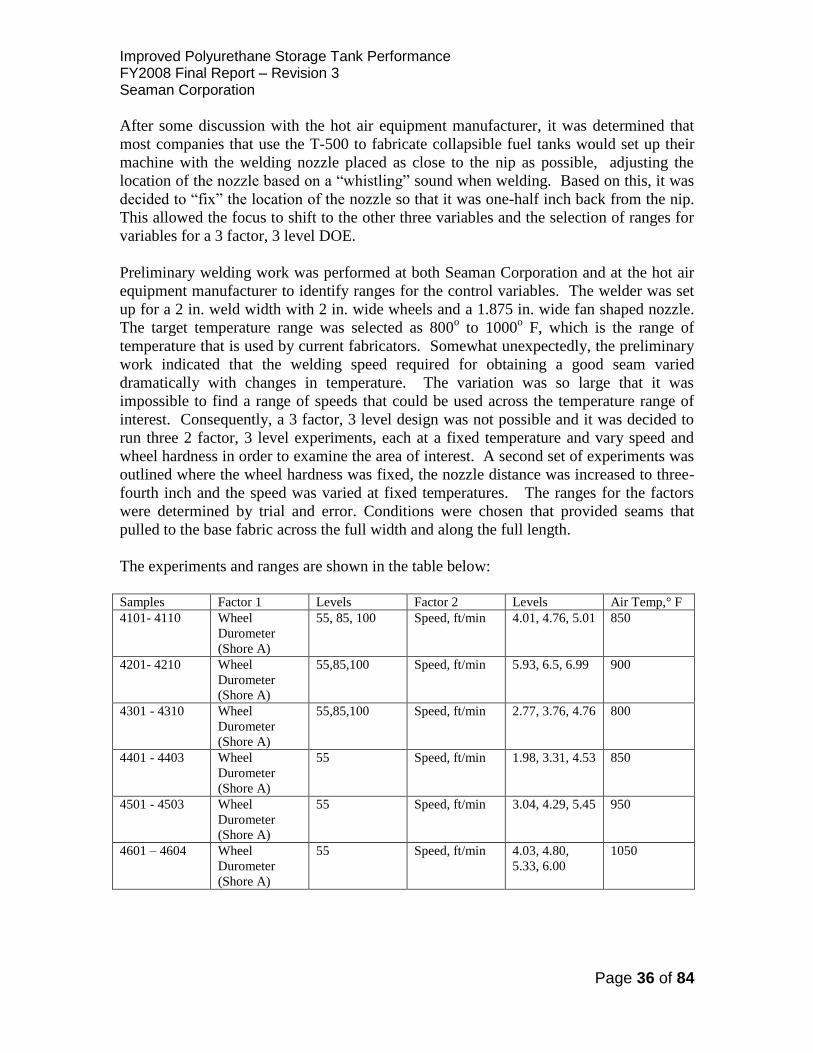
Improved Polyurethane Storage Tank Performance FY2008 Final Report – Revision 3 Seaman Corporation
Page 36 of 84
After some discussion with the hot air equipment manufacturer, it was determined that
most companies that use the T-500 to fabricate collapsible fuel tanks would set up their
machine with the welding nozzle placed as close to the nip as possible, adjusting the
location of the nozzle based on a “whistling” sound when welding. Based on this, it was
decided to “fix” the location of the nozzle so that it was one-half inch back from the nip.
This allowed the focus to shift to the other three variables and the selection of ranges for
variables for a 3 factor, 3 level DOE.
Preliminary welding work was performed at both Seaman Corporation and at the hot air
equipment manufacturer to identify ranges for the control variables. The welder was set
up for a 2 in. weld width with 2 in. wide wheels and a 1.875 in. wide fan shaped nozzle.
The target temperature range was selected as 800o to 1000
o F, which is the range of
temperature that is used by current fabricators. Somewhat unexpectedly, the preliminary
work indicated that the welding speed required for obtaining a good seam varied
dramatically with changes in temperature. The variation was so large that it was
impossible to find a range of speeds that could be used across the temperature range of
interest. Consequently, a 3 factor, 3 level design was not possible and it was decided to
run three 2 factor, 3 level experiments, each at a fixed temperature and vary speed and
wheel hardness in order to examine the area of interest. A second set of experiments was
outlined where the wheel hardness was fixed, the nozzle distance was increased to three-
fourth inch and the speed was varied at fixed temperatures. The ranges for the factors
were determined by trial and error. Conditions were chosen that provided seams that
pulled to the base fabric across the full width and along the full length.
The experiments and ranges are shown in the table below:
Samples Factor 1 Levels Factor 2 Levels Air Temp,° F
4101- 4110 Wheel
Durometer
(Shore A)
55, 85, 100 Speed, ft/min 4.01, 4.76, 5.01 850
4201- 4210 Wheel
Durometer
(Shore A)
55,85,100 Speed, ft/min 5.93, 6.5, 6.99 900
4301 - 4310 Wheel
Durometer
(Shore A)
55,85,100 Speed, ft/min 2.77, 3.76, 4.76 800
4401 - 4403 Wheel
Durometer
(Shore A)
55 Speed, ft/min 1.98, 3.31, 4.53 850
4501 - 4503 Wheel
Durometer
(Shore A)
55 Speed, ft/min 3.04, 4.29, 5.45 950
4601 – 4604 Wheel
Durometer
(Shore A)
55 Speed, ft/min 4.03, 4.80,
5.33, 6.00
1050
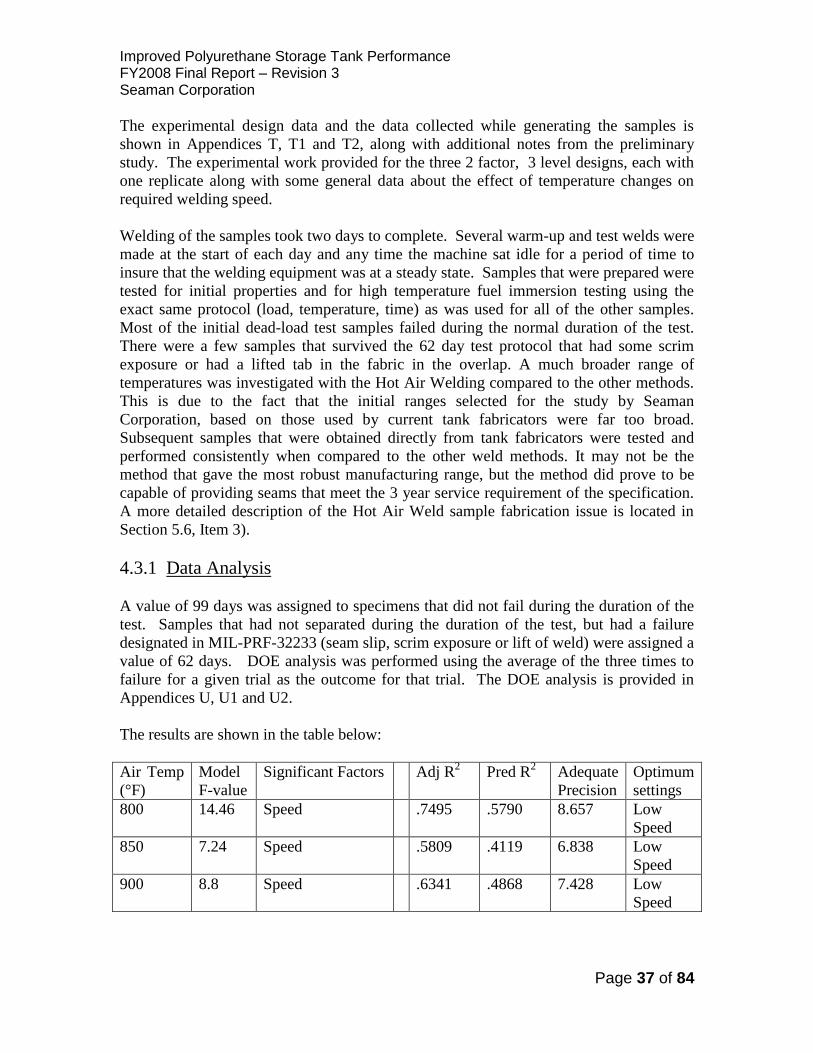
Improved Polyurethane Storage Tank Performance FY2008 Final Report – Revision 3 Seaman Corporation
Page 37 of 84
The experimental design data and the data collected while generating the samples is
shown in Appendices T, T1 and T2, along with additional notes from the preliminary
study. The experimental work provided for the three 2 factor, 3 level designs, each with
one replicate along with some general data about the effect of temperature changes on
required welding speed.
Welding of the samples took two days to complete. Several warm-up and test welds were
made at the start of each day and any time the machine sat idle for a period of time to
insure that the welding equipment was at a steady state. Samples that were prepared were
tested for initial properties and for high temperature fuel immersion testing using the
exact same protocol (load, temperature, time) as was used for all of the other samples.
Most of the initial dead-load test samples failed during the normal duration of the test.
There were a few samples that survived the 62 day test protocol that had some scrim
exposure or had a lifted tab in the fabric in the overlap. A much broader range of
temperatures was investigated with the Hot Air Welding compared to the other methods.
This is due to the fact that the initial ranges selected for the study by Seaman
Corporation, based on those used by current tank fabricators were far too broad.
Subsequent samples that were obtained directly from tank fabricators were tested and
performed consistently when compared to the other weld methods. It may not be the
method that gave the most robust manufacturing range, but the method did prove to be
capable of providing seams that meet the 3 year service requirement of the specification.
A more detailed description of the Hot Air Weld sample fabrication issue is located in
Section 5.6, Item 3).
4.3.1 Data Analysis
A value of 99 days was assigned to specimens that did not fail during the duration of the
test. Samples that had not separated during the duration of the test, but had a failure
designated in MIL-PRF-32233 (seam slip, scrim exposure or lift of weld) were assigned a
value of 62 days. DOE analysis was performed using the average of the three times to
failure for a given trial as the outcome for that trial. The DOE analysis is provided in
Appendices U, U1 and U2.
The results are shown in the table below:
Air Temp
(°F)
Model
F-value
Significant Factors Adj R2 Pred R
2 Adequate
Precision
Optimum
settings
800 14.46 Speed .7495 .5790
8.657 Low
Speed
850 7.24 Speed .5809 .4119 6.838 Low
Speed
900 8.8 Speed .6341 .4868 7.428 Low
Speed
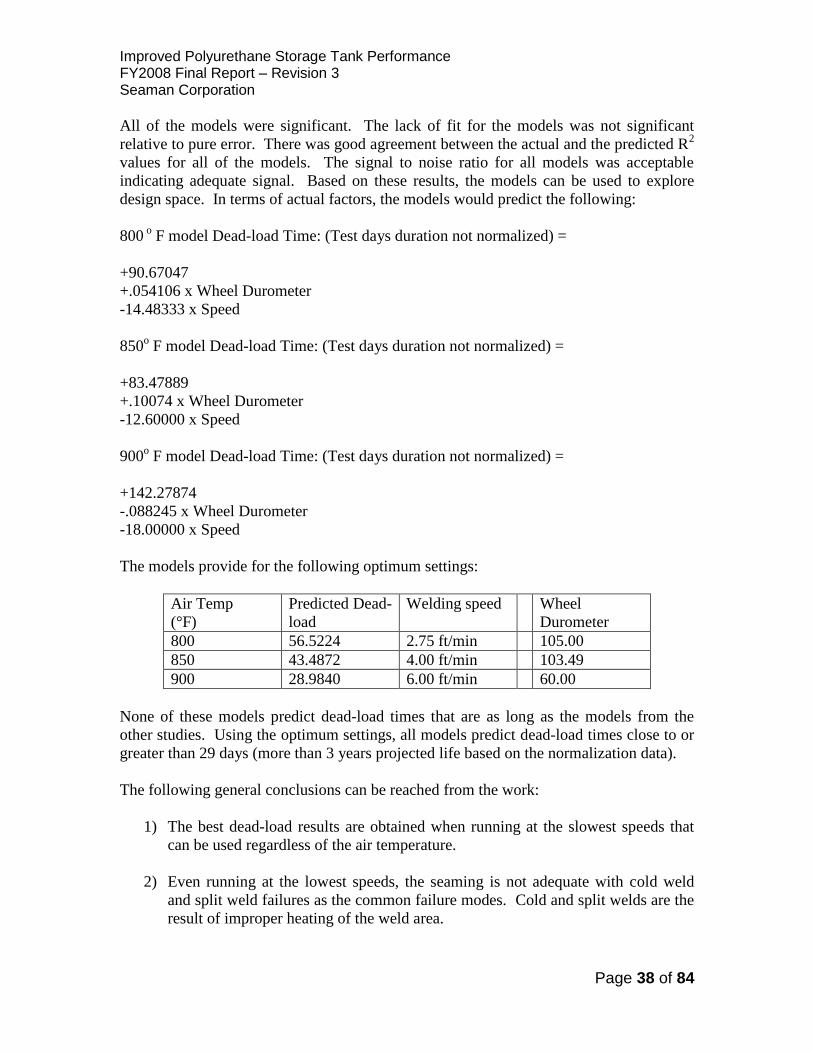
Improved Polyurethane Storage Tank Performance FY2008 Final Report – Revision 3 Seaman Corporation
Page 38 of 84
All of the models were significant. The lack of fit for the models was not significant
relative to pure error. There was good agreement between the actual and the predicted R2
values for all of the models. The signal to noise ratio for all models was acceptable
indicating adequate signal. Based on these results, the models can be used to explore
design space. In terms of actual factors, the models would predict the following:
800 o F model Dead-load Time: (Test days duration not normalized) =
+90.67047
+.054106 x Wheel Durometer
-14.48333 x Speed
850o F model Dead-load Time: (Test days duration not normalized) =
+83.47889
+.10074 x Wheel Durometer
-12.60000 x Speed
900o F model Dead-load Time: (Test days duration not normalized) =
+142.27874
-.088245 x Wheel Durometer
-18.00000 x Speed
The models provide for the following optimum settings:
Air Temp
(°F)
Predicted Dead-
load
Welding speed Wheel
Durometer
800 56.5224 2.75 ft/min 105.00
850 43.4872 4.00 ft/min 103.49
900 28.9840 6.00 ft/min 60.00
None of these models predict dead-load times that are as long as the models from the
other studies. Using the optimum settings, all models predict dead-load times close to or
greater than 29 days (more than 3 years projected life based on the normalization data).
The following general conclusions can be reached from the work:
1) The best dead-load results are obtained when running at the slowest speeds that
can be used regardless of the air temperature.
2) Even running at the lowest speeds, the seaming is not adequate with cold weld
and split weld failures as the common failure modes. Cold and split welds are the
result of improper heating of the weld area.

Improved Polyurethane Storage Tank Performance FY2008 Final Report – Revision 3 Seaman Corporation
Page 39 of 84
3) Welding speed is the dominant control variable. The dead-load result increases
with decreasing weld speed. Wheel Durometer had no significant effect on the
dead-load results.
4) As the gap between the nozzle and the nip is increased, the welding speed must be
decreased to obtain similar seam performance. The significance of the nozzle
location became obvious as the later experiments were conducted.
5) Additional studies were conducted with additional hot air welding samples
produced by the hot air equipment manufacturer and by current fuel tank
fabricators. The results highlight the importance of maintaining tight process and
quality control, especially when compared to the much broader operational
parameters initially used. Results from all sample testing are presented in Sections
5.5 and 5.6.
4.4 Hot Bar Welding
Hot bar welding is based on the principle that if two thermoplastic items are pressed
against a heated metal bar, they will soften and a seam can be made between them. The
equipment is generally comprised of one or two metal bars, one or both of which is
heated. The heating can be electrical, by steam, or by circulating a heat transfer fluid
through them. One of the bars is generally moveable, to allow placement and removal of
the items to be welded. The weld pressure can be applied using a variety of methods:
mechanically, pneumatically or via the use of a bladder. A release coating or release
membrane is often located between the heated bar and the items to be seamed to prevent
molten material from sticking to the bar. With conventional hot bar welding, the heated
bar is removed while the weld is still hot or molten. The joint is not cooled under
pressure during the cooling phase. Heated tool/cooled tool welding has been developed
where the weld is held under pressure while the tool is cooled.
The Hot Bar welding work for this study was performed by an experienced fabricator that
has been using hot bar welding to manufacture collapsible fuel tanks using rubber coated
fabrics. They had limited experience in the fabrication of fuel tanks with polyurethane
coated fabrics. Consequently, the selection of process variables and the preliminary work
to develop ranges for these variables was done jointly with Seaman Corporation. Since
the welder is a hot bar welder, the potential control parameters fall in line with other bar
welders, those being:
1) Pressure
2) Temperature
3) Dwell Timing
4) Cooling Temperature

Improved Polyurethane Storage Tank Performance FY2008 Final Report – Revision 3 Seaman Corporation
Page 40 of 84
The hot bar welder used was a scaled down version of the bar welder used in their normal
manufacturing process. The welder was about 6 foot long. The following is a general
schematic of the welding head:
Hot oil is circulated through the lower bar to heat the bar and there is a thermocouple in
the lower bar to measure the temperature. The upper bar is also fixed and is not heated.
Air bags or bladders are located between both the upper and lower bars. The fabrics to be
seamed are positioned between the upper and lower bars. When the seam area is being
heated, the lower bag is deflated and the upper bag is pressurized with air to hold the
seam together under pressure during heating and welding. The seam is heated to the
desired temperature, held for a set amount of time, and then the upper bag is deflated and,
the seamed panel is removed. The release liner on both sides of the welded material is a
fabric or film, such as Teflon coated fiberglass that releases from the urethane easily,
allowing for the material to separate cleanly from the upper and lower bar assemblies. If
cooling is planned, at the end of the heating time, the lower bag is pressurized with
chilled air pushing the fabric away from the heated platen, to maintain pressure on the
seam while it is cooled. Once cooling is complete, the lower bag is deflated and the weld
is complete.
In order to provide for the best control during the testing, the welder was equipped with
some additional thermocouples to allow monitoring of the seam temperature at all
external seam surfaces and in all bond-lines. Bond-line temperature was the basis for the
control of the heating portion of the welding process.
The fabricator has generally used double strap butt seams for the production of thermoset
collapsible fuel tanks and generally run using a constant bladder pressure during the
heating period and remove the weld while hot rather than using a cooling period where
the weld is held under pressure during cooling. For the DOE study, 2 in. overlap and a 6
in. double strap butt seams were prepared for testing, holding the bladder pressure
constant, the bond-line temperature constant, varying the dwell time and the cooling
temperature.
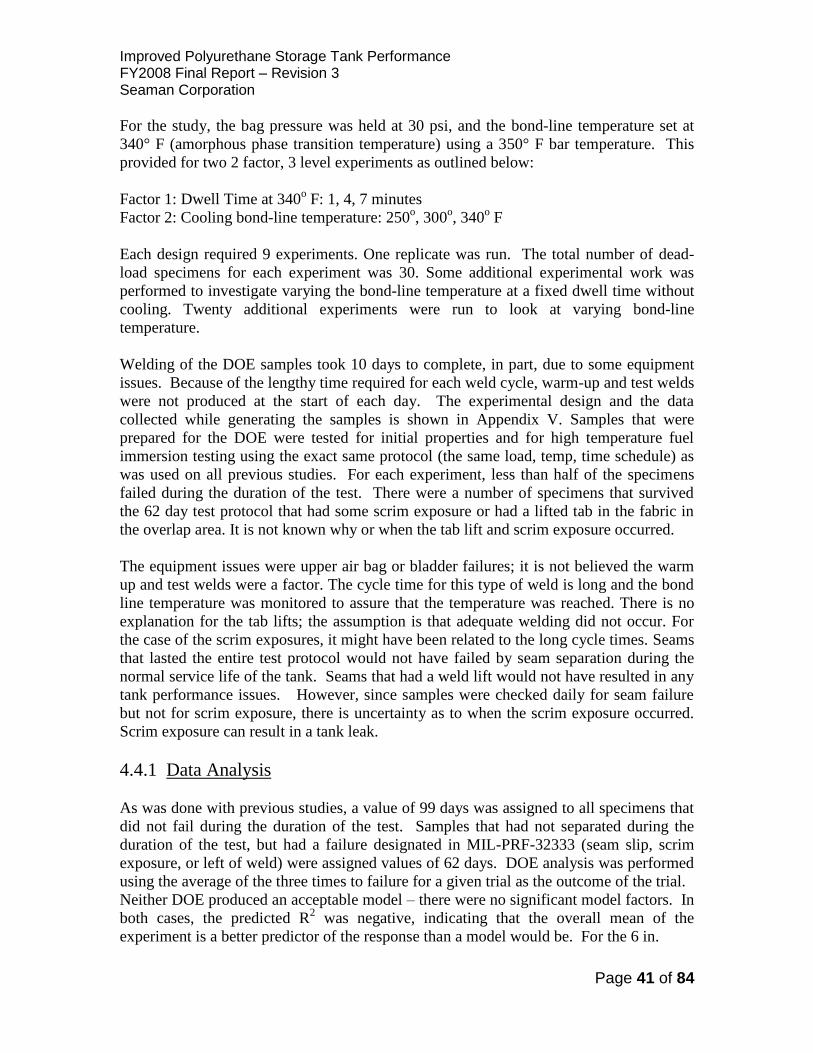
Improved Polyurethane Storage Tank Performance FY2008 Final Report – Revision 3 Seaman Corporation
Page 41 of 84
For the study, the bag pressure was held at 30 psi, and the bond-line temperature set at
340° F (amorphous phase transition temperature) using a 350° F bar temperature. This
provided for two 2 factor, 3 level experiments as outlined below:
Factor 1: Dwell Time at 340o F: 1, 4, 7 minutes
Factor 2: Cooling bond-line temperature: 250o, 300
o, 340
o F
Each design required 9 experiments. One replicate was run. The total number of dead-
load specimens for each experiment was 30. Some additional experimental work was
performed to investigate varying the bond-line temperature at a fixed dwell time without
cooling. Twenty additional experiments were run to look at varying bond-line
temperature.
Welding of the DOE samples took 10 days to complete, in part, due to some equipment
issues. Because of the lengthy time required for each weld cycle, warm-up and test welds
were not produced at the start of each day. The experimental design and the data
collected while generating the samples is shown in Appendix V. Samples that were
prepared for the DOE were tested for initial properties and for high temperature fuel
immersion testing using the exact same protocol (the same load, temp, time schedule) as
was used on all previous studies. For each experiment, less than half of the specimens
failed during the duration of the test. There were a number of specimens that survived
the 62 day test protocol that had some scrim exposure or had a lifted tab in the fabric in
the overlap area. It is not known why or when the tab lift and scrim exposure occurred.
The equipment issues were upper air bag or bladder failures; it is not believed the warm
up and test welds were a factor. The cycle time for this type of weld is long and the bond
line temperature was monitored to assure that the temperature was reached. There is no
explanation for the tab lifts; the assumption is that adequate welding did not occur. For
the case of the scrim exposures, it might have been related to the long cycle times. Seams
that lasted the entire test protocol would not have failed by seam separation during the
normal service life of the tank. Seams that had a weld lift would not have resulted in any
tank performance issues. However, since samples were checked daily for seam failure
but not for scrim exposure, there is uncertainty as to when the scrim exposure occurred.
Scrim exposure can result in a tank leak.
4.4.1 Data Analysis
As was done with previous studies, a value of 99 days was assigned to all specimens that
did not fail during the duration of the test. Samples that had not separated during the
duration of the test, but had a failure designated in MIL-PRF-32333 (seam slip, scrim
exposure, or left of weld) were assigned values of 62 days. DOE analysis was performed
using the average of the three times to failure for a given trial as the outcome of the trial.
Neither DOE produced an acceptable model – there were no significant model factors. In
both cases, the predicted R2 was negative, indicating that the overall mean of the
experiment is a better predictor of the response than a model would be. For the 6 in.

Improved Polyurethane Storage Tank Performance FY2008 Final Report – Revision 3 Seaman Corporation
Page 42 of 84
double strap butt seam, the average dead-load was 77.33 days. For the 2 in. overlap
seam, the average dead-load was 79.51 days. All of the actual dead-load results obtained
for the DOE samples were greater than 29 days (more than 3 years projected life based on
normalization data).
The additional experimental work performed with varying bond-line temperature showed
that there was a tendency for samples to show more weld lift issues at bond-line
temperatures below 340° F and more tear and strip failures at temperatures above 340o F.
The 6 in. double strap butt samples seemed to be more prone to strip types of failures
than the 2 in. overlap seams, possibly due to a longer overall cycle time required to reach
the desired temperatures. In general, those samples that had longer overall cycle times,
greater than 30 minutes, were more prone to failures that were related to separation at the
seam; scrim exposure, tear, stripping of yarn from the weld.
The following general conclusions can be reached from the experimental work:
1) Operating the bar welder using a 30 psi bag pressure and a 340o F bond-line
temperature results in durable seams irrespective of the dwell time or the cooling
temperature.
2) Additional work is warranted to more thoroughly understand the effect of bond-
line temperature on dead-load performance with special focus on scrim exposure
and weld lift failures. The effect of bond line temperature on the weld integrity
was investigated during the study. Welds with good integrity were produced over
a broad temperature range. However, weld lifts and scrim exposures were not
checked on a daily basis as the testing was being performed. Weld lifts do not
represent a performance issue, but scrim exposure does. Since the samples are
immersed continuously in the high temperature fuel, in a sealed assembly, it was
not possible to physically see the sample without disassembling the fixture. Weld
lifts and scrim exposures were not observed until the samples were removed from
the dead load chamber. This became the justification for de-rating the samples to
62 days, since it is not known if the weld lifts or scrim exposures would lead to
eventual failure.
3) Both the 2 in. overlap and the 6 in. double strap butt seam, when properly
prepared, should provide for service lives that exceed the requirements of MIL-
PRF-32233. It is somewhat surprising that the overall dead-load times for both
seams are similar given that the 6 in. double strap butt seam has significantly
more overlap area to hold the seam together. However, a longer duration test
possibly could show some difference.

Improved Polyurethane Storage Tank Performance FY2008 Final Report – Revision 3 Seaman Corporation
Page 43 of 84
5.0 Manufacturing Variability
5.1 Impulse Welding
For the impulse welding work, the pressure was a machine setting and the dwell time was
a machine setting. The cooling temperature, which was not selected as a process variable,
was also a machine setting. The 2 MP temperature was a result of setting the temperature
for the thermocouple in the lower bar. There was some adjustment required of the
thermocouple set point to achieve the correct 2 MP temperature. The adjustment
procedure was straightforward and new setting held over the course of a day within about
2 degrees F. Some slight adjustment was required when the machine was restarted the
next day. Once process variables were selected for the machine, the operator was
responsible for a number of tasks to complete a weld. In sequence this included, 1)
inputting the process parameters into the control panel, 2) positioning the first fabric
panel so that it was aligned correctly with the welding bar (accomplished by alignment
marks on the lower bar) and, 3) positioning the edge of the second fabric panel to ensure
that the overlap width was correct (accomplished by marking the first panel with a line
showing where the edge of the second panel needed to be positioned). After this was
completed, the operator pressed a button and the welding process ran to the settings that
were input.
Overall, the welding cycle time was very reproducible. A review of the heating time to
reach the 2 MP temperature shows it varied by less than a minute. The weld cycle time
was controlled. The cooling time increased with an increase in the 2 MP temperature. At
a given 2 MP temperature, it varied by a maximum of 2.5 minutes. Over the entire 2 MP
temperature range studied, it varied by 3.7 minutes.
Seam adhesion values varied with the 2 MP temperature. Lower 2 MP temperatures
provided lower average adhesion values and lower dead-load durability. In general, seam
appearance and quality was good when pulled in peel, pulling clean to the base fabric
over the entire length and width of the seam. This was true for the entire experimental
range.
5.2 RF Welding
For the RF welding work, all of the process variables were machine settings. Once
process variables were selected for the machine, the operator was responsible for a
number of tasks to complete a weld. In sequence this included, 1) inputting the process
parameters into the control panel, 2) positioning the first fabric panel so that it was
aligned correctly with the welding bar (accomplished by alignment marks on the lower
bar), and, 3) positioning the edge of the second fabric panel to ensure that the overlap
width was correct (accomplished by marking the first panel with a line showing where
the edge of the second panel needed to be located). After this was completed, the
operator pressed a button and the welding process ran to the settings that were input.
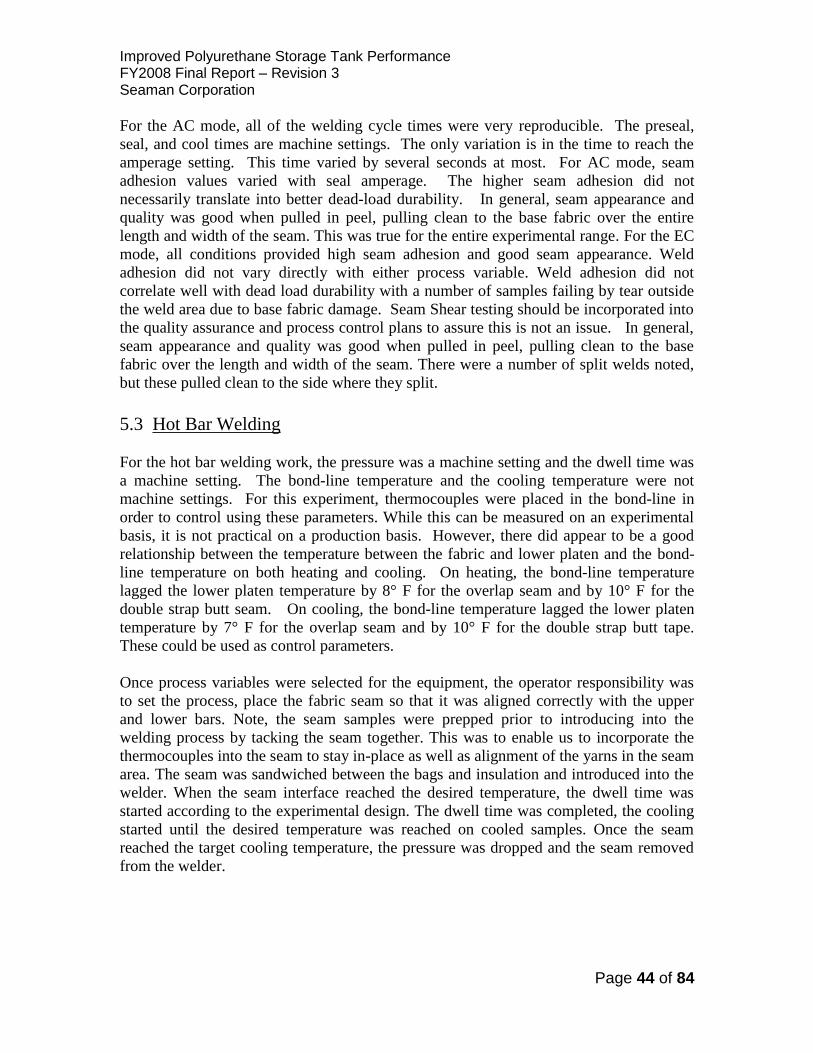
Improved Polyurethane Storage Tank Performance FY2008 Final Report – Revision 3 Seaman Corporation
Page 44 of 84
For the AC mode, all of the welding cycle times were very reproducible. The preseal,
seal, and cool times are machine settings. The only variation is in the time to reach the
amperage setting. This time varied by several seconds at most. For AC mode, seam
adhesion values varied with seal amperage. The higher seam adhesion did not
necessarily translate into better dead-load durability. In general, seam appearance and
quality was good when pulled in peel, pulling clean to the base fabric over the entire
length and width of the seam. This was true for the entire experimental range. For the EC
mode, all conditions provided high seam adhesion and good seam appearance. Weld
adhesion did not vary directly with either process variable. Weld adhesion did not
correlate well with dead load durability with a number of samples failing by tear outside
the weld area due to base fabric damage. Seam Shear testing should be incorporated into
the quality assurance and process control plans to assure this is not an issue. In general,
seam appearance and quality was good when pulled in peel, pulling clean to the base
fabric over the length and width of the seam. There were a number of split welds noted,
but these pulled clean to the side where they split.
5.3 Hot Bar Welding
For the hot bar welding work, the pressure was a machine setting and the dwell time was
a machine setting. The bond-line temperature and the cooling temperature were not
machine settings. For this experiment, thermocouples were placed in the bond-line in
order to control using these parameters. While this can be measured on an experimental
basis, it is not practical on a production basis. However, there did appear to be a good
relationship between the temperature between the fabric and lower platen and the bond-
line temperature on both heating and cooling. On heating, the bond-line temperature
lagged the lower platen temperature by 8° F for the overlap seam and by 10° F for the
double strap butt seam. On cooling, the bond-line temperature lagged the lower platen
temperature by 7° F for the overlap seam and by 10° F for the double strap butt tape.
These could be used as control parameters.
Once process variables were selected for the equipment, the operator responsibility was
to set the process, place the fabric seam so that it was aligned correctly with the upper
and lower bars. Note, the seam samples were prepped prior to introducing into the
welding process by tacking the seam together. This was to enable us to incorporate the
thermocouples into the seam to stay in-place as well as alignment of the yarns in the seam
area. The seam was sandwiched between the bags and insulation and introduced into the
welder. When the seam interface reached the desired temperature, the dwell time was
started according to the experimental design. The dwell time was completed, the cooling
started until the desired temperature was reached on cooled samples. Once the seam
reached the target cooling temperature, the pressure was dropped and the seam removed
from the welder.
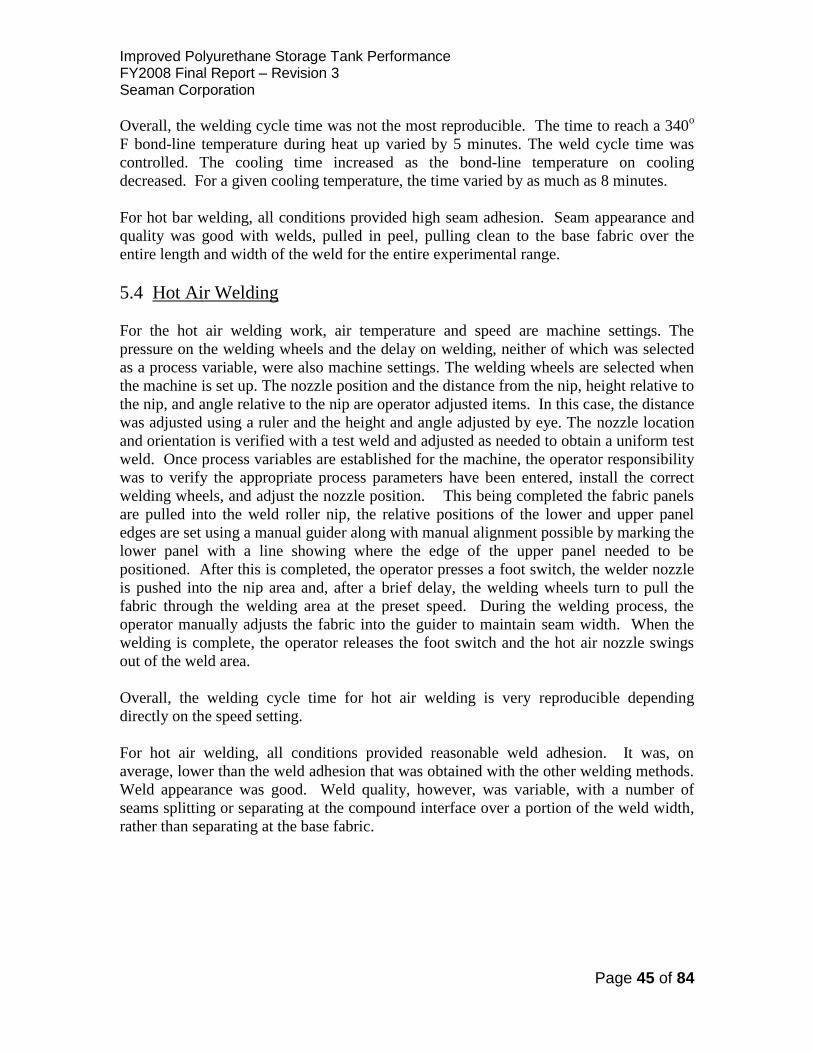
Improved Polyurethane Storage Tank Performance FY2008 Final Report – Revision 3 Seaman Corporation
Page 45 of 84
Overall, the welding cycle time was not the most reproducible. The time to reach a 340o
F bond-line temperature during heat up varied by 5 minutes. The weld cycle time was
controlled. The cooling time increased as the bond-line temperature on cooling
decreased. For a given cooling temperature, the time varied by as much as 8 minutes.
For hot bar welding, all conditions provided high seam adhesion. Seam appearance and
quality was good with welds, pulled in peel, pulling clean to the base fabric over the
entire length and width of the weld for the entire experimental range.
5.4 Hot Air Welding
For the hot air welding work, air temperature and speed are machine settings. The
pressure on the welding wheels and the delay on welding, neither of which was selected
as a process variable, were also machine settings. The welding wheels are selected when
the machine is set up. The nozzle position and the distance from the nip, height relative to
the nip, and angle relative to the nip are operator adjusted items. In this case, the distance
was adjusted using a ruler and the height and angle adjusted by eye. The nozzle location
and orientation is verified with a test weld and adjusted as needed to obtain a uniform test
weld. Once process variables are established for the machine, the operator responsibility
was to verify the appropriate process parameters have been entered, install the correct
welding wheels, and adjust the nozzle position. This being completed the fabric panels
are pulled into the weld roller nip, the relative positions of the lower and upper panel
edges are set using a manual guider along with manual alignment possible by marking the
lower panel with a line showing where the edge of the upper panel needed to be
positioned. After this is completed, the operator presses a foot switch, the welder nozzle
is pushed into the nip area and, after a brief delay, the welding wheels turn to pull the
fabric through the welding area at the preset speed. During the welding process, the
operator manually adjusts the fabric into the guider to maintain seam width. When the
welding is complete, the operator releases the foot switch and the hot air nozzle swings
out of the weld area.
Overall, the welding cycle time for hot air welding is very reproducible depending
directly on the speed setting.
For hot air welding, all conditions provided reasonable weld adhesion. It was, on
average, lower than the weld adhesion that was obtained with the other welding methods.
Weld appearance was good. Weld quality, however, was variable, with a number of
seams splitting or separating at the compound interface over a portion of the weld width,
rather than separating at the base fabric.

Improved Polyurethane Storage Tank Performance FY2008 Final Report – Revision 3 Seaman Corporation
Page 46 of 84
5.5 Seam Failure Review
An extensive study of all 576 dead load samples tested was conducted to understand the
typical root cause of failures associated with the various methods of seam welding. The
dead load samples reviewed were all exposed to the high temperature fuel (HTF) under
increasing temperature and load conditions in the Dead Load Chamber. A failure
classification convention was created which defines the results observed across all of the
sample seams.
Seam failures were grouped in to 3 major classifications - 1) Seam Opened-Up, 2)
Designated, and 3) Other Failures. These classifications were formed based on the
common underlying root cause or the anticipated outcome of such a failure. The failure
convention is defined generally in the following few paragraphs with specific details and
photograph examples of each failure further on in this section. This is followed by a
detailed discussion of the summarized data.
As the name suggests, the Seam Opened-Up category contained observed failures where
separation between the two panels occurred. These included the Interply Separation
Failure (IUS), Pull to Base (PTB), Split Weld (SW), Tore Inside Weld (TIW) and Yarns
Bunched-Up (YBU) failure conditions. The Designated failure group was defined to
cover those samples which made it to the end of the exposure period, but might lead to
eventual catastrophic (e.g., seam rupture) or non-catastrophic (e.g., weeping, seeping or
blistering) failures. Scrim Exposure (SE) and End Tab Lifts (ETL) were identified as the
two Designated failure conditions. Other Failures included Tore Adjacent to Weld (TA),
Tore Outside of Weld (TOW) and Yarns Stripped-Out of Seam (YSOS). TOW was
included because it was an observed test outcome however it is not certain as to whether
it is a condition that would occur in a collapsible fuel tank (CFT) or rather an artifact of
the test method.
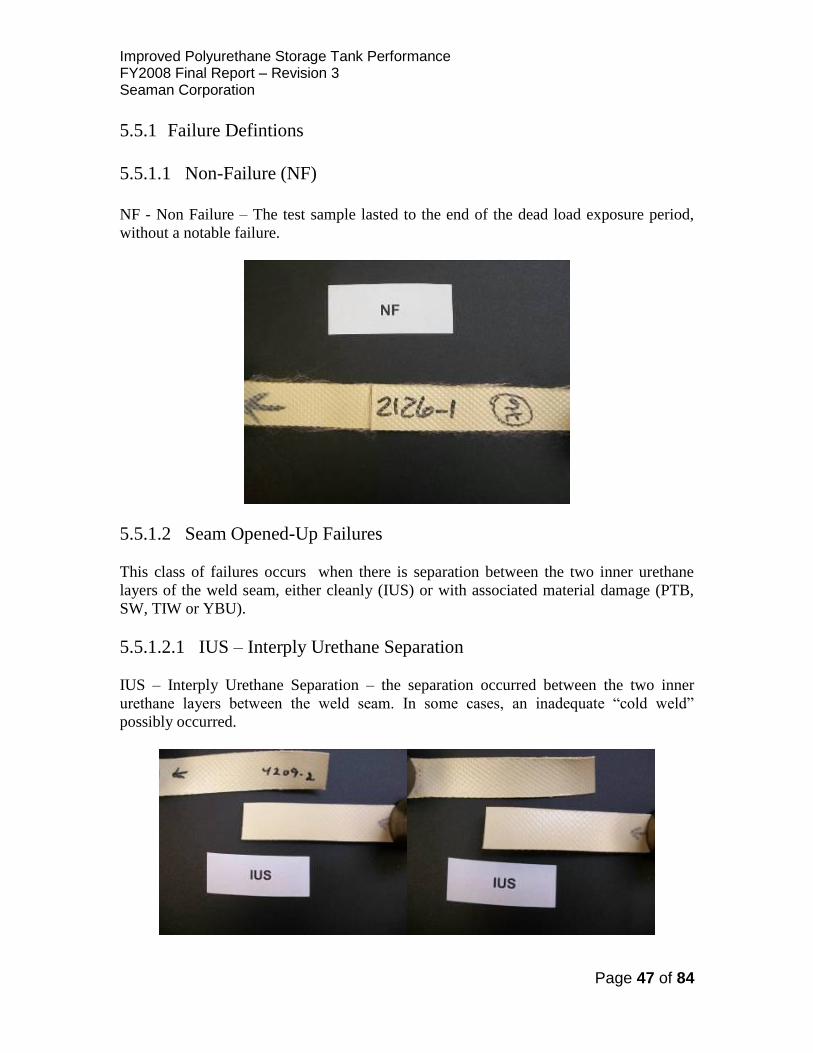
Improved Polyurethane Storage Tank Performance FY2008 Final Report – Revision 3 Seaman Corporation
Page 47 of 84
5.5.1 Failure Defintions
5.5.1.1 Non-Failure (NF)
NF - Non Failure – The test sample lasted to the end of the dead load exposure period,
without a notable failure.
5.5.1.2 Seam Opened-Up Failures
This class of failures occurs when there is separation between the two inner urethane
layers of the weld seam, either cleanly (IUS) or with associated material damage (PTB,
SW, TIW or YBU).
5.5.1.2.1 IUS – Interply Urethane Separation
IUS – Interply Urethane Separation – the separation occurred between the two inner
urethane layers between the weld seam. In some cases, an inadequate “cold weld”
possibly occurred.

Improved Polyurethane Storage Tank Performance FY2008 Final Report – Revision 3 Seaman Corporation
Page 48 of 84
5.5.1.2.2 PTB – Pull to Base
PTB – Pull to Base – The urethane from one side of the weld was pulled away from the
base fabric on the adjoining material.
5.5.1.2.3 SW – Split Weld
SW – Split Weld – a PTB occurs on both sides of the weld, with urethane weld
“splitting” and being removed and adhering on both sides, in different areas.
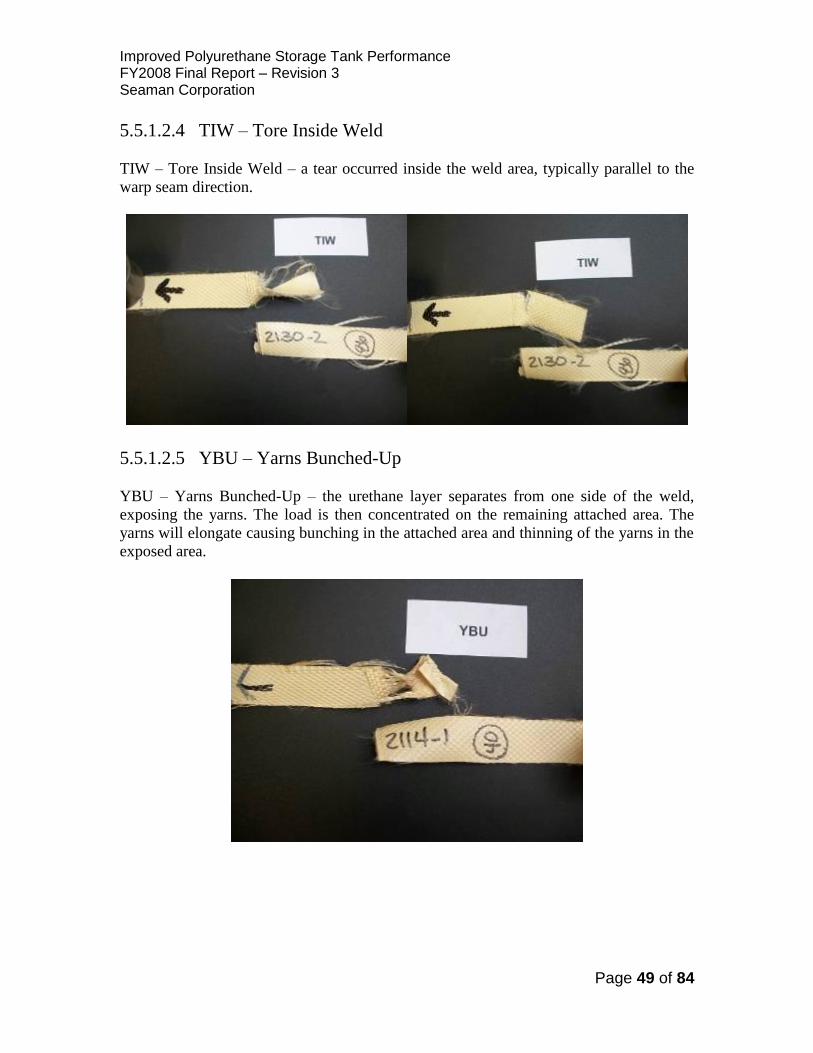
Improved Polyurethane Storage Tank Performance FY2008 Final Report – Revision 3 Seaman Corporation
Page 49 of 84
5.5.1.2.4 TIW – Tore Inside Weld
TIW – Tore Inside Weld – a tear occurred inside the weld area, typically parallel to the
warp seam direction.
5.5.1.2.5 YBU – Yarns Bunched-Up
YBU – Yarns Bunched-Up – the urethane layer separates from one side of the weld,
exposing the yarns. The load is then concentrated on the remaining attached area. The
yarns will elongate causing bunching in the attached area and thinning of the yarns in the
exposed area.
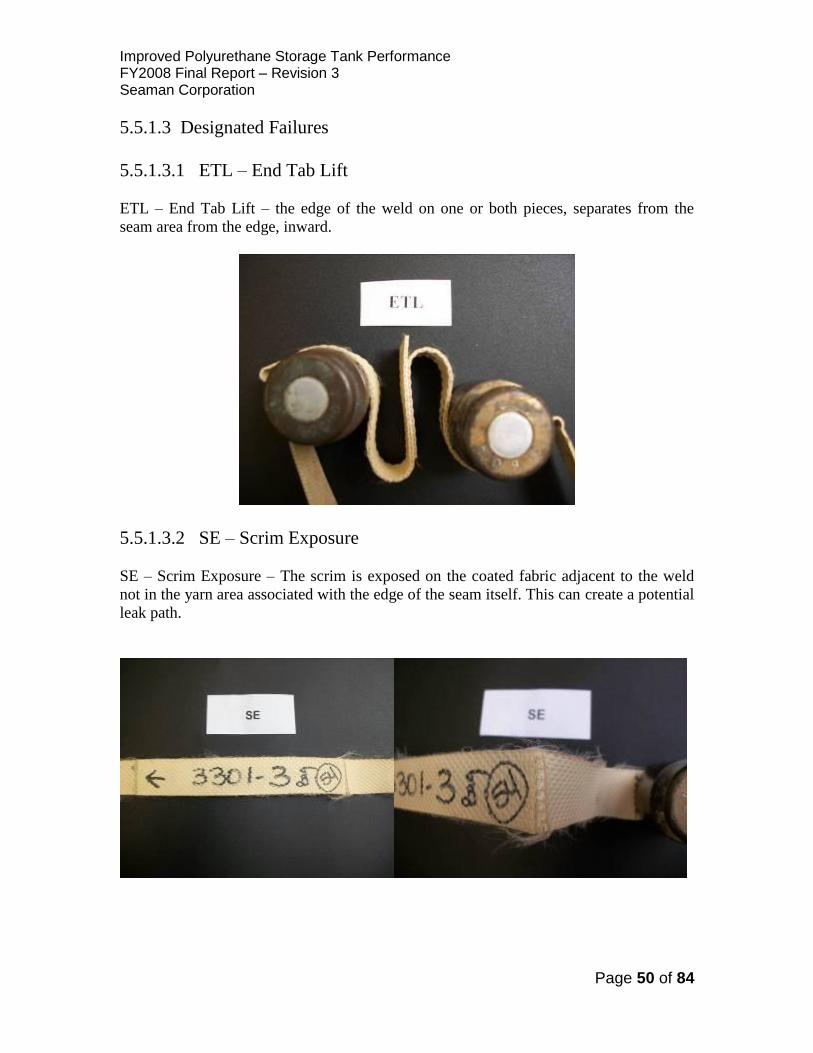
Improved Polyurethane Storage Tank Performance FY2008 Final Report – Revision 3 Seaman Corporation
Page 50 of 84
5.5.1.3 Designated Failures
5.5.1.3.1 ETL – End Tab Lift
ETL – End Tab Lift – the edge of the weld on one or both pieces, separates from the
seam area from the edge, inward.
5.5.1.3.2 SE – Scrim Exposure
SE – Scrim Exposure – The scrim is exposed on the coated fabric adjacent to the weld
not in the yarn area associated with the edge of the seam itself. This can create a potential
leak path.

Improved Polyurethane Storage Tank Performance FY2008 Final Report – Revision 3 Seaman Corporation
Page 51 of 84
5.5.1.4 Other Failures
5.5.1.4.1 TA – Tore Adjacent to Weld
TA – Tore Adjecent to Weld – the material on one piece tears parallel to the edge of the
welded seam. A complete TA is shown below.
5.5.1.4.2 TOW – Tore Outside Weld
TOW – Tore Outside Weld – the material on one piece tears, either partially or
completely away from the weld area. It is directly related to testing and preparation.
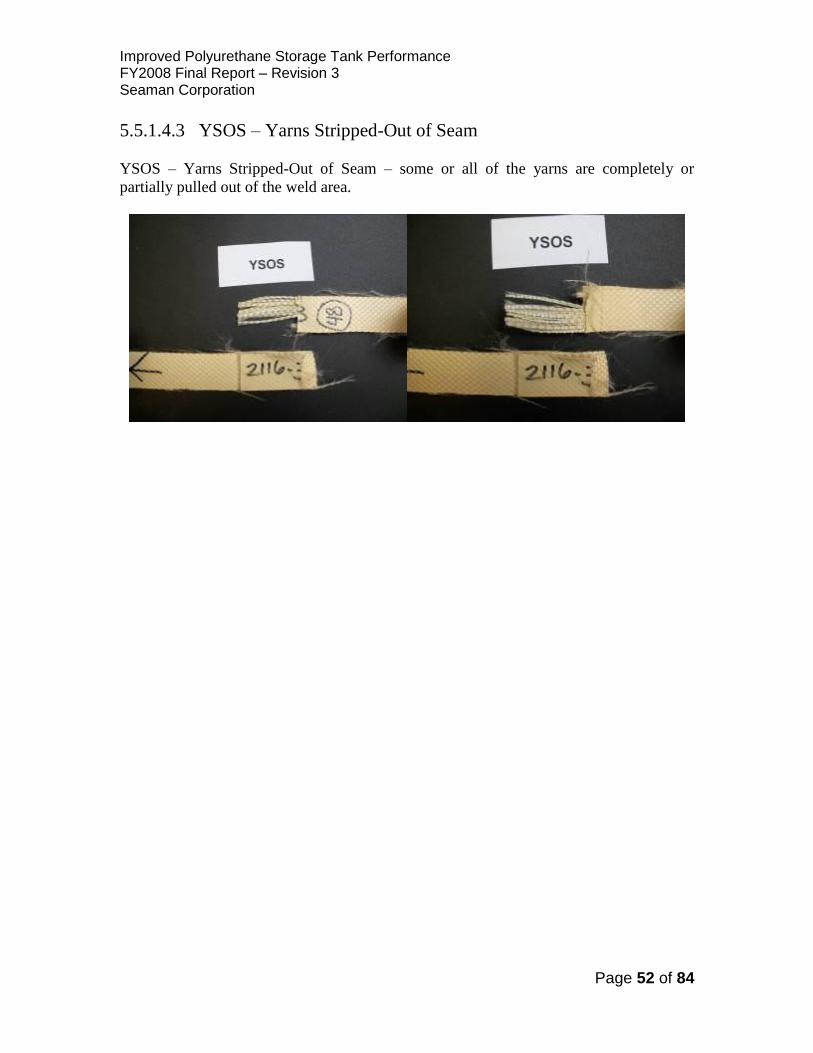
Improved Polyurethane Storage Tank Performance FY2008 Final Report – Revision 3 Seaman Corporation
Page 52 of 84
5.5.1.4.3 YSOS – Yarns Stripped-Out of Seam
YSOS – Yarns Stripped-Out of Seam – some or all of the yarns are completely or
partially pulled out of the weld area.

Improved Polyurethane Storage Tank Performance FY2008 Final Report – Revision 3 Seaman Corporation
Page 53 of 84
5.5.2 Failure Data Summary Review
5.5.2.1 Failure Frequency
In analyzing the results, the three major failure classes were further qualified by their
frequency of occurrence. This is illustrated in the graph below. It was possible for more
than one failure mode to occur on a single sample. However the major failure mode was
determined for each sample and utilized in the evaluation. For example, for trial # 2105-
002, an RF welded sample, there was a significant Pull to Base (PTB) area (>90%), a tear
designated by a Tore Inside the Weld (TIW) and also Yarns Stripped-Out of the Seam
(YSOS). It was determined that the PTB was the predominant cause of the failure and
possibly contributed to the other failures occurring. The total number of samples
evaluated across the five welding methods tested was 576. The graph below illustrates
the percentage of the failures, by each failure class (e.g., Seam Opened-Up) and failure
type (e.g., PTB), out of the total number of samples tested (576).
It is evident from this graph that the Seam Opened-Up classification occurred most often
(~ 45% of the total samples). The theory as to why this was so frequent is discussed in
the next section. The seam opened up typically when separation occured between the two
inner urethane layers of the weld. In the case of the IUS this happened cleanly with no
visual damage to the urethane layers or yarns.

Improved Polyurethane Storage Tank Performance FY2008 Final Report – Revision 3 Seaman Corporation
Page 54 of 84
This is different from the other four types where material damage occurred. In the case of
the Pull to Base (PTB), the welded urethane layer was pulled away from the yarns on one
side of the weld. For a Split Weld (SW) it split and pulled to the base on each split or it
split and partially pulled to the base with partial inter-ply urethane separation.
Sometimes when the seam separated, a tear in the weld area (TIW) occurred or the Yarns
Bunch-Up (YBU) as the urethane covering those yarns was pulled away by the other side
of the weld (see above). Note in this graph, the YBU failure doe not occur as the primary
failure cause and therefore is not shown in the Seam Opened Up category. For all five
types, the failure in a CFT would be considered catastrophic.
The Designated Failure classification (~14% of the total samples) covers two cases that
typically completed exposure without failing the dead load test. These samples were
reduced from a complete pass (99 days) to a designated failure condition (62 days) to
reflect the potential that they could cause a leak, or eventually lead to a catastrophic
failure. This rating was assigned to show that they were not the same as samples that
survived the test with absolutely no issues. Since the dead load specimen did not
completely separate, it was impossible to recognize these failures until they were
removed from the dead load test chamber at the end of exposure.
The Other Failure classification (~12.5% of the total samples) covered the remaining
three failure types. Although there is no direct evidence as to the root cause of these
failures, it is believed that potential damage to the yarns during the welding process was a
contributing factor. The three failure types, TA, TOW and YSOS, occurred more often in
welding methods where Seam Opened Up failures are not as predominant.
5.5.2.3 Seam Opened-Up Failures
The Seam Opened-Up failures occurred more often than the other two failure
classifications. It is believed that the underlying cause for this failure could be
inconsistent welding or adhesion in the weld area. The impact of this partial weld can be
seen in the Seam Opening Contribution to Failures graph below.

Improved Polyurethane Storage Tank Performance FY2008 Final Report – Revision 3 Seaman Corporation
Page 55 of 84
This graph focuses on failures which occur when no material damage is present. In the
case of an IUS, the two pieces separate with no visible damage to the urethane coating on
either side. For an ETL, the end tab has started to lift away from the weld area, again with
no visual damage to the urethane on either piece. In the dead load test, the sample is cut
from two panels that have been welded together. The sample is typically 1 inch in width,
with the weld surface area covering 2 inches of panel overlap. Therefore, for a quality
weld there should be urethane inter-ply adherence over the entire 2 inch square area.
When a load is applied to this sample, the stress seen in the weld is inversely proportional
to the surface area, for a fixed load:
σ = F/A
where:
σ = stress
F = force or applied load
A = area of weld
If the area welded is less than that recommended or required, due to inadequate weld
conditions or process control, the stress in the remaining weld area will increase
accordingly. For example, if the actual surface area welded is approximately ½ the
recommended area or 1 sq inch, the stress for a fixed load will double. If this area is
approximately ⅛, the stress will be 8 times for the same fixed load.
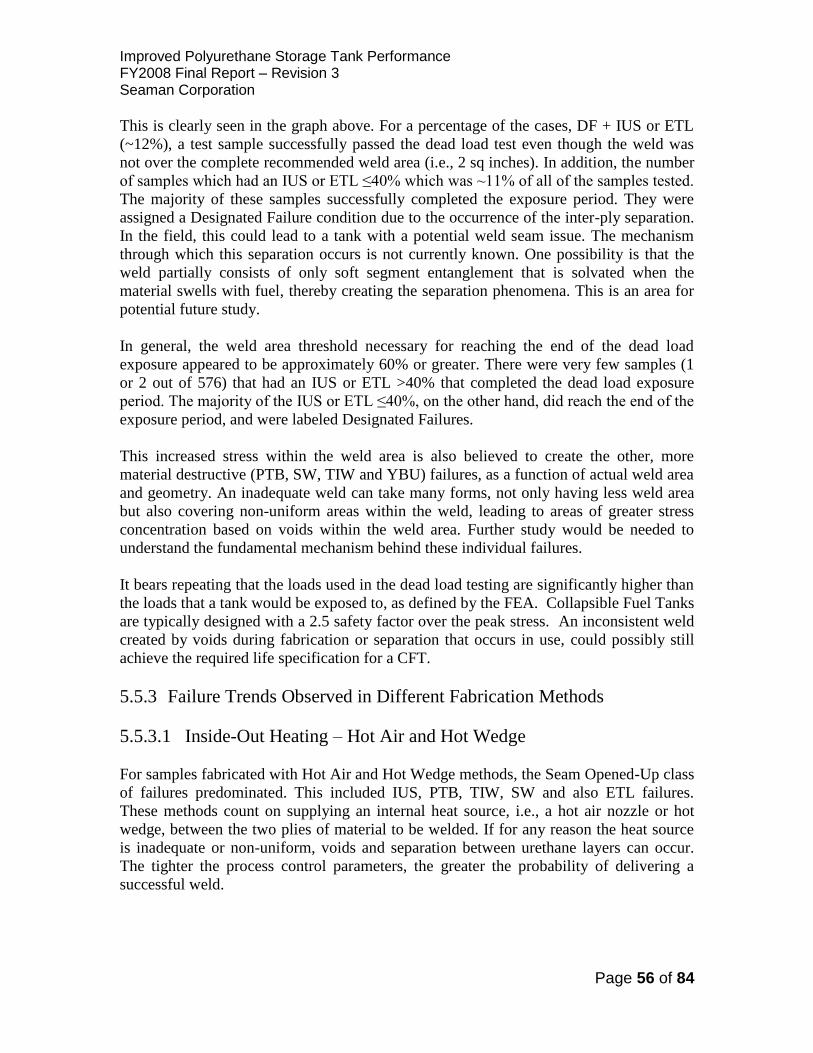
Improved Polyurethane Storage Tank Performance FY2008 Final Report – Revision 3 Seaman Corporation
Page 56 of 84
This is clearly seen in the graph above. For a percentage of the cases, DF + IUS or ETL
(~12%), a test sample successfully passed the dead load test even though the weld was
not over the complete recommended weld area (i.e., 2 sq inches). In addition, the number
of samples which had an IUS or ETL ≤40% which was ~11% of all of the samples tested.
The majority of these samples successfully completed the exposure period. They were
assigned a Designated Failure condition due to the occurrence of the inter-ply separation.
In the field, this could lead to a tank with a potential weld seam issue. The mechanism
through which this separation occurs is not currently known. One possibility is that the
weld partially consists of only soft segment entanglement that is solvated when the
material swells with fuel, thereby creating the separation phenomena. This is an area for
potential future study.
In general, the weld area threshold necessary for reaching the end of the dead load
exposure appeared to be approximately 60% or greater. There were very few samples (1
or 2 out of 576) that had an IUS or ETL >40% that completed the dead load exposure
period. The majority of the IUS or ETL ≤40%, on the other hand, did reach the end of the
exposure period, and were labeled Designated Failures.
This increased stress within the weld area is also believed to create the other, more
material destructive (PTB, SW, TIW and YBU) failures, as a function of actual weld area
and geometry. An inadequate weld can take many forms, not only having less weld area
but also covering non-uniform areas within the weld, leading to areas of greater stress
concentration based on voids within the weld area. Further study would be needed to
understand the fundamental mechanism behind these individual failures.
It bears repeating that the loads used in the dead load testing are significantly higher than
the loads that a tank would be exposed to, as defined by the FEA. Collapsible Fuel Tanks
are typically designed with a 2.5 safety factor over the peak stress. An inconsistent weld
created by voids during fabrication or separation that occurs in use, could possibly still
achieve the required life specification for a CFT.
5.5.3 Failure Trends Observed in Different Fabrication Methods
5.5.3.1 Inside-Out Heating – Hot Air and Hot Wedge
For samples fabricated with Hot Air and Hot Wedge methods, the Seam Opened-Up class
of failures predominated. This included IUS, PTB, TIW, SW and also ETL failures.
These methods count on supplying an internal heat source, i.e., a hot air nozzle or hot
wedge, between the two plies of material to be welded. If for any reason the heat source
is inadequate or non-uniform, voids and separation between urethane layers can occur.
The tighter the process control parameters, the greater the probability of delivering a
successful weld.

Improved Polyurethane Storage Tank Performance FY2008 Final Report – Revision 3 Seaman Corporation
Page 57 of 84
5.5.3.2 Outside-In Heating – Impulse and RF, Hot Bar
These methods rely on energy transfer from an external source to the internal urethane to
urethane interface to create a weld. For Impulse and RF, Seam Opened-Up failures were
noticeably minimal when compared to the Hot Air and Hot Wedge methods. The more
frequent failures with this method were TA, TOW, SE and YSOS, failures which
occurred around the periphery or outside of the weld area. This might suggest, in some
instances that the weld area might actually be more prone to over-heating, leading to
localized urethane thinning, increased urethane weld flow and possible yarn damage.
5.5.4 Failure Predictability
A plot of the % Non-Failed Dead Load Samples as a function of number of days of
exposure is shown below. It illustrates, with a couple of exceptions, that the majority of
the samples that passed at 4 days typically made it to 29 days. Samples that survived 29
days, referencing the test protocol used in this study, would have met the 3 year service
requirement (i.e., Load = 2.5x maximum in-plane stress for a full 50,000 gallon CFT at a
service temperature of 158o F). The exceptions mentioned included a Hot Air and a Hot
Wedge run where the fabrication process was not yet optimized. The RF samples had
some initial failures attributed to over welding of the sample. Once the process control
parameters were optimized, the Hot Air and Hot Wedge runs became quite repeatable, as
is evident in the data.

Improved Polyurethane Storage Tank Performance FY2008 Final Report – Revision 3 Seaman Corporation
Page 58 of 84
5.6 Summary
The following is a summary of the results of the seam method experiments:
1) For the discrete welding methods, notably for impulse and hot bar welding,
operating at bond-line temperatures of 340° F provides seams with excellent
dead-load durability. This corresponds to the melting transition for amorphous
phase of the coating compound. This was demonstrated in both the hot bar and
the impulse welding experiments. It was not possible to obtain bond-line
temperature readings for the RF sealing work. However, for the RF welding
work, the seam durability varied with the power applied (AC mode), which
should relate to the temperature that the compound reaches.
At lower bond-line temperatures, the seams show more weld lift, cold weld
separations and split weld failures.
At long dwell times at 340° F or at higher bond-line temperatures, seams show
more failures that are related to damage of the fabric or coating compound (tears,
weld strips, and scrim exposures on static loading).
2) For the continuous welding method studied, rotary hot air welding, measurement
of the bond-line temperatures to determine if the same correlation applied was not
possible. In general, lowering the speed of the welding, at any temperature
reviewed in this study, provided the best dead-load durability. It is expected that
lowering the speed, increases the fabric surface temperature.
3) For the design spaces analyzed for this study, the discrete welding methods
provided durable welds over good portions of the design space investigated giving
broad ranges of acceptable processing conditions. For hot air welding, the peak
dead-load durability of welds was less than those achieved by the discrete
methods. Hot air welding provided the maximum dead-load durability over
narrow ranges of each design space investigated and showed considerable
interdependence of process variables. For example, a change in a hot air
temperature or nozzle location required readjustment of the welding speed to
obtain reasonable weld results. The samples initially fabricated for Seaman
Corporation (HAW 1 and 2), based on welding parameters from tank fabricators,
had far too broad a range. Tests of samples provided directly by fabricators
(HAW 3 and 4), using hot air welding were obtained and tested. These samples
do not provide a range of process variables, but are representative of current
process settings and control. The results of these tests are presented in Sections
5.5 and 5.6.
Improved Polyurethane Storage Tank Performance FY2008 Final Report – Revision 3 Seaman Corporation
Page 59 of 84
4) The discrete processes, hot bar, RF and impulse welding, showed less operator
dependence and required less adjustment on set up to obtain acceptable welds
than did the hot air welding. For hot air welding, nozzle position, and nozzle
alignment had a significant influence on whether the weld pulled clean to the base
fabric on initial testing or whether it split or pulled cold on one edge or another.
All of the methods are capable of producing welds that will meet the service life
requirements of the contract. None of the welding methods investigated have
limits that preclude their use. There is no reason why discrete welders with tools
that are shorter than the entire seam can't be used to make the required length
seam by overlapping. Other seam methods may be required for other areas of the
tank design (e.g., closing seams, might not lend themselves to the same type of
seaming methods that are used for the main panel seams because of limited
access, fabric bulk, etc.), irrespective of the method used for the bulk of the tank.
5) The analysis of the sample failures, exposed to HTF under increasing temperature
and load, clearly illustrated the critical importance of tight process control and
quality assurance in the fabrication of the CFTs. Incomplete and excessive
welding conditions were contributing factors to welds which proved to be
inadequate. Incomplete welding predominated in Inside-Out processes, such as
Hot Air and Hot Wedge, as was witnessed by the large number of Seam Opened-
up type failures. Excessive welding occurred with greater frequency with Outside-
In processes such as Impluse and RF, with failures occuring more often in the
yarns or around the periphery of the weld.
The three main classes of failures observed were 1) Seam Opened-Up, 2)
Designated , and 3) Other Failures. ETL, although a Designated failure, should
also be considered a type of IUS, most probably in its initial stage. Urethane
separation based failures all typically occurred within the weld area. The only
exception appeared to be Scrim Exposure (SE), which typically occurred adjacent
to the weld area. The failures which occurred typically outside of the weld area,
e.g, the Other Catatrophic class, appeared to be a yarn, testing discrepancy or
combination yarn and urethane. This was exhibited by the tendency for these
failures to be tears (TA or TOW) or breakage of yarn (YSOS), usually initiating
near the edge of a welded seam. It is critical that seam shear be run due to TA
and YSOS because of excessive heating causes damage to the weld area.
The fact that some of the samples, where IUS or ETL was present up to 40%,
without failure, is of some concern. Therefore, it is considered critical that both
seam peel adhesion be run on samples to verify appropriate process control.

Improved Polyurethane Storage Tank Performance FY2008 Final Report – Revision 3 Seaman Corporation
Page 60 of 84
In all cases, the CFT fabricator should consider all of the contributing factors that
would effect fabrication (e.g., cost, quality, reproducibility, equipment, available
space, staff training) before deciding on which method best meets their
operational needs and the military’s requirments. Based on the data summarized
here, all of the methods require process control procedures to insure seam
performance. The critical factor appears to be the ability to maintain tight process
control and the to fine tune all of the factors associated with optimizing the
process.
6) A summary table of the welding methods and the associated failure modes
recorded during this testing is shown below. When reviewing the information in
this table it is important to remember the following critical points:
a) For some methods (e.g., RF), the equipment utilized was new and there
were not recommeded settings available for the material. A lot of time was
spent in “dialing in” the equipment to find the best operational range and
settings. This could be further optimized if transferring to a production
environment.
b) For other methods (e.g., Hot Wedge), initial welding parameters were based on
the fabricators experience with similar materials. This lead to many early failures.
Once these parameters were optimized for the Seaman 1940 PTFF MS-337
polyurethane, the weld samples were much more robust.
c) The primary modes of failure were due to either polyurethne separation caused
by inadequate welding (e.g., IUS) or weld tearing and exposure of the yarns
created by excessive energy in the weld (e.g., TA).

Improved Polyurethane Storage Tank Performance FY2008 Final Report – Revision 3 Seaman Corporation
Page 61 of 84

Improved Polyurethane Storage Tank Performance FY2008 Final Report – Revision 3 Seaman Corporation
Page 62 of 84
6.0 Process Control
There are a number of items that are common to all welding processes that need to be
part of the process control plan. These items are:
1) The weld adhesion should reach a minimum value that has proven to give
acceptable results.
A review of the initial weld adhesion data, the HTF weld immersion and the HTF
dead-load results across all of the studies shows the following:
Initial weld adhesion and weld adhesion after HTF immersion have a linear
relationship.
Initial weld adhesion vs HTF weld adhesion
25.0
30.0
35.0
40.0
45.0
50.0
55.0
60.0
65.0
70.0
75.0
80.0
85.0
90.0
95.0
100.0
105.0
25.0 30.0 35.0 40.0 45.0 50.0 55.0 60.0 65.0 70.0 75.0 80.0 85.0 90.0
Initial weld adhesion, lbs/inch
HT
F w
eld
ad
hesio
n, lb
s/in
ch

Improved Polyurethane Storage Tank Performance FY2008 Final Report – Revision 3 Seaman Corporation
Page 63 of 84
The relationship between HTF weld adhesion and HTF dead-load performance is
shown below.
While not as clean as the relationship between HTF adhesion and initial adhesion,
the data shows a steep increase in dead-load performance with an increase in
seam adhesion as it goes from 30 to approximately 45 lbsf/in. Beyond the 45
lbsf/in. levels, the dead-load performance is relatively flat, except for a few points
where poor dead-load performance was seen with high seam adhesion. For these
points, the failure mode is generally tear rather than seam separation, indicating
the fabric had been damaged during the welding process.
As noted in previous discussions, a 29 day dead-load duration corresponds to a 3
year service life. A linear fit of the HTF adhesion data and the HTF dead-load
data between 30 and 50 lbsf/in. shows that a 29 day dead-load value can be
obtained at a HTF seam adhesion of 39 lbsf/in. However, a much safer seam
adhesion value would be at about 45 lbsf/in.
A 45 lbsf/in. HTF seam adhesion translates into a 55 lbsf/in. initial seam adhesion.
Based on these results, a 55 lbsf/in. initial seam adhesion should be considered as
the target.

Improved Polyurethane Storage Tank Performance FY2008 Final Report – Revision 3 Seaman Corporation
Page 64 of 84
2) The seam when pulled in shear should break in the base fabric at a force that is no
less than 90% of the base fabric strength as an indication that the base fabric has
not been damaged.
3) The seam, when pulled in peel, should separate at the base fabric. This should
have the lowest bond strength. If a seam does not pull to the base cloth across the
entire width of the seam area and along the entire length of the seam, it indicates
that the seam is not uniform and there is an issue with the set up of the equipment.
In this study, split seams, especially those that pulled to the compound interface,
showed to perform poorer than welds that pulled uniformly to the base cloth.
4) At a minimum, the process parameters used in the DOE studies should be
monitored and controlled to within ranges that provide acceptable dead-load
durability.
5) Cycle times for the various portions of the welding process should be monitored
for changes that would be indicative of a change in equipment performance. This
might translate into results that are different than were obtained in the studies.
6) Set up, start-up, operating and process control procedures should be developed for
each of the welding processes. Process control procedures need to detail the
control parameters, the tolerances for the parameters, the measurement system
that will be used, testing and sampling that will be performed, sampling
frequency, control methods, and reaction plans.
The process control plans that would be developed for a manufacturing operation will be
dependent on the equipment that the manufacturer is using. All impulse welders, hot bar
welders, hot air welders, and RF sealers are not the same. However, as a guide, typical
process control plans are provided on the following pages for the equipment and
configurations that we used for the study.

Improved Polyurethane Storage Tank Performance FY2008 Final Report – Revision 3 Seaman Corporation
Page 65 of 84
6.1 Process Control Plan
Characteristics Methods
Process Process step
Machine, device, tool Product Process
Product or Process spec/tolerance
Evaluation method
Sample size
Sample frequency
Control method Reaction Plan
Panel Panel Weld Impulse Dwell time, minutes 2 +2.25/ - 0 Machine display 1 1 x/ shift Control Sheet
Manual adjustment
Platen Temp F - Heat 394 Machine display 1 1 x/shift Control Sheet Manual adjustment
Platen Temp F - Cool 120 Machine display 1 1 x/shift Control Sheet Manual adjustment
2 MP Temp, F 398 +/- 3 Trial 1 1x/day X bar - R chart Adjust platen temp /retest
Pressure, psi 30 +15, -0 Machine display 1 1 x/shift Control Sheet Manual adjustment
Coolant Temp 120 F Machine display 1 2 x/shift Control Sheet Manual adjustment
Heat up time, minutes 1.0 +/- 0.5 minutes Machine log 1 2 x/shift X bar - R chart Adjust PID platen
Cooling time, minutes 3.0 - to 7.0 minutes Machine log 1 2 x/shift X bar - R chart Maintenance
Bondline temp, F 340 +0/- 5 Trial 1 weekly X bar - R chart Reset 2 MP target/retest
Weld Width 2" min Ruler 1 each panel X bar - R chart Check/correct markings
Weld Adhesion 55 lbs/inch min ASTM D751 test weld 2 x/ shift X bar - R chart Run Hold - notify QC
Weld consistency clean to base Visual test weld 2 x/ shift Visual to std
Run Hold. Check platen alignment, check tool , run test weld
Weld Aesthetics no defect Visual 1 each panel Visual to std
Check contact surfaces for damage, Maintenance

Improved Polyurethane Storage Tank Performance FY2008 Final Report – Revision 3 Seaman Corporation
Page 66 of 84
Characteristics Methods
Process Process step
Machine, device, tool Product Process
Product or Process spec/tolerance
Evaluation method
Sample size
Sample frequency
Control method Reaction Plan
Panel Panel Weld RF, 2 x 33 Seal time, seconds 6, +1/-0.5 Machine display 1 1 x/ shift Control Sheet
Manual adjustment
Pressure, bar 4.5 Machine display 1 1 x/shift Control Sheet Manual adjustment
Amps 1.63 to 1.95 Machine display 1 1 x/shift Control Sheet Manual adjustment
Preseal time, seconds 3 Machine display 1 1 x/shift Control Sheet
Manual adjustment
Cooling time, seconds 15 Trial 1 1 x/shift
X bar - R chart
Manual adjustment
Air Coolant temp, F 80 F Machine display 1 1 x/shift Control Sheet Manual adjustment
Overall cycle time, seconds 24 to 28 Machine log 1 1 x/shift
X bar - R chart Maintenance
Weld Width 2" min Ruler 1 each panel
X bar - R chart
Check/correct markings
Weld Adhesion 55 lbs/inch min ASTM D751 test weld 2 x/ shift
X bar - R chart
Run Hold - notify QC
Weld consistency clean to base Visual
test weld 2 x/ shift Visual to std
Run Hold. Check platen alignment, check tool , run test weld
Weld Aesthetics no defect Visual 1 each panel Visual to std
Check contact surfaces for damage, Maintenance

Improved Polyurethane Storage Tank Performance FY2008 Final Report – Revision 3 Seaman Corporation
Page 67 of 84
Characteristics Methods
Process Process step
Machine, device, tool Product Process
Product or Process spec/tolerance
Evaluation method
Sample size
Sample frequency
Control method Reaction Plan
Panel Panel Weld T 500 Speed, ft/min 4 to 4.5 Machine display 1 1 x/ shift
Control Sheet
Manual adjustment
2" 100A wheel Pressure, psi 80 Machine display 1 1 x/shift
Control Sheet
Manual adjustment
1 7/8" tip Air Temp, F 850 Machine display 1 1 x/shift
Control Sheet
Manual adjustment
2" Guider Nozzle position, inches 0.5 Machine display 1 1 x/shift
Control Sheet
Manual adjustment
Delay 3 Trial 1 1 x/shift Control Sheet
Manual adjustment
Weld Width 2" min Ruler 1 each panel
X bar - R chart
Check/correct markings
Weld Adhesion 55 lbs/inch min ASTM D751 test weld 2 x/ shift
X bar - R chart
Run Hold - notify QC
Weld consistency clean to base Visual
test weld 2 x/ shift Visual to std
Run Hold. Check tip position, check weld wheels for damage of buildup, run test weld
Weld Aesthetics no defect Visual 1 each panel Visual to std
Check weld wheels for damage, Maintenance

Improved Polyurethane Storage Tank Performance FY2008 Final Report – Revision 3 Seaman Corporation
Page 68 of 84
Characteristics Methods
Process Process step
Machine, device, tool Product Process
Product or Process spec/tolerance
Evaluation method
Sample size
Sample frequency
Control method Reaction Plan
Panel Panel Weld Hot bar Dwell time, minutes 1 Machine display 1 1 x/ shift
Control Sheet
Manual adjustment
Bar temp, F 350 Machine display
Platen fabric interface temp F – Heat 348 Machine display 1 1 x/shift
Control Sheet
Manual adjustment
Platen fabric interface temp F – Cool 340 Machine display 1 1 x/shift
Control Sheet
Manual adjustment
Pressure, psi 30 Machine display 1 1 x/shift Control Sheet
Manual adjustment
Coolant Air Temp NA Machine display 1 2 x/shift Control Sheet
Manual adjustment
Heat up time, minutes
17.5 +/- 2.5 minutes Machine log 1 2 x/shift
X bar - R chart
Adjust PID platen
Cooling time, minutes 0 Machine log 1 2 x/shift
X bar - R chart Maintenance
Bondline temp, F 340 +0/- 5 Trial 1 weekly X bar - R chart
Reset 2 MP target/retest
Weld Width 2" min Ruler 1 each panel
X bar - R chart
Check/correct markings
Weld Adhesion 55 lbs/inch min ASTM D751 test weld 2 x/ shift
X bar - R chart
Run Hold - notify QC
Weld consistency clean to base Visual
test weld 2 x/ shift Visual to std
Run Hold. Check pressure, check contact surfaces for damage, run test weld
Weld Aesthetics no defect Visual 1 each panel Visual to std
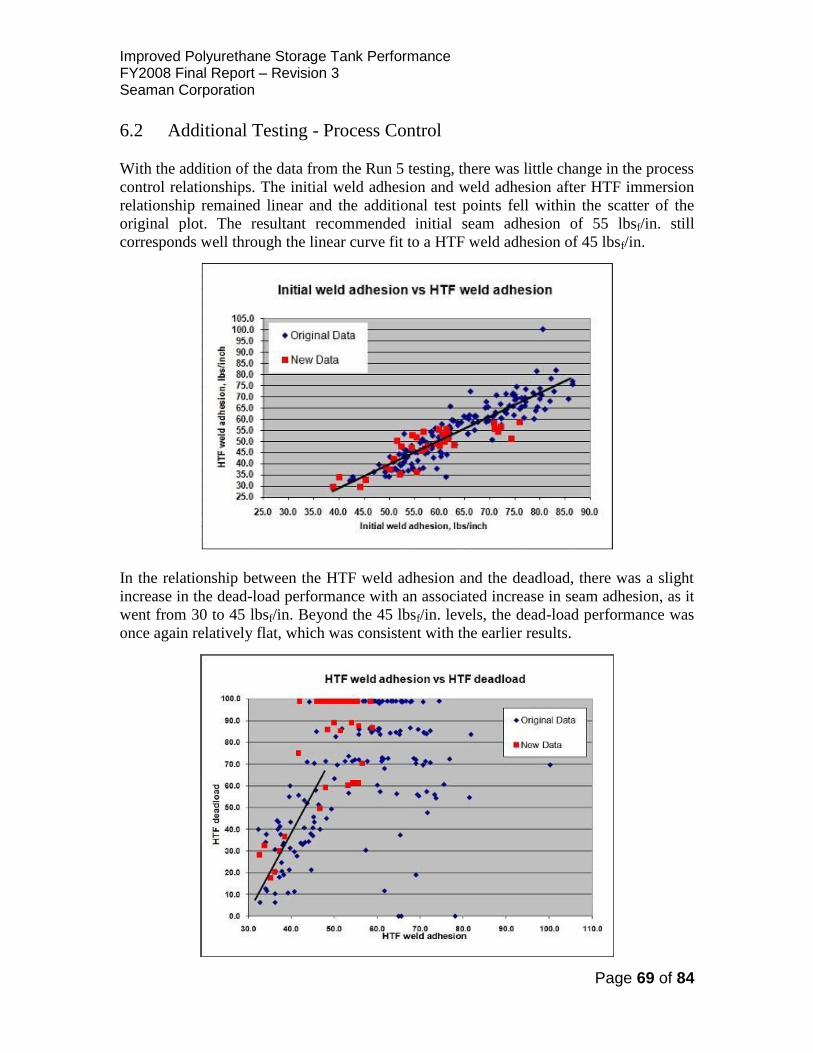
Improved Polyurethane Storage Tank Performance FY2008 Final Report – Revision 3 Seaman Corporation
Page 69 of 84
6.2 Additional Testing - Process Control
With the addition of the data from the Run 5 testing, there was little change in the process
control relationships. The initial weld adhesion and weld adhesion after HTF immersion
relationship remained linear and the additional test points fell within the scatter of the
original plot. The resultant recommended initial seam adhesion of 55 lbsf/in. still
corresponds well through the linear curve fit to a HTF weld adhesion of 45 lbsf/in.
In the relationship between the HTF weld adhesion and the deadload, there was a slight
increase in the dead-load performance with an associated increase in seam adhesion, as it
went from 30 to 45 lbsf/in. Beyond the 45 lbsf/in. levels, the dead-load performance was
once again relatively flat, which was consistent with the earlier results.

Improved Polyurethane Storage Tank Performance FY2008 Final Report – Revision 3 Seaman Corporation
Page 70 of 84
7.0 Quality Control
7.1 Raw Materials
The coated fabric to be used for the tank must have been certified by the fabric
manufacturer to meet the fabric requirements of the fuel tank specification and any
fabricator specific quality requirements.
Prior to using the fabric to produce a fuel tank, the coated fabric should be pre-qualified
by the fabricator. The material should not be stored outside. It is recommended that the
material be stored inside, out of direct sunlight, at ambient temperatures (70ºF), at a
humidity below 65%. High humidity and UV exposure may affect the weldability of the
material, especially if the environmental conditions exceed the recommended limits
(verify material suitability through standard such as ASTM D638). To qualify the
material, take a sample from the lot of material to be fabricated and prepare welds on the
tank welding equipment. The weld conditions should duplicate the conditions that will be
used in fabricating the tank. In the event the welding equipment, personnel,
environmental conditions, equipment operation, etc. changes, requalification must be
performed.
Wiping of the seam area with a cleaning solvent to remove any contaminants, such as oil,
dirt, and grease just prior to the welding process is recommended. This ensures that there
are no contaminants present to inhibit the molecular bonding of the coating compound.
One must allow adequate time for the solvent to flash off the seam area prior to
manufacture to avoid having the solvent cause issues during the welding process. The
solvent(s) used should only be those recommended by the material supplier. In addition,
the material supplier should also provide the appropriate procedures and conditions for
use of the solvents (e.g., contact time, environmental condition restrictions, required
drying time, etc).
7.2 General Testing
Historically, fuel tank seam have been evaluated by weld adhesion and some form of
dead-load testing. The tests to evaluate the seam performance for this report, and for
production set-up and operation, were based on the requirements as outlined in MIL-
PRF-32233. Adhesion of coating to fabric, known as peel adhesion, was added to the test
parameters to determine if there is a correlation to the weld adhesion. The use of ASTM
International Standard ASTM D751 Standard Test Methods for Coated Fabrics was
deemed appropriate for use in determining the strength of the seam and peel adhesion.
The adhesion was performed along the length of the seam. The peel adhesion was pulled
in the warp direction. Fuel immersions on the seams were performed to ASTM D471
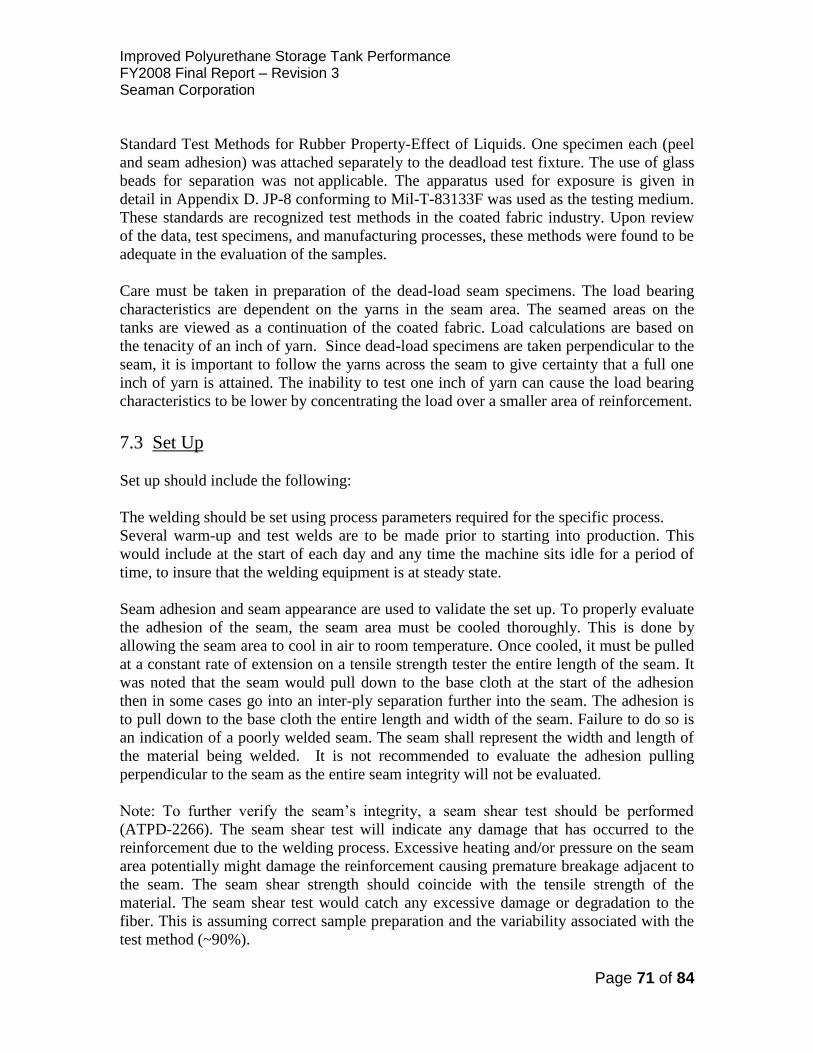
Improved Polyurethane Storage Tank Performance FY2008 Final Report – Revision 3 Seaman Corporation
Page 71 of 84
Standard Test Methods for Rubber Property-Effect of Liquids. One specimen each (peel
and seam adhesion) was attached separately to the deadload test fixture. The use of glass
beads for separation was not applicable. The apparatus used for exposure is given in
detail in Appendix D. JP-8 conforming to Mil-T-83133F was used as the testing medium.
These standards are recognized test methods in the coated fabric industry. Upon review
of the data, test specimens, and manufacturing processes, these methods were found to be
adequate in the evaluation of the samples.
Care must be taken in preparation of the dead-load seam specimens. The load bearing
characteristics are dependent on the yarns in the seam area. The seamed areas on the
tanks are viewed as a continuation of the coated fabric. Load calculations are based on
the tenacity of an inch of yarn. Since dead-load specimens are taken perpendicular to the
seam, it is important to follow the yarns across the seam to give certainty that a full one
inch of yarn is attained. The inability to test one inch of yarn can cause the load bearing
characteristics to be lower by concentrating the load over a smaller area of reinforcement.
7.3 Set Up
Set up should include the following:
The welding should be set using process parameters required for the specific process.
Several warm-up and test welds are to be made prior to starting into production. This
would include at the start of each day and any time the machine sits idle for a period of
time, to insure that the welding equipment is at steady state.
Seam adhesion and seam appearance are used to validate the set up. To properly evaluate
the adhesion of the seam, the seam area must be cooled thoroughly. This is done by
allowing the seam area to cool in air to room temperature. Once cooled, it must be pulled
at a constant rate of extension on a tensile strength tester the entire length of the seam. It
was noted that the seam would pull down to the base cloth at the start of the adhesion
then in some cases go into an inter-ply separation further into the seam. The adhesion is
to pull down to the base cloth the entire length and width of the seam. Failure to do so is
an indication of a poorly welded seam. The seam shall represent the width and length of
the material being welded. It is not recommended to evaluate the adhesion pulling
perpendicular to the seam as the entire seam integrity will not be evaluated.
Note: To further verify the seam’s integrity, a seam shear test should be performed
(ATPD-2266). The seam shear test will indicate any damage that has occurred to the
reinforcement due to the welding process. Excessive heating and/or pressure on the seam
area potentially might damage the reinforcement causing premature breakage adjacent to
the seam. The seam shear strength should coincide with the tensile strength of the
material. The seam shear test would catch any excessive damage or degradation to the
fiber. This is assuming correct sample preparation and the variability associated with the
test method (~90%).

Improved Polyurethane Storage Tank Performance FY2008 Final Report – Revision 3 Seaman Corporation
Page 72 of 84
7.4 Manufacturing
The process control plan should be used to guide the manufacturing of the tanks
(previous section).
All data and documentation shall be maintained on the testing performed on the samples.
Sample identification, date, time, operator, equipment identification, operating
parameters to name a few, should be documented with the test data. The results shall be
maintained to cover the length of exposure of the tank according to contractual and/or
specification language. This will enable the manufacturer to evaluate the results in the
event of a field failure.
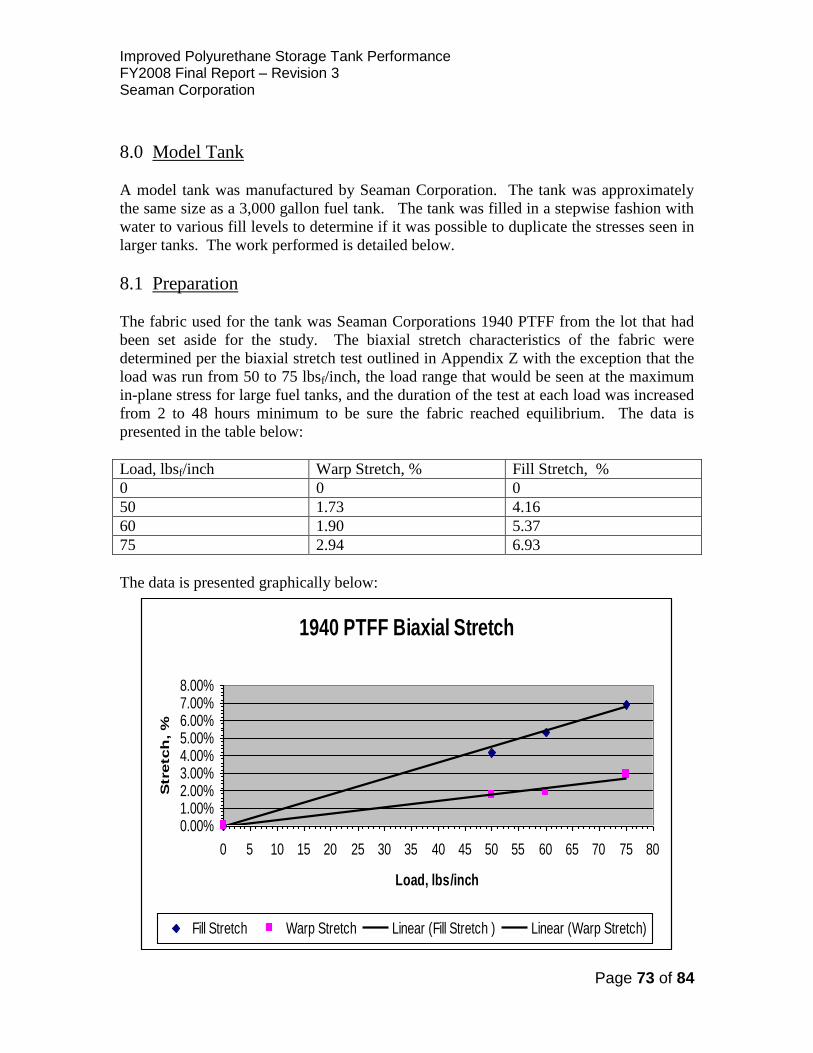
Improved Polyurethane Storage Tank Performance FY2008 Final Report – Revision 3 Seaman Corporation
Page 73 of 84
8.0 Model Tank
A model tank was manufactured by Seaman Corporation. The tank was approximately
the same size as a 3,000 gallon fuel tank. The tank was filled in a stepwise fashion with
water to various fill levels to determine if it was possible to duplicate the stresses seen in
larger tanks. The work performed is detailed below.
8.1 Preparation
The fabric used for the tank was Seaman Corporations 1940 PTFF from the lot that had
been set aside for the study. The biaxial stretch characteristics of the fabric were
determined per the biaxial stretch test outlined in Appendix Z with the exception that the
load was run from 50 to 75 lbsf/inch, the load range that would be seen at the maximum
in-plane stress for large fuel tanks, and the duration of the test at each load was increased
from 2 to 48 hours minimum to be sure the fabric reached equilibrium. The data is
presented in the table below:
Load, lbsf/inch Warp Stretch, % Fill Stretch, %
0 0 0
50 1.73 4.16
60 1.90 5.37
75 2.94 6.93
The data is presented graphically below:
1940 PTFF Biaxial Stretch
0.00%1.00%2.00%3.00%4.00%5.00%6.00%7.00%8.00%
0 5 10 15 20 25 30 35 40 45 50 55 60 65 70 75 80
Load, lbs/inch
Stretch
, %
Fill Stretch Warp Stretch Linear (Fill Stretch ) Linear (Warp Stretch)
Improved Polyurethane Storage Tank Performance FY2008 Final Report – Revision 3 Seaman Corporation
Page 74 of 84
8.2 Tank Manufacturing
The tank was designed to use half widths of the standard 68 in. fabric in order to have a
tank with more seams than would normally be seen in a 3000 gallon tank. The panels
used for the tank were cut and marked on a Computer Aided Design driven cutting table.
In addition to markings for seam overlap and fitting locations, the panels were marked
with grids that could be used to measure the stretch once the tank was filled. Twenty 10
in. x 10 in. squares, in various locations on the tank, were selected for stretch
measurement and one 3 in. x 6 in. rectangle. Additional stretch measurements were taken
at all of the squares along one side of the tank (A to D).
The tank was manufactured in the following manner:
1) Eleven tank panels were cut and marked. The panels were welded together using
a 2 in. overlap seam on the Fiab RF welder. The panels were shingled. Other
methods can be used for model tank fabrication. RF was readily available to
Seaman Corporation for this scale model tank. There are current commercial fuel
tank manufacturers that are producing large scale fuel tanks that are using RF
welding for multiple seams on each tank. The RF is being used to produce both
overlap and butt seams.
2) The edges of the seams were capped with a 1 in. wide, 30 mil urethane tape on all
exposed edges using a hot air welder with tape dispenser.
3) The ends of the panel were welded together to make a large tube.
4) Overlap seams were made to close the tube on both ends into a pillow. The end
seams were not cap stripped with tape.
5) Diagonal seams were run across each corner by welding the inside surfaces of the
tank together. The corner seams were mechanically clamped.
6) The fittings were attached.
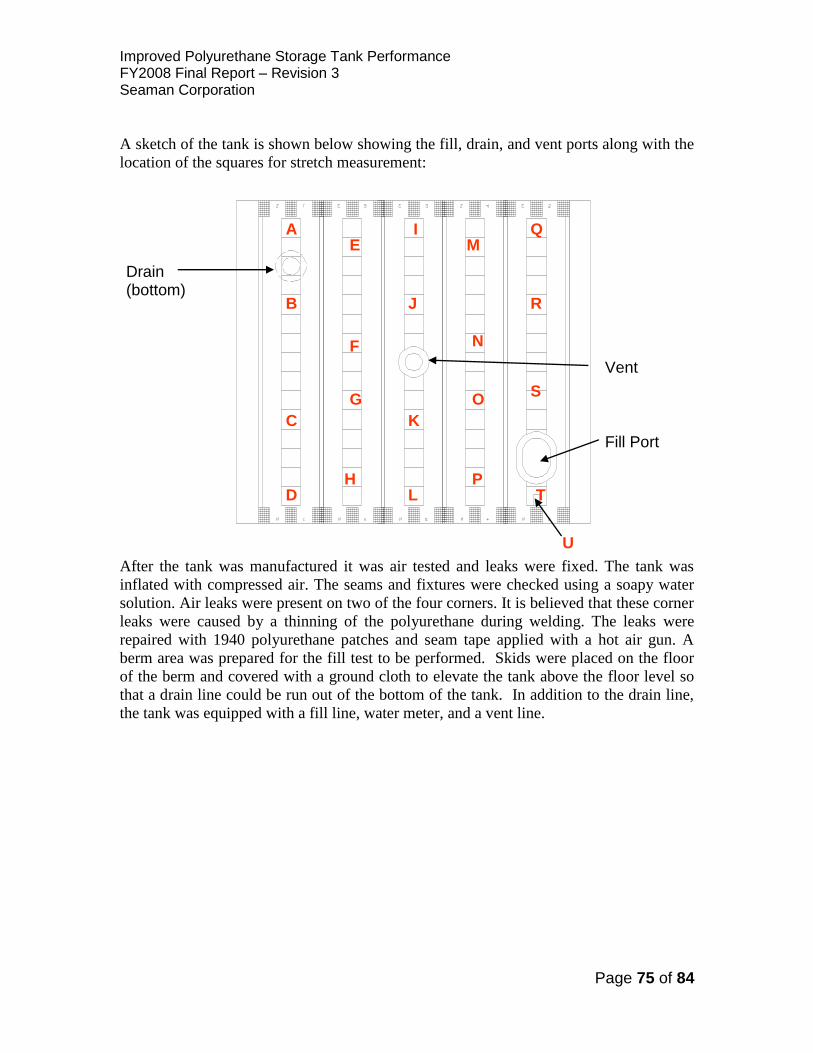
Improved Polyurethane Storage Tank Performance FY2008 Final Report – Revision 3 Seaman Corporation
Page 75 of 84
A sketch of the tank is shown below showing the fill, drain, and vent ports along with the
location of the squares for stretch measurement:
After the tank was manufactured it was air tested and leaks were fixed. The tank was
inflated with compressed air. The seams and fixtures were checked using a soapy water
solution. Air leaks were present on two of the four corners. It is believed that these corner
leaks were caused by a thinning of the polyurethane during welding. The leaks were
repaired with 1940 polyurethane patches and seam tape applied with a hot air gun. A
berm area was prepared for the fill test to be performed. Skids were placed on the floor
of the berm and covered with a ground cloth to elevate the tank above the floor level so
that a drain line could be run out of the bottom of the tank. In addition to the drain line,
the tank was equipped with a fill line, water meter, and a vent line.
T
S
R
Q M
N
O
P L
K
J
I
H
G
F
E
D
C
B
A
Fill Port
Vent
Drain (bottom)
U

Improved Polyurethane Storage Tank Performance FY2008 Final Report – Revision 3 Seaman Corporation
Page 76 of 84
A photograph of this is shown below:
The tank was initially filled with water to 2500 gallons. Water was chosen instead of JP-8
since the intention of this test was to check the effect of over-filling the tank. The tank
was inspected for leaks and silicone was applied on the filler-discharge bulk head
assembly at three bolt-hole locations. The tank was then filled with water at 300 gallon
increments, stopping after each fill to, 1) check for leaks, 2) allow the tank to equilibrate
to the surrounding environment for two days, and, 3) measure stretch in the panels. At
3000 gallons, additional leaks were noted at the filler-discharge bolts. They were re-
tightened and Loctite Superflex Red High Temp RTV (59630) was applied and
successfully sealed the leaks. A minor end closing seam leak (weep) was also detected
and repaired with a polyurethane adhesive, “Gorilla Glue”. For each 300 gallon fill,
stretch measurements were taken at all 21 locations and the height of the tank was
measured. The incremental fills continued until the volume of water added reached 4500
gallons. All of the data generated on the model tank is presented in Appendix Z1 and
Appendix Z2.
8.3 Tank 1 Analysis
As mentioned previously, the tank was constructed using ½ width panels in order to have
more seams in the tank. The largest stretch readings always occurred near the top center
of the tank. This was expected based on the stress concentration diagrams provided in
the SwRI report on a 50,000 gallon fuel tank.

Improved Polyurethane Storage Tank Performance FY2008 Final Report – Revision 3 Seaman Corporation
Page 77 of 84
The table provides data on the tank height and peak stretch for the water fill level:
Volume, gallons Height, inches Peak warp stretch, % Peak fill stretch, %
2500 26.0 0.63 2.50
3000 32.5 0.63 3.75
3300 36.5 1.25 5.00
3600 41.5 1.25 6.25
3900 46.5 1.25 6.88
4200 52.0 2.50 8.75
4500 57.0 3.75 9.38
The data is presented graphically below, along with a polynomial fit:
Stretch vs Tank Height
0%
5%
10%
15%
25.0 30.0 35.0 40.0 45.0 50.0 55.0 60.0
Tank Height, inches
Stretch
, %
Warp Stretch Fill Stretch Poly. (Fill Stretch) Poly. (Warp Stretch)
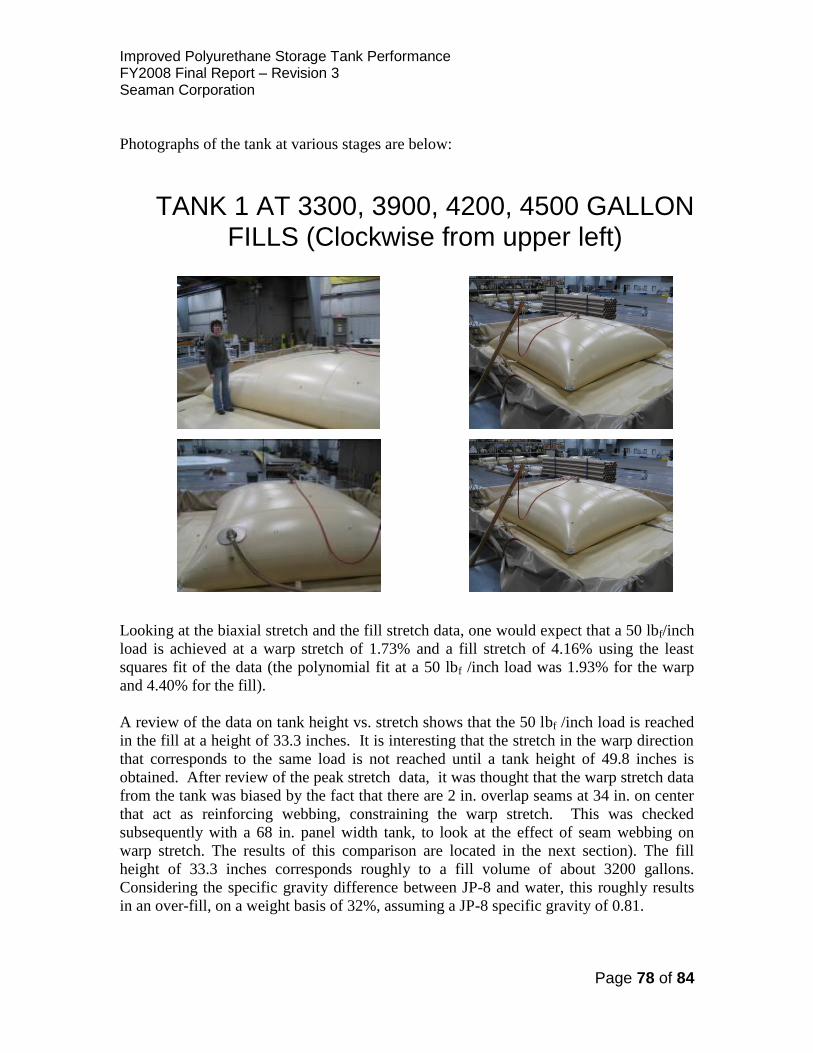
Improved Polyurethane Storage Tank Performance FY2008 Final Report – Revision 3 Seaman Corporation
Page 78 of 84
Photographs of the tank at various stages are below:
Looking at the biaxial stretch and the fill stretch data, one would expect that a 50 lbf/inch
load is achieved at a warp stretch of 1.73% and a fill stretch of 4.16% using the least
squares fit of the data (the polynomial fit at a 50 lbf /inch load was 1.93% for the warp
and 4.40% for the fill).
A review of the data on tank height vs. stretch shows that the 50 lbf /inch load is reached
in the fill at a height of 33.3 inches. It is interesting that the stretch in the warp direction
that corresponds to the same load is not reached until a tank height of 49.8 inches is
obtained. After review of the peak stretch data, it was thought that the warp stretch data
from the tank was biased by the fact that there are 2 in. overlap seams at 34 in. on center
that act as reinforcing webbing, constraining the warp stretch. This was checked
subsequently with a 68 in. panel width tank, to look at the effect of seam webbing on
warp stretch. The results of this comparison are located in the next section). The fill
height of 33.3 inches corresponds roughly to a fill volume of about 3200 gallons.
Considering the specific gravity difference between JP-8 and water, this roughly results
in an over-fill, on a weight basis of 32%, assuming a JP-8 specific gravity of 0.81.
TANK 1 AT 3300, 3900, 4200, 4500 GALLON FILLS (Clockwise from upper left)
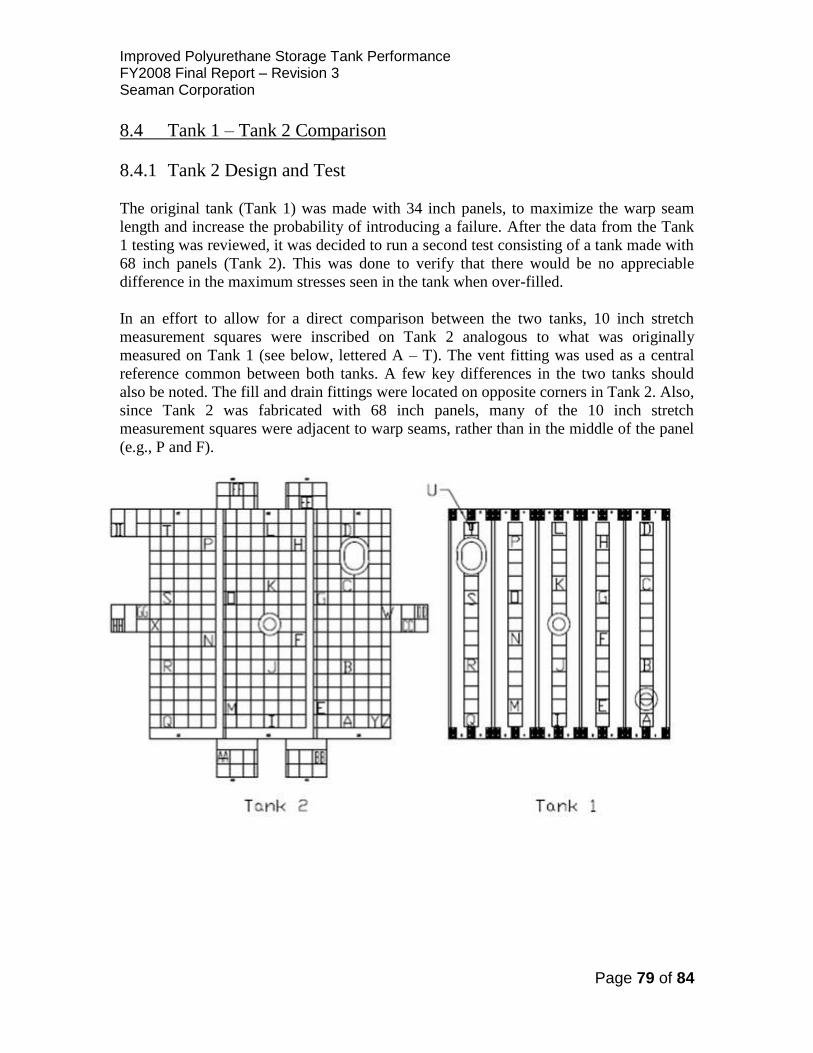
Improved Polyurethane Storage Tank Performance FY2008 Final Report – Revision 3 Seaman Corporation
Page 79 of 84
8.4 Tank 1 – Tank 2 Comparison
8.4.1 Tank 2 Design and Test
The original tank (Tank 1) was made with 34 inch panels, to maximize the warp seam
length and increase the probability of introducing a failure. After the data from the Tank
1 testing was reviewed, it was decided to run a second test consisting of a tank made with
68 inch panels (Tank 2). This was done to verify that there would be no appreciable
difference in the maximum stresses seen in the tank when over-filled.
In an effort to allow for a direct comparison between the two tanks, 10 inch stretch
measurement squares were inscribed on Tank 2 analogous to what was originally
measured on Tank 1 (see below, lettered A – T). The vent fitting was used as a central
reference common between both tanks. A few key differences in the two tanks should
also be noted. The fill and drain fittings were located on opposite corners in Tank 2. Also,
since Tank 2 was fabricated with 68 inch panels, many of the 10 inch stretch
measurement squares were adjacent to warp seams, rather than in the middle of the panel
(e.g., P and F).
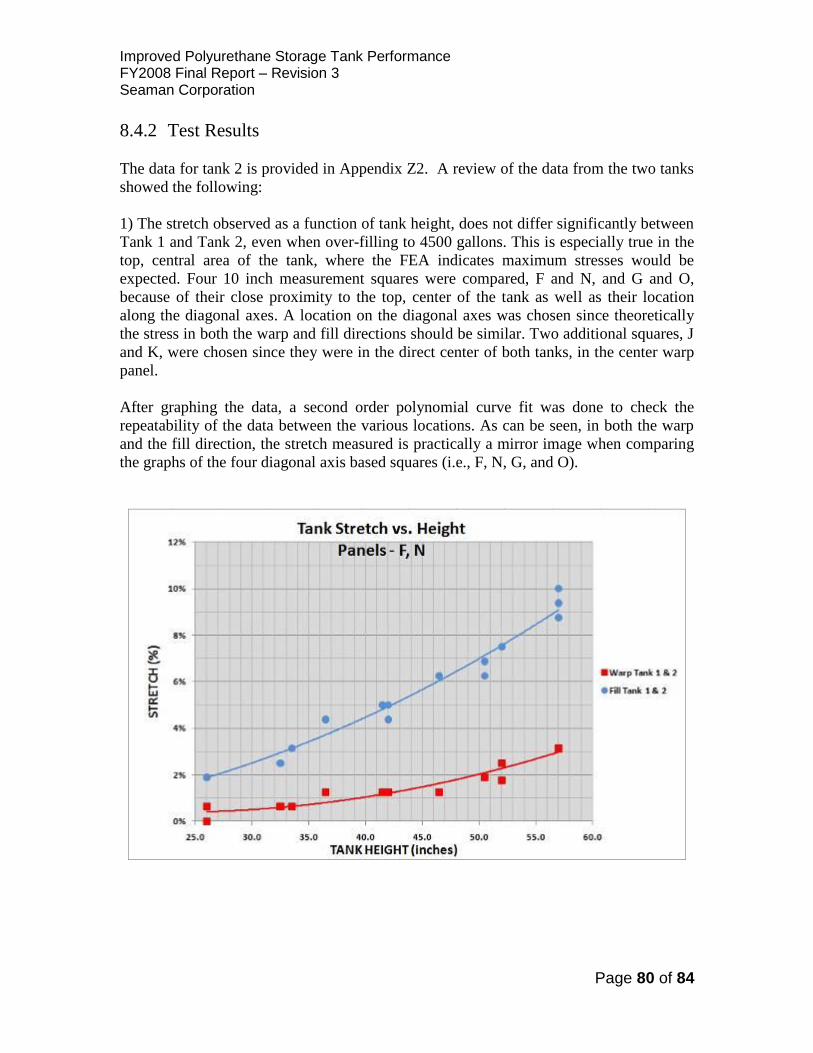
Improved Polyurethane Storage Tank Performance FY2008 Final Report – Revision 3 Seaman Corporation
Page 80 of 84
8.4.2 Test Results
The data for tank 2 is provided in Appendix Z2. A review of the data from the two tanks
showed the following:
1) The stretch observed as a function of tank height, does not differ significantly between
Tank 1 and Tank 2, even when over-filling to 4500 gallons. This is especially true in the
top, central area of the tank, where the FEA indicates maximum stresses would be
expected. Four 10 inch measurement squares were compared, F and N, and G and O,
because of their close proximity to the top, center of the tank as well as their location
along the diagonal axes. A location on the diagonal axes was chosen since theoretically
the stress in both the warp and fill directions should be similar. Two additional squares, J
and K, were chosen since they were in the direct center of both tanks, in the center warp
panel.
After graphing the data, a second order polynomial curve fit was done to check the
repeatability of the data between the various locations. As can be seen, in both the warp
and the fill direction, the stretch measured is practically a mirror image when comparing
the graphs of the four diagonal axis based squares (i.e., F, N, G, and O).

Improved Polyurethane Storage Tank Performance FY2008 Final Report – Revision 3 Seaman Corporation
Page 81 of 84
When compared to the central warp seam panel containing J and K to the diagonal
squares, a slight increase in the fill stretch was noted (i.e., within 0.5%) at both the top
and bottom of the curve. This is expected since the location of J and K is on the overall
central warp axis of the tank and therefore should be nearest the location of peak stretch.
Improved Polyurethane Storage Tank Performance FY2008 Final Report – Revision 3 Seaman Corporation
Page 82 of 84
When comparing the peak stress location between Tank 1 and Tank 2, the % fill stretch is
typically within 0.5%. There was minimal variance in warp stretch between the two
tanks.
2) The warp stretch does not appear to concentrate in any great degree along the top of
the tank. The warp stretch at the top of the tank in most cases is the same irrespective of
position. The only place where this is not the case is along the edges of the tank where
the fill stretch is very low and crimp interchange is playing a role in the stretch values.
The loads in the warp direction are carried by the warp yarn, not by a homogeneous shell
and contrary to the FEA model, appear to be distributed evenly in the warp direction.
The fill stretch does seem to concentrate. The fill yarn is not continuous in fill direction.
At each seam, there is a break in the yarn and an opportunity for stresses to build. This is
indeed what is seen in the data. The stretch in the fill varies by position in a way that is
consistent with the FEA.
3) The stress in the fill direction does appear to concentrate and represents the maximum
stresses that will be present in the tank. The stretch in the fill direction should be used as
the basis for comparison of loads.
8.5 Conclusion
The stresses that are seen in large tanks can be approximated by controlled overfilling of
smaller tanks. The comparison between Tank 1 and Tank 2 successfully demonstrated
that there was little difference in the measured stretch as a function of tank height. This is
further illustrated by the close correlation between fill volume and tank height for both
tanks. Hence, the previous conclusion that the stresses seen in large tanks can be
approximated by controlled overfilling of smaller tanks still appears to be valid.

Improved Polyurethane Storage Tank Performance FY2008 Final Report – Revision 3 Seaman Corporation
Page 83 of 84
9.0 Testing Program Summary
9.1 FEA Analysis
A review of the FEA analysis on the fuel tank confirmed loads that are seen on the
50,000 gallon fuel tanks and provided information to set-up the dead-load testing
program. Industry experts that have done work on both 50K and 210K tanks indicated
that the stresses seen in the 50K tank are consistent with those seen in the 210K tank.
The FEA on the two different seam types showed a reduction of stresses in the tank fabric
as it enters the seam area. There is a slight effect at the edge of the seams, causing a
small peel force; however, this force was extremely small when compared to the peel
adhesion strength of the material.
9.2 Welding Equipment Evaluation
Seams prepared by various welding methods were tested for survival time under static
load at elevated temperatures while immersed in fuel. A time-temperature-stress
superposition technique was used to establish a relationship between the number of days
a seam survived under test conditions vs. the expected actual service days at use
conditions. The testing showed that seams that lasted 29 days under test conditions
would last 3 years at actual service conditions.
It was demonstrated that any of the four different types of welding equipment could be
used to manufacture a successful seam, as defined as being able to withstand the high
temperature fuel dead-load test for the time corresponding to a three year service life. No
matter what the welding process was, the ability to get the urethane coated fabric to a
high enough temperature was the key to a successful weld. Production considerations
such as the speed of fabrication and the associated cost of each method are not included
in this report. Also, the results did not take into consideration the ability to make a fuel
tight seam with any of the welding systems; the focus was on seam integrity as defined
by HTF dead-loads.
One finding of note is that is that dead load samples exposed to high temperature fuel that
did not fail by 4 days, typically lasted until 29 days. This applies to those samples that
were fabricated with known, controlled process parameters. The current specification of
70 hours might not be an adequate predictor of success in the field (MIL-PRF-32233,
section 4.5.2.8). A limit of 96 hours with a constant dead load tension force equivalent to
a 2.5 safety factor in JP-8 at 160 °F should increase the probability of success in the field.
Improved Polyurethane Storage Tank Performance FY2008 Final Report – Revision 3 Seaman Corporation
Page 84 of 84
9.3 Model Tank
It was demonstrated that two model tanks could be constructed and over-filled with water
such that the material/seams were exposed to the peak stresses seen on a 50,000 gallon
tank. This allows us to further study the different welding techniques and tank designs
using a small scale model tank. Studying model tanks is the best way to determine the
ability of a welding method to minimize or eliminate seam leaks. This work will be
continued in the FY2009 Improved Polyurethane Fuel Tank study.


