
ARTICLE
Increased Power for Detectionof Parent-of-Origin Effectsvia the Use of Haplotype Estimation
Richard Howey,1 Chrysovalanto Mamasoula,1,2 Ana Topf,1 Ron Nudel,3 Judith A. Goodship,1
Bernard D. Keavney,1,4 and Heather J. Cordell1,*
Parent-of-origin (or imprinting) effects relate to the situation in which traits are influenced by the allele inherited from only one parent
and the allele from the other parent has little or no effect. Given SNP genotype data from case-parent trios, the parent of origin of each
allele in the offspring can often be deduced unambiguously; however, this is not true when all three individuals are heterozygous. Most
existing methods for investigating parent-of-origin effects operate on a SNP-by-SNP basis and either perform some sort of averaging over
the possible parental transmissions or else discard ambiguous trios. If the correct parent of origin at a SNP could be determined, this
would provide extra information and increase the power for detecting the effects of imprinting.We proposemaking use of the surround-
ing SNP information, via haplotype estimation, to improve estimation of parent of origin at a test SNP for case-parent trios, case-mother
duos, and case-father duos. This extra information is then used in a multinomial modeling approach for estimating parent-of-origin
effects at the test SNP. We show through computer simulations that our approach has increased power over previous approaches, partic-
ularly when the data consist only of duos. We apply our method to two real datasets and find a decrease in significance of p values in
genomic regions previously thought to possibly harbor imprinting effects, thus weakening the evidence that such effects actually exist in
these regions, although some regions retain evidence of significant effects.
Introduction
Parent-of-origin effects relate to the situation where traits
are influenced by the allele inherited from only one parent
(e.g., the mother), with the allele from the other parent
(e.g., the father) having little or no effect. More generally,
parent-of-origin effects can be defined as effects where
the alleles inherited from the different parents have
differing effects on some phenotype of interest. This phe-
nomenon is not the same as a direct effect of maternal
genotype. A maternal-genotype effect occurs when an
offspring’s phenotype is altered (perhaps in utero) by the
maternal genotype, regardless of the allele actually trans-
mitted to the child. One biological mechanism that can
lead to parent-of-origin effects is genomic imprinting,
the phenomenon whereby either the maternally or the
paternally inherited allele is expressed, while the other
allele is silenced. The mechanisms underlying imprinting
are not yet fully understood, but are believed to involve
epigenetic processes including histone acetylation and
DNA methylation.1
Parent-of-origin effects due to genomic imprinting
(or due to interactions with imprinted loci) have been
observed for multiple traits in outbred mice.2 In humans,
parent-of-origin effects have been observed at known im-
printed regions for a variety of phenotypes,3 including
chromosome 14q32 in type 1 diabetes,4 chromosome
7q32 in type 2 diabetes,5 and chromosome 11p15 in breast
1Institute of Genetic Medicine, Newcastle University, Newcastle upon Tyne, NE
upon Tyne, NE2 4AX, UK; 3Wellcome Trust Centre for Human Genetics, Unive
University of Manchester, Manchester, M13 9NT, UK
*Correspondence: [email protected]
http://dx.doi.org/10.1016/j.ajhg.2015.07.016. �2015 The Authors
This is an open access article under the CC BY license (http://creativecommon
The American
cancer.5 Parent-of-origin effects have also been observed
on chromosomes 5p13 and 14q12 in relation to specific
language impairment (SLI)6 and at the filaggrin gene
(FLG [MIM: 135940]) on chromosome 1q21 in relation
to childhood atopic dermatitis7 (although this FLG
effect was interpreted as being most likely due to a direct
effect of maternal genotype, rather than to differing
effects of the alleles inherited from the different parents).
Experimental studies investigating potential parent-of-
origin effects detected at COL2A1 (MIM: 120140) and
ABCA4 (MIM: 601691) in children with congenital toxo-
plaxmosis8 showed isoform-specific epigenetic modifica-
tions consistent with imprinting in both COL2A1 and
ABCA4.
A variety of statistical methods have been used for the
detection and estimation of parent-of-origin effects in
humans. We focus here on methods designed for binary
(disease) traits, rather than on methods that have been
developed for the analysis of quantitative traits.9–12 A
review of the most popular currently used approaches is
given by Connolly and Heron.13 One intuitive approach,
available in the software package PLINK,14 is to use
an adaptation of the transmission disequilibrium test
(TDT),15 whereby transmissions and non-transmissions
of an allele of interest to an affected offspring are stratified
according to parental origin. However, such TDT-like
approaches generally have the disadvantage of discarding
observations in which both parents and offspring are
1 3BZ, UK; 2Institute of Health and Society, Newcastle University, Newcastle
rsity of Oxford, Oxford, OX3 7BN, UK; 4Institute of Cardiovascular Sciences,
s.org/licenses/by/4.0/).
Journal of Human Genetics 97, 419–434, September 3, 2015 419

heterozygous (given that parental origin cannot be as-
signed in this case), of erroneously assuming the transmis-
sions from two heterozygous parents are independent
(which is not true in the presence of child-genotype ef-
fects16), and of being sensitive to (i.e., invalid in the pres-
ence of) maternal-genotype effects. In an Icelandic study,
Kong et al.5 used a case-control version of this TDT-like
approach and overcame these limitations by performing
long-range phasing of SNP data to infer haplotypes and
comparing the resulting haplotypes with those present in
the closest relatives on the paternal and maternal sides
(considered as ‘‘surrogate parents’’) in order to infer parent
of origin; they also excluded the possibility of maternal-ge-
notype effects by evaluating the effects of the non-trans-
mitted maternal alleles.
Provided one is willing to assume an absence of
maternal-genotype effects, valid parent-of-origin tests
include the transmission asymmetry test (TAT),17 the
(generally more powerful)13 parental asymmetry test
(PAT),16 and the parent-of-origin-effects test statistic
(POET).18 If one is not willing to make this somewhat
restrictive assumption, likelihood ratio tests based on
more complex log-linear,17 logistic,16 conditional logis-
tic,19 or multinomial20 models are generally considered
preferable.13 (Such approaches can also be implemented
under the assumption of no maternal-genotype effects,
to increase power, if desired.) A variety of software imple-
mentations for fitting these more complex models exists;
Connolly and Heron13 recommend the use of our own
software suite, PREMIM and EMIM,20,21 over other alterna-
tives, on account of its ease of use for genome-wide data
and generally high power for detection of parent-of-origin
effects (even in the presence of other effects, such as those
due to child or maternal genotype) while maintaining
appropriate type I error rates. An additional attraction of
PREMIM and EMIM is their ability to deal with data from
either case-mother or case-father duos or case-parent trios,
along with additional child and parent genotype data
(such as that from individual case and control subjects or
parents of case and control subjects) included when avail-
able. This allows the incorporation of families in which
one (or more) individuals within a trio are missing, making
maximum use of all available information.
Most existing methods for investigating parent-of-origin
effects operate on a SNP-by-SNP basis, and each SNP is
analyzed individually. When an ambiguous configuration
with respect to parental origin is encountered at a
SNP (such as observations in which both parents and
an offspring are heterozygous), then either some sort of
‘‘averaging’’ over the possible parental transmissions is
performed or else these ambiguous observations are dis-
carded. In theory, greater information regarding parental
origin could be obtained by considering several nearby
SNPs simultaneously, as was done in the long-range
phasing approach employed in the Icelandic study.5
Extensions to the PAT that take into account haplotypes
of multiple tightly linked SNPs22,23 have demonstrated
420 The American Journal of Human Genetics 97, 419–434, Septemb
that increased power can indeed be obtained through
this strategy, but these extensions suffer from the same
problem as the original PAT of being sensitive to the pres-
ence of maternal-genotype effects. Gjessing and Lie24 pre-
sent an extension to the log-linear modeling approach17
that models the effects of haplotypes defined by alleles at
several nearby SNPs. Their extension is implemented in
the software package HAPLIN. As pointed out by Shi
et al.,25 estimation of risks for all haplotypes, as done by
HAPLIN, becomes rapidly intractable with more than a
few SNPs, on account of the fact that the number of
possible haplotypes (and thus parameters to estimate)
grows exponentially with the number of SNPs. Shi
et al.25 propose their own haplotype-based extension to
the log-linear modeling approach that uses the HAPLORE
program26 to perform the initial haplotype estimation
(phasing) step. Shi et al. achieve higher computational ef-
ficiency than Gjessing and Lie by focusing on candidate
haplotypes that are nominated a priori based on prior
knowledge. Although computationally convenient, this
thus represents a somewhat restricted application. Modi-
fication of haplotype effects according to parental origin
has also been incorporated in the UNPHASED software.27
However, UNPHASED, like HAPLIN, is limited (for compu-
tational reasons) to haplotypes comprised of no more
than about five or six SNPs, meaning that a genome-
wide analysis would need to be performed through
repeated phasing across small sliding windows of haplo-
types, a procedure that is both operationally and computa-
tionally inconvenient.
The issue of haplotype estimation (phasing) is by now
quite well-studied in human genetics. Estimated haplo-
types are routinely used for a variety of downstream
analyses, including estimation of recombination rates,28
measurement of linkage disequilibrium,29 and genotype
imputation.30 This desire to construct (potentially long-
range) haplotypes, given unphased genotype data, has
resulted in the development of a variety of software pack-
ages that can efficiently perform haplotype estimation on
a chromosome-wide scale. Arguably one of the most
competitive among these is the package SHAPEIT2,31,32
which has been found to outperform most other methods
in terms of switch error rate and high computational effi-
ciency.32 Although designed primarily for the analysis of
unrelated individuals, SHAPEIT2 also has the advantage
of being able to handle case-parent trios and duos. (These
situations impose constraints on the configurations of
possible haplotypes that are consistent within a duo or
trio.) Given the availability of such a convenient software
implementation for haploype phasing (in the form of
SHAPEIT2), we sought to update our software suite,
PREMIM and EMIM, to make use of haplotypes estimated
with SHAPEIT2, in order to provide improved power for
detection of parent-of-origin effects. Here, we present an
overview and evaluation of our improved method, which
has been incorporated into our freely available software
package PREMIM and EMIM.21
er 3, 2015

Material and Methods
For an overview of the methodology implemented in PREMIM
and EMIM, see our previous work.20,21 Here, we shall describe
only the essential components relevant to the currentmanuscript.
EMIM uses genotype counts from pedigree data to estimate rela-
tive-risk parameters through the use of multinomial modeling.
The accompanying program PREMIM pre-processes the pedigree
data to supply EMIM with the required genotype count informa-
tion. Parameters estimable by EMIM include child genotype
effects R1 and R2 (the relative risks conferred by the presence of
one or two copies of the risk allele in the child), maternal-geno-
type effects S1 and S2 (the relative risks conferred by the presence
of one or two copies of the risk allele in the mother), and maternal
and paternal parent-of-origin (or, imprinting) parameters Im and
Ip, respectively, which correspond to the factor by which a child’s
disease risk is multiplied if they inherit a risk allele from their
mother or father. EMIM calculates a log likelihood at each SNP
of interest, on the basis of the chosen parameters and assump-
tions, such as Hardy-Weinberg equilibrium or conditioning on
parental genotypes.21
Here, we aim to increase the power to detect parent-of-origin
effects by improving the information regarding the parental origin
of a child’s alleles. First, we consider case-parent trios and then
case-mother duos. By symmetry, all results for maternally in-
herited imprinting effects can be applied to paternally inherited
imprinting effects, and, similarly, results for case-mother duos
can be applied to case-father duos.
For case-parent trios, 15 possible genotype combinations
(gm,gf,gc) can occur in a mother, father, and child at any given
SNP (see Table 2 of Ainsworth et al.20). EMIM fits a multinomial
model to the observed counts in these 15 categories. The only
configuration in which it is not possible to determine the parental
origin is when all three individuals are heterozygous. That is, if we
denote the minor allele by ‘‘2’’ and the major allele by ‘‘1,’’ then if
both parents and the child have genotype ‘‘1/2,’’ it is not known
whether the ‘‘2’’ allele came from the father or the mother.
(Throughout this paper we use ‘‘2’’ to denote the minor allele,
which is also considered, for convenience, to be the risk allele,
although in practice either allele can be modeled as the risk allele).
In previous versions of EMIM (% 2.07), the multinomial likeli-
hood contribution from such a trio was
P�gm ¼ 12; gf ¼ 12; gc ¼ 12 or 21 jdis ¼ 1
�¼ m4R1S1
�Ip þ Im
�g11
where dis ¼ 1 denotes the event that the child is diseased, gcdenotes the ordered (maternal and paternal) alleles in the child,
m4 denotes a nuisance (mating-type stratification) parameter,
and g11 denotes an optional mother-child genotype-interaction
parameter that can be estimated if desired. This likelihood contri-
bution comes from combining into a single cell (cell 9) the contri-
butions from cells 9a and 9b of Table 2 of Ainsworth et al.,20
in which cell 9a corresponds to the (unobservable) situation that
the ‘‘2’’ allele in the child came from the father and 9b to the
(unobservable) situation that the ‘‘2’’ allele in the child came
from the mother.
In our updated version of EMIM, we use the software package
SHAPEIT231,32 to estimate haplotypes in the trio and then use
this information to infer the parental origin of the ‘‘2’’ allele in
the child. We thus consider cells 9a and 9b separately, resulting
in a likelihood contribution of m4R1S1Ipg11 if a trio is deemed to
fall into category 9a or m4R1S1Img11 if a trio is deemed to fall into
The American
category 9b. (Trios where there is still some ambiguity regarding
parental origin could, in theory, contribute fractional counts to
both cells; however, as noted later, we did not find any advantage
in allowing for this as compared to just using the most likely
parent-of-origin assignment).
Separation of cell 9 into two cells, 9a and 9b, leads to a situation
in which the multinomial likelihood uses counts from 16 (rather
than the originally considered 15) cells. However, we might
want to analyze datasets in which only a proportion of the case-
parent trios have been phased. This could occur, for example, if
some of the case-parent trios have been genotyped only at a candi-
date SNP (so there are no surrounding SNPs to provide phase infor-
mation), whereas other trios have been more densely genotyped.
Thus, we actually need to consider the counts from 17 cells,
with cells 9, 9a, and 9b all considered as separate categories.
In Appendix A, we derive themultinomial likelihood that includes
data for cells 9, 9a, and 9b in terms of the genotype relative-risk
parameters of interest.
A similar approach can be used for case-mother or case-father
duos. Table 3 of Ainsworth et al.20 shows the seven observable
genotype combinations in case-mother duos (a similar table can
be constructed for case-father duos). Here, cell 4 is the only con-
figuration in which parental origin is not observed. Cell 4 can
be divided into two cells: cell 4a, where the risk allele, ‘‘2,’’ is
inherited from the father, and cell 4b, where it is inherited from
the mother. In previous versions of EMIM (% 2.07), the multino-
mial likelihood contribution from cell 4 was R1S1g11(Im(m4 þ m5) þIp(m2 þ m4)), whereas now this is separated out into two con-
tributions, R1S1g11(Ip(m2 þ m4)) for counts in cell 4a and
R1S1g11(Im(m4 þ m5)) for counts in cell 4b. To allow for datasets in
which only a proportion of the case-mother duos have been
phased, we fit a likelihood to the counts from nine cells, with cells
4, 4a, and 4b all considered as separate categories (see Appendix A).
A similar process can be carried out with the table for case-father
duos. The overall likelihood of the data corresponds to the product
of the likelihoods for the tables for different observed family units
(including case-parent trios, case-mother duos, case-father duos,
and various other case- and control-based tables, see Howey and
Cordell21 for details).
WorkflowThe following steps are carried out when using PREMIM and
EMIM in conjunction with SHAPEIT2 to analyze data from multi-
ple nearby SNPs (including, but not limited to, genome-wide asso-
ciation study [GWAS] data). Note that steps 1–7 are carried out
through a single command line call to PREMIM, which automati-
cally invokes SHAPEIT2 as required.
1. PREMIM: Case-parent trios and duos are chosen from pedi-
grees. PREMIM processes the pedigree data and summarizes
for each SNP the possible genotype combinations in case-
parent trios and duos. The previous version of PREMIM pro-
cessed pedigrees on a SNP-by-SNP basis so that the chosen
case-parent trio (from a larger pedigree) for one SNP might
be different from that for another SNP. For haplotype
estimation, it is necessary that the same case-parent trio is
chosen for every pedigree and SNP, so PREMIM chooses
the case-parent trio with the least missing SNP data, but
only if the amount of missing data is above a user-specified
threshold (default, 50%). Following selection of case-parent
trios, case-mother duos are next selected by PREMIM in the
same manner except with the extra constraint that only
Journal of Human Genetics 97, 419–434, September 3, 2015 421
422
pedigrees that have not had a case-parent trio selected are
considered. The case-father duos are then selected with
the constraint that only pedigrees that have not had a
case-parent trio or case-mother duo selected are considered.
2. PREMIM: Binary pedigree files are created for case-parent
trios and duos. The case-parent trios and duos selected for
haplotype estimation are collected together into one
PLINK14-format binary pedigree (.bed) file with associated
family (.fam) and map (.bim) files.
3. SHAPEIT2: Haplotype graph is calculated. PREMIM invokes
SHAPEIT2 to calculate the haplotype graphwith data created
in step 2. Several different options are available in SHAPEIT2
to try to improve the accuracy of the phasing at the cost of
increasing the processing time. In our experience, we found
that the default (slower) settings were best for duos, and thus
these are used by default, but for trios these couldbe changed
in order to speed up the processing time. It is also possible
to use an external reference panel with SHAPEIT2, and to
use a known recombinationmap, whichmight be beneficial
for some datasets. However, in our experience, case-parent
trios and duos generally provide sufficient information for
excellent resolution of parental origin even without making
use of a reference panel or a known recombination map.
SHAPEIT2 also imputesmissing data andhandlesMendelian
errors by setting genotypes to missing.
4. SHAPEIT2: Haplotypes are estimated. PREMIM then evokes
SHAPEIT2 to return the most probable haplotype estimates
from the haplotype graph calculated in step 3. It was found
(data not shown) that allowing for phase uncertainty
through sampling possible haplotypes from the haplotype
graph did not improve performance in terms of power or
type I error, although in theory this could be done (with
the results averaged to generate non-integer cell counts for
cells 9a and 9b or for cells 4a and 4b) if desired.
5. PREMIM: Phased case-parent trio and duo data processed.
PREMIM estimates the parent of origin of alleles for ambig-
uous scenarios by using the phased haplotypes from
SHAPEIT2. The total counts for trios and duos that are
phased and not phased are also recorded for each SNP and
are used to calculate the likelihood. The resolution of ambig-
uous trios and duos is recorded as cell counts 9a and 9b for
case-parent trios and cell counts 4a and 4b for duos.
6. PREMIM: Phased duo data are adjusted. The estimated
counts in cell 4a and 4b for duos have been found to some-
times lead to an inflated test statistic in EMIM. Therefore,
these counts are adjusted to reduce the inflation to an
acceptable level, see Appendix B for details.
7. PREMIM: Remaining pedigrees are processed. Any pedigrees
without a case-parent trio or duo selected for phasing are pro-
cessed by PREMIM in the usualmanner on a SNP-by-SNP ba-
sis, possibly creatingother pedigree subunits, such as parents
of a case subject, lone case subjects, and control subjects.
Each pedigree subunit has a file created with the genotype
counts for each SNP. Any case-parent trio or duo data pro-
cessed without phasing is combined with the phased data
to create EMIM input files with counts in all three relevant
categories (9, 9a, and 9b for trios or 4, 4a, and 4b for duos).
8. EMIM: Case-parent trio and duo data are analyzed together
with other pedigree data. The genotype count files created
by PREMIM are analyzed by EMIM (with a slightly up-
dated-format parameter file that specifies the parameters
to estimate and the model assumptions).
The American Journal of Human Genetics 97, 419–434, Septemb
Adjustment of Genotype Counts for DuosInitial investigations indicated that for ambiguous duos (in which
the parent and child are both heterozygous), when the number of
minor alleles inherited from the father and mother were esti-
mated with SHAPEIT2, the estimates could be biased, depending
on the minor allele frequency and which parent (mother or
father) was genotyped, leading to inflated test statistics in
EMIM. To correct this bias, we devised an adjustment procedure
that relies on the fact that we will have tested many SNPs, most
of which will not display parent-of-origin effects. (Our adjust-
ment is thus suitable for GWAS data or data from a set of SNPs
that are not expected to show parent-of-origin effects; it would
not be suitable for analyzing a small number of candidate
SNPs.) See Appendix B and Figure S1 for details and an example
of the proposed adjustment procedure. Our adjustment procedure
involves fitting curves to the estimated counts that correspond to
adjusted versions of the curves expected under the null hypothe-
sis. The fitted curves include an adjustment function, f(p), where
p is the minor allele frequency. The cell counts for minor alleles
inherited from the father (cell 4a) and mother (cell 4b) are then
adjusted by respectively subtracting and adding f(p). (This can
result in non-integer values for the adjusted counts, which is
not a problem given that the multinomial likelihood maximized
by EMIM does not specifically require the counts to be integers,
see Appendix A.) This procedure ensures that, for the adjusted
counts, there should, on average, be far less bias toward transmis-
sions being estimated as coming from one particular parent.
A particular SNP that displays clear evidence of transmission
from one parent rather than from another, as expected if genuine
parent-of-origin effects exist, will, however, be only marginally
affected by this adjustment, given that the vast majority of
SNPs are assumed to be non-causal. It will be shown later (see
Results) that this reduces inflation of the test statistic and slightly
increases the power.
Simulations for Investigating Power and Type I ErrorWe carried out a simulation study to investigate the performance
of our proposed new approach. SimPed33 was used to simulate
1,000 (for investigation of power) or 5,000 (for investigation of
type I error) replicates of datasets, each with 1,500 family units
(case-parent trios, case-mother duos, or case-father duos) typed
at 200 SNPs across a ‘‘chromosome.’’ Haplotype blocks of eight
SNPs in length were simulated; this was repeated 25 times to
give the total of 200 SNPs. If a causal SNP was required (as
when estimating power), then the 100th SNP was used. The
power or type I error of PREMIM and EMIM under various models
was then calculated; detection at SNP numbers 97 to 104 was
used as evidence of a true or false finding. Several different
PREMIM and EMIM tests were considered: (1) using the parent
of origin of alleles as estimated from SHAPEIT2, with and without
genotype-count adjustment, (2) using the previous version
of PREMIM and EMIM, which categorizes ambiguous trios or
duos into a single cell (cell 9 for trios or cell 4 for duos) without
estimating parent of origin, and (3) using the known (simulated)
parent of origin of alleles. The p value thresholds used to
examine power were 10�12, 10�10, and 10�6. For type I error,
the p value thresholds used were 6.25 3 10�3, 1.25 3 10�3,
and 1.25 3 10�4, which correspond to family-wise error rates
(FWERs) of 0.05, 0.01, and 0.001, under the assumption that
the eight SNPs tested are independent. Unless otherwise stated,
the default options in SHAPEIT2 were used (‘‘�burn 7 �prune
8 �main 20’’). For faster analysis (used in the simulation study
er 3, 2015

0.0
0.2
0.4
0.6
0.8
1.0
Maternal imprinting relative risk (Im)
Pow
er
1 1.2 1.4 1.6 1.8 2.0
Mat. imp. − KnownMat. imp. − EstimatedMat. imp. − UnknownMat. imp. cond. child − KnownMat. imp. cond. child − EstimatedMat. imp. cond. child − Unknown
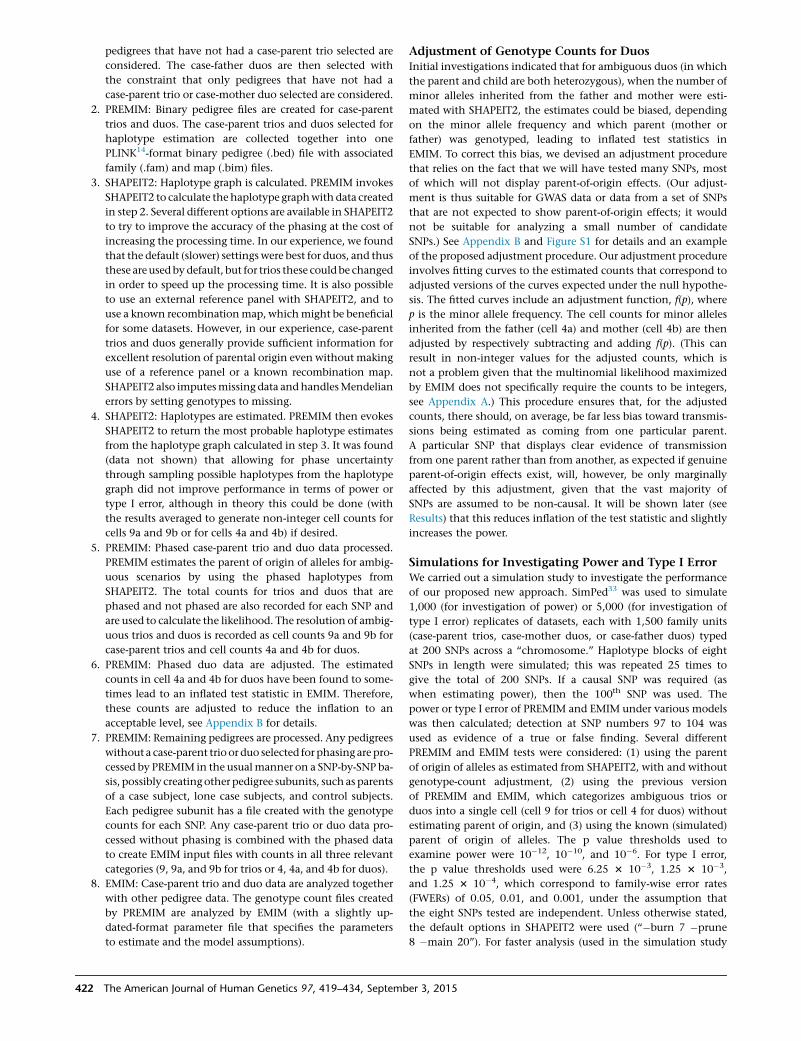
Figure 1. Power of EMIM when UsingSimulated Case-Parent Trio DataPowers of EMIM (for p value threshold10�6) when using simulated case-parenttrio data and assuming known parent oforigin, parent of origin estimated withhaplotype estimates from SHAPEIT2, orunknown (so, averaged over) parent oforigin for any ambiguous trios. Resultsare shown for tests of both maternally in-herited imprinting effects and maternallyinherited imprinting effects conditionalon child-genotype effects.
for case-parent trios), SHAPEIT2 with fast MCMC options
(‘‘�burn 1 �prune 1 �main 1’’) was used. Tests were performed
with PREMIM and EMIM to detect (1) maternally inherited
imprinting effects, (2) maternally inherited imprinting effects
while allowing for child effects, and, for case-parent trios and
type I errors only, (3) maternally inherited imprinting effects
while allowing for maternal effects and (4) maternally inherited
imprinting effects while allowing for maternal and child effects.
Application to SLI DataSLI is a neurodevelopmental disorder that affects linguistic
abilities when development is otherwise normal. In a recent
GWAS of 297 affected children in 278 pedigrees, Nudel et al.6
found two chromosomal regions of interest: chromosome 14,
with a paternally inherited parent-of-origin effect (Ip, p value ¼3.74 3 10�8) and chromosome 5, with a maternally inherited
parent-of-origin effect (Im, p value ¼ 1.16 3 10�7). We applied
the latest versions of PREMIM and EMIM (using SHAPEIT2 to
estimate the parent-of-origin of alleles) to a slightly updated
version of this SLI dataset, testing for paternally inherited
parent-of-origin effects on chromosome 14 and maternally in-
herited parent-of-origin effects on chromosome 5. The pedigrees
were subjected to quality control measures as described in
Anderson et al.34 and Nudel et al,6 but note that the threshold
used for exclusion on the basis of heterozygosity rates was 5 3
SD from the mean, and the Hardy-Weinberg equilibrium p value
exclusion threshold used in PLINK was 10�6 (and not 5 2 SD
and 0.001, respectively, as previously incorrectly specified in
Nudel et al.6).
Application to Tetralogy of Fallot DataTetralogy of Fallot (TOF) is the most common form of congenital
heart disease, a major source of morbidity and mortality in child-
hood. In a recent GWAS using a European discovery set of 835
case subjects, 717 additional family members (including both
parents for 293 of the case subjects), and 5,159 control subjects,
Cordell et al.35 found regions on chromosomes 12 and 13 to be
significantly and replicably associated with TOF. Although not
reported by Cordell et al.,35 further modeling of the replicating
regions via EMIM indicated that the top result on chromosome
12 (at rs11065987) could be equally well modeled by a paternally
inherited imprinting effect (Ip, p value ¼ 2.10 3 10�8) as by an
allelic effect of a child’s own genotype (p value ¼ 4.06 3 10�8).
Also, the top result on chromosome 13 (at rs7982677) could
potentially be equally well modeled by a maternally inherited
imprinting effect (Im, p value ¼ 9.54 3 10�7) as by an allelic
effect of a child’s own genotype (p value 6.41 3 10�7), although
The American
there wasn’t sufficient power in either case to distinguish be-
tween imprinting and child-genotype effects. Evidence for a
maternally inherited imprinting effect on chromosome 12 or a
paternally inherited imprinting effect on chromosome 13 was
less well supported (Im, p value ¼ 9.04 3 10�5 at rs11065987;
Ip, p value 0.00022 at rs7982677). Here, we investigate these
findings further by using our updated version of PREMIM and
EMIM, which uses SHAPEIT2 to estimate the parent-of-origin
of alleles, to test for paternally inherited imprinting effects on
chromosome 12 and maternally inherited imprinting effects on
chromosome 13.
Results
Here, we present results using the latest versions of our
programs PREMIM and EMIM,21 which have been updated
to incorporate haplotype estimation when modeling
parent-of-origin effects. PREMIM calls (if requested) the
software package SHAPEIT2,31,32 and EMIM then incorpo-
rates the estimates of parent of origin of alleles provided by
SHAPEIT2 into its own multinomial modeling procedure
to increase power.
Power for Case-Parent Trios
The power to detect a maternally inherited imprinting
effect (i.e., in which the allele inherited from the mother
increases disease risk) with 1,500 simulated case-parent
trios is shown in Figure 1. Powers are presented for varying
values of the imprinting parameter Im (representing the
risk factor conferred by the maternal risk allele) with or
without additionally conditioning on (i.e., allowing for)
child-genotype effects. In each case, the top line shows
the power of EMIM when using known parent of origin
(calculable here because this is simulated data), the middle
line shows the power of EMIM when using haplotype esti-
mation in SHAPEIT2, and the lower line shows the power
when using the previous version of EMIM. It can be seen
that haplotype estimation increases the power and pro-
vides a level of power that is not too far from themaximum
power achievable when using the known parent of origin
of alleles.
We investigated the use of different options within
SHAPEIT2 to try to improve the accuracy of estimation of
Journal of Human Genetics 97, 419–434, September 3, 2015 423

0 5 10 15 20 25
05
1015
2025
Maternal imprinting
theoretical
obse
rved
λ = 0.996
0 5 10 15 20 25
05
1015
2025
Maternal imprintingconditional on child effects
theoretical
obse
rved
λ = 1.003
0 5 10 15 20 25
05
1015
2025
Maternal imprintingconditional on maternal effects
theoretical
obse
rved
λ = 0.994
0 5 10 15 20 25
05
1015
2025
Maternal imprinting conditional on child and maternal effects
theoretical
obse
rved
λ = 1.000
Figure 2. Q-Q Plots for Simulated Case-Parent Trio DataQ-Q plots showing observed test statisticsagainst their theoretical values for simu-lated case-parent trio data when usingEMIM with SHAPEIT2 to test (1) mater-nally inherited imprinting effects, (2)maternally inherited imprinting effectsconditional on child-genotype effects, (3)maternally inherited imprinting effectsconditional on maternal-genotype effects,and (4) maternally inherited imprintingeffects conditional on child and maternaleffects. bl indicates the genomic controlinflation factor.
haplotypes and thus of parent of origin. For trios, it was
found that no options provided higher power than using
the most basic Markov chain Monte Carlo (MCMC) op-
tions in SHAPEIT2 (‘‘�burn 1 �prune 1 �main 1’’) and
the default options for the size of the SNP window (2Mb)
and the states (‘‘�window 2 �states 100’’) (results not
shown), and these options provided adequate control of
type I error (Figure 2, Figure S2). We also investigated sam-
pling from the posterior distribution of haplotypes within
SHAPEIT2 in order to allow for haplotype uncertainty, but
this did not improve either power or type I error in compar-
ison to just using the most likely haplotype configuration
(results not shown).
The type I error obtained with the new versions of
PREMIM and EMIM was compared with that obtained
with previous versions of PREMIM/EMIM and with that
obtained when parent of origin is known. All three
approaches gave the same levels of type I error and no
signs of inflation (Figure S2). Quantile-quantile (Q-Q)
plots of the test statistics from the new versions of
PREMIM and EMIM (derived from 5,000 simulation rep-
licates under the null hypothesis, each consisting of
1,500 case-parent trios and 200 SNPs) are shown in
Figure 2. The results shown are for tests of maternally
inherited imprinting effects, maternally inherited im-
printing effects conditional on child-genotype effects,
maternally inherited imprinting effects conditional
on maternal-genotype effects, and maternally inherited
424 The American Journal of Human Genetics 97, 419–434, September 3, 2015
imprinting effects conditional on
both child and maternal effects.
The observed genomic control36
inflation factors are all approxi-
mately 1.0, as expected for a well-
calibrated test.
Power for Case-Mother Duos
In many studies, genotype data for
case subjects and their mothers are
available, but no genotype informa-
tion is available for the father. We
used the same approach as used above
for case-parent trios to investigate
the powers to detect maternally inherited imprinting
effects and maternally inherited imprinting effects
conditional on child effects, given genotype data for
1,500 case-mother duos. Results are shown in Figure 3.
In general, the powers are seen to be lower than when
using case-parent trios because there is less information
available to determine the parent of origin of the child’s
alleles.
The top lines of both plots in Figure 3 show the power
of EMIM when using known parent of origin (calculable
here because this is simulated data). It is interesting
to note that the powers are slightly less than those
seen with case-parent trios, even though in both sce-
narios we have the same number of cases and perfect
information on the parent of origin of the alleles of
interest. This loss of power is most likely due to
there being less information available to estimate the
nuisance parameters (the minor allele frequency and
the parental mating parameters m1,.,m6, see Ainsworth
et al.20).
The middle lines of both plots in Figure 3 show the po-
wer of EMIM when incorporating haplotype estimation,
with the cell counts either unadjusted or adjusted by
PREMIM (see Material and Methods for description of
adjustment procedure). It can be seen that the use of
estimated parent of origin through haplotype estimation
provides a substantial increase in power in comparison
to that of the previous version of EMIM (the bottom

0.0
0.2
0.4
0.6
0.8
1.0
Maternal imprinting relative risk (Im)
Pow
er
1 1.2 1.4 1.6 1.8 2.0
Mat. imp. − KnownMat. imp. − AdjustedMat. imp. − EstimatedMat. imp. − Unknown
0.0
0.2
0.4
0.6
0.8
1.0
Maternal imprinting relative risk (Im)
Pow
er
1 1.2 1.4 1.6 1.8 2.0
Mat. imp. cond. child − KnownMat. imp. cond. child − AdjustedMat. imp. cond. child − EstimatedMat. imp. cond. child − Unknown
Figure 3. Power of EMIM when UsingSimulated Case-Mother Duo DataPowers of EMIM (for p value threshold10�6) when using simulated case-motherduo data and assuming known parent oforigin, parent of origin estimated withhaplotype estimates from SHAPEIT2, orunknown (so, averaged over) parent oforigin for any ambiguous duos. Tests ofmaternally inherited imprinting effectsare shown on the top plot and maternallyinherited imprinting effects conditionalon child effects are shown on the lowerplot.
line of both plots), which effectively ‘‘averages’’ over
parent of origin. The greater improvement in power
from haplotype estimation seen for case-mother duos in
comparison to that for case-parent trios is due to the
larger proportion of families in which the parent of origin
of alleles is ambiguous (for case-mother duos, only the
mother and child must be heterozygous for parent of
origin to be unobserved, whereas for case-parent trios,
all three individuals must be heterozygous). The power
when using adjusted estimates (see Material and
Methods) shows a slight improvement over the power
when using unadjusted estimates, owing to the fact
that the estimation of counts of duos falling into the
different parent-of-origin categories is improved through
the adjustment procedure.
Figure S3 shows the type I error of the different EMIM
tests, and dashed lines show the expected FWERs if the
eight SNPs in the simulated haplotype are (conservatively)
considered to be independent. The type I error of the
previous version of EMIM (labeled ‘‘unknown’’), which
has been extensively evaluated by Ainsworth et al.,20
acts as a guide to the ‘‘correct’’ type I error rate, allowing
for dependency between the SNPs. The type I error when
using SHAPEIT2 with fast parameter options is very
inflated. This is illustrated further in the Q-Q plots
(Figure 4) in which the genomic control inflation factor
l ¼ 1.653. However, the inflation factor can be reduced
to 1.052 when using PREMIM’s adjustment procedure.
The improvement obtained from adjustment when
The American Journal of Human Gen
using the default (slower) parameter
options in SHAPEIT2 is not as pro-
nounced: the inflation factor is
1.146 for the unadjusted analysis
and reduces to 1.061 when the counts
are adjusted (see Figure 4).
Utility of Paternal Data for
Detection of Maternally Inherited
Imprinting Effects
Although case-mother duos are a
more commonly used unit than
case-father duos, in real studies,
both types of duos might be
collected. In Figure S4, it can be seen that, somewhat
counter-intuitively, when performing a test of the param-
eter Im in the presence of genuine maternally inherited
imprinting effects, more power is gained from a sample
of case-father duos than from a sample of case-mother
duos. (Both types of duos provide less power than case-
parent trios.) This is true whether or not haplotype esti-
mation with SHAPEIT2 is performed. This observation
can be explained by the observation that, to detect
maternally inherited imprinting effects, we are only
interested in determining whether or not the child
inherited a risk allele from the mother. The expected
proportion of case-mother duos in which the parent of
origin can be determined unambiguously can be calcu-
lated from column five of Table 3 of Ainsworth et al.;20
a similar calculation can be performed for case-father
duos. Performing this calculation, we find that, provided
the allele frequency of the maternally transmitted allele
that increases disease risk is < 0.5 (i.e., the ‘‘risk’’ allele
is the minor allele), a higher proportion of case-father
duos than case-mother duos allows unambiguous deter-
mination of the parent of origin (data not shown). If
the major allele is the risk allele, this is reversed, and it
is the case-mother duos that provide the greater power.
Similarly, for a paternally inherited imprinting effect, pro-
vided the risk allele is the minor allele, it is the case-
mother duos that provide the higher power; if instead
the risk allele is the major allele, case-father duos provide
higher power.
etics 97, 419–434, September 3, 2015 425

0 5 10 15 20 25 30
05
1015
2025
30
EMIM
theoretical
obse
rved
λ= 1.003
0 5 10 15 20 25 30
05
1015
2025
30
EMIM − known
theoretical
obse
rved
λ= 1.008
0 5 10 15 20 25 30
05
1015
2025
30
EMIM with SHAPEIT2 (fast)
theoretical
obse
rved
λ= 1.653
0 5 10 15 20 25 30
05
1015
2025
30
EMIM with SHAPEIT2 (fast) − Adjusted
theoretical
obse
rved
λ= 1.052
0 5 10 15 20 25 30
05
1015
2025
30
EMIM with SHAPEIT2 (slow)
theoretical
obse
rved
λ= 1.146
0 5 10 15 20 25 30
05
1015
2025
30
EMIM with SHAPEIT2 (slow) − Adjusted
theoretical
obse
rved
λ= 1.061
Figure 4. Q-Q Plots for Simulated Case-Mother Duo DataQ-Q plots showing observed test statisticsagainst their theoretical values for simu-lated case-mother duo data when usingEMIM to detect maternally inheritedimprinting effects in 1,500 case-motherduos with (1) EMIM alone, (2) EMIM withknown parent-of-origin alleles, (3) EMIMusing SHAPEIT2 with fast MCMC parame-ters, (4) EMIM using SHAPEIT2 with fastMCMC parameters and adjusted counts,(5) EMIM using SHAPEIT2 with slowMCMC parameters, and (6) EMIM usingSHAPEIT2 with slow MCMC parametersand adjusted counts. bl indicates thegenomic control inflation factor.
SLI Data
We re-analyzed an updated version of the dataset of
Nudel et al. (2014),6 who had presented evidence for a
maternally inherited parent-of-origin effect on chromo-
some 5 and a paternally inherited parent-of-origin effect
on chromosome 14. Re-analysis of the chromosome
5 data in PREMIM and EMIM without using haplotype
estimation in SHAPEIT2 gave a minimum p value of
1.29 3 10�7 at rs10447141, very similar to that seen in
the original analysis by Nudel et al. (p value ¼ 1.16 3
10�7). Using PREMIM and EMIM with haplotype estima-
tion in SHAPEIT2 gave a less significant p value of
6.18 3 10�5 at the same SNP. Plots of the two analyses,
with and without use of SHAPEIT2 to estimate the
426 The American Journal of Human Genetics 97, 419–434, September 3, 2015
parent of origin of alleles, are shown
in Figure 5 and show a considerable
decrease in significance of the most
significant p values. The p values in
the implicated region when using
estimated parent of origin now
provide only weak evidence of asso-
ciation as a result of a maternally
inherited imprinting effect.
Re-analysis of the SLI data on chro-
mosome 14 without use of haplotype
estimation in SHAPEIT2 gave a mini-
mum p value of 2.29 3 10�8 at
rs4280164, very similar to that seen
in the original analysis by Nudel
et al. (p value ¼ 3.74 3 10�8). Using
PREMIM/EMIM with haplotype esti-
mation in SHAPEIT2 gave a less signif-
icant p value of 1.32 3 10�7 at the
same SNP. Plots of the two analyses,
with and without estimated parent
of origin, are shown in Figure 6. These
plots show a general decrease in
significance of the most significant
p values when using haplotype esti-
mation in SHAPEIT2, although the
results (see bottom plots of Figure 6) do still provide posi-
tive evidence of association due to a paternally inherited
imprinting effect.
To investigate the cause of the decreases in significance
seen in the SLI study when incorporating haplotype esti-
mation, we examined the counts of trios and duos falling
into the various categories used in EMIM’s multinomial
modeling procedure (see Table 1). Cells 9 (for trios) or 4
(for duos) correspond to the ambiguous categories in
which all individuals are heterozygous; when using
haplotype estimation in SHAPEIT2, these cells are decom-
posed into cells 9a and 9b, or 4a and 4b, respectively, in
which parent of origin has been (probabilistically) deter-
mined. For SNP rs10447141 on chromosome 5, there

0 50 100 150
12
34
56
78
EMIM without SHAPEIT2 (Im)
chromosome 5 position (Mb)
−lo
g 10(p)
0 5 10 15 20 25 30
05
1015
2025
30
Q−Q plot
theoretical
obse
rved
λ= 0.978
0 50 100 150
12
34
56
78
EMIM with SHAPEIT2 (Im)
chromosome 5 position (Mb)
−lo
g 10(p)
0 5 10 15 20 25 30
05
1015
2025
30
Q−Q plot
theoretical
obse
rved
λ= 0.982
Figure 5. Manhattan and Q-Q Plots forSpecific Language Impairment Data,Chromosome 5Manhattan plots of the�log10 p values andQ-Q plots of the test statistics on chro-mosome 5 for maternally inheritedimprinting effect analysis of specificlanguage impairment data when usingEMIM alone (top plots) and EMIM withSHAPEIT2 (bottom plots). bl indicates thegenomic control inflation factor.
are 16 ambiguous case-parent trios, which result (when
using haplotype estimation) in estimates of six case sub-
jects receiving the risk allele from the father and ten
from the mother. There were also ten ambiguous case-
mother duos, resulting in estimates of 1.99 case subjects
receiving the risk allele from the father and 8.01 from
the mother, and four ambiguous case-father duos, result-
ing in estimates of 3.02 cases receiving the risk allele from
the father and 0.98 from the mother. Overall, this re-
solves the parent of origin in an additional 30 families
in comparison to the original analysis of Nudel et al.,6
giving 11.01 new receipts from the father and 18.99
from the mother. This increased number of receipts
from the mother might be expected to result in a stronger
maternally inherited imprinting effect than seen origi-
nally; however, the ‘‘risk’’ allele in this case actually
decreases risk, giving an odds ratio of Im ¼ 0.326 in
the original analysis and Im ¼ 0.494 when using esti-
mated parent of origin. Therefore, the overall effect is
now weakened by having more new receipts from
mothers than from fathers. Similar observations can be
made for the other SNPs in this region. It therefore seems
probable that the original result could represent a statisti-
cal false positive due to stochastic sampling variation,
which has been better resolved with the addition of
30 new observations. So, although the overall decrease
in significance might seem disappointing, it corresponds
to the use of more information (an additional 30 families
The American Journal of Human Gen
contributing to the analysis) and
thus should be considered a more
reliable result.
The reduction in significance for
the paternally inherited imprinting
effect on chromosome 14 can also
be explained by examining the
parent-of-origin resolved cell counts
(7.01 new receipts from the father
and 15.99 from the mother, see
Table 1). The fact that an additional
23 families are contributing to the
analysis means that this should
again be considered a more reliable
result in comparison to the original
analysis. However, in this case, the
evidence for the presence of a pater-
nally inherited imprinting effect remains relatively strong
(p value ¼ 1.32 3 10�7).
TOF Data
We also re-analyzed the data of Cordell et al. (2013),35
testing for a paternally inherited imprinting effect on
chromosome 12 and a maternally inherited imprinting
effect on chromosome 13. Without using estimated
parent of origin, the analysis on chromosome 12 gave a
minimum p value of 2.10 3 10�8 at rs11065987; using
estimated parent of origin gave a p value of 4.16 3 10�7
at the same SNP. On chromosome 13, the most significant
SNP, rs7982677, gave p values of 9.54 3 10�7 and 6.97 3
10�6 when not estimating and estimating parent of
origin, respectively. Plots of these analyses, with and
without using estimated parent of origin, are shown in
Figures S5 and S6. Again we see a general decrease in
the significance of the most significant results when
using haplotype estimation, weakening the evidence
that these genomic regions genuinely harbor imprinting
effects.
Table 2 shows counts of the number of trios or duos fall-
ing into the ambiguous categories and their resolution
when using haplotype estimation with SHAPEIT2 for the
TOF data. For SNP rs11065987 on chromosome 12, it can
be seen that, for case-parent trios and case-father duos,
the number of risk alleles inherited from the father and
mother are approximately equal; however, for case-mother
etics 97, 419–434, September 3, 2015 427

20 40 60 80 100
12
34
56
78
EMIM without SHAPEIT2 (Ip)
chromosome 14 position (Mb)
−lo
g 10(p )
0 5 10 15 20 25 30
05
1015
2025
30
Q−Q plot
theoretical
obse
rved
λ= 0.869
20 40 60 80 100
12
34
56
78
EMIM with SHAPEIT2 (Ip)
chromosome 14 position (Mb)
−lo
g 10(p )
0 5 10 15 20 25 30
05
1015
2025
30
Q−Q plot
theoretical
obse
rved
λ= 0.891
Figure 6. Manhattan and Q-Q Plots forSpecific Language Impairment Data,Chromosome 14Manhattan plots of the �log10 p valuesand Q-Q plots of the test statistics onchromosome 14 for paternally inheritedimprinting effects analysis of specificlanguage impairment data when usingEMIM alone (top plots) and EMIM withSHAPEIT2 (bottom plots). bl indicates thegenomic control inflation factor.
duos, many more risk alleles are estimated to be inherited
from the mother: 10.007, as compared to 1.993 from the
father. This results in the initial estimated paternally in-
Table 1. Cell Counts for the Specific Language Impairment Data
Chromosome SNPBase-PairPosition
Cell Counts inCase-ParentTrios
Cell Counts inCase-MotherDuos
Cell Counts inCase-FatherDuos
EMIMwithof O
9 9a 9b 4 4a 4b 4 4a 4b Unk
5 rs10447141 39852924 16 6 10 10 1.99 8.01 4 3.02 0.98 0.32
5 rs980306 39852592 14 6 8 9 1.99 7.01 4 3.02 0.98 0.33
5 rs17194068 39857074 14 6 8 9 1.99 7.01 4 3.02 0.98 0.33
5 rs6895329 39861497 15 6 9 11 2.99 8.01 4 3.02 0.98 0.34
5 rs1994882 39841921 7 7 0 13 1.99 11.01 2 1.02 0.98 2.38
14 rs4280164 23841124 10 5 5 12 1.01 10.99 1 1.00 0.00 0.25
14 rs11158632 23839502 10 5 5 12 1.01 10.99 1 1.00 0.00 0.25
14 rs2144494 23843226 10 5 5 12 1.01 10.99 1 1.00 0.00 0.25
14 rs2281472 23845685 12 6 6 10 1.02 8.98 2 2.00 0.00 0.29
14 rs3181384 23856815 11 5 6 11 1.02 9.98 1 1.00 0.00 0.32
Shown are the results at the five SNPs on chromosomes 5 and 14 with the lowest p values, when using EMIMare shown for the ambiguous scenarios in which all individuals are heterozygous: cell 9 for case-parent trios anThe estimated number of trios and duos in which the risk allele is inherited from the father is given as cells 9awhich the risk allele is inherited from the mother is given as cells 9b and 4b, respectively. Cell counts estimatedthe adjustment described in Appendix B. The odds ratios and p values given by EMIM with and without haplowere tested for maternally and paternally inherited imprinting effects, respectively.
428 The American Journal of Human Genetics 97, 419–434, September 3, 2015
herited imprinting effects odds ratio
Ip ¼ 1.662 reducing to 1.555, thus
decreasing the significance (and
increasing the p value). Similarly, for
SNP rs7982677 on chromosome 13,
it can be seen that more alleles are in-
herited from the father than from the
mother for all trios and duos, result-
ing in an initial estimated maternally
inherited imprinting effect odds ratio
Im ¼ 1.577 reducing to 1.504. Again,
although the significance is decreased
when using haplotype estimation, it
corresponds to the use of more infor-
mation (an additional 43 families on
chromosome 12 and an additional
29 families on chromosome 14) and
thus should be considered the more reliable result. We
note that the decrease of significance seen in this dataset
with respect to testing imprinting effects (Ip or Im) has no
Odds RatioParentrigin
EMIM p Valuewith Parentof Origin
nown Estimated Unknown Estimated
6 0.494 1.29 3 10�7 6.18 3 10�5
4 0.487 4.28 3 10�7 7.53 3 10�5
6 0.487 4.91 3 10�7 7.53 3 10�5
3 0.497 1.12 3 10�6 1.10 3 10�4
8 2.013 2.70 3 10�6 5.57 3 10�5
4 0.317 2.29 3 10�8 1.32 3 10�7
6 0.320 2.83 3 10�8 1.70 3 10�7
6 0.317 3.03 3 10�8 1.31 3 10�7
9 0.364 2.12 3 10�7 6.96 3 10�7
6 0.376 1.02 3 10�6 2.21 3 10�6
with and without haplotype estimation. Cell countsd cell 4 for case-mother duos and case-father duos.and 4a, respectively, and the estimated number infrom duos need not be integers as they incorporatetype estimation are shown. Chromosomes 5 and 14

Table 2. Cell Counts for the Tetralogy of Fallot Data
Chromosome SNPBase-PairPosition
Cell Counts inCase-ParentTrios
Cell Counts inCase-MotherDuos
Cell Counts inCase-FatherDuos
EMIM Odds Ratiowith Parentof Origin
EMIM p Valuewith Parentof Origin
9 9a 9b 4 4a 4b 4 4a 4b Unknown Estimated Unknown Estimated
12 rs11065987 110556807 28 13 15 12 1.993 10.007 3 1.976 1.024 1.662 1.555 2.10 3 10�8 4.16 3 10�7
12 rs11066188 111095097 30 13 17 13 2.996 10.004 4 2.976 1.024 1.591 1.489 3.38 3 10�7 5.02 3 10�6
12 rs3184504 110368991 30 14 16 11 9.942 1.058 3 0.987 2.013 0.622 0.662 3.43 3 10�7 3.35 3 10�6
12 rs17696736 110971201 29 13 16 12 1.987 10.013 4 2.977 1.023 1.582 1.481 4.63 3 10�7 6.84 3 10�6
12 rs653178 110492139 30 14 16 11 9.943 1.057 3 0.987 2.013 0.627 0.666 4.82 3 10�7 4.50 3 10�6
13 rs7982677 91786324 19 10 9 6 3.016 2.984 4 4.000 0.000 1.577 1.504 9.54 3 10�7 6.97 3 10�6
13 rs7318834 108710500 11 5 6 6 1.006 4.994 1 0.987 0.013 1.667 1.640 5.87 3 10�6 8.40 3 10�6
13 rs4771856 91792510 18 9 9 6 3.016 2.984 3 2.998 0.002 1.519 1.461 1.12 3 10�5 4.79 3 10�5
13 rs7994141 47672251 42 24 18 4 2.008 1.992 4 2.007 1.993 0.656 0.668 1.41 3 10�5 1.13 3 10�5
13 rs7995410 47651319 42 24 18 4 2.008 1.992 4 2.007 1.993 0.656 0.668 1.43 3 10�5 1.14 3 10�5
Shown are the results at the five SNPs on chromosomes 12 and 13 with the lowest p values, when using EMIMwith and without haplotype estimation. Cell countsare shown for the ambiguous scenarios in which all individuals are heterozygous: cell 9 for case-parent trios and cell 4 for case-mother duos and case-father duos.The estimated number of trios and duos in which the risk allele is inherited from the father is given as cells 9a and 4a, respectively, and the estimated number inwhich the risk allele is inherited from the mother is given as cells 9b and 4b, respectively. Cell counts estimated from duos need not be integers given that theyincorporate the adjustment described in Appendix B. The odds ratios and p values given by EMIM, with and without haplotype estimation, are shown. Chromo-somes 12 and 13 were tested for paternally and maternally inherited imprinting effects, respectively.
impact on the significance of associations due to the case
subject’s own genotype, findings which have in any case
already been replicated in independent cohorts.35
Discussion
Here, we have demonstrated the improved functionality
implemented in the latest version of our software package,
PREMIM and EMIM, which has been updated to incorpo-
rate haplotype estimation in SHAPEIT2 when modeling
parent-of-origin effects. Naturally, computation time is
increased as a result of using SHAPEIT2, but the analysis still
remains quite feasible for any realistically sized study.
Although the focus of this current investigation is on detec-
tion of parent-of-origin effects, we note that PREMIM and
EMIM offer wider functionality, such as the ability to test
formaternal-genotype effects ormother-child genotype in-
teractions,withorwithout the inclusionofparent-of-origin
effects. The software can also be used to increase the power
when analyzing an unrelated case-control dataset by incor-
porating case or control parental data when available.
The ability to detect imprinting effects is dependent on
determining the parent of origin of alleles in a set of case
subjects, which requires parental data as well as data
from the case subjects themselves. The most obvious data
to gather is a case-parent trio so that the parent of origin
of alleles can be determined, except in the one scenario
where all individuals are heterozygous. With the use of
SHAPEIT2, the parent of origin of alleles can be estimated
by using the surrounding SNP information to estimate
haplotypes and thus parent of origin. By using these esti-
The American
mates in our multinomial modeling procedure, we found
that the power could be increased over the previous ver-
sions of PREMIM and EMIM, while still retaining accept-
able type I error rates.
When data are restricted to case-mother or case-father
duos, the proportion of genotype data with ambiguous
parent of origin is greater than that for case-parent trios,
thus greatly increasing the benefit of using SHAPEIT2 to
estimate the parent of origin of alleles. However, use of
case-mother or case-father duos with estimated haplotypes
was found to lead to a potential bias in the parent-of-origin
assignment (the bias was dependent on which parent
was genotyped and the minor allele frequency of the SNP
being tested), resulting in an increase in type I error. Fortu-
nately, this could be corrected by adjusting the estimated
parent-of-origin cell counts to more closely match the
expected distributions under the null hypothesis. This
adjustment was performed by fitting an adjustment curve
via maximum likelihood methods, which successfully
reduced the type I errors to acceptable levels as well as
increased the power.
Parent-of-origin effects, particularly if mediated through
imprinting, represent a more complex, potentially func-
tionally relevant mechanism than the genetic effects that
are typically identified through large-scale case-control
GWASs. The requirement for parental data necessarily
limits the power of studies designed to detect such effects
(except, perhaps, in special populations such as the Icelan-
dic population), owing to the decreased sample sizes
that are likely to be available; however, suitable cohorts
(particularly of mother-child duos) are often collected,
for example, when investigating traits related to pregnancy
Journal of Human Genetics 97, 419–434, September 3, 2015 429

complications. An attraction of focusing on the detection
of parent-of-origin effects (rather than on effects mediated
primarily by the case subject’s own genotype) is the
greater potential for immediate functional investigation
and experimental validation. Our application of the new
versions of PREMIM and EMIM to four genomic regions
that have been postulated as harboring parent-of-origin
effects (in cohorts with two separate disorders) found
slightly decreased evidence in three of the four regions
and considerably decreased evidence in one region, as
a result of a larger number of parent-of-origin resolved
transmissions than had previously been available. None
of the SNPs investigated lie in regions already known to
contain imprinted genes,37,38 so further investigation will
be required to determine the underlying cause of the
parent-of-origin effects observed. The parent-of-origin
effect seen on 14q for SLI does, however, overlap with a re-
gion that has previously shown a hint toward genomic
imprinting.39 A comparison of individuals with a paternal
deletion of 14q11–13 and individuals with maternal uni-
parental disomy of that region showed that the two groups
had some overlapping phenotypes, suggesting that the
paternal allele is normally expressed.40 Together, these
studies suggest that the region may be maternally im-
printed, and thus paternal parent-of-origin effects may be
operating there.
In conclusion, we recommend that investigators inter-
ested in analyzing GWAS data to search for maternally
or paternally inherited imprinting effects should use the
updated approach implemented in our software package
PREMIM and EMIM, which currently provides, to the
best of our knowledge, the most convenient and powerful
analysis tool for addressing this question.
Appendix A
Derivation of Likelihood
Here, we derive the likelihood for the multinomial model
when estimated haplotypes are used to estimate the parent
of origin of alleles. The data considered consists of case-
parent trios and control-parent trios and the methodology
extends to other sub-pedigrees as previously described.20,21
We consider data observed at one SNP given that some,
possibly all, of the data have been phased and parent-of-
origin deduced. This gives an expression for the likelihood
as follows:
Lðq;DÞ ¼Yi
P�gmi
; gfi ; gci ;Ji j q;disi�;
where D is the data (consisting of genotype data gmi, gfi ,
and gci for the mother, father, and child, respectively,
in the ith trio and the event that the trio has been
phased, Ji ¼ 1, or not, Ji ¼ 0), conditional on the child’s
disease status disi. The full set of multinomial model
parameters is given by q ¼ (R1, R2, S1, S2, Im, Ip, g11, g12,
430 The American Journal of Human Genetics 97, 419–434, Septemb
g21, g22, m1, m2, m3, m4, m5, m6) as defined by Ainsworth
et al.20 We have
Lðq;DÞ ¼Y
i˛diseased
P�gmi
; gfi ; gci ;Ji j q;disi ¼ 1�
�Y
i˛not diseased
P�gmi
; gfi ; gci ;Ji j q;disi ¼ 0�;
where ‘‘diseased’’ or ‘‘not diseased’’ relate to the sets of
case subjects (disi ¼ 1) or control subjects (disi ¼ 0),
respectively.
The first term of this product where the child is diseased
gives
Qi˛diseased
P�gmi
; gfi ; gci ;Ji j q;disi ¼ 1�¼
Qi˛diseased; phased
P�gmi
; gfi ; gci j q;disi ¼ 1;Ji ¼ 1�
3 P�Ji ¼ 1 j q;disi ¼ 1
�3
Yi˛diseased; not phased
P�gmi
; gfi ; gci j q;disi ¼ 1;Ji ¼ 0�
3 P�Ji ¼ 0 j q;disi ¼ 1
�:
Now, define nj and n0j as the number of case-parent trios
with genotype data for cell j˛{1, ., 8, 9a, 9b, 10, ., 15}
for not phased and phased data, respectively, where
the 16 cells are defined as by Ainsworth et al.20 and
Nj ¼ nj þ n0j as the total case-parent trios with diseased chil-
dren for cell j. For phased data, n09a and n0
9b are calculated
from the estimated haplotypes, and we can define cell 9
as the total of cells 9a and 9b so that n09 ¼ n0
9a þ n09b. For un-
phased data, cells 9a and 9b are not observed or estimated,
so we again define cell 9 as the total of cells 9a and 9b,
which is observed, so that n9 ¼ n9a þ n9b.
Define r as the probability of a case-parent trio being
phased, assuming independence with the genotypes.
This is given by the proportion of trios that have been
phased in the dataset. Referring to column 9 of Table 2 in
Ainsworth et al,20 we then get
Yi˛diseased;
phased
P�gmi
; gfi ; gci j q;disi ¼1;Ji ¼1�PðJi ¼ 1 jdisi ¼1Þ ¼
�rR2S2ImIpg22m1
�n01 3.3
�rR2S1ImIpg12m4
�n08
3�rR1S1Ipg11m4
�n09a 3 ½rR1S1Img11m4�n
09b 3 ½rS1m4�n
010 3 ½rm6�n
015 :
When the data are not phased, we have n9 ¼ n9a þ n9b.
This then gives
Yi˛diseased;not phased
P�gmi
; gfi ; gci j q;disi¼1;Ji¼0�PðJi ¼ 0 jdisi¼1Þ ¼
�ð1� rÞR2S2ImIpg22m1
�n1 3.3�ð1� rÞR2S1ImIpg12m4
�n83�ð1� rÞR1S1
�Ip þ Im
�g11m4
�n93½ð1� rÞS1m4�n103½ð1� rÞm6�n15 :
Therefore,
er 3, 2015

Yi˛diseased
P�gmi
; gfi ; gci ;Ji j q;disi ¼ 1� ¼
rn01ð1� rÞn13.3 rn
08ð1� rÞn83 rn
010ð1� rÞn103.3 rn
015ð1� rÞn15
3�R2S2ImIpg22m1
�N1 3.3�R2S1ImIpg12m4
�N8
3�rR1S1Ipg11m4
�n09a 3 ½rR1S1Img11m4�n
09b
3�ð1� rÞR1S1
�Ip þ Im
�g11m4
�n9 3 ½S1m4�N10 3.3 ½m6�N15 :
Similarly, when the child is not diseased we use
Qi˛not diseased
P�gmi
; gfi ; gci ;Ji j q;disi ¼ 0�¼
Qi˛not diseased;
phased
P�gmi
; gfi ; gci j q;disi ¼ 0;Ji ¼ 1�
3 P�Ji ¼ 1 j q;disi ¼ 0
�3
Qi˛not diseased;
not phased
P�gmi
; gfi ; gci j q;disi ¼ 0;Ji ¼ 0�
3 P�Ji ¼ 1 j q;disi ¼ 0
�:
Define mj and m0j as the number of control-parent trios
with genotype data for each cell j for not phased and
phased data, respectively, and Mj ¼ mj þm0j as the total of
control-parent trios with diseased children for cell j.
Furthermore, define r0 as the probability of a control-parent
trio being phased, assuming independence with the geno-
types. As before, referring to Table 2 in Ainsworth et al,20
we obtain
Yi˛not diseased;
phased
P�gmi
; gfi ; gci j q;disi ¼0;Ji¼1�PðJi ¼1 jdisi¼ 0Þ
¼ ½r 0m1�m01 3.3 ½r0m4�m
08 3 ½r0m4�m
09a 3 ½r0m4�m
09b
3 ½r 0m4�m010 3.3 ½r0m6�m
015 :
As with case-parent trios, we define cell 9 as the total of
cells 9a and 9b, which is observed, so that m9 ¼ m9a þm9b. This then gives
Yi˛not diseased;
not phased
P�gmi
; gfi ; gci j q;disi ¼0;Ji ¼0�PðJi ¼0 jdisi¼ 0Þ
¼ ½ð1� r0Þm1�m1 3.3 ½ð1� r0Þm4�m8 3 ½ð1� r 0Þm4�m9
3 ½ð1� r 0Þm4�m10 3.3 ½ð1� r 0Þm6�m15 :
Therefore,
Yi˛not diseased
P�gmi
; gfi ; gci j q;disi ¼ 0�
¼ ðr 0Þm01ð1� r0Þm1 3.3 ðr 0Þm0
15ð1� r 0Þm15
3 ½m1�M1 3.3 ½m4�M8 3 ½m4�M9 3 ½m4�M10 3.3 ½m6�M15 :
The American
Therefore, the likelihood of the data is
Lðq;DÞ ¼ rn01ð1� rÞn1 3.3 rn
08ð1� rÞn8
3 rn010ð1� rÞn10 3.3 rn
015ð1� rÞn15 3 ðr0Þm0
1
3 ð1� r 0Þm1 3.3 ðr0Þm015ð1� r0Þm15
3�R2S2ImIpg22m1
�N1 3�R2S2ImIpg22m2
�N2
3 ½R1S2Img21m2�N3 3�R2S1ImIpg12m2
�N4
3�R1S1Ipg11m2
�N5 3 ½R1S2Img21m3�N6 3�R1Ipm3
�N7
3�R2S1ImIpg12m4
�N8 3�rR1S1Ipg11m4
�n09a
3 ½rR1S1Img11m4�n09b 3
�ð1� rÞR1S1�Ip þ Im
�g11m4
�n93 ½S1m4�N10 3 ½R1S1Img11m5�N11 3 ½S1m5�N12
3�R1Ipm5
�N13 3 ½m5�N14 3 ½m6�N15 3 ½m1�M1 3 ½m2�M2
3 ½m2�M3 3 ½m2�M4 3 ½m2�M5 3 ½m3�M6 3 ½m3�M7 3 ½m4�M8
3 ½m4�M9 3 ½m4�M10 3 ½m5�M11 3 ½m5�M12 3 ½m5�M13
3 ½m5�M14 3 ½m6�M15 :
The log likelihood is therefore given by
lðq;DÞ ¼ logðLðq;DÞÞ¼ n0
1logðrÞ þ n1logð1� rÞ þ.þ n08logðrÞ
þ n8logð1� rÞ þ n010logðrÞ þ n10logð1� rÞ þ.
þ n015logðrÞ þ n15logð1� rÞ þm0
1logðr 0Þþm1logð1� r0Þ þ.þm0
15logðr0Þ þm15logð1� r0ÞþN1log
�R2S2ImIpg22m1
�þN2log�R2S2ImIpg22m2
�þN3logðR1S2Img21m2Þ þN4log
�R2S1ImIpg12m2
�þN5log
�R1S1Ipg11m2
�þN6logðR1S2Img21m3ÞþN7log
�R1Ipm3
�þN8log�R2S1ImIpg12m4
�þ n0
9alogðrÞ þ n09blogðrÞ þ n9logð1� rÞ
þ n09alog
�R1S1Ipg11m4
�þ n09blogðR1S1Img11m4Þ
þ n9log�R1S1
�Ip þ Im
�g11m4
�þN10logðS1m4ÞþN11logðR1S1Img11m5Þ þN12logðS1m5ÞþN13log
�R1Ipm5
�þN14logðm5Þ þN15logðm6ÞþM1logðm1ÞþM2logðm2ÞþM3logðm2Þ þM4logðm2ÞþM5logðm2Þ þM6logðm3Þ þM7logðm3ÞþM8logðm4Þ þM9logðm4Þ þM10logðm4ÞþM11logðm5Þ þM12logðm5Þ þM13logðm5ÞþM14logðm5Þ þM15logðm6Þ:
We note that, for fixed r and r0, the likehood does not
depend on the values of r and r0, so these terms can be
dropped. For convenience, in our software implementa-
tion, we retain r and r0 in the likelihood calculation,
but we find the results are invariant to the choice of r
and r0. This is equivalent to considering the overall
likelihood as the product of the conditional likeli-
hoods P(gmi, gfi, gci j q, disi, Ji ¼ 0) and P(gmi
, gfi, gci jq, disi, Ji ¼ 1) for the unphased (15 cell) and phased
(16 cell) tables, respectively.
Journal of Human Genetics 97, 419–434, September 3, 2015 431

For other types of sub-pedigrees, including case-mother
duos and case-father duos, the calculation proceeds
similarly.
Appendix B
Adjustment of Genotype Counts for Duos
Let N be the number of case-mother duos and M the
number of SNPs to be analyzed. (Genotype counts for
case-father duos are adjusted in the same manner, but
we only consider case-mother duos here for simplicity.)
Let X ¼ {x1,.,xM} be the sequence of observed SNP
case-mother duo data such that each xi is a vector of
cell counts {xij} for SNP i for case-mother duo cells j ¼ 1,
2, 3, 4a, 4b, 5, 6, and 7. Let pi be the minor allele
frequency of SNP i, then, assuming Hardy-Weinberg
equilibrium and random mating, xi is given by a multi-
nomial distribution withP
jxij ¼ N and eight probabilities
qij, with probabilities for cells 4a and 4b given by
qið4aÞ ¼ p2i ð1� piÞ and qið4bÞ ¼ pið1� piÞ2, respectively. Let
Si be the covariance matrix where the variances for
cells 4a and 4b are given by Sið4a;4aÞ ¼ Nqið4aÞð1� qið4aÞÞand Sið4b;4bÞ ¼ Nqið4bÞð1� qið4bÞÞ, respectively, with covari-
ance Sið4a;4bÞ ¼ �Nqið4aÞqið4bÞ.Approximating the multinomial distribution with the
multivariate normal distribution gives the following likeli-
hood function:
LðXÞ ¼YMi¼1
1ffiffiffiffiffiffiffiffiffiffiffiffiffiffiffiffiffiffiffiffiffiffiffiffið2pÞ2 jSi j
q exp
� 1
2ðxi � miÞTS�1
i ðxi � miÞ;
where mi ¼ Nqi are the expected cell counts for SNP i. To
correct the bias, we add a correction vector, F(pi), to the
observed data, with F(pi) given by
F�pi� ¼ �
0;0;0;�Nf�pi�;Nf
�pi�;0;0; 0
�T;
where f(p) ¼ b0 þ b1p þ b2p2 þ b3p
3, so that the cell counts
4a and 4b are adjusted while maintaining the sumPjxij ¼ N. We choose b ¼ {b0,b1,b2,b3} to maximize the
likelihood:
LðX j bÞ ¼YMi¼1
1ffiffiffiffiffiffiffiffiffiffiffiffiffiffiffiffiffiffiffiffiffiffiffiffið2pÞ2 jSi j
q3 exp
� 1
2
�xi þ F
�pi��mi
�TS�1
i
�xi þ F
�pi�� mi
�:
It was found that higher order polynomials than cubic
resulted in over fitting, whereas lower order polynomials
were insufficient tomodel the bias over the differentminor
allele frequencies. Taking the negative logarithm and
removing all constants that do not depend on b results
in the following negative log likelihood:
432 The American Journal of Human Genetics 97, 419–434, Septemb
lðX j bÞ ¼Xi¼1
M 1
2�Sið4a;4aÞSið4b;4bÞ � Sið4a;4bÞ
�3
��xið4aÞ �Nf
�pi�� mið4aÞ
�2
Sið4b;4bÞ
� 2�xið4aÞ �Nf
�pi�� mið4aÞ
�3�xið4bÞ �Nf
�pi�� mið4bÞ
�Sið4a;4bÞ
þ�xið4bÞ þNf
�pi�� mið4bÞ
�2
Sið4a;4aÞ
�;
where xi(4a) and xi(4b) are the number of case-mother duos
(with expected values mið4aÞ ¼ Nqið4aÞ ¼ Np2i ð1� piÞ and
mið4bÞ ¼ Nqið4bÞ ¼ Npið1� piÞ2) for cells 4a and 4b, respec-
tively. Newton’s Method is used to fit b in PREMIM by
minimizing the negative log-likelihood with (fixed) esti-
mated minor allele frequencies, pi, for each SNP i. The
new adjusted cell counts for cells 4a and 4b are then given
by xi(4a) � Nf(pi) and xi(4b) þ Nf(pi), respectively.
Example Illustrating the Adjustment of Genotype
Counts for Duos
A demonstration of adjusting the duo counts is shown in
Figure S1. Data were simulated under the null hypothesis
for 1,500 case-mother duos with haplotypes of eight
SNPs in length repeated 25 times, which gave rise to
200 SNPs with expected minor allele frequencies of 0.34,
0.45, 0.35, 0.25, 0.20, 0.16, 0.12, and 0.08, shown by the
clustering of points in Figure S1 around these values. The
top left plot shows, for each SNP, the SHAPEIT2 estimated
number of minor alleles inherited from the father for the
ambiguous scenario (cell 4a) plotted against the estimated
minor allele frequency. The solid line shows the expected
number of minor alleles inherited from the father under
the null hypothesis, and it can be seen that the clusters
of points tend to be not centered on this line but are too
high for low minor allele frequencies and too low for
high minor allele frequencies. The corresponding plots
for the number of minor alleles inherited from the mother
(cell 4b) shows a similar, but reversed, pattern. This can be
seen more clearly with the estimated cell count minus the
expected cell count (bottom left plots) where the points are
not clustered around zero.
The dashed lines on the two top left plots in Figure S1
show the fitted curves used to adjust the genotype counts,
N(p2(1 � p) þ f(p)) and N(p(1 � p)2 � f(p)) for p˛[0, 0.5], forthe number of minor alleles inherited from the father and
mother, respectively. These two curves are fitted simulta-
neously, and if the estimates given by SHAPEIT2 are accu-
rate, then these should be close to the expected curves,
with the fitted parameters b being close to zero. In the
example in Figure S1 this is not true (although the tails
of the dashed lines can be ignored given that there is no
data in these regions). The dashed lines on the two lower
plots on the left show Nf(p) and �Nf(p), respectively, and
show how the estimated cell counts will be adjusted.
er 3, 2015

The two top right plots in Figure S1 show that the
adjusted cell counts are nearer the expected curves than
the unadjusted cell counts. This is more clearly shown
on the two lower right plots where the differences between
the estimated and the expected (under the null hypothe-
sis) cell counts are shown.
Supplemental Data
Supplemental Data include six figures and can be found with this
article online at http://dx.doi.org/10.1016/j.ajhg.2015.07.016.
Acknowledgments
Support for this work was provided by the Wellcome Trust (grants
087436/Z/08/Z and 102858/Z/13/Z). B.K. is supported by a British
Heart Foundation personal chair. R.N. was funded by a University
of Oxford Nuffield Department of Medicine Prize Studentship. We
thank Dianne F. Newbury and Simon E. Fisher for helpful com-
ments on the manuscript. The work of the Newbury lab (which
supported R.N.) is funded by the Medical Research Council
(G1000569/1 and MR/J003719/1). We thank the SLI Consortium
for making their data available to us. The SLI Consortium GWAS
data were generated with funding from the Max Planck Society.
Generation of the TOF data was funded by the British Heart Foun-
dation and the EuropeanCommunity (7th Framework Programme
contract ‘‘CHeartED,’’ grant no. HEALTH-F2-2008-223040). Gener-
ation of the Wellcome Trust Case Control Consortium 2 control
data was funded by the Wellcome Trust under award 085475.
Received: June 23, 2015
Accepted: July 29, 2015
Published: August 27, 2015
Web Resources
The URLs for data presented herein are as follows:
OMIM, http://www.omim.org
PREMIM and EMIM, https://www.staff.ncl.ac.uk/richard.howey/
emim/index.html
SHAPEIT2, https://mathgen.stats.ox.ac.uk/genetics_software/shapeit/
shapeit.html#home
References
1. Lawson, H.A., Cheverud, J.M., andWolf, J.B. (2013). Genomic
imprinting and parent-of-origin effects on complex traits. Nat.
Rev. Genet. 14, 609–617.
2. Mott, R., Yuan, W., Kaisaki, P., Gan, X., Cleak, J., Edwards, A.,
Baud, A., and Flint, J. (2014). The architecture of parent-of-
origin effects in mice. Cell 156, 332–342.
3. Guilmatre, A., and Sharp, A.J. (2012). Parent of origin effects.
Clin. Genet. 81, 201–209.
4. Wallace, C., Smyth, D.J., Maisuria-Armer, M., Walker, N.M.,
Todd, J.A., and Clayton, D.G. (2010). The imprinted DLK1-
MEG3 gene region on chromosome 14q32.2 alters susceptibil-
ity to type 1 diabetes. Nat. Genet. 42, 68–71.
5. Kong, A., Steinthorsdottir, V., Masson, G., Thorleifsson, G.,
Sulem, P., Besenbacher, S., Jonasdottir, A., Sigurdsson, A., Kris-
tinsson, K.T., Jonasdottir, A., et al.; DIAGRAM Consortium
The American
(2009). Parental origin of sequence variants associated with
complex diseases. Nature 462, 868–874.
6. Nudel, R., Simpson, N.H., Baird, G., O’Hare, A., Conti-Rams-
den, G., Bolton, P.F., Hennessy, E.R., Ring, S.M., Davey Smith,
G., Francks, C., et al.; SLI Consortium (2014). Genome-wide
association analyses of child genotype effects and parent-of-
origin effects in specific language impairment. Genes Brain Be-
hav. 13, 418–429.
7. Esparza-Gordillo, J., Matanovic, A., Marenholz, I., Bauerfeind,
A., Rohde, K., Nemat, K., Lee-Kirsch, M.A., Nordenskjold, M.,
Winge, M.C., Keil, T., et al. (2015). Maternal filaggrin muta-
tions increase the risk of atopic dermatitis in children: an
effect independent of mutation inheritance. PLoS Genet. 11,
e1005076.
8. Jamieson, S.E., de Roubaix, L.A., Cortina-Borja, M., Tan, H.K.,
Mui, E.J., Cordell, H.J., Kirisits, M.J., Miller, E.N., Peacock, C.S.,
Hargrave, A.C., et al. (2008). Genetic and epigenetic factors at
COL2A1 and ABCA4 influence clinical outcome in congenital
toxoplasmosis. PLoS ONE 3, e2285.
9. Kistner, E.O., Infante-Rivard, C., and Weinberg, C.R. (2006).
A method for using incomplete triads to test maternally medi-
ated genetic effects and parent-of-origin effects in relation to a
quantitative trait. Am. J. Epidemiol. 163, 255–261.
10. Wheeler, E., and Cordell, H.J. (2007). Quantitative trait associ-
ation in parent offspring trios: Extension of case/pseudocon-
trol method and comparison of prospective and retrospective
approaches. Genet. Epidemiol. 31, 813–833.
11. Belonogova, N.M., Axenovich, T.I., and Aulchenko, Y.S.
(2010). A powerful genome-wide feasible approach to detect
parent-of-origin effects in studies of quantitative traits. Eur.
J. Hum. Genet. 18, 379–384.
12. Hoggart, C.J., Venturini, G., Mangino, M., Gomez, F., Ascari,
G., Zhao, J.H., Teumer, A., Winkler, T.W., T�sernikova, N.,
Luan, J., et al.; Generation Scotland Consortium; LifeLines
Cohort study; GIANT Consortium (2014). Novel approach
identifies SNPs in SLC2A10 and KCNK9 with evidence for
parent-of-origin effect on body mass index. PLoS Genet. 10,
e1004508.
13. Connolly, S., and Heron, E.A. (2015). Review of statistical
methodologies for the detection of parent-of-origin effects
in family trio genome-wide association data with binary dis-
ease traits. Brief. Bioinform. 16, 429–448.
14. Purcell, S., Neale, B., Todd-Brown, K., Thomas, L., Ferreira,
M.A., Bender, D., Maller, J., Sklar, P., de Bakker, P.I., Daly,
M.J., and Sham, P.C. (2007). PLINK: a tool set for whole-
genome association and population-based linkage analyses.
Am. J. Hum. Genet. 81, 559–575.
15. Spielman, R.S., McGinnis, R.E., and Ewens, W.J. (1993). Trans-
mission test for linkage disequilibrium: the insulin gene re-
gion and insulin-dependent diabetes mellitus (IDDM). Am.
J. Hum. Genet. 52, 506–516.
16. Weinberg, C.R. (1999). Methods for detection of parent-of-
origin effects in genetic studies of case-parents triads. Am. J.
Hum. Genet. 65, 229–235.
17. Weinberg, C.R., Wilcox, A.J., and Lie, R.T. (1998). A log-linear
approach to case-parent-triad data: assessing effects of disease
genes that act either directly or through maternal effects and
that may be subject to parental imprinting. Am. J. Hum.
Genet. 62, 969–978.
18. Zhou, J.Y., Hu, Y.Q., and Fung, W.K. (2007). A simple method
for detection of imprinting effects based on case-parents trios.
Heredity (Edinb) 98, 85–91.
Journal of Human Genetics 97, 419–434, September 3, 2015 433

19. Cordell, H.J., Barratt, B.J., and Clayton, D.G. (2004). Case/
pseudocontrol analysis in genetic association studies:
A unified framework for detection of genotype and haplo-
type associations, gene-gene and gene-environment interac-
tions, and parent-of-origin effects. Genet. Epidemiol. 26,
167–185.
20. Ainsworth, H.F., Unwin, J., Jamison, D.L., and Cordell, H.J.
(2011). Investigation of maternal effects, maternal-fetal
interactions and parent-of-origin effects (imprinting),
using mothers and their offspring. Genet. Epidemiol. 35,
19–45.
21. Howey, R., and Cordell, H.J. (2012). PREMIM and EMIM:
tools for estimation of maternal, imprinting and interaction
effects using multinomial modelling. BMC Bioinformatics
13, 149.
22. Becker, T., Baur, M.P., and Knapp, M. (2006). Detection of
parent-of-origin effects in nuclear families using haplotype
analysis. Hum. Hered. 62, 64–76.
23. Zhou, J.Y., Lin, S., Fung, W.K., and Hu, Y.Q. (2009). Detection
of parent-of-origin effects in complete and incomplete nuclear
families with multiple affected children using multiple tightly
linked markers. Hum. Hered. 67, 116–127.
24. Gjessing, H.K., and Lie, R.T. (2006). Case-parent triads: esti-
mating single- and double-dose effects of fetal and maternal
disease gene haplotypes. Ann. Hum. Genet. 70, 382–396.
25. Shi, M., Umbach, D.M., and Weinberg, C.R. (2009). Using
case-parent triads to estimate relative risks associated with a
candidate haplotype. Ann. Hum. Genet. 73, 346–359.
26. Zhang, K., Sun, F., and Zhao, H. (2005). HAPLORE: a program
for haplotype reconstruction in general pedigrees without
recombination. Bioinformatics 21, 90–103.
27. Dudbridge, F. (2008). Likelihood-based association analysis for
nuclear families and unrelated subjects withmissing genotype
data. Hum. Hered. 66, 87–98.
28. Myers, S., Bottolo, L., Freeman, C., McVean, G., and Donnelly,
P. (2005). A fine-scale map of recombination rates and hot-
spots across the human genome. Science 310, 321–324.
29. Frazer, K.A., Ballinger, D.G., Cox, D.R., Hinds, D.A., Stuve,
L.L., Gibbs, R.A., Belmont, J.W., Boudreau, A., Hardenbol, P.,
434 The American Journal of Human Genetics 97, 419–434, Septemb
Leal, S.M., et al.; International HapMap Consortium (2007).
A second generation human haplotype map of over 3.1
million SNPs. Nature 449, 851–861.
30. Marchini, J., and Howie, B. (2010). Genotype imputation for
genome-wide association studies.Nat. Rev.Genet.11, 499–511.
31. Delaneau, O., Marchini, J., and Zagury, J.F. (2012). A linear
complexity phasing method for thousands of genomes. Nat.
Methods 9, 179–181.
32. Delaneau, O., Zagury, J.F., and Marchini, J. (2013). Improved
whole-chromosome phasing for disease and population ge-
netic studies. Nat. Methods 10, 5–6.
33. Leal, S.M., Yan, K., and Muller-Myhsok, B. (2005). SimPed: a
simulation program to generate haplotype and genotype
data for pedigree structures. Hum. Hered. 60, 119–122.
34. Anderson, C.A., Pettersson, F.H., Clarke, G.M., Cardon, L.R.,
Morris, A.P., and Zondervan, K.T. (2010). Data quality control
in genetic case-control association studies. Nat. Protoc. 5,
1564–1573.
35. Cordell, H.J., Topf, A., Mamasoula, C., Postma, A.V., Bentham,
J., Zelenika, D., Heath, S., Blue, G., Cosgrove, C., Granados
Riveron, J., et al. (2013). Genome-wide association study iden-
tifies loci on 12q24 and 13q32 associated with tetralogy of Fal-
lot. Hum. Mol. Genet. 22, 1473–1481.
36. Devlin, B., and Roeder, K. (1999). Genomic control for associ-
ation studies. Biometrics 55, 997–1004.
37. Morison, I.M., Ramsay, J.P., and Spencer, H.G. (2005). A
census of mammalian imprinting. Trends Genet. 21, 457–465.
38. Glaser, R.L., Ramsay, J.P., and Morison, I.M. (2006). The im-
printed gene and parent-of-origin effect database now in-
cludes parental origin of de novo mutations. Nucleic Acids
Res. 34, D29–D31.
39. Kotzot, D. (2001). Comparative analysis of isodisomic and
heterodisomic segments in cases with maternal uniparental
disomy 14 suggests more than one imprinted region. Clin.
Genet. 60, 226–231.
40. Sutton, V.R., and Shaffer, L.G. (2000). Search for imprinted re-
gions on chromosome 14: comparison of maternal and
paternal UPD cases with cases of chromosome 14 deletion.
Am. J. Med. Genet. 93, 381–387.
er 3, 2015


