
1
International Major Infrastructure Projects Benchmarking Review
Final Report
30 April 2021

2
Glossary
BCG Boston Consulting Group
D&C Design and Construct contract
OPV Office of Projects Victoria
PPP Public private partnership
MFP Multi Factor Productivity
OECD Organisation for Economic Co-operation and Development
GlobalData CIC GlobalData Construction Intelligence Centre
CPI Consumer Price Index
GDP Gross Domestic Product
LNG Liquid Natural Gas
EIS Environmental Impact Statement
MRT Mass Rapid Transport
GFC Global Financial Crisis
IP Intellectual Property
DoT Department of Transport

3
Table of contents
1 Executive summary .................................................................................................................. 6
2 Objectives of this review .......................................................................................................... 8
3 Scope and methodology ........................................................................................................... 9
3.1 Scope of the review.......................................................................................................... 9
3.2 Estimated delivery and initial cost ............................................................................... 11
3.3 Actual completion dates and costs ............................................................................... 12
3.4 Definition of schedule overrun and underrun ............................................................. 12
3.5 Definition of cost overrun and underrun ..................................................................... 12
3.6 Definition of contract models ....................................................................................... 12
3.7 Currency, exchange rates, and inflation ...................................................................... 13
4 Context for the infrastructure sector ..................................................................................... 14
4.1 Delivering infrastructure on-time and on-budget is a global challenge ..................... 14
4.2 Key trends in the infrastructure sector have exacerbated the degree of challenge in adhering to cost and schedule estimates ...................................................................... 16
4.3 Cost and schedule overruns are not unique to the public sector ............................... 18
4.4 The public sector faces additional unique challenges ................................................. 18
4.5 One-off delays from COVID-19, but ongoing impact likely to be small ..................... 20
5 Benchmarking on cost and schedule adherence .................................................................. 22
5.1 Benchmarks for selected countries ............................................................................... 22
5.2 Benchmarks by project portfolio .................................................................................. 25
5.3 Benchmarks by project type ......................................................................................... 26
5.4 Benchmarks by contract model .................................................................................... 27
5.5 Benchmarks by project size ........................................................................................... 29
6 Case studies ............................................................................................................................. 31
6.1 Overview ........................................................................................................................ 31
6.2 Methodology .................................................................................................................. 31
6.3 Case study selection ....................................................................................................... 31
6.4 Case studies of projects with poor adherence ............................................................. 32
6.4.1 Difficult early estimations ................................................................................... 33
6.4.2 Unknown subsurface issues ................................................................................ 33
6.4.3 Management of change through claims and disputes ....................................... 34
6.4.4 Scale and Complexity .......................................................................................... 34
6.4.5 Required design and scope variations ................................................................ 34
6.4.6 Compounding Costs of delay .............................................................................. 35
6.5 Case studies of good adherence to schedule and budget ............................................ 35
6.5.1 Upfront investment in de-risking projects .......................................................... 36
6.5.2 Alignment of procurement and contract structures .......................................... 36
6.5.3 Clear legitimacy and support .............................................................................. 37

4
6.5.4 Adoption of new technology and tools............................................................... 37
7 Conclusions ............................................................................................................................. 38
Appendix 1: List of all in-scope projects ...................................................................................... 39
Appendix 2: Schedule and cost adherence correlation over time ............................................. 46
Appendix 3: Case studies considered in this review ................................................................... 47

5
Note to the reader
This benchmarking report was prepared over March and April 2021 by The Boston Consulting Group (BCG) for the Office of Projects Victoria (OPV) as part of our engagement to review major international infrastructure projects.
It is understood by BCG that this review is part of a broader program of work that OPV is embarking on, to establish infrastructure project benchmarks in Victoria. The purpose of this report is to provide a set of global benchmarks for infrastructure projects which can be used in these future studies.
The materials contained in this report were developed for the sole use of the Victorian Government and for the limited purposes described in the proposal, and are subject to BCG's Standard Terms and Conditions, or such other agreement as may have been previously executed by BCG and the Victorian Government.
The report draws on proprietary datasets, desktop research on publicly available sources, and interviews with experts across the globe. It is intended to provide a reference point on the delivery of major public infrastructure projects globally, based on typical experiences, to help policy-makers and industry alike. It is not intended to provide determinative indicators of cost and schedule overruns, or to provide causal analysis of underlying drivers of cost and schedule overruns.
Findings in the report are based on a time-bound program of research. While efforts have been undertaken to exclude unreliable datapoints from the dataset on which this report is based, care should be exercised in interpreting and applying the benchmarks. The benchmarks are a reflection only of the projects included in the sample, and should not be extrapolated so as to suggest these results are indicative of broader infrastructure project delivery outcomes achieved by a particular country, or industry sub-sector.
BCG shall not be responsible for updating these materials after the date of this report notwithstanding that such information may become outdated or inaccurate.
BCG retains ownership of, and all rights to the materials. These materials serve only as the focus for discussions and may not be relied on as a stand-alone document. Further, third-parties may not, and it is unreasonable for any third-party to, rely on these materials for any purpose whatsoever. To the fullest extent permitted by law (and except to the extent otherwise agreed and signed in writing by BCG), BCG shall have no liability whatsoever to any third-party, and any third-party hereby waives any rights and claims it may have at any time against BCG with regards to these services, these materials or other BCG developed materials, including the accuracy and completeness thereof. Receipt and review of this report shall be deemed agreement with and consideration for the foregoing.
A note on COVID-19
The situation surrounding COVID-19 is dynamic and rapidly evolving, on a daily basis. Although we have taken care in producing this report, it by necessity reflects a general view at a particular point in time, and may not represent the specific experience in a particular location.
This report is not intended to: (i) constitute, or be a substitute for medical, legal or safety advice; nor (ii) be seen as a formal endorsement or recommendation of a particular response. As such you are advised to make your own continued assessments as to the appropriate course of action to take, using this report as general guidance only. Please carefully consider local laws and guidance in your area, particularly the most recent advice issued by your local (and national) health authorities, before making any decision.

6
1 Executive summary
It is well known that cost and schedule overruns occur frequently in major infrastructure projects, across geographies and project types. Almost all countries with significant infrastructure programs share this experience.
The prevalence and extent of these overruns is underpinned by a range of structural challenges in the infrastructure sector – many of which do not occur in other areas of the global economy. Large-scale infrastructure projects often take place in complex urban and geological environments, and are typically expected to deliver outcomes for a wide range of stakeholders with different (and sometimes competing) objectives and priorities.
Many of these structural challenges are increasing in intensity over time. Environmental standards and expectations on government have increased in most jurisdictions over the past decade. Community expectations are higher, with infrastructure projects expected to meet a growing array of amenity, liveability, and sustainability objectives.
Buyers of infrastructure, in particular governments, must manage and coordinate a wide range of stakeholders and businesses, and deal with numerous ongoing and emerging issues such as population growth, energy affordability, sustainability, technological innovation and safety and environmental regulations.
Construction productivity has also declined by as much as 20% over recent decades in some advanced-economy markets.1 While safety on infrastructure projects has improved over past decades, other industries, such as manufacturing have managed to increase both safety and productivity over the same time period.
While many of these trends are overall positive and well-founded, they have also increased the cost of infrastructure, and extended the degree of challenge in delivering projects on schedule and estimated cost.
Key findings
This report sets out a series of benchmarks on cost and schedule adherence. It focuses on 379 large transport and social infrastructure projects across 14 OECD nations globally, providing a reference point on the experience of governments around the world in delivering these large-scale investments.2 A detailed methodology is set out in Chapter 3.
The key findings on the in-scope projects include:
1. Approximately a third of major transport infrastructure projects globally exceeded their estimated schedule. The average overrun among these projects was 35%, and the average overrun across all transport projects was 12%.3
2. Over half (53%) of major transport infrastructure projects exceeded their estimated cost. The average overrun among these projects was 59%, and the average overrun across all transport projects was 28%.4
3. Approximately 30% of major social infrastructure projects globally exceeded their estimated schedule. The average overrun among these projects was 31%, and the average overrun across all social infrastructure projects was 9% – a similar result to the schedule adherence for transport infrastructure.
1 US Department of Labour data shows a decrease in construction multifactor productivity of 21% from 1987 to 2020. The UK Office for National Statistics also lists a decrease in construction multifactor productivity of 23% for this same period.
2 The 14 countries are set out in Chapter 3. Australia is not included, on the basis that the objective for this report was to establish a series of global benchmarks which can inform future work by OPV.
3 A schedule overrun is defined as more than six months after initial estimated completion date. Where completion was estimated simply as being in a particular calendar year, completion in any subsequent year is treated as a schedule overrun. See Chapter 3 for more detail.
4 A cost overrun is defined as more than 5% over the initial estimated total cost (total out turned cost). See Chapter 3 for more detail.

7
4. Approximately 43% of major social infrastructure projects exceeded their estimated cost. The average overrun among these projects was 41%, and the average overrun across all social infrastructure projects was 16%. This represents a slightly higher level of adherence to cost estimates compared to transport infrastructure.
5. The extent of infrastructure cost and schedule overruns globally is linked to the complexity of the project undertaken, with tunnel projects showing the highest overruns (e.g. 82% of rail tunnel projects overrunning cost, with an average overrun of 61%), and very large projects over $5 billion showing the largest overruns on a relative as well as absolute basis (77% average overruns for transport projects over $5 billion compared to 26% for projects between $500 million and $1 billion).
6. There was no substantial difference between the performance of sampled major infrastructure projects under PPP-type or D&C-type contracts. Construct-only-type contracts showed slightly stronger adherence to estimated costs. 33% of these Construct-only major transport infrastructure projects exceeded their estimated cost, compared with 51% across the total transport sample. However, this likely reflects that Construct-only contracts are typically used for smaller or less complex programs of work.
Drivers of schedule and cost overruns
A subset of these projects were selected for more detailed case studies, which show a series of common themes and drivers of schedule and cost overruns. These include:
• the difficulty of developing accurate early-stage cost “point estimates” – particularly for very large programs of work
• a prevailing view that subsurface risks, in particular ground conditions and utilities, are a major source of uncertainty leading to cost issues
• management of change through claims and disputes
• governance and management systems that are not designed for the increased complexity of very large projects in particular
• required design and scope variations (especially late stage changes), and
• the costs flowing from delays – which allow greater escalation, overheads, and outlays for schedule acceleration.
These case studies also highlighted a number of common themes and enablers that can improve cost and schedule adherence. These include:
• upfront investment in de-risking the project, particularly through early contractor engagement
• alignment of procurement approaches and contract models with the specific pressures and risks in each project
• clear legitimacy and support from government sponsors and community stakeholders
• adoption of new technology, tools, and innovation, bringing a focus on productivity improvement and efficiency throughout the project
• deep experience in relevant agencies in similar projects and programs
• setting expectations on cost and schedule which account for the degree of uncertainty.
These themes are discussed in more detail in Chapter 6 and Appendix 3.
While it is beyond the scope of this report to provide detailed recommendations, its findings may provide a starting point for further consideration of options for governments to evolve their approach to delivering large-scale transport and social infrastructure and meet the increasing challenges within this vital sector of the economy.

8
2 Objectives of this review
The purpose of this review was to develop benchmarks on cost and time, reflecting the experience of governments around the world in delivering large-scale transport and social infrastructure projects.
In particular, there were two broad points of interest where benchmarks were to be developed:
1. Adherence of major infrastructure projects to the schedule at the point of public commitment
2. Adherence of major infrastructure projects to the cost estimate at the point of public commitment
When reviewing large-scale infrastructure projects, it is critical to note that each one is unique and faces its own pressures. The type of project undertaken, its overarching purpose, and difficulties posed by location, geology, resources and public needs and expectations can have significant impact on its outcomes.
This report focusses specifically on the benchmarking data of individual project outcomes, to provide an indication of trends and themes. It is not intended to provide definitive conclusions on the root causes of schedule delays or cost overruns.
In order to provide context for these observations, this report includes a series of selected case studies from major infrastructure projects, notable for their adherence to, or deviation from, committed cost and schedule estimates. These case studies provide examples of typical drivers of cost and schedule overruns in the infrastructure sector, as well as potential enablers of positive cost and schedule adherence.
The review team selected a set of 14 countries with many broadly comparable features. They are advanced economies globally, with significant infrastructure programs underway.
The report is structured into seven chapters:
• Chapter 1 contains an executive summary of the key findings
• Chapters 2 and 3 provide an overview of the objectives, scope, and methodology underpinning this report
• Chapter 4 gives an overview of the current context for the infrastructure sector, and the key trends and issues which typically generate cost and schedule pressures which is the focal point of this report
• Chapter 5 contains the benchmarking analysis which is the key focus of our review
• Chapter 6 discusses a series of case studies containing project-level examples of typical pressures and practices relevant to cost and schedule adherence
• Chapter 7 provides a set of conclusions, and observations for consideration.

9
3 Scope and methodology
3.1 Scope of the review
This review seeks to understand the track record of global infrastructure projects in adhering to proposed delivery cost and timeline schedules. Its findings are based on a dataset of major infrastructure projects. Specifically, the review examines road and rail transport projects which cost more than US$500 million, and certain classes of social infrastructure projects which cost more than US$250 million, namely correctional facilities, hospitals, and schools.
Fourteen countries were selected to provide a particular focus to the review: Canada, France, Germany, Greece, Ireland, Italy, Brazil, Japan, New Zealand, Singapore, South Korea, Spain, the UK and the USA. They represent a mix of geographies, with a range of economy sizes, ranging from US$210 billion (Greece), to US$23,000 billion (USA). They are all OECD nations, and share many comparable features. They are advanced economies globally, and have significant infrastructure programs underway.
Our team used the database of GlobalData CIC (Construction Intelligence Centre), a leading provider of global company operational data and strategic analysis, to source potential infrastructure projects that were within the parameters outlined above. Once we had narrowed down our in-focus projects, we then undertook more than 500 hours of research, using publicly available sources such as government documents, industry reports, media releases and press searches.
To develop the case studies of individual projects, we interviewed experts who have direct personal experience in these projects. Case studies are also informed by our desktop research of publicly available sources.
At the time of this review, of ~5,311 projects that were feasibly within scope, 2,152 were still in design phase while 1,655 were in construction. This narrowed down the list of completed projects to 1,504. Of these, the review team focused on the 566 projects that were carried out within our 14 focus countries, listed above. After detailed research, 187 of these projects were excluded on the basis of incomplete or insufficient published data being available to support benchmarking. The benchmarks in this report are therefore based on a sample of 379 completed projects across the 14 focus countries (see Exhibit 1).
The benchmarking contained in Chapter 5 analyses these 379 projects across different dimensions, including project type and size. These “cuts” of the total sample will necessarily be smaller than the total 379 projects, due to the differential sample size of different dimensions (e.g. ~170 transport projects and ~210 infrastructure projects), and data availability across some dimensions. The total sample size for each dimension is noted in the footnotes.
Exhibit 1: Benchmarking based on 379 relevant, completed projects

10
Exhibit 2: Fourteen countries chosen as a focus for this review
The in-scope projects for this review provide a balance across modes of transport, as set out in Exhibit 3 below.
Exhibit 3: In-scope projects represent a balance of different project portfolios
The vast majority of in-scope projects under consideration commenced before 2017, largely due to our selection criterion that construction must be completed. Exhibit 4 shows the number of in-scope projects by year of completion and by size of project.
As the exhibit reveals, the sample shows a skew toward larger projects over time, consistent with the broader growth of the global infrastructure pipeline over the past decade, and the global trend toward larger, more complex projects.

11
Exhibit 4A: Projects included in benchmarking sample, by completion date and size
Exhibit 4B: Projects included in benchmarking sample, by project length (from announcement date to completion), over time
3.2 Estimated delivery and initial cost
The report determines each infrastructure project’s estimated delivery and initial cost, based on the earliest public commitment to the project. We have deliberately focused on the public announcement of the schedule and cost because:
1. These are the figures to which the public typically hold governments to account.
2. After public commitment, there is usually a high degree of lock-in to a project (Terrill, et al., 2016).5 After this point projects are rarely cancelled even if cost and schedule forecasts increase substantially.
Note that when comparing this report’s benchmarks across jurisdictions, initial costs may not be set at the same point in the project lifecycle, as government guidelines and requirements for disclosures at time of announcement differ.
5 Terrill, M. and Danks, L., (2016) “Cost overruns in transport infrastructure” Australasian Transport Research Forum 2016 Proceedings

12
3.3 Actual completion dates and costs
After verifying each project’s estimated delivery and initial cost, we determined each project’s actual completion dates and final cost of delivery. This was defined as the point in which the project’s construction and commissioning was complete, and the asset was opened. We obtained this information from the GlobalData CIC database, triangulated with publicly available data sources, and where required, supplemented by expert interviews.
3.4 Definition of schedule overrun and underrun
Recognising that project dates are often announced in broad terms, and that minor variations in completion dates may not be widely regarded as an overrun, this report has defined schedule overrun as more than six months over the announced completion date, and underrun as more than 6 months earlier than the announced completion date.
Where a project was simply announced to be completed in a particular year, for example “in 2020”, we have adopted an approach where projects delivered at any point in that year are regarded as “on schedule”. A delivery date in the earlier or subsequent calendar years would be regarded as a schedule underrun or overrun. This was practically effected by treating the estimated completion date for whole-year targets, as 30 June of that year (e.g. 30 June 2020) and applying the 6 months “on schedule” buffer as described above.
3.5 Definition of cost overrun and underrun
Minor variations in project cost may not be widely regarded as an overrun or underrun. With this in mind, the report has adopted a definition of cost overrun as being more that 5% above the estimated cost at the date of public commitment to delivering the project, and cost underrun as being more than 5% below that same estimated cost. This range reflects the accuracy of a review of publicly available sources and is more lenient than most academic literature, which typically does not consider a range.
Cost overruns have been calculated based on difference between final construction costs and estimated construction costs as at the time of announcement, divided by the estimated construction costs as at time of announcement.
3.6 Definition of contract models
This report adopts five broad contract model classifications: Construct-only, Design and Construct (D&C), Public Private Partnership (PPP), Collaborative, and other. While major infrastructure projects deploy a much greater diversity of delivery methods, we have confined the categories for ease of analysis. Each category captures an umbrella of associated contract models, which may fall outside of the strict definition of that contract classification applied by industry. The contract classifications adopted for the purposes of this review are as follows:
• Construct-only: Projects where the design and construction of the project are provided by separate parties, with the construction contractor typically procured through a fixed-price tender process. This includes “design-bid-build” contracts.
• D&C: Projects with an integrated design and build contractor, but without any project financing, ownership, or long-term concession. This includes “design and build” contracts.
• PPP: All projects that include primary financing by private companies for public sector projects, and typically involve greater assumption of risk and responsibility by the contractor. This includes “project finance initiatives” and “design build finance maintain operate” contracts.
• Collaborative: Non-fixed price contracts where parties adopt a performance-based remuneration regime, with continuous participation from contractors, and greater shared assumption of risk by all parties. This includes “integrated project delivery”,

13
“alliance” delivery methods, cost-plus reimbursable approaches, and some forms of target-cost contracting.
• Other: All other contract types not captured above.
3.7 Currency, exchange rates, and inflation
We assessed project cost overruns, and actual project costs in the local currency of each project’s jurisdiction. We then converted the cost into US dollars, using the exchange rate as at each project’s completion date.
For cost overruns, we have assumed both project cost estimates and actuals to be in nominal terms, unadjusted for inflation. This assumes that initial cost estimates include adjustments for inflation, as is ordinary industry practice. As cost overruns are represented as a percentage of initial estimated cost, we did not apply inflationary adjustment of estimated and actual project costs as it would have almost no effect on the relative size of cost overruns.
However, for anywhere in the report where absolute figures are reported (e.g. for benchmarking by project size), we have adjusted for inflation. Here, project costs are adjusted by Australian CPI, based on the date of construction completion, and typically shown in AUD.

14
4 Context for the infrastructure sector
4.1 Delivering infrastructure on-time and on-budget is a global challenge
It is well known and expected that large infrastructure projects will experience challenges adhering to cost and schedule estimations.6 Almost all countries with significant infrastructure programs share this expectation.
There is extensive academic literature on infrastructure cost adherence. The literature reveals a common picture of near-ubiquitous overruns for both cost and schedule but is highly varied on the extent and source of these overruns (see Exhibit 6). Variations are at least partially driven by choice of baseline values, project specifications and jurisdiction, but a degree of variation appears to be inherent.
Globally, Flyvbjerg, et al., 2002 measured that 86% of large transport infrastructure projects
experience cost or schedule overruns. 7 Updates from Flyvbjerg in 2016 used a dataset of
1603 projects and estimated an average increase in cost from announcement to completion
(average cost overrun) of 39% across all infrastructure projects, 40% in rail projects and 24%
in road projects.8 This appears to be consistent with the Asia region, where Ashan &
Gunawan, et al., 2010, found an average cost overrun of 19% and schedule overrun of 33%.9
Australia has multiple, highly regarded academics investigating the area. Their studies
indicate that Australian infrastructure projects are generally representative of global trends.
Selected literature has shown a range in transport infrastructure from the 12.22% average
cost overrun determined by Love, et al., 2013 to the 52% measured by the Grattan Institute in
a dataset of projects over $AUD100 million in value.10 This is similar to the cost overrun
range of 24-52% measured by Duffield, et al., 2008.11
Investigations of non-transport infrastructure are less frequent. However, Duffield, et al. 2007
determined a range of 12-35% for cost overruns in non-transport infrastructure projects.12
Limited, well-referenced coverage of schedule overruns exists for Australia, but Love, et al.,
2012 found an overall average schedule overrun of 9% for transport projects.13
Substantial variation is expected in these literature values, as they take varied approaches to
baselining the estimated value for projects, and rely on datasets with differing infrastructure
project sizes and groupings. For example, the average project value at completion of this
report’s data set is ~AU$1.6 billion and projects have a minimum value of $US250 million,
compared to the Terrill, et al., 2016 data set, which considered projects with a value over
$AUD20 million.
6 Terrill, M. and Danks, L. (2016) Cost overruns in transport infrastructure
7 Flyvbjerg, Holm and Buhl. (2002) “Underestimating Costs in Public Works Projects” Journal of the American Planning Association, Vol. 68, No. 3, Summer. American Planning Association, Chicago, IL 8 Flyvbjerg, Bent. (2016) "The Fallacy of Beneficial Ignorance: A Test of Hirschman's Hiding Hand," World Development, vol. 84, May, pp. 176–189. 9 Ashan, K., & Gunawan, I. (2010) “Analysis of cost and schedule performance of international development projects”
International Journal of Project Management, 28, 68-78. 10 Love, P., Wang, X., Sing, C.-P. and Tiong, R. (2013) “Determining the Probability of Project Cost Overruns” In: Journal of Construction Engineering and Management 139.3, pp. 321–330. 11 Duffield, C., Raisbeck, P. and Xu, M. (2008) “Report on the performance of PPP projects in Australia when compared with a representative sample of traditionally procured infrastructure projects” Report. University of Melbourne. 12 Duffield, C. (2007). “Performance of PPPs and traditional procurement in Australia” Sydney: Infrastructure Partnerships
Australia. 13 Love, P., Sing, C.-P., Wang, X., Irani, Z. and Thwala, D. W. (2012) “Overruns in transportation infrastructure projects” In: Structure and Infrastructure Engineering 10.2, pp. 141–159.

15
Exhibit 6: Academic literature consistently reports cost and schedule overruns for a large proportion of projects, but with variance on the extent of average overrun
Despite variation in specific overrun measurements, there is widespread agreement in the
academic literature that there has been little change in average level of overruns over
time.(14, 15) Flyvbjerg, et al., 2009 noted that for their study “overrun is constant for the 70-year
period covered… cost estimates have not improved over time”16 and Shrestha, et al., 2013 found
their “study could not find any relationship between cost and schedule overruns with project types
and project completion year”.17 The reasons for the pervasiveness of overruns is not covered in
detail, but primary influences of optimism bias, strategic misrepresentation, and
management expectation that large projects will inevitably ‘break’.
Analysis of cost overruns for the projects in this benchmarking study align with the literature
findings. As set out in Exhibit 7, there appears to be no clear change over time in the
proportion of major transport infrastructure projects overrunning cost. This may reflect that
although there have been incremental improvements against select drivers of cost overruns –
such as advancements against technical estimation issues – there have been countervailing
pervasive unresolved issues, and increasing areas of challenge. Pervasive issues include those
noted in literature, such as optimism bias and strategic bias, while increasing areas of
challenges are explored in Section 4.2.
14 Terrill, et al., 2016, Adams, et al., 2014, Flyvbjerg, et al., 2009, and Schrestha, et al., 2013
15 Adams, A., Josephson, P. & Lindahl, G. (2014) “Implications of cost overruns and time delays on major public construction
projects” Proceedings of the 19th International Symposium on the Advancement of Construction Management and Real Estate.
16 Flyvbjerg, Bent. (2009) “Survival of the unfittest: why the worst infrastructure gets built—and what we can do about it” Oxford Review of Economic Policy Vol. 25, No. 3, INFRASTRUCTURE, UTILITIES, AND REGULATION (AUTUMN 2009), pp. 344-367.
17 Shrestha, Burns & Shields. (2013) “Magnitude of Construction Cost and Schedule Overruns in Public Work Projects” Journal of Construction Engineering. 2013. 1-9.

16
Exhibit 7: Cost overruns over time (2005-2021) for transport projects in the benchmark sample
4.2 Key trends in the infrastructure sector have exacerbated the degree of challenge in adhering to cost and schedule estimates
In Australia and overseas, infrastructure projects face a range of structural challenges – factors which typically do not impact other sectors to the same extent. Projects take place over a wide range of environmental conditions, and must deliver outcomes for communities and users with often competing needs and demands. Owners must manage and coordinate a wide range of stakeholders and businesses, and deal with a wide range of ongoing and emerging issues such as population growth, energy affordability, sustainability, technological innovation, network integration, and safety and environmental regulations.
The current infrastructure market is heated in Australia and globally, with increasing demand, and capacity constraints being experienced.18 Infrastructure Australia Chair, Julieanne Alroe, stated in 2019 that current sector activity is at historic levels and likely to continue for at least the next 15 years.19 BIS Oxford Economics research indicates that transport-related engineering construction work in Australia is already at or near the record levels reached during the peak of the mining boom, and is set for a substantial further increase in the coming 5 years (Exhibit 8). In the US, the recent $2 Trillion infrastructure package passed by the US Federal Government comes at a time when infrastructure investment is already at a high.20 This high demand is likely to lead to further capacity constraints in many jurisdictions, noted in Australia as a cause of pressure on project outcomes including cost and schedule adherence.18
18 Australian Transport Infrastructure Market Review 2019, BCG
19 Infrastructure Australia Media Release, 13/08/2019, “Record infrastructure spend the new normal, 2019 Australian Infrastructure Audit warns”
20 The White House, 31/03/2021, “FACT SHEET: The American Jobs Plan”

17
Exhibit 8: Expenditure on transport infrastructure is at a high, and set to increase
It is currently not uncommon for a project to experience cost escalation rates up to 4-6% per annum. This is well in excess of the average CPI increase for the last 10 years at 1.92%.21 This compounds significantly over time, especially for larger, longer projects with significant time lags and can significantly contribute to total outturn cost of projects.
These cost pressures are not unique to Australia, but are a long-term, global trend. The pervasive overruns in infrastructure have changed little over a long period of time, and have likely been impacted by the construction industry’s productivity challenges. In the last ~30 years, multifactor productivity (MFP) in the US economy has generally increased, with sectors such as mining increasing by well over 50%. Over the same time period, construction productivity has declined by 21% (see Exhibit 9). In Australia, over the last 15 years, Construction MFP has experienced a net decline of 8.5%, which is ~16% below market-wide performance. While a large portion of this productivity underperformance can be attributed to the industry’s considerable safety improvements, other industries, such as manufacturing, have managed to achieve both higher safety standards and productivity improvement over the same period.
Exhibit 9: Historically, US construction productivity lags other sectors
21 ABS

18
Finally, in many jurisdictions, contracts and procurement processes have become increasingly complex. A number of the case studies explored through this review provide examples of how this can contribute to the risk of adversarial engagement and increase issues with risk transfer during delivery. This can contribute to project delays, escalating cost and other significant delivery challenges.
4.3 Cost and schedule overruns are not unique to the public sector
The private sector is far from immune to cost and schedule overruns on major capital projects. While transport and social infrastructure projects of the scale in-scope for this review are typically only commissioned by government, similarly large capital projects are often commissioned and delivered by private owners in the energy and resources sectors. Exhibit 10 sets out three such Australian examples: Gorgon LNG (AU$54 billion), Curtis Island LNG (AU$20.4 billion), and Raventhorpe Mine & Yabulu Refinery (AU$2.8 billion). All three projects encountered substantial delivery challenges, resulting in cost and schedule overruns.
The objectives and technical challenges of these projects differ from the public sector projects considered in this report’s dataset, but the drivers for cost and schedule overruns were very similar. Both the projects in this exhibit, and the public sector projects investigated as case studies in Chapter 6, experienced influences on cost and schedule from with long delays, required variations to scope, and complex locations and interfaces.
Exhibit 10: Australian examples of overruns in large private sector capital projects
4.4 The public sector faces additional unique challenges
In addition to the challenges and pressures experienced by large-scale capital projects in the private sector, governments across the globe face a number of unique challenges when delivering large-scale transport and social infrastructure.
• Government projects are often delivered in densely populated areas – A seemingly straightforward project such as road resurfacing involves complex planning and management of multiple stakeholders such as council, community services and the general public; obtaining permit applications; rerouting and managing traffic and mitigating potential disruption to critical services.

19
• The public has high expectations for government to meet increasingly stringent standards and regulations – Globally, there is increasing pressure for large-scale infrastructure programs to consider and meet higher environmental and cultural protection, and accessibility standards during both planning and execution stages. While this is common to both public and private sector infrastructure, the expectations on government are arguably higher – with an obligation to be best-practice in their management of these impacts.
Australia’s regulatory and approval processes illustrate increases in these expectations. The Productivity Commission noted in their 2014 Public Infrastructure Inquiry Report that the scope and requirements of such regulations have increased over time – and that there is scope to rationalise and improve.
The length of Environmental Impact Statements (EIS) shows a clear progression of environmental approval requirements. In 1999, the Scoresby Transport Corridor (East Link) produced a 215 page EIS, compared to the 2019 North East Link which produced a ~6,300 page EIS22. The same trend can be observed in NSW, where the 2015 WestConnex EIS was ~7,350 pages, compared to the Pacific Highway upgrade EIS documents in 2007 and 2012, which had just 456 and ~1,800 pages respectively.23
• Community expectations of the overall benefits of public sector projects are typically higher – There are significant, increasing expectations of governments to use large-scale infrastructure projects to meet broader outcomes outside the direct function of the proposed asset. This could include additional functions such as community arts and green spaces, and active transport, or broader outcomes such as providing employment and training opportunities, harnessing the latest innovations and providing an opportunity for more local content.
• Public sector projects are typically exposed to a longer period of cost and schedule risk – As set out in Exhibit 11 below, the public sector typically announces project cost and schedule estimates earlier in the major project lifecycle compared to private sector equivalents. Standard government budget and financial reporting practices typically require an estimate of cost to be booked to the government budget at this early stage, and citizens expect that an initial announcement will come with concrete estimates of time and cost. As a result, expectations are anchored early to an estimated cost and the likelihood of the project proceeding. These early estimates are necessarily developed on the basis of less detailed planning, design, and engineering work, and exposed to a longer period of risk. Private sector projects are controlled through different budgeting mechanisms, with less expectation of early cost estimates and more ongoing testing of the viability of the investment case. The effect is that commitment for private sector projects occur at a later stage when there is a greater level of certainty over design, standards, approvals and cost. Value is often not known at the tender stage and project cost and schedule forecasts are often only announced after construction contracts have been signed. In private sector systems, it is also typically easier to cancel projects at later stages in the lifecycle.
• These public sector challenges are increasing over time – Projects are becoming larger, longer, and more complex, and community engagement in projects is increasing with access and awareness. Brownfield projects in dense urban areas are now the norm in many advanced economies, and the prevalence of mega-projects is increasing. A North American expert interviewed for this report noted that today’s large projects have “high complexity and require good program and project management”, and that “community expectations and demands on infrastructure projects are increasing.” A European expert linked the increase in community demands on infrastructure projects to “better organisation of societal groups through the power of social media and digitalisation”.
22 North East Link Project, VIC
23 Major Projects, NSW Department of Planning, Industry and Environment

20
Exhibit 11: Typical staging of project commitments for private and public sector infrastructure, within the major project lifecycle
4.5 One-off delays from COVID-19, but ongoing impact likely to be small
The impacts of COVID-19 in 2020 on the engineering and construction industry were significant. Long shutdowns delayed projects and health restrictions were not yet fully understood. The mid-term effects of the pandemic are not yet obvious. However, interviews with infrastructure experts across this report’s in-focus countries three clear themes in common, set out in Exhibit 12.
Exhibit 12: Key impacts of COVID-19 on current infrastructure projects

21
Views varied as to the degree of impact on projects during the lockdown period, but the prevailing belief was that the ongoing impact on construction productivity from continued COVID-safe practices is likely to be small. Some experts cited large initial productivity delays brought on by health and safety regulations, while others saw projects accelerate, for instance, due to improved truck access to site with less congestion on the roads. Supply-chain interruptions appear to have experienced a similar progression. Some experts cited significant upfront supply delays, particularly from Chinese exports, but ongoing issues appear to be isolated. Overall, a flow through of project delays from initial lockdowns will remain, but it appears that continued compounding will be limited.
Among the consulted experts, there is general consensus that COVID-19 is having a significant impact on funding decisions. Project preferences for both private and public actors are being reprioritised. Uncertainty in patronage with new ways of working is raising questions about the need for transit spend, and there is new focus on sustainable and digital infrastructure. Private capital availability is also being affected by higher uncertainty and an unwillingness to push forward on new projects. These effects are likely to materialise in the types of projects ended or paused during the pandemic, and what pipeline options are selected for future spend.
Finally, the experts highlighted an increased difficulty in sourcing talent. Worker mobility has been severely limited by personal health-based choices, regional movement limitations and the feasibility of in-person training. Attrition of workers in on-site roles has also been observed, with a low propensity to return to work during remobilisation after shutdowns. In addition, international and inter-regional labour markets have completely halted. This appears likely to have an impact on some ongoing projects, especially in more isolated areas.

22
5 Benchmarking on cost and schedule adherence
This Chapter details the results of cost and schedule adherence benchmarking of the priority ~379 infrastructure projects. Priority projects were differentiated as either social or transport infrastructure and analysed for cost and schedule adherence across five dimensions: by country, project portfolio, project type, contract model, and project size.
Summary of key themes
• Cost and schedule overruns were both frequent and significant in degree, across transport modes, project types, and project sizes.
• Cost overruns were typically higher in incidence and degree than schedule overruns. For example, 53% of sampled transport infrastructure projects overran on cost. In comparison, only 32% of transport projects overran schedule.
• Rail projects recorded higher overruns than road projects across most dimensions. 41% of rail projects overran schedule and 73% overran cost, compared to only 26% and 43% for road projects, respectively.
• Within both rail and road, tunnel projects recorded the highest incidence of cost and schedule overruns. This was most obvious in cost overruns – at an average of 35% across all road tunnel projects compared to 21% for road above ground projects, and 48% for rail tunnels compared to 22% for above-ground rail projects.
• Within social infrastructure, hospitals were the most likely to experience cost overruns at 45%, with 30% of hospital projects also experiencing schedule overruns.
• There were no clear difference in the sample studied, between PPP and Design and Construct (D&C) contract models. In contrast, Construct-only contracts showed slightly stronger adherence to estimated schedule and cost, but this likely reflects that Construct-only contracts are typically used for smaller or less complex programs of work.
• Increasing project size appears to correlate with poorer adherence to cost and schedule, likely due to increasing project duration and complexity (and therefore exposure to risk). For example, 77% of sampled transport infrastructure projects greater than AU$5 billion in size overran cost, compared to 54% of transport projects between AU$0.5-1 billion. Projects greater than AU$5 billion in size also overran to a greater extent when they did exceed cost and schedule estimates.
5.1 Benchmarks for selected countries
Exhibit 13 below reveals the adherence to schedule of the sample of 139 transport projects, based on country. Overall, across all the 139 projects, 32% overran their proposed schedule. On average, these late transport projects overran the estimated length of time from announcement to completion by 35%.
The UK projects recorded the highest average schedule overrun, at 22%. However, this figure was disproportionately skewed by outlying projects including Edinburgh Tramways and the London Underground Jubilee Line Extension, which had schedule overruns of more than 75%.
Notably, more than 80% of sampled Canadian and German projects ran on time. German projects in the sample were on average ~AU$1.4 billion in size, just over half of the average for all transport projects, while 8/11 of the Canadian projects in the sample were road projects, potentially contributing to the countries’ positive results. Moreover, both countries had relatively small sample sizes of ~10, which makes it more difficult to generalise their results.

23
Exhibit 13: Transport projects adherence to schedule, for selected countries
The 186 social infrastructure projects in the sample recorded similar schedule results in aggregate to transport infrastructure projects. 30% of sampled projects experienced schedule overruns, with late social infrastructure projects running 31% longer than estimated. These results were substantially driven by projects from the USA, which constituted approximately two thirds of the sample size, and recorded proportion and length of schedule overruns within 5% of the total results.
In aggregate, social and transport infrastructure schedule overruns accord with the range within the academic literature reviewed.24 The average schedule overrun of a given project in the sample was 9% for social infrastructure projects and 12% for transport infrastructure projects, in the lower end of the 7-33% and 10-38% ranges in the literature (see Exhibit 6 in Chapter 4).
Exhibit 14: Social infrastructure projects adherence to schedule, for selected countries
24 See Section 4.1 and Exhibit 6.

24
Cost overruns for both transport and social infrastructure projects were higher on average than schedule overruns, aligning with commentary from reviewed academic literature.25 For transport infrastructure, across the entire sample, more than half of all projects (53%) overran on costs, with those projects costing an average of 59% more than originally estimated.
The Italian projects in the sample experienced the highest average cost overruns at 62% across projects, due to large-scale, high-speed rail projects that faced significant cost overruns. While in comparison, the 57 US projects delivered a better average cost outcome overall at 23%, they recorded the second highest average overrun of projects, exceeding their initial estimates by 79%. This result was driven by the USA having the lowest proportion of projects with cost overruns (33%) and key projects under cost estimates that suppressed the average.
Exhibit 15: Transport project costs, for selected countries
There was greater variance between social and transport infrastructure projects for cost overruns than for schedule, with 43% of projects over cost (compared to 53% for transport). This reflects academic expectation that social infrastructure projects are less likely to have cost overruns, partly flowing from the typically lesser complexity associated with vertical construction compared to linear projects. Significantly, the samples from the UK, US and Canada constitute 173 of 181 social infrastructure projects, substantially skewing the total benchmarking for social infrastructure projects to the performance in those jurisdictions.
More broadly, across both transport and social infrastructure and in total, the incidence and degree of overrun in cost is significantly higher than in schedule. This trend is replicated in all subsequent cuts of the benchmarking data.
25 See Section 4.1.

25
Exhibit 16: Social infrastructure project costs, for selected countries
5.2 Benchmarks by project portfolio
When examining schedule overrun based on project portfolio, 30% of projects in the 325 project sample ran late. Likelihood of schedule overrun was relatively consistent (+/- 4%) across social infrastructure and road projects. In contrast, rail projects were significantly more likely to overrun at 42%, 11% above average.
Within social infrastructure, there was no significant differentiation between cost and schedule overruns for healthcare and schools. Against schedule, schools had marginally higher average overruns for late projects at 47% than healthcare at 30%, but had marginally lower average cost overruns across all projects and for over estimate projects, at 11% and 32%, compared to healthcare at 15% and 39%.
Exhibit 17: Transport and social infrastructure project adherence to schedule by project portfolio
A substantial number of rail and road projects also overran their proposed cost, with projects experiencing average overruns of 35% and 23% respectively. Meanwhile, healthcare projects overran costs by only 15% on average. Overall, more infrastructure projects in our sample overran on costs than were delivered to cost estimate, at 47% and 40% respectively.

26
Exhibit 18: Transport and social infrastructure project costs, by project portfolio
5.3 Benchmarks by project type
Exhibit 19: Transport project schedule adherence deep dive, by project type
The type of rail or road project may influence the likelihood of a project exceeding its original costing. As Exhibits 19 and 21 reveal, tunnel projects typically experience higher cost and schedule overruns than other transport infrastructure projects. This may be due to the high level of inherent safety and geological challenges encountered in such projects.
In the sample, 43% of road tunnel projects and 82% of rail tunnel projects experienced cost overruns – with road tunnel projects costing 99% more on average than originally anticipated. In comparison, significantly fewer above ground road and rail projects experienced cost overruns (38% and 64% respectively).

27
Exhibit 20: Transport project cost deep dive, by project type
5.4 Benchmarks by contract model
Schedule and cost overruns were assessed by contract model, using broad contract model classifications defined in Section 3.6. Of the total sample of 379 projects within scope, sufficient data on contract model was able to be ascertained for the following: 122 Construct-only projects with an average size of ~AU$1 billion,26 122 D&C contracts with an average size of ~AU$1.7 billion, 89 PPP projects with an average size of ~AU$1.7 billion, and three collaborative-focussed contract model projects (e.g. alliances), with three projects unknown. Exhibits 21-22 analyse smaller subsets of this data, based on cost, schedule, and project type, and subject to data availability.
These results are not intended as an evaluation of the merits of different contract model types in safeguarding against cost and schedule overruns for transport infrastructure projects. There is significant complexity in discerning causation, and cost and schedule performance for a given project may be significantly influenced by confounding factors such as the existing relationship between the parties, and project type and size.
As only three projects were confirmed as collaborative contracting models, projects governed by collaborative contracts could not be reliably independently analysed. Instead, their results are incorporated in the aggregated totals in Exhibits 21-22, and the alliance-based Waterview Connection rail project in New Zealand has been included as a case study in Chapter 6. The Tours to Bordeaux LGV Line successfully incorporated aspects of relationship-style contracting, and so can be considered in a similar context, with a case study also discussed in Chapter 6.
Across contract models for transport infrastructure, Construct-only contracts performed better than average on both schedule and cost. However, this likely reflects that Construct-only contracts are typically used for smaller or less complex programs of work. As Exhibit 22 reveals, only 33% of Construct-only contracts experienced cost overruns, compared to the total average of 51%, resulting in an average overrun across Construct-only contracts of ~7% below the transport infrastructure total.
While Construct-only contracts had the highest average overrun for projects that exceeded estimated cost, this is skewed by a single outlier, which had a 400% cost overrun. Removal of the outlier lowers the average to 21%, significantly below the 57% total for infrastructure projects.
26 Project size is final project outturn costs, adjusted by Australian CPI to account for inflation.

28
The story is less clear for PPPs and D&Cs. While D&Cs are marginally above average across all metrics for transport projects, PPPs have the lowest proportion of projects over schedule, but the highest proportion of projects with cost overruns. The same result is observed for PPPs when social infrastructure projects are considered.27
Academic literature such as the reports by Duffield, et al., 2007 and National Audit Office, 200328
show a cost overrun advantage for private finance projects over traditional contracting models. While our data does not support this conclusion, there are significant differences between this report’s dataset and methodologies, and those used in relevant academic literature. In particular, there are dataset differences in project timing, scale, and location.
Exhibit 21: Transport project schedule adherence, by contract model
Exhibit 22: Transport project cost adherence, by contract model
27 Note that for PPPs, “total outturn cost” is used to ensure comparability against projects using other contract models, comprising design, engineering, construction, overheads, escalation costs, as well as contingencies actually spent. This will typically differ from the cost to government, and excludes the cost of any required financing
28 Bourn, John. (2003) “PFI: Construction Performance. Report by The Comptroller and Auditor General” National Audit Office

29
5.5 Benchmarks by project size
Projects were analysed by size, with “size” determined as the final project outturn cost, adjusted for inflation as per the methodology described in Section 3.7.
The data suggests that projects over $5 billion in size were more likely to overrun on cost and schedule, than projects smaller than $5 billion. 77% of transport infrastructure projects over $5 billion overran costs, compared to 54% of those between $0.5-1 billion (Exhibit 24). Furthermore, these projects were more expensive when they did overrun (99% compared to 53%). This finding should be treated with some caution as the sample size for projects over $5 billion is significantly smaller than the other size ranges (n=13), and the trend is not apparent between the $0.5-1 billion and $1-5 billion ranges for transport infrastructure.
Exhibit 23: Transport project schedule adherence, by project size
Exhibit 24: Transport infrastructure project cost adherence, by project size
The social infrastructure benchmarks more clearly suggest increasing project cost and schedule overruns with size. Proportion and average size of overruns increased incrementally with each size range, for both schedule and cost. For example, the average cost overrun for social infrastructure across size brackets was 10%, 14% and 44%, for the $0.25-0.5 billion, $0.5-1 billion, and $1-5 billion ranges, respectively (Exhibit 26).

30
This result is noteworthy because it suggests that the trend is observable at smaller project sizes. The average size of sampled social infrastructure projects was ~$720 million, compared to $2.6 billion, for sampled transport projects.
Exhibit 25: Social infrastructure project schedule adherence, by project size
Exhibit 26: Social infrastructure project cost adherence, by project size

31
6 Case studies
6.1 Overview
This report includes a selection of case studies to help qualitatively benchmark and investigate the global performance of large infrastructure projects. These projects include a deeper investigation of the cost and schedule structures, and drivers for performance.
These case studies have helped draw out key themes for poor and strong adherence to budget and schedule, representing a number of evident influences on project performance.
6.2 Methodology
The case study selection focuses on two groups: Seven projects with poor adherence to budget and schedule, and five with good adherence. The basic selection criteria for these projects are:
• The scale of the project (measured by project value)
• Covering a range of priority geographies
• Covering a range of priority project portfolios
• Availability of data (both publicly and through experts)
For each case study, we have drawn on both internal BCG resources and researchers, and external interviews with subject-matter experts.
6.3 Case study selection
Exhibit 27: Case studies explored to consider typical budget and schedule overruns

32
Exhibit 28: Case studies explored to consider enablers of positive cost and schedule adherence
6.4 Case studies of projects with poor adherence
This report has identified six themes within the case study projects that had poor adherence to schedule and cost. Exhibits 29-30 lists each theme, its impact on the chosen case studies and examples of its occurrence. For additional information on case study specifics, see Appendix 2.
Exhibit 29: Observed common drivers of schedule and cost overruns

33
Exhibit 30: Indicative impact of each theme from the case studies examined in this review
6.4.1 Difficult early estimations
Most public sector infrastructure projects provide an early estimate of cost and schedule, often for budgetary purposes. This often occurs before detailed planning and site investigation has been possible. There is inherent uncertainty in making these estimations with limited available data, especially for large complex projects with many risks and uncertainties. While early estimates do typically make some allowance for risks, they can also be affected by optimism bias. Our case studies reveal the double impact of over-optimistic projections and uncertainty in early decisions as a common challenge faced by most large infrastructure projects.
• The Central Artery Project (The Big Dig) cost overrun can partially be traced back to its initial cost estimates. A 25-year project with a final nominal value of US$22 billion is difficult to estimate, with many risks and challenges for the project not materialising until years after announcement. Reports suggest that a revised, more optimistic version of the original estimate encouraged government acceptance of the project.
• The MRT Downtown Line began with a similarly undersized initial estimate. Reports suggest that inexperience with projects of commensurate size and limited preparation for the procurement process contributed to the low estimate. While the subsequent cost overrun was publicly attributed to material cost overruns, other reports indicate a lack of understanding of project scale and complexity at the start were additional factors.
6.4.2 Unknown subsurface issues
Geotechnical, geophysical and utilities risk are present in most infrastructure projects. However, the selected case studies reveal the large impact on cost and schedule that they can have in worst case scenarios – and the challenges borne by project managers in fully accounting for these risks. This is particularly prevalent in projects that involve tunnelling or significant earthworks, and highlights the value in upfront investments in de-risking these projects through detailed geotechnical and other studies. While these investigations often face practical difficulties (e.g. access requirements, authorising legislation, public sensitivities), the case studies developed nonetheless reflect the value in ensuring these works are undertaken.
• The Central Artery Project faced significant delays as a result of unaccounted for water leakage, utilities requirements, and archaeological discoveries. No contingencies had been made to cover these issues, which extended for the duration

34
of the project. Post-completion, the project has faced continued geological issues caused by unexpected soil conditions and water leaks.
• The MRT Downtown line reportedly faced similar issues with unexpected soil conditions. Part of the MRT Downtown Line was also built on reclaimed land, which likely complicated design and construction.
6.4.3 Management of change through claims and disputes
It is not uncommon for infrastructure projects to experience some claims and disputes. However, major claims and disputes, often linked to issues that arise from over-optimistic estimates or appearance of unexpected scenarios, can have a major impacts on compounding cost and schedule impacts. In some case studies, project structures and systems also created incentives that increased the likelihood of claims and disputes. This can be caused by numerous factors, including strategic optimism bias, agency issues, misalignment between contractors and owners, and structural issues associated with construction and low margins.
• The Maliakos Bay to Kleidi Motorway began with over-optimistic cost estimates and risk management, which were strategically positioned for the best tender outcome. In particular, the project did not properly account for appropriate geological and tunnelling risk, and uncertainty in motorway refurbishment requirements which later caused major disputes, legal claims and delays.
• The Grande Prairie Regional Hospital redevelopment is an example where misalignment resulted in claims and disputes. Misalignment between the general contractor and owner resulted in legal action and the contractor being replaced. Further disputes have been reported to stem from a complex ownership structure between Alberta Health Services and Alberta Infrastructure.
6.4.4 Scale and Complexity
Many standard project management and governance systems are not well set up to manage larger, longer, and more complex projects. Across the case studies considered in this report, issues with experience, transparency, reporting, contracting, systems integration and project ownership have impacted cost and schedule performance.
Governance and management capabilities can be insufficiently developed to support the complexity of today’s projects and their accompanying challenges. A time lag effect is potentially at work as the relevant authorities build resources and capabilities to better manage larger and more complex projects.
• The Edinburgh Tramway was completed in 2014 with a 110% cost overrun. Poor performance was primarily attributed to a lack of managerial experience and complexity linked to project ownership structures. A triangular ownership between Edinburgh City Council, Transport Scotland and specific Scottish ministers meant the project lacked clear leadership and responsibility. The Edinburgh City Council also took a managerial role without any experience on previous projects of similar size.
• The Denver VA Medical Centre also suffered management issues due to inexperience. These were further compounded by underrepresentation of oversight personnel, geographical separation from the project and widespread misreporting of project performance.
6.4.5 Required design and scope variations
Variations to the original costed scope and design of projects, particularly at late stages, have been identified as a source of cost and schedule delays in all selected case studies. The variation appears to stem from community and technical needs, and owner preference changes that arise during the project. The original contracting process, scope definition and community engagement were also identified as influencing factors. As scope expands, the schedule and cost of the project follow. It should also be acknowledged that variation to scope

35
is not necessarily a negative project impact, if the altered scope also delivers additional benefits. For example, project owners can incorporate lessons learned and design updates to significantly improve stakeholder outcomes.
• The Denver VA Medical Centre project had over 1,400 design changes in its first two years of construction. These variations significantly expanded the scope of work required from contractors to meet project expectations. Subsequent disagreements over feasibility within the project budget created a misalignment between contractor and owner, and led to legal and contract disputes.
• Crossrail experienced a similarly high number of scope changes early in the project,
which led to contract expansion in all 36 main contracts. The procurement
complexity of numerous contracts caused major scope gaps, with most of the scope
and design changes carried out to close these gaps. Further complexity and
subsequent changes have been credited to a design process focused on customisation.
The former Chair of Crossrail Ltd noted at a London Assembly Transport Committee
meeting that “everything is different in every station” and “everything is done onsite”.
Standardisation and simplification of design may have helped reduce required design
and scope variations.
6.4.6 Compounding Costs of delay
Schedule overruns are closely linked to additional costs. Flyvbjerg, et al. 2004 deemed project delays to be responsible for the majority of cost overruns and estimated an additional year of project delays added an average of 4.64% to total project cost.29 In the selected case studies, all projects except the MRT Downtown Line showed similar characteristics, with delay costs materialising as overheads, mitigation payments and escalation.
• The Maliakos Bay to Kleidi Motorway experienced major delays due to the Global Financial Crisis (GFC) and subsequent Greek financial crisis. The project was halted for three years but could not be fully demobilised so running costs continued. When the project restarted, escalation of materials and labour would also not have been foreseen in its original cost estimations.
• The Central Artery/Tunnel Project experienced nine years of delays. Cost escalation subsequently played a major role in overruns, with the final cost including ~$US8 billion in inflation. This has been accounted for in this report’s overrun calculations, but indicates the level of escalation that this project experienced.
6.5 Case studies of good adherence to schedule and budget
Typically, successful infrastructure projects are supported by owners and teams with deep experience in the same, or comparable, projects and programs. Projects that begin by setting expectations on cost and schedule which account for the degree of uncertainty – for example, by announcing a broad range of cost estimates – also appear to be more successful than projects that do not.
Our review identified a further four themes from the selection of case studies that had good adherence to schedule and cost, which are likely to have contributed to success. For each theme, examples of its occurrence are listed in Exhibit 31.
For additional information on case study specifics, see Appendix 2.
29 Flyvbjerg, Holm and Buhl. (2004) "What Causes Cost Overrun in Transport Infrastructure Projects?" Transport Reviews, vol. 24, no. 1, January 2004, pp. 3-18.

36
Exhibit 31: Themes and enablers for positive cost and schedule adherence
6.5.1 Upfront investment in de-risking projects
In all the following case studies, early investment in de-risking the project led to more effective management of costs, fewer claims, and better schedule adherence. Upfront investment had a particular impact on schedule where it served to minimise permit, environmental and contract delays.
• The Waterview connection allocated $18 million to its tender process to cover 60% of bidder costs and acquire all IP from all its bids. By acquiring IP, they were able to integrate the best ideas into the winning bid and decrease project risks. Covering bidder costs also led to quality bids and improved buy-in to the process. Further, funding helped the project successfully define the project scope and requirements, minimising the risk of later scope changes and unforeseen issues.
• The Tours to Bordeaux LGV line began with significant environmental, civil and geotechnical investment. For example, the project included a dedicated process for environmental regulation and considerations for specific parks and species. This helped ensure social buy-in and confirm necessary expropriations early. The project also invested in best-practice geotechnical investigation. All these early investments avoided potential delays in the project delivery.
6.5.2 Alignment of procurement and contract structures
Procurement and contract structures aligned to project requirements and outcomes appear to be an effective catalyst for project budget and schedule adherence. Typically, projects include comprehensive processes to tailor procurement and contracts to match the specific project’s requirements in cost, risk management, and innovation. Upfront investment in these areas appears to lock in project-wide impacts.
• Queensferry Crossing Bridge successfully locked in benefits because the authority recognised and took advantage of the market conditions at the time of the procurement process. By negotiating and mitigating future changes and claims at this time, it was able ensure a strong cost performance.
• Waterview Connection was a complex project involving significant risks. The owner used a competitive alliance contracting model deemed best practice for risk management in the specific project application. The alliance contract was reported to not be a substitute for risk management but to act as a catalyst for best practice risk

37
principles. As an added advantage, this model promoted innovation in design and value for money through competition at the tendering stage.
• Tours to Bordeaux LGV line was the first project of its type in France to use a concession agreement in the project’s construction phase. The agreement is a 50-year concession until 2061 covering financing, design, construction, operation, and maintenance of the project. The concession format is thought to have internally driven adherence to the project schedule and cost performance through the link to maximising consortium return on investment. VINCI construction, which led the consortium that was awarded the contract, have significantly expanded their concession offerings since the success of this model.
6.5.3 Clear legitimacy and support
Project buy-in and clear sponsorship from government and community stakeholders appears to be a further driver for good cost and schedule adherence.
• Queensferry Crossing Bridge had clear sponsorship from government, with a Scottish referendum for independence driving strong public backing and support for the project. Government provided significant oversight of the project cost and schedule, with frequent communication between the project team and government. This ensured clear reporting, sufficient oversight and strong support for any necessary changes.
• Frontlines 2015 had strong public support, helping to facilitate the use of a community funded alternate funding model. Given the project’s long-term development plan and strong social licence, this model accelerated the project through a tax increase.
6.5.4 Adoption of new technology and tools
Design tools and technology have allowed several of these selected case studies to better mitigate risks and avoid multiple sources of cost and schedule pressure. Early adoption of and experience in design and technology appears to allow these projects to outperform and better mitigate potential risks.
• Tours to Bordeaux LGV Line used specialised technology to carry out geotechnical investigation as a part of its upfront investment in risk mitigation. This helped ensure the project avoided the many geological risks involved in excavation and tunnelling. The project also standardised its design to leverage the previous experience of the conglomerate and to simplify both the design and construction processes.
• Wrexham Prison used virtual reality and spatial modelling during its design phase. This helped to minimise later design changes and rework, by seeking buy-in effectively and any preference changes from owners and the community integrated successfully at the design stage.

38
7 Conclusions
The pressures and challenges experienced globally in delivering major transport and social infrastructure projects, and the related challenges in adhering to cost and time estimates, are unlikely to abate.
These pressures are driven by long-term structural factors linked to the increasing size, complexity, community expectations, and risk associated with these very large programs of work. They are not unique to any one location or type of project, but are experienced globally on a range of large infrastructure projects.
Governments, public sector agencies, and contractors alike may find it helpful to consider the following factors as they approach significant infrastructure builds, which appear to exacerbate the risks of overruns in major project delivery:
• The challenge of delivering accurate estimates of schedule and cost early in the project lifecycle, especially point-estimates – as it is difficult to deliver accurate estimates before detailed design and engineering work takes place
• The adequacy of project management and project governance systems, especially on the client-side of projects – which are increasingly exposed to higher risk profiles associated with the shift toward larger, more complex projects
• The suitability of the chosen contract model (and contract management approach) for the specific risks and objectives of the project at hand – taking into account for instance, desired acceleration of works, degree of uncertainty in geological or utilities risk, likelihood of future variations in scope
• Project-by-project approaches to procurement of major infrastructure (as distinct from program-based approaches) – which limit the capacity and incentives for industry to invest in productivity-enhancing initiatives, innovation, new technology and tools
• The extent of governments’ partnership with industry to deliver long-term increases in infrastructure-sector productivity – systematically identifying, scoping, funding and relevant initiatives
Because every infrastructure project is unique, it can be helpful to consider these factors in the context of the overall infrastructure ecosystem. Cost and schedule overruns can rarely be attributed to a single factor. Therefore, we suggest that governments and public sector agencies take an end-to-end consideration of their infrastructure project lifecycle and delivery approach including: the supply chain, contracting approaches and models, design standards and specifications, environmental and other regulations, and community and public policy sensitivities specific to each jurisdiction.
Taking a careful, integrated consideration of these factors, may help ensure each infrastructure investment provides the greatest amount of value.
The infrastructure sector’s response to the challenges posed by the COVID-19 pandemic demonstrated a capacity for rapid innovation and adaptation. As many countries look to expand their infrastructure pipelines to support economic recovery post-COVID-19, these matters will become even more critical.

39
Appendix 1: List of all in-scope projects
Transport
Project Name Country
MoT – BRT Transcarioca – Rio de Janeiro Brazil
Seplan – Salvador Lauro de Freitas Metro Line II – Bahia Brazil
DERSA – Mario Covas East Stretch Ring Road Development – Sao Paulo Brazil
CCR/SEDUR – Salvador Metro Subway – Bahia Brazil
CMSP – Adolfo Pinheiro to Chacara Klabin Metro Line V Expansion – Sao Paulo Brazil
DNIT/DER – BR 493/RJ 109 Metropolitan Arch Highway – Rio de Janeiro Brazil
BCMoT - Vancouver-Whistler Sea-to-Sky Highway - British Columbia Canada
Canada Transit Line - Vancouver Canada
CCE - South LRT Extension : Phase I - Alberta Canada
Golden Ears Bridge - Pitt Meadows Canada
MOT - Stoney Trail NE Ring Road - Alberta Canada
MoT - Autoroute 30 Extension - Quebec Canada
MOT – New Port Mann Bridge and Highway I Development – British Columbia Canada
MoT – Anthony Henday Drive Ring Road – Alberta Canada
TransLink – Evergreen Line Rapid Transit – British Columbia Canada
TTC – Toronto-York Spadina Subway Extension – Ontario Canada
IC – Champlain Bridge Corridor – Quebec Canada
MoHI – Regina Bypass – Saskatchewan Canada
MTO – Highway 407 East Extension – Ontario Canada
CCT – Union Station GO Terminal Renovation – Ontario Canada
Tunnel du Mont Sion – Saint-Blaise France
RATP - Duplex A86 Tunnels - Paris France
RFF - Rhine To Rhone High Speed Rail East Line - Rhone-Alpes France
MEEDDAT – A63 Toll Road Salles to Saint-Geours-de-Maremne Upgrade – Aquitaine France
RFF – PP17 Paris to Bratislava Railway Axis: Baudrecourt-Vendenheim Section – Grand Est France
MEDDE – Marseille A507 Expressway – France France
RFF – Bretagne to Pays de la Loire High Speed Rail Link – Bretagne France
RFF – Nimes to Montpellier Bypass Rail Link – Languedoc Roussillon France
RFF – Tours To Bordeaux LGV High Speed Line – Aquitaine France
RFF – Nice Tramway Line T2 Development – Cote d'Azur France
DB AG - Katzenberg Tunnel - Baden-Wurttemberg Germany
TASLS - A1 Motorway Expansion Bremen-Hamburg - Germany Germany
FSS – Leipzig City Tunnel – Saxony Germany
MCC – Luise-Kiesselbach-Platz Tunnel – Bavaria Germany
DBN – Ebensfeld-Erfurt Express Railway Line – Thuringia Germany
BMVI – Hamburg-Northwest-Bordesholm A7 Highway Expansion – Schleswig-Holstein Germany
ABDSB – A94 Forstinning-Marktl Motorway – Bavaria Germany
BVG – Berlin U5 Underground Railway Line Expansion – Germany Germany
DB – ABS48-Munich-Memmingen-Lindau Railway Line Electrification – Bavaria Germany
BSG – Augsburg-Ulm Motorway Expansion – Bavaria Germany
AM – Metro Line 2 Extension – Athens Greece
MoITN – Maliakos Bay to Kleidi Motorway Upgrade – Greece Greece
NRA – Dublin Port Tunnel – Dublin Ireland
NRA - N25 Waterford Bypass - Ireland Ireland
Limerick Immersed Tunnel – Limerick Ireland
NRA - Limerick Ring Road - Ireland Ireland
NRA – Arklow-Rathnew Carriageway N11 – County Wicklow Ireland
NRA – Galway Gort to Tuam Motorway – Ireland Ireland
FDS - Monte Bibele Tunnel - Monterenzio Italy
Ferrovie – Bologna to Florence High Speed Railway Line – Emilia Romagna Italy
GTT - Metro Line Rail Tunnel - Torino Italy
ATAC - B1 Rome Metro Rail - Rome Italy
BM - Brescia Driverless Metro - Lombardy Italy
T.A.V. SpA - Turin-Milan High-Speed Railway Line - Italy Italy

40
Brebemi – Brebemi Motorway – Italy Italy
ATM – Milan Metro Line V – Italy Italy
MIT – Milan East Outer Ring Road – Italy Italy
RFI – Treviglio to Brescia High Speed Railway Line – Lombardy Italy
MIT – Highway 640 Caltanissetta-Agrigento Rehabilitation: Twin Tunnels – Sicily Italy
MoF – Florence Tramway Line II – Italy Italy
RFI – San Lorenzo al Mare-Andora Rail Line Redevelopment – Italy Italy
JR Central – Superconducting Maglev Test Line Upgrade – Yamanashi Japan
NZTA – Waterview Connection – Auckland New Zealand
Expressway Tunnel - Kallang Singapore
LTA - Circle Line MRT Tunnel - Singapore Singapore
LTA – Tuas West Extension – Central Singapore Singapore
LTA – Downtown MRT Line – Central Singapore Singapore
Airport Connection Bridge - Incheon South Korea
BMC - Busan-Geoje Fixed Link - South Korea South Korea
RoSK – Seoul–Munsan Expressway – South Korea South Korea
Guadarrama Tunnel – Madrid Spain
M30 Madrid Calle 30 - Madrid Spain
Madrid to Valladolid High speed lines – Madrid Spain
Pajares Base Tunnel – Asturias Spain
GoC - Eix Transversal Road Development - Catalunia Spain
ZCG - Zaragoza Tramway Line I - Spain Spain
Fomento – Antequera-Granada High-Speed Rail System – Malaga Spain
TMB – Barcelona Metro Line 9 – Spain Spain
London Underground Jubilee Line Extension - London UK
CTRL Contract 105 - St Pancras UK
HE – A3 Hindhead Development – London UK
TWITA – New Tyne Road Crossing – Tyne and Wear UK
Network Rail – Kings Cross Station Redevelopment – London UK
TFL/NRIL - East London Line Extension - London UK
ECC – Edinburgh Tramway – Scotland UK
HE – M25 Motorway Improvement – London UK
NCC – Nottingham Express Transit Phase II – Nottinghamshire UK
Network Rail – New Street Station Gateway – West Midlands UK
Network Rail – Reading Railway Station Upgrade: Phase II – Berkshire UK
HBC – Mersey Gateway Bridge – Cheshire UK
Network Rail – Edinburgh to Glasgow Main Line Electrification – UK UK
TS – A8/M8 Baillieston-Newhouse Motorway Development – Glasgow UK
TS – Queensferry Crossing Bridge – Edinburgh UK
TfL – Victoria Tube Station Renovation – Greater London UK
HE – A14 Highway Upgrade – Cambridgeshire UK
HA – M1 Junction J10 to 13 Motorway Scheme – Bedfordshire UK
HE – A1-Highway Upgradation – Darrington to Dishforth UK
TS – Aberdeen Western Peripheral Route – UK UK
I-15 Corridor Reconstruction - West Salt Lake US
The Alameda Corridor - Los Angeles US
AirTrain - New York US
AirTrain JFK Light Rail System - New York US
Bay Area Rapid Transit (BART) Extension - San Francisco US
Cooper River Bridge - Carolina US
I-25 T-REX Project - Colorado US
Woodrow Wilson Bridge - Washington D.C US
South Bay Expressway - San Diego County US
State Route 22 HOV Lane Project - California US
The Central Artery/Tunnel Project - Boston US
T-Third Street Metro - San Francisco US
Marquette Interchange Project - Milwaukee US
ST - Seattle Transit Tunnel - Washington US
TxDOT - Austin SH 130 Segments V-VI Highway - Texas US

41
VDOT - Capital Beltway High Occupancy Toll Lanes - Virginia US
CDoT/SANBAG – San Bernardino I-215 State Highway Redevelopment – California US
NCTA – Triangle Expressway – Raleigh US
UTA – FrontLines 2015 Railway Lines – Utah US
FDOT – Interstate 595 Revamp – Florida US
FDOT – Port of Miami Tunnel – Florida US
Metro/Caltrans – I-405 Sepulveda Pass Improvements – California US
MTA – Fulton Street Transit Center – Manhattan US
NJTA – Turnpike Interchange 6 to 9 Widening Program – New Jersey US
NTTA – Chisholm Trail Parkway: Chisholm Trail – Texas US
TxDOT – Dallas Fort Worth Connector – Texas US
TxDOT – North Tarrant Express Highway – Texas US
VDoT – I-95 Express Lanes – Virginia US
EMLCA – Los Angeles Expo Light Rail Line – California US
MTA – VII Subway Line Extension – New York US
TxDOT – LBJ Express Highway Improvement – Texas US
CDOT/HPTE/RTD – US 36 Managed Lanes – Colorado US
CTDOT – Interstate-95 New Heaven Harbor Crossing Corridor – Connecticut US
KYTC/INDOT – Ohio River Bridges – Indiana US
ST – Capitol Hill to Husky Stadium Tunnel – Washington US
BART – Warm Springs Extension – California US
MnDoT/WDoT – St. Croix River Crossing – Minnesota US
RCTC – SR 91 Corridor Improvement – Southern California US
TxDOT – Dallas Horseshoe Road Development – Texas US
CoC – Charlotte LYNX Blue Line Extension – North Carolina US
GDOT – Northwest Corridor – Georgia US
NCDoT – I-77 Charlotte to Mooresville Toll Lane – North Carolina US
NYSTA – Tappan Zee Bridge Replacement – New York US
ODOT – Southern Ohio Veterans Memorial Highway – Ohio US
PANYNJ – Goethals Bridge Replacement – New Jersey US
TxDOT – State Highway 183 Managed Lanes Development – Texas US
ADOT – Phoenix South Mountain Freeway Loop 202 Extension – Arizona US
DelDOT – U.S. Route 301 Toll Road – Delaware US
GSA – San Ysidro Land Port of Entry Expansion – California US
NDOT – Neon Road Improvements – Nevada US
PANYNJ – Bayonne Bridge Upgrade and Navigational Clearance Project– New Jersey US
WSDOT – Hyak to Keechelus Dam Road Improvement – Washington US
POLB/CDoT/LACMTA/DoT – Gerald Desmond Bridge Replacement – California US
TxDOT – Harris County SH-288 Toll Road – Texas US
TxDOT/CTRMA/CA/Metro/CAMPO – Bergstrom Expressway – Texas US
Amtrak/MTA – New Haven-Hartford-Springfield High Speed Commuter Rail Line – Connecticut US
Caltrans/ACTA – Schuyler Heim Bridge Replacement and SR-47 Expressway – California US
CDOT – New Britain to Hartford Busway – Connecticut US
ESDC – Moynihan Rail Station Redevelopment – New York US
METRO – Light Rail System Expansion – Texas US
MSDC – Moynihan Station Redevelopment – New York US
MTA/DoT – Canarsie Tunnel Rehabilitation – New York US
NCDOT – Monroe Connector Bypass – North Carolina US
NJDOT – Pulaski Skyway Rehabilitation – New Jersey US
NYSDOT – Kosciuszko Bridge Replacement – New York US
PDOT – Birmingham Bridge Upgrade – Pennsylvania US
TxDOT – Border West Expressway – Texas US
TxDOT – Grand Parkway Development – Texas US
WSDoT - SR 104 Hood Canal Bridge Redevelopment - Washington US

42
Social
Project Name Country
William Osler Civic Hospital- Brandon Canada
CHR - Foothills Medical Centre McCaig Tower - Alberta Canada
NBGH - North Bay Regional Health Centre - Ontario Canada
SAH - New Sault Area Hospital - Ontario Canada
WGH - Woodstock General Hospital - Ontario Canada
CAMH - Phase 1B Redevelopment - Ontario Canada
HHS - Juravinski Hospital and Cancer Centre - Ontario Canada
NHA - Fort St. John Hospital & Residential Care - British Columbia Canada
NHS - St. Catharine’s Hospital - Ontario Canada
HSC – Toronto Sick Children Research and Learning Tower – Ontario Canada
MoI - Edmonton New Remand Centre - Alberta Canada
RVH - Royal Victoria Hospital Expansion - Ontario Canada
Fraser Health – Surrey Memorial Hospital Expansion – British Columbia Canada
HRH – Humber River Regional Hospital Redevelopment – Ontario Canada
MUHC – McGill University Health Centre Super Hospital – Quebec Canada
WCH – Women’s College Hospital Capital Redevelopment: Phase II – Ontario Canada
HGJ – Pavilion K – Quebec Canada
IHA – Interior Heart and Surgical Centre – British Columbia Canada
PC/IO – Providence Care Hospital – Ontario Canada
JBMH/McMaster/IO/MoH – Joseph Brant Memorial Hospital Expansion – Ontario Canada
SIQ – Sorel-Tracy Detention Facility – Quebec Canada
CHUSJ – Sainte-Justine University Hospital Centre Modernization – Quebec Canada
SHNB – North Battleford Hospital Replacement – Saskatchewan Canada
SHR – Jim Pattison Children’s Hospital – Saskatchewan Canada
AI – Grande Prairie Regional Hospital – Alberta Canada
CAMH – McCain Complex Care and Recovery Centre: Phase 1C – Toronto Canada
VIHA/CSRHD – Comox Valley Hospital Development – British Columbia Canada
WOHS – Brampton Peel Memorial Centre Redevelopment – Ontario Canada
APUH – Amiens University Hospital – Picardie France
SBK – Villingen-Schwenningen Hospital Building – Baden-Wurttemberg Germany
UKSH – Kiel University Hospital of Schleswig-Holstein Expansion – Germany Germany
HK – Bad Homburg Hochtaunus-Hospital – Hesse Germany
TMU – Tokyo University Hospital Building – Japan Japan
CDHB – Christchurch Hospital Redevelopment – Canterbury New Zealand
MoH - The Academia Twin Towers - Singapore Singapore
Puerta de Hierro Hospital Renovation – Majadahonda Spain
SSLIB - New Son Dureta University Hospital - Baleares Spain
SESCAM - New University Hospital - Cuenca Spain
Norfolk and Norwich University Hospital - Norwich UK
Walsgrave Hospital - Coventry UK
BMDC - Bradford Schools PFI: Phase I - Northern England UK
Derby City General Hospital Epansion - Derby UK
Modernisation of Acute Services - Nottinghamshire UK
LBN – Newham Building Schools For Future – UK UK
LCC - Lancashire Building Schools : Phase 2/2A - England UK
UHBT - Queen Elizabeth Hospital - Birmingham UK
Walsall NHS - Walsall Manor Hospital Redevelopment - West Midlands UK
BMDC - Bradford Schools PFI Phase II - Bradford UK
WHSCT - Acute Hospital - Enniskillen UK
HCC/Esteem - Hull Building Schools for the Future Development – Yorkshire UK
HCC – BSF Investment Program – Hull UK
NHS – Southmead Hospital – UK UK
AHC Trust – Alder Hey Children’s Health Park – Merseyside UK
NHSGGC – New South Glasgow Hospital Campus – UK UK
NSNHST – Royal Stoke University Hospital – West Midlands UK
BARTS – St Bart's and The Royal London Hospitals Redevelopment – London UK
SFT - Mansfield Community Hospitals Redevelopment - Mansfield UK
MoJ – Wrexham Super Prison Development – UK UK
NHS – Dumfries Hospital Redevelopment – Dumfries and Galloway UK
WCC – Building Schools for Future Program – Wolverhampton UK

43
WLMHT – Broadmoor Psychiatric Hospital Redevelopment – West Berkshire UK
MoD – Stanford Hall Defence and National Rehabilitation Center – Leicestershire UK
PH – New Papworth Hospital – Cambridgeshire UK
ABHB – The Grange University Hospital – Torfaen UK
HBC - Halton BSF Programme - Cheshire UK
MoJ - Belmarsh West Prison Development - London UK
NFV - Forth Valley Acute Hospital - Larbert UK
NHS - Victoria Hospital Redevelopment - Kirkcaldy UK
NHSFT - Royal Manchester Children Hospital - England UK
Shine – Blackburn with Darwen and Bolton BSF Development – UK UK
STCC – Stoke-on-Trent Building Schools for the Future Development – Staffordshire UK
Banner – Banner-University Medical Center Phoenix Patient Tower – Arizona US
Banner Desert Medical Center Tower - Mesa US
Harborview Norm Maleng Building - Seattle US
Kaiser Permanente Hospital - Panorama City US
LAC+USC Medical Center Replacement Facility - Los Angeles US
Ronald Reagan UCLA Medical Center - Los Angeles US
Sacred Heart Medical Center - Springfield US
El Camino Hospital - Mountain View US
Henry Ford West Bloomfield Hospital - Michigan US
SH - Elgin Sherman Hospital Replacement Campus - Illinois US
SHC - Gainesville Shands Cancer Hospital - Florida US
JHH - Baltimore Johns Hopkins Hospital New Clinical Building - Maryland US
MTHS - Middle Tennessee Medical Center - Tennessee US
MTMC - Middle Tennessee Medical Center Replacement - Tennessee US
STHS - New Columbia St. Mary's Hospital Milwaukee - Wisconsin US
YNHHS - Smilow Cancer Hospital - Connecticut US
JMH - Walnut Creek Campus Phase IV Expansion - California US
LMC – Lexington Medical Center Expansion – South Carolina US
MHS - Good Samaritan Hospital Expansion - Puyallup US
MPHS/SH - Burlingame Mills-Peninsula Hospital Replacement - California US
SACH - St. Anthony Hospital Expansion - Lakewood US
USACE - San Antonio Military Medical Center - Texas US
DUHS - Duke Cancer Center and Medicine Pavilion - North Carolina US
KFH - Kaiser Permanente Fontana Medical Center - California US
LRMC - Lakeway Regional Medical Center - Texas US
NF - Orlando Nemours Children Hospital - Florida US
SCH - Silver Cross Replacement Hospital - Illinois US
UoK - Albert B. Chandler Hospital Phase I - Kentucky US
AMC – Albany Medical Center Expansion – New York US
MGH – Augusta Regional Hospital Development – Maine US
NAVFAC Southwest – Naval Hospital Replacement – California US
OMHS – Owensboro Medical Center Replacement Hospital – Kentucky US
UCH – University of Colorado Hospital Expansion – Colorado US
UMCP - University Medical Center Replacement Facility - New Jersey US
UOCH – Anschutz Medical Campus Expansion – Colorado US
KP – Oakland Medical Center – California US
NF – Nemours/Alfred I. duPont Hospital for Children Expansion – Delaware US
OSU – Wexner Medical Center Expansion – Ohio US
SH/ABSMC – Alta Bates Summit Medical Center Patient Care Pavilion – California US
SMC – Sutter Santa Rosa Regional Hospital – California US
USACE – Fort Hood Medical Center – Texas US
UTSW – New UT Southwestern University Hospital – Texas US
CCSF – San Francisco General Hospital and Trauma Center Redevelopment – California US
DoVA – Veterans Affairs Medical Center – Orlando US
GoL – University Medical Center Complex – Louisiana US
Mercy – Joplin New Hospital Development – Missouri US
OHC – Riverside Neuroscience Center – Ohio US
PHHS – Parkland Hospital Replacement – Texas US
TCH – The Christ Hospital Mt. Auburn Campus Expansion – Ohio US
UCSF – UCSF Mission Bay Hospital Complex – California US
DoD – Carl R. Darnall Army Medical Center – Texas US
IHS – Inova Women and Children Hospital – Virginia US

44
PHS - Marshall and Katherine Cymbaluk Medical Tower - Washington US
SH – Stamford Hospital Development – Connecticut US
UCSD – Altman Clinical and Translational Research Institute – California US
UCSD – Jacobs Medical Center – California US
UTMB – Jennie Sealy Replacement Hospital – Texas US
BHSF – The Miami Cancer Institute – Florida US
BMHCC – Oxford Baptist Memorial Hospital Replacement – Mississippi US
EH – Clifton Road Hospital Expansion – Georgia US
HSHS – O’Fallon St. Elizabeth’s Hospital – Illinois US
KH – John R. Oishei Children’s Hospital – New York US
Methodist – The Woodlands Hospital – Texas US
MH – The Gary Shorb Tower Hospital Expansion – Tennessee US
MHS/UTHSC – Methodist Hospital Campus Expansion – Texas US
RHMC – West Reading Campus Surgical Building – Pennsylvania US
RIC – The Shirley Ryan AbilityLab – Illinois US
SH – Sanford Fargo Medical Center – North Dakota US
UoI – University of Iowa Children's Hospital – Iowa US
DMRC/IH – Dixie Regional Medical Center Expansion – Utah US
DVA – New Denver VA Medical Center – Colorado US
EMMC – Bangor Eastern Maine Medical Center Expansion – Maine US
IHS – Fairfax Inova Dwight and Martha Schar Cancer Institute – Virginia US
JSUMC – Neptune City HOPE Tower – New Jersey US
LRHS – Pavilion for Women and Children at Lakeland Regional Health – Florida US
MCHS – Mount Carmel East Hospital Expansion – Ohio US
Methodist – Houston Methodist Hospital Campus Inpatient Tower – Texas US
NYPH – David H. Koch Ambulatory Care Center – New York US
NYULMC – Helen L. and Martin S. Kimmel Pavilion Hospital Expansion – New York US
SBU – Stony Brook New Medical and Research Translation Complex – New York US
TCH – Pediatric Tower E Children's Hospital Expansion – Texas US
WHHS – Morris Hyman Critical Care Pavilion – California US
ACMC – Alameda County Acute Tower Replacement – California US
AHWAH – White Oak Hospital Development – Maryland US
Banner – Tucson Hospital Tower – Arizona US
Bayhealth – Milford Memorial Hospital Redevelopment – Delaware US
CPMC – Cathedral Hill Hospital Development – California US
HHCMC – Wishard Hospital Replacement – Indiana US
IHN – Mullica Hill Medical Center – New Jersey US
Inspira – Gloucester County Inspira Medical Center – South Jersey US
Intermountain – Utah Valley Regional Hospital Replacement – Utah US
MCHS – Mount Carmel Grove City Hospital Expansion – Ohio US
MGH/DLP – Marquette General Hospital Expansion – Michigan US
MGH/DLP – Marquette Hospital – Michigan US
MH – Asheville Hospital Tower – North Carolina US
MLH – Bryn Mawr Hospital Modernization – Pennsylvania US
MRHS – Rockford Destination Hospital – Illinois US
ProMedica – Toledo Hospital Expansion – Ohio US
SUMC – Adult Stanford Hospital – California US
THR/UTSMC – Texas Health Frisco – Texas US
TMH – Tallahassee Surgery Center and Adult ICU Expansion – Florida US
UCHealth – Highlands Ranch Hospital and Medical Campus – Colorado US
UCSF – Precision Cancer Medicine Building – California US
USACE – Fort Bliss Replacement Hospital – Texas US
CCHS – Christiana Hospital Expansion – Delaware US
HMS – Silverdale Hospital Expansion – Washington US
ILH – Inova Loudoun Hospital Expansion – Virginia US
MHD – Marin General Hospital Redevelopment – California US
MHP – Muskegon New Mercy Health Medical Center – Michigan US
MSKCC/CUNY – Memorial Sloan Kettering Cancer Treatment Complex – New York US
MUSC – Charleston Children and Women Hospital – South Carolina US
OU – 700 North East 13th Street Hospital Development – Oklahoma US
RGH – Sands-Constellation Critical Care Center – New York US
SSMH – Saint Louis University New Hospital – Missouri US
SUH – Bethesda Suburban Hospital Expansion – Maryland US

45
CoS – Somerville High School – Massachusetts US
MHHS – Texas Medical Center Expansion – Texas US
NYMH – Park Slope Hospital Expansion – New York US
VBMC – Vassar Brothers Medical Center Expansion – New York US
AHC – Advocate Christ Medical Center: Patient Tower – Illinois US
BMC – Boston Medical Center Renovation – Massachusetts US
CCHMC – Clinical Space Expansion – Ohio US
CPHCS/CDCR – Stockton Prison Medical Facility – California US
DHS/UMMS – University of Maryland Capital Region Health Development – Maryland US
ECH – Mountain View Campus Health Center – California US
LACDPW – Rancho Rising 2020 – California US
LLUMC/PGM - Murrieta General Acute Care Hospital - California US
Memphis City Schools - Memphis US
MH – St. Joseph Building Redevelopment – North Carolina US
NCH - Nationwide Children’s Hospital Expansion - Ohio US
NLFH – Northwestern Lake Forest Hospital Revitalization – Illinois US
SBMC – Cooperman Family Pavilion Renovation – New Jersey US
SCH - New Lenox Silver Cross Hospital - Illinois US
SMC – Santa Rosa Sutter Medical Center – California US
SUMC – Palo Alto Lucile Packard Children's Hospital Expansion – California US
UCM – Hyde Park Campus Expansion – Illinois US
UF – Health Shands Cancer Hospital Expansion – Florida US
UHS – Bexar County University Hospital Renovation – San Antonio US
UoM - C.S. Mott Children’s Hospital and Von Voigtlander Women’s Hospital - Ann Arbor US
VA - Southern Nevada Healthcare Complex: Phase IV - Nevada US
VH - Virtua West Jersey Replacement Hospital - New jersey US
Westwood Replacement Hospital - Los Angeles US

46
Appendix 2: Schedule and cost adherence correlation over time
Exhibit 32 displays the major transport infrastructure projects included in this review’s sample of 379 projects, by relative size of schedule and cost overruns. The distribution appears to indicate a positive correlation between cost and schedule overrun. This is consistent with findings in academic literature that both schedule and cost overruns are consistently experienced across transport projects (see Chapter 4).
A sub-segment of projects, highlighted below, performed relatively well on schedule, but suffered significant cost overruns (>40%). A possible explanation for these cases is that the parties spent additional capital to mitigate delays, generating cost overruns in response to internal or external time pressures to expedite a project.
Exhibit 32: Schedule and cost adherence correlation – transport infrastructure

47
Appendix 3: Case studies considered in this review

48

49

50

51

52
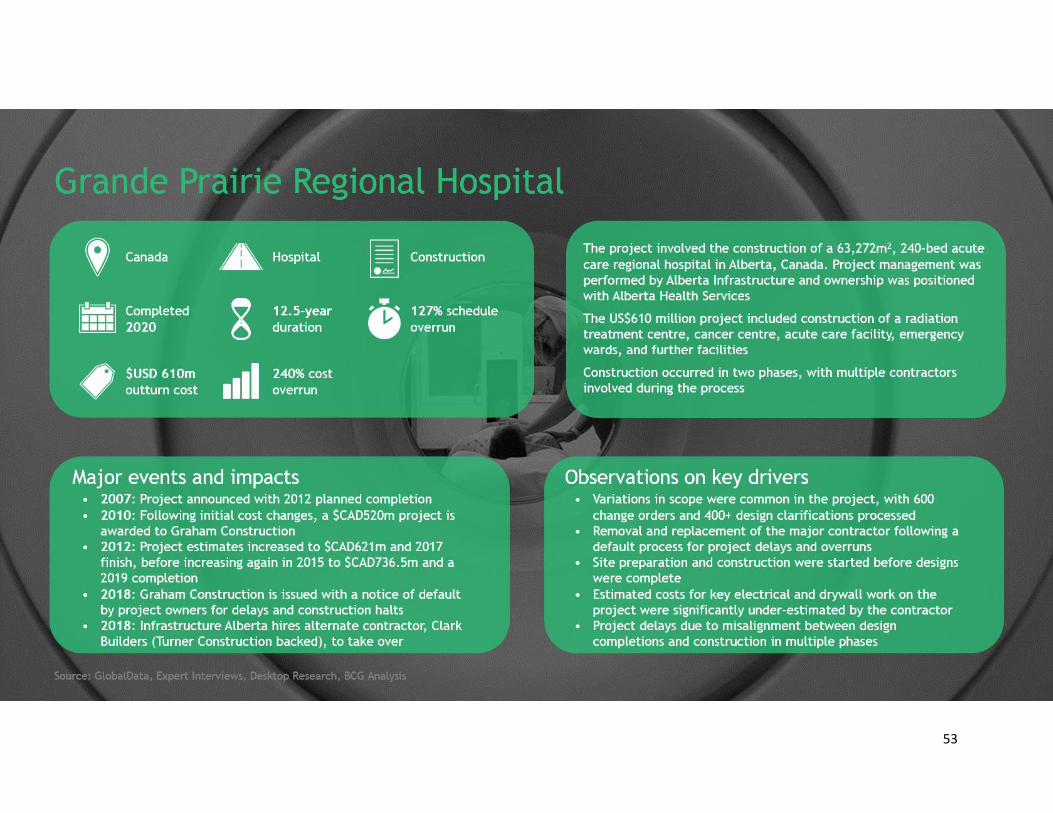
53

54

55

56

57

58


