
1
Introduction to scenario studies Introduction to scenario studies (SRES, post(SRES, post--SRES, etc)SRES, etc)
National Institute for Environmental StudiesNational Institute for Environmental Studieshttp://www-iam.nies.go.jp/aim/
Mikiko KainumaMikiko Kainuma
AIM Training Workshop AIM Training Workshop 1616--20 October 200620 October 2006
NIES, Tsukuba, JapanNIES, Tsukuba, Japan

ScenariosScenariosProvide a framework for decision making Provide a framework for decision making which illuminates the impact associated which illuminates the impact associated with alternative courses of actionwith alternative courses of action
Facilitate the interpretation of possible Facilitate the interpretation of possible future statesfuture states
Include elements that cannot be formally Include elements that cannot be formally modeledmodeled
Aimed at challenging prevailing mind setsAimed at challenging prevailing mind sets
Source: Source: NakicenovicNakicenovic, 2005, 2005

Previous developed and used scenarios by IPCC
INTERGOVERNMENTAL PANEL ON CLIMATE CHANGE (IPCC)
1990 1992
Six IS92 scenarios
1995
Evaluation Scenarios
1996
Panel decisionnew scenarios
2000
Special Report Emissions Scenarios (SRES)
2001
TAR
2004
Start writing AR4Based on SRES
????
Start writing AR5Based on ???????
Four SA90 scenariosStart reviewing post-SRES scenarios and updating database

Purposes of Emissions Purposes of Emissions ScenariosScenarios
Purpose 1: Evaluate the environmental and climatic Purpose 1: Evaluate the environmental and climatic consequences of consequences of ““nonnon--interventionintervention”” futuresfutures
Purpose 2: Evaluate the environmental and climatic Purpose 2: Evaluate the environmental and climatic consequences of consequences of ““interventionintervention”” futuresfutures
Purpose 3: Examine the feasibility and costs of Purpose 3: Examine the feasibility and costs of mitigating mitigating GHGsGHGs from different regions and sectorsfrom different regions and sectors
Purpose 4: Negotiate possible emissions reductions Purpose 4: Negotiate possible emissions reductions for different countries and regionsfor different countries and regions
Source: IPCC, 1995Source: IPCC, 1995

Source: Source: NakicenovicNakicenovic, 2005, 2005
SA90SA90 IS92IS92 SRESSRES TARTAR
Purpose 1Purpose 1““nonnon--interventionintervention””
YesYes YesYes YesYes
NoNo
NoNo
No (?)No (?)
NoNo
Purpose 2Purpose 2““interventionintervention””
YesYes NoNo Yes Yes
Purpose 3Purpose 3"different regions "different regions and sectors"and sectors"
NoNo NoNo Yes (?)Yes (?)
Purpose 4Purpose 4"Negotiation""Negotiation"
No (?)No (?) No (?)No (?) No (?)No (?)
Purposes of Emissions ScenariosPurposes of Emissions Scenarios(Together with Climate Projections)(Together with Climate Projections)

Source: IPCC SRES, 2000Source: IPCC SRES, 2000
Alternative Scenario FormulationsAlternative Scenario Formulations
Models
Stories
Scenarios
Quantitativ
e
Qualitativ
e

7
SRES: Socioeconomic development scenariosfor climate change prediction
economy
environment
regionalismglobalism
A2A2
B1 B2
populationEconomic growth
technology energyAgriculture(land use)
Driving Forces
A1A1FIA1FI
A1TA1TA1BA1B
Source: IPCC SRES

Global Population ProjectionsGlobal Population ProjectionsWorld Population (SRES, n=40) (pre SRES, n=62)
1940 1960 1980 2000 2020 2040 2060 2080 2100
billi
on
0
5
10
15
20pre SRES range
SRES
pre
SR
ES
Source: Source: NakicenovicNakicenovic et al., 2006et al., 2006

Global Population ProjectionsGlobal Population ProjectionsWorld Population (post SRES, n=168) (pre SRES, n=62)
1940 1960 1980 2000 2020 2040 2060 2080 2100
billi
on
0
5
10
15
20pre SRES range
post
SR
ES
pre
SR
ES
Source: Source: NakicenovicNakicenovic et al., 2006et al., 2006

Source: Source: NakicenovicNakicenovic et al., 2006et al., 2006
Global Population ProjectionsGlobal Population ProjectionsWorld Population (post SRES, non intervention, n=64)
1940 1960 1980 2000 2020 2040 2060 2080 2100
billi
on
0
5
10
15
20
post SRES, non intervention range
Median
pre SRES range
post
SR
ES
pre
SR
ES

Gross World ProductGross World ProductRange Across Emissions ScenariosRange Across Emissions Scenarios
World GDP (SRES, n=40) (pre SRES, n=151)
1940 1960 1980 2000 2020 2040 2060 2080 2100
trillio
n 19
90$
0
100
200
300
400
500
600
700
800pre SRES range
SRES
pre
SR
ES
Source: Source: NakicenovicNakicenovic et al., 2006et al., 2006

Gross World ProductGross World ProductRange Across Emissions ScenariosRange Across Emissions Scenarios
World GDP (post SRES, n=194) (pre SRES, n=151)
1940 1960 1980 2000 2020 2040 2060 2080 2100
trillio
n 19
90$
0
100
200
300
400
500
600
700
800pre SRES range
post
SR
ES
pre
SR
ES
Source: Source: NakicenovicNakicenovic et al., 2006et al., 2006
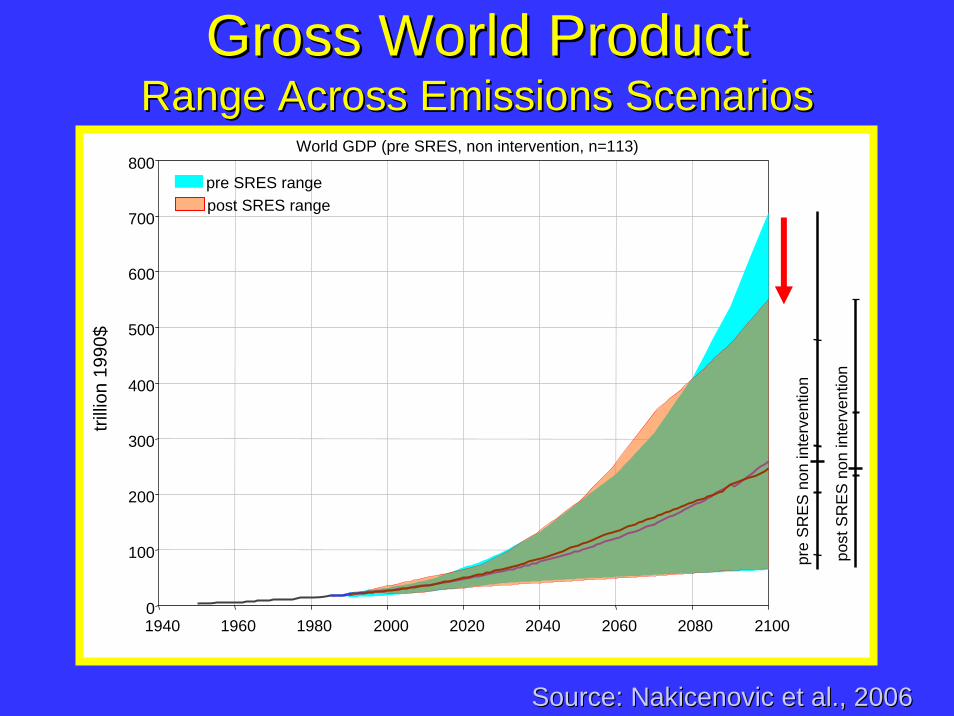
Gross World ProductGross World ProductRange Across Emissions ScenariosRange Across Emissions Scenarios
World GDP (pre SRES, non intervention, n=113)
1940 1960 1980 2000 2020 2040 2060 2080 2100
trillio
n19
90$
0
100
200
300
400
500
600
700
800
pre
SRES
non
inte
rven
tion
post
SR
ES
non
inte
rven
tion
pre SRES rangepost SRES range
Source: Source: NakicenovicNakicenovic et al., 2006et al., 2006

Carbon EmissionsCarbon EmissionsRange Across Emissions ScenariosRange Across Emissions Scenarios
World CO2 emissions (pre SRES, non intervention, n=199)
1940 1960 1980 2000 2020 2040 2060 2080 2100
Gt C
0
10
20
30
40
50
60
70
80
pre
SR
ES
non
inte
rven
tion
Source: Source: NakicenovicNakicenovic et al., 2006et al., 2006

World CO2 emissions (tar, intervention, n=80) (SRES, n=40)
1940 1960 1980 2000 2020 2040 2060 2080 2100
Gt C
0
10
20
30
40
50
60
70
80SRES range
Carbon EmissionsCarbon EmissionsTAR Intervention ScenariosTAR Intervention Scenarios
Source: Source: NakicenovicNakicenovic et al., 2006et al., 2006

16
A1B
450450550550650650Baseline
10203040
02000 2050 2100
AIFI
450450550550650650750750
Baseline
2000 2050 2100
10203040
0
A1T
Baseline
450450550550650650
2000 2050 2100
10203040
0
A2
550550750750
2000 2050 2100
Baseline
10203040
0
B1
450450550550Baseline
2000 2050 2100
10203040
0
B2
450450550550650650Baseline
2000 2050 2100
10203040
0
CO
2em
issi
on (G
tC)
Difficulty of CO2 reduction depends on Difficulty of CO2 reduction depends on development path for future worlddevelopment path for future world
A1FI and A2 require much larger reduction than A1T and B1

17
Major findings of Post-SRES
• Different development paths require different technology/ policy measures and show different costs of mitigation to stabilize atmospheric CO2 concentrations
• A portfolio of measures required for timely development, adoption and diffusion of mitigation options; Policy integration across an array of technologies, sectors and regions is the key to successful climate policies
• However, associated socio-economic and institutional changes are required to realize the potential for the above stabilization in practice

18
Issues after Post-SRES
• Greater need for the linkage of emission and impact analysis– Appropriate criteria of stabilization targets (ex. GHG
concentration, radiative forcing, temperature change, rate of temperature change, sea level rise, rate of sea level rise)
– Timing of mitigation (early vs. late)
• Uncertainty in future technological advances (risks of mitigation in later stage)
• Specific mitigation implementation strategies for achieving targets of 550 ppmv, 450 ppmv, etc.

19
Recent Stabilization Scenarios
• Global level studies– e.g. MA, UNEP/GEO, EMF21, IEA/Energy to 2050,
• Country level studies– Each country focusing on its own mitigation targets and
ways to achieve them
• Sector focused analysis– e.g. OECD/Environmentally Sustainable Transport

20
Framework of MAFramework of MA(Millennium ecosystem assessment)(Millennium ecosystem assessment)
Primary Drivers• Demographic Change• Economic Change • Social and Political Change• Technological change• Lifestyle and Behavioral
change
Proximate Drivers• Climate Change• Land Use & Cover Change• Factor inputs• Pollution• Nutrient Release• Species Introductions• Harvest
Ecosystems & their Services
• Supporting (Biodiversity and ecosystem processes)
• Provisioning (Food, water,fiber, fuel, other biological products)
• Enriching (Cultural, aesthetic)
Human Well-being & Poverty Reduction
• Health and disease• Environmental Security• Cultural Security• Economic Security• Equity
= Strategies and Interventions
Impact of
responses
Life on earth
21
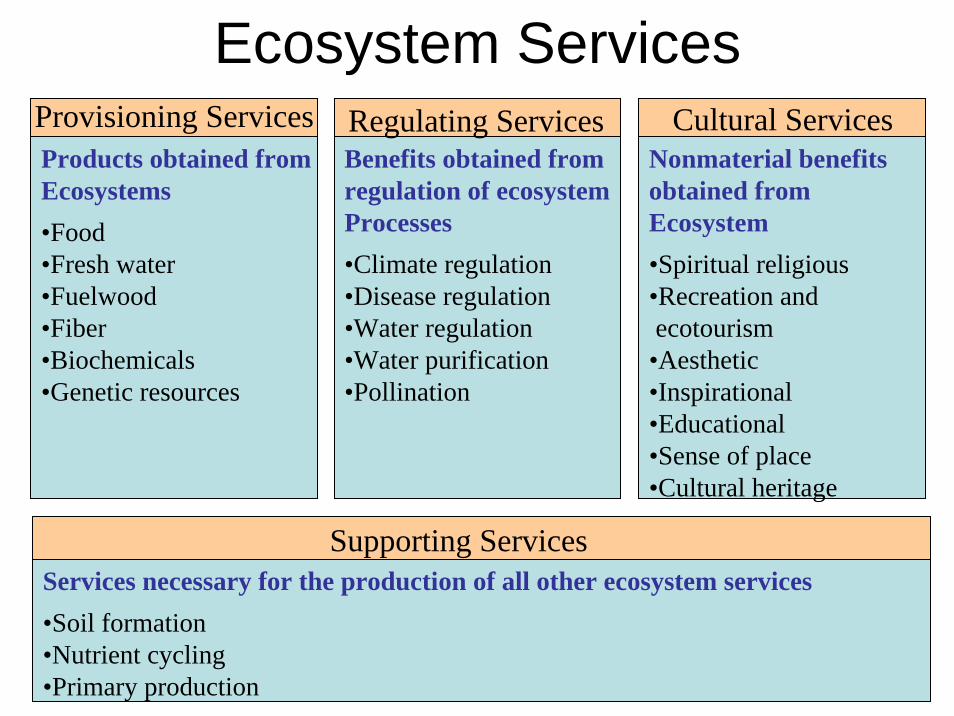
Cultural Services
Supporting Services
Ecosystem Services
Products obtained fromEcosystems•Food•Fresh water•Fuelwood•Fiber•Biochemicals•Genetic resources
Benefits obtained fromregulation of ecosystemProcesses•Climate regulation•Disease regulation•Water regulation•Water purification•Pollination
Nonmaterial benefits obtained fromEcosystem•Spiritual religious•Recreation and ecotourism•Aesthetic•Inspirational•Educational•Sense of place•Cultural heritage
Services necessary for the production of all other ecosystem services•Soil formation•Nutrient cycling•Primary production
Regulating ServicesProvisioning Services

22
Globally Connected
Regional Focus
Proactive ReactiveApproach to environmental management
Inst
itutio
ns
TechnogardenFocus:
Environmentaltechnology
GlobalOrchestration
Focus: Social policy
Adapting MosaicFocus:
Active learning
Order from StrengthFocus:
Self interest
Frame of MA Scenarios

23
Global Orchestration (GO)
Order from Strength (OS)
TechnoGarden(TG)
Adaptive Mosaic (AM)
2000 2100
0 20 40 60 80 100 ~(%)
1 5 10
0 20 40 60 80 100 ~(%)
1 5 10
-In general, the order of stress is OS > AM > GO > TG
Withdrawal: driven by socio-economic factorsWater resource: driven by climate factorsGeneral trend of stress index change can be explained by demand side.
-Middle East and North AfricaHigh drought risk ← water demand increase derived from population increase and economic development. Mitigated in TG ← high efficiency of water use.
-East EuropeHigh draught risk inGO ←high rate increase of industrial water withdrawal which cannot be compensated with the water use efficiency improvement.
Water Stress IndexWater Stress Index(ratio between total withdrawal(ratio between total withdrawaland renewable water resource)and renewable water resource)

UNEP/GEO4 Meeting 2005
The Background of UNEP/GEO
•The UNEP GEO project was initiated in response to
•Environmental reporting requirements of Agenda 21
•UNEP governing council decision of May 1995
•The coordinated global network of collaborating centers (CCs) isat the core of the GEO process
•Reports are produced using regional and participatory approach

UNEP/GEO4 Meeting 2005
Key Questions and Elements
The Outlook
•The extent and direction of opportunities (actions) would determine different out looks for the future.
•GEO 4 will explore possible futures
•Markets first, Policy first, Security first, Sustainability first
•Regional differentiation and regional and global implications to be explored
•Implications of decisions made today

UNEP/GEO4 Meeting 2005
Proposed Plan for the Outlook Component of GEO-4
Proposed Purpose and Key Questions•Where does each scenario stand in relation to specific goals?
•What are intermediate and long-term implications of current (and already taken) actions?
•What are the contrasting ‘costs’ (in a broad sense) for achieving particular sustainability goals under the scenarios?
•How, and how well, can different actors/regions respond to a future shock/disturbance/new insight/concern under the different scenarios?

Asia Pacific Integrated Modeling Team
Some GEO 3 Outlook Results
-100%
-50%
0%
50%
100%
150%
200%
250%
300%M
FPO SC SU M
FPO SC SU M
FPO SC SU M
FPO SC SU M
FPO SC SU
Afghanistan BangladeshBhutan IndiaIran MaldivesNepal PakistanSri Lanka BruneiCambodia IndonesiaLao MalaysiaMyanmar PhilippinesSingapore ThailandVietnam ChinaKorea,Dem JapanKorea,Rep MongoliaTaiwan KazakhstanKyrgyz Republic TajikistanTurkmenistan UzbekistanAustralia New ZealandFiji KiribatiNauru PalauPapua New Guinea French PolynesiaTonga VanuatuSamoa Solomon Islands
SouthEast AsiaSouth Asia East Asia Central Asia
ANZ and SouthPacific
MF: market first, PO: policy first, SC: security first, SU: sustainability first
Change in energy-related SO2 emissions by 2032 relative to 2002 (%)
Focus on regional environmental changes

Asia Pacific Integrated Modeling Team
Example: Access to safe water/sanitation by AIM/Water
Request for StorylineMillennium Development Goals 7, Target 10: Halve by 2015 the proportion of people without sustainable access to safe drinking water and basic sanitation
►►► Timing of MDG achievement ►►► Quality of safe water/sanitation technologies or investment cost
QuantificationConsistency check between access to safe water/sanitation by technology, investment costs and MDG achievementPotential mortality of diarrhea
Focus on Short-term (2015) and Medium-term (2050)

Asia Pacific Integrated Modeling Team
Access to safe water in 2015 and 2050
0
20
40
60
80
100
2000
Mar
kets
Pol
icy
Sec
urity
Sus
tain
abili
ty20
00M
arke
tsP
olic
yS
ecur
ityS
usta
inab
ility
2000
Mar
kets
Pol
icy
Sec
urity
Sus
tain
abili
ty20
00M
arke
tsP
olic
yS
ecur
ityS
usta
inab
ility
2000
Mar
kets
Pol
icy
Sec
urity
Sus
tain
abili
ty20
00M
arke
tsP
olic
yS
ecur
ityS
usta
inab
ility
Australiaand NewZealand
CentralAsia
North WestPacific andEast Asia
South Asia South EastAsia
SouthPacific
Acc
ess
to s
afe
wat
er (%
)
2015
2015PF scenario in every sub-region except South Pacific achieves MDG due to fully investment cost and
SuF scenario achieves MDG in some sub-regions.MF only achieves MDG in Northwest Pacific and East Asia and SeF scenario fail to achieve MDG.
Austria and New Zealand already have 100% access to safe water.
2050In Northwest Pacific and East Asia, four scenario almost achieve 100% access to safe water based
on rapid economic growthIn other sub-regions, growth of access to safe water coverage stagnates because of rapid population
growth, investment cost limitation and rise of investment cost for household connection
0
20
40
60
80
100
2000
Mar
kets
Pol
icy
Sec
urity
Sus
tain
abili
ty20
00M
arke
tsP
olic
yS
ecur
ityS
usta
inab
ility
2000
Mar
kets
Pol
icy
Sec
urity
Sus
tain
abili
ty20
00M
arke
tsP
olic
yS
ecur
ityS
usta
inab
ility
2000
Mar
kets
Pol
icy
Sec
urity
Sus
tain
abili
ty20
00M
arke
tsP
olic
yS
ecur
ityS
usta
inab
ility
Australiaand NewZealand
CentralAsia
North WestPacific andEast Asia
South Asia South EastAsia
SouthPacific
Acc
ess
to s
afe
wat
er (%
)
2050
Millennium Development Goal (MDG), Goal 7, Target 10: Halve by 2015 the proportion of people without sustainable access to safe drinking water and basic sanitation

30
Forecasting from now and Backcasting from Forecasting from now and Backcasting from future prescribed/normative worldfuture prescribed/normative world
2020 20502000
Checkingyear
Long-term target year
Release of the study result
Technology development,socio-economic change projected by well calibrated dynamic models
Forecasting
Backcasting
Normative target world
Reference future world (BaU)
Service demand change
by changing social behavior, lifestyles
and institutions
Mitigation Technology
developmentRequiredTrend breaking
Intervention and Investment
Calculation of required intervention by dynamic models
Envi
ronm
enta
l pre
ssur
e
Sufficient calibration in order to reflect historical trends

31
How much speed of technological change should be required to achieve
Low Carbon Society?
E : Primary energy use, E/GDP: Energy intensity
CO2/E : Carbon intensity
CO2 = (CO2/E) x (E/GDP) x GDP
- Comparison of scenarios -
CO2 emission disaggregation by Kaya identity
32–3 –2 –1 0
–3
–2
–1
0
Carbon intensity (%/y)
Ene
rgy
inte
nsity
(%/y
)
Japan(90–00)
France
Germany
UK60-00
Japan(90–00)
60-0060-00
50% reduction
60% reduction
70% reduction
80% reduction
90% reduction
Switchover
B2
Revival
Saving energy
Combine option
(90–00)
(90–00)
(90–00)
40% reduction
30% reduction
20% reduction
Rage of Energy Intensity Changes in
last 40 years
GHG reduction in next 50 years with the
assumption of 1% GDP growth
Scenarios of UK, Germany and France toward
Range of Carbon
Intensity in last 40 years
A
B
Cha
nge
of E
nerg
y In
tens
ity o
f GD
P (
%/y
ear)
Change of Carbon Intensity of Energy (%/year)
How fast GHG emissions should be reduced?
Japanese 70% reduction scenario

33
• To achieve ambitious target of a 50-90% CO2 emission reduction, the pace of aggregated energy intensity improvement and carbon intensity decrease must be 2-3 times greater than the 40-year historical change, while the change rates should be maintained for 50 years.
• We need ‘trend-braking’ intervention. What and How?
• Scenarios can help to foresee the future world and provide lessons from the future.
Summary

34
Thank you for your attention!


