February 2018
LABOUR MARKET
OUTCOMES OF ALBERTA’S APPRENTICESHIP AND INDUSTRY TRAINING SYSTEM
Report on the Results of the Benefits to Post-Secondary Education Project
Labour Market Outcomes of Alberta’ Apprenticeship and Industry Training System
ISBN 978-1-4601-3814-4
© 2018 Government of Alberta Created by: Alberta Advanced Education Last updated: February 22, 2018
For more information about this document, contact: Strategic Integration Policy Branch 5th Floor, Commerce Place 10155 102 Street NW Edmonton, AB, T6H 4G8 Email: [email protected]
This document is made available under the Open Government Licence – Alberta (http://open.alberta.ca/licence)
This document is available online at: http://open.alberta.ca/publications/9781460138144

ACKNOWLEDGEMENTS Alberta Advanced Education wishes to thank the Council of Ministers of Education Canada for their
contributions to this project. Advanced Education would also like to thank Statistics Canada for their
partnership and continued support that made this project possible.

TABLE OF CONTENTS
Executive Summary ...................................................................................................................... 1
Overall ......................................................................................................................................... 1
Completers versus Qualifiers ...................................................................................................... 1
Completers .................................................................................................................................. 1
Introduction .................................................................................................................................... 2
Definitions ................................................................................................................................ 2
Overview ......................................................................................................................................... 3
Analysis .......................................................................................................................................... 4
Results ............................................................................................................................................ 6
Route to Certification ................................................................................................................... 6
Completers Over Time............................................................................................................. 8
Completers Starting Income .................................................................................................... 9
Trade Group .......................................................................................................................... 10
Parent Trade .............................................................................................................................. 11
Top Paying Trades ................................................................................................................ 11
Lowest Paying Trades ........................................................................................................... 12
Compulsory and Optional Trades .......................................................................................... 12
Earning Potential and Income Patterns ................................................................................. 12
Conclusions ................................................................................................................................. 15
Appendix A: Methodology and Limitations .............................................................................. 16
Methodology .............................................................................................................................. 16
Limitations .................................................................................................................................. 17
Appendix B: Trade Group Classification .................................................................................. 18
Appendix C: Median Income, Cell Counts, and Response/ Exclusion Rates ....................... 19
Labour Market Outcomes of Alberta’s Apprenticeship and Industry Training System | alberta.ca | February 2018 1
EXECUTIVE SUMMARY
The Benefits to Post-Secondary Education Project (BPSEP) examines employment earnings of
individuals certified through Alberta’s apprenticeship and industry training system. Administrative
data was linked to tax records to determine median incomes over time. The project included
individuals, certified in a designated trade or occupation in Alberta between 2005 and 2013, who
reported employment earnings in the 2006 to 2014 tax years. The project follows individuals
certified in each year (cohort) over time.
The results provide an indication of the long-term benefits of trade certification based on annual
earnings. They provide accurate, reliable data that builds on and validates existing survey data.
Past survey data is self-reported and based on a point in time. This project, for the first time,
employs a data matching process and follows certified individuals over time. The results support
policy development and accountability related to Alberta’s apprenticeship program. The project is,
however, limited in scope to those certified individuals who file personal income taxes in the project
study years. Self-employed individuals are not included. The number of hours worked and the job
in which they are employed are unknown.
Overall
The results indicate that there is considerable variability in the median income of those certified
through Alberta’s apprenticeship industry training system. The variability occurs between trades
and between years of certification. Income patterns over time are characterized by fluctuations.
The magnitude of those fluctuations depends on the route to certification, trade, and to some extent
year of certification. This suggests that in some trades, median incomes may fluctuate with changes
in economic conditions - in some cases, quickly and dramatically. Changing economic conditions
may affect the availability of work and the hours worked, which in turn, may influence median
incomes. Further research is needed to understand these fluctuations in income.
Completers versus Qualifiers
Individuals who have completed an apprenticeship program (completers) have different earning
potential and median income patterns than those certified through the Qualification Program
(qualifiers). Generally, qualifiers have higher median incomes that tend to be more variable from
year to year.
Completers
The median income of completers has been increasing since 2005. There are a few years in which
earnings decrease, but these are typically followed by recovery and growth. The median income of
completers one year after graduation tends to increase for each graduation cohort over time.
A higher number of years since certification does not necessarily mean higher earnings. Income
growth patterns vary widely among the trades. Most trades are characterized by increases and
decreases from year to year. However, earnings in some trades are more volatile than others.

Labour Market Outcomes of Alberta’s Apprenticeship and Industry Training System | alberta.ca | February 2018 2
INTRODUCTION
The Benefits to Post-Secondary Education Project (BPSEP) is a new research project led by
Alberta Advanced Education in partnership with Statistics Canada that is intended to fill information
gaps related to the labour market outcomes of Alberta’s post-secondary graduates. This report
focuses on income outcomes of those certified through Alberta’s apprenticeship and industry
training system. It provides insight on graduates’ initial performance in the labour market, as well
as long term earning potential.
To date, data on employment income has been collected solely through a biennial survey of
apprentice graduates. This project, for the first time, linked data to track employment income of
those certified over time. Although the survey cohort is different from those tracked here, the two
approaches deliver similar results with incomes varying by 10% on average over the four survey
years compared (2005/06, 2007/08, 2009/10 and 2011/12).
For income information on graduates of other post-secondary programs see: Labour Market
Outcomes of Graduates of Alberta Post-Secondary Institutions.
Definitions
Designated Trade: An occupation designated under the Apprenticeship and Industry Training Act
by Lieutenant Governor in Council on the recommendation of industry, the Alberta Apprenticeship
and Industry Training Board, and the Minister of Advanced Education. The legislation provides for
apprenticeship programs and certification of tradespeople as evidence that their qualifications meet
the industry-established standards for the trade.
Designated Occupation: An occupation designated under the Apprenticeship and Industry Training
Act by the Minister of Advanced Education on the recommendation of industry and the Alberta
Apprenticeship and Industry Training Board. Designated occupations have clearly identified
competencies. When an individual has achieved the occupation’s identified competencies, the
Minister grants an Occupational Certificate. Participation in a designated occupation is voluntary
and a certificate is not required by law for an individual to work in the occupation.
For more information on Alberta’s designated trades and occupations, go to:
https://tradesecrets.alberta.ca
Completer: An individual who either completed the requirements of an apprenticeship program in
a designated trade or was granted an occupation certificate.
Qualifier: An individual granted a Qualification Certificate who, through an assessment of their prior
work experience, knowledge and skills in a designated trade, demonstrates he/she meets the
standards set for certification in Alberta. These individuals have not completed an apprenticeship
program.
Tax year: Income earned between January 1 and December 31 of a given year.
Cohort: Group of individuals who became certified through Alberta’s apprenticeship and industry
training system between January 1 and December 31 in a given calendar year.

Labour Market Outcomes of Alberta’s Apprenticeship and Industry Training System | alberta.ca | February 2018 3
OVERVIEW
Individuals who achieved certification through Alberta’s apprenticeship and industry training system
between 2005 and 2013 (inclusive) were followed over time to study the dynamics of their
employment income. Statistics Canada’s T1 Family File (T1FF) was used to determine employment
income beginning the first year following certification. Three methods of data collection were used
in the overall study, cross-sectional, longitudinal and true longitudinal, but only results of true
longitudinal approach are reported here. (See Appendix A for more details about methodology and
exclusion criteria.) Results from the true longitudinal method include only individuals who
consistently filed personal income taxes in every year of the study period after certification. In
addition, individuals who reported self-employment earnings in any of the project’s study years, or
who have returned to study or earned another credential since certification are not included in the
results reported here.
This report describes employment incomes based on data matching but does not make causal
claims. Further research is needed to better understand the factors affecting earnings over time.
Individuals included in this project may have obtained additional credentials prior to becoming
certified in a designated trade or occupation. They also may be certified in more than one trade,
however they are tracked in the trade in which they are most recently certified. In addition, it is
important to note that tax files do not indicate the number of hours tax filers worked nor the type of
work/job in which they are employed over the project period. Although they have been certified in
a designated trade or occupation at some point, they may not have continued working in that
trade/occupation.
The impact of economic conditions on employment earnings in the trades is also unknown.
However, the unemployment rate and employment insurance (EI) uptake in Alberta for the study
period are included in Figure 1 for context in considering the results reported here. The
unemployment rate and EI uptake peaked in 2009 and fell between 2010 and 2012.
Labour Market Outcomes of Alberta’s Apprenticeship and Industry Training System | alberta.ca | February 2018 4
ANALYSIS
Median income was used to represent earnings for each cohort (each cohort is represented by a
unique color in the Figures in this report). Median income is a good indicator of how a ‘typical’
graduate is doing – half of the cohort is earning above the median income and half is earning below.
The advantage of using median income is that outliers (highest and lowest earners) will not skew
income figures, as they would if using averages. Median incomes are rounded to the nearest $100
and expressed in real 2015 dollars using the Alberta Consumer Price Index All-Items (CPI).
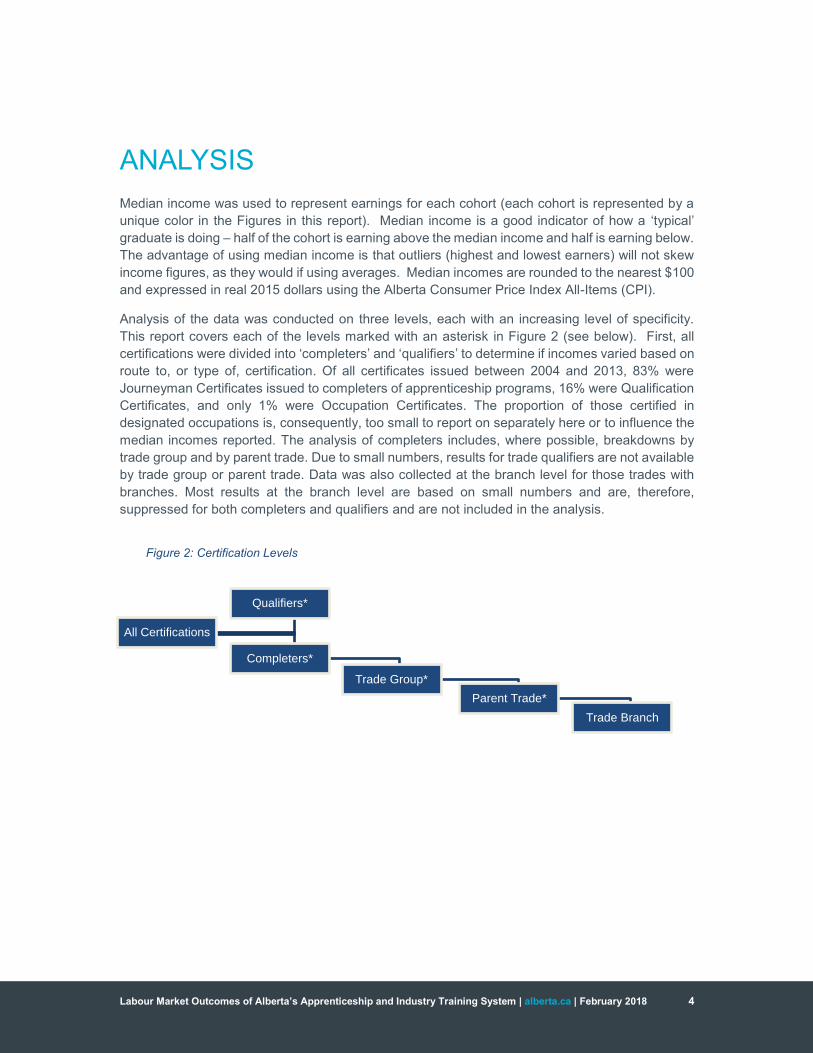
Analysis of the data was conducted on three levels, each with an increasing level of specificity.
This report covers each of the levels marked with an asterisk in Figure 2 (see below). First, all
certifications were divided into ‘completers’ and ‘qualifiers’ to determine if incomes varied based on
route to, or type of, certification. Of all certificates issued between 2004 and 2013, 83% were
Journeyman Certificates issued to completers of apprenticeship programs, 16% were Qualification
Certificates, and only 1% were Occupation Certificates. The proportion of those certified in
designated occupations is, consequently, too small to report on separately here or to influence the
median incomes reported. The analysis of completers includes, where possible, breakdowns by
trade group and by parent trade. Due to small numbers, results for trade qualifiers are not available
by trade group or parent trade. Data was also collected at the branch level for those trades with
branches. Most results at the branch level are based on small numbers and are, therefore,
suppressed for both completers and qualifiers and are not included in the analysis.
All Certifications
Qualifiers*
Completers*
Trade Group*
Parent Trade*
Trade Branch
Figure 2: Certification Levels
Labour Market Outcomes of Alberta’s Apprenticeship and Industry Training System | alberta.ca | February 2018 5
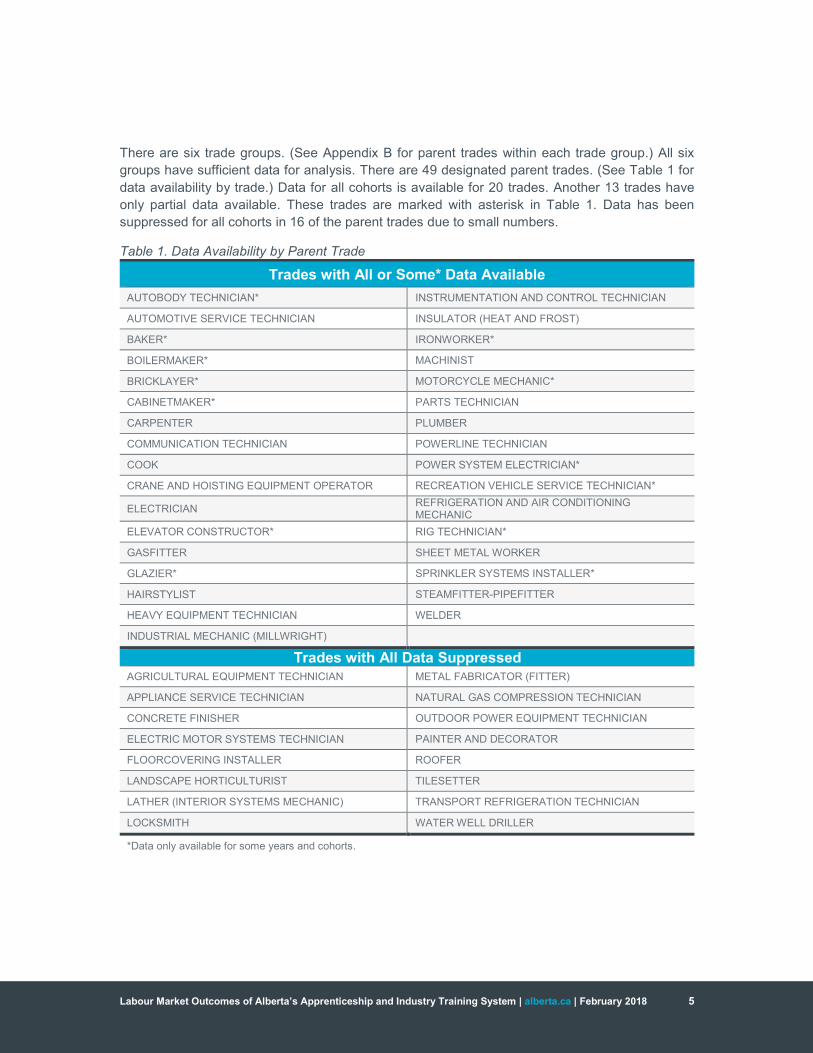
There are six trade groups. (See Appendix B for parent trades within each trade group.) All six
groups have sufficient data for analysis. There are 49 designated parent trades. (See Table 1 for
data availability by trade.) Data for all cohorts is available for 20 trades. Another 13 trades have
only partial data available. These trades are marked with asterisk in Table 1. Data has been
suppressed for all cohorts in 16 of the parent trades due to small numbers.
Table 1. Data Availability by Parent Trade
Trades with All or Some* Data Available
AUTOBODY TECHNICIAN* INSTRUMENTATION AND CONTROL TECHNICIAN
AUTOMOTIVE SERVICE TECHNICIAN INSULATOR (HEAT AND FROST)
BAKER* IRONWORKER*
BOILERMAKER* MACHINIST
BRICKLAYER* MOTORCYCLE MECHANIC*
CABINETMAKER* PARTS TECHNICIAN
CARPENTER PLUMBER
COMMUNICATION TECHNICIAN POWERLINE TECHNICIAN
COOK POWER SYSTEM ELECTRICIAN*
CRANE AND HOISTING EQUIPMENT OPERATOR RECREATION VEHICLE SERVICE TECHNICIAN*
ELECTRICIAN REFRIGERATION AND AIR CONDITIONING MECHANIC
ELEVATOR CONSTRUCTOR* RIG TECHNICIAN*
GASFITTER SHEET METAL WORKER
GLAZIER* SPRINKLER SYSTEMS INSTALLER*
HAIRSTYLIST STEAMFITTER-PIPEFITTER
HEAVY EQUIPMENT TECHNICIAN WELDER
INDUSTRIAL MECHANIC (MILLWRIGHT)
Trades with All Data Suppressed
AGRICULTURAL EQUIPMENT TECHNICIAN METAL FABRICATOR (FITTER)
APPLIANCE SERVICE TECHNICIAN NATURAL GAS COMPRESSION TECHNICIAN
CONCRETE FINISHER OUTDOOR POWER EQUIPMENT TECHNICIAN
ELECTRIC MOTOR SYSTEMS TECHNICIAN PAINTER AND DECORATOR
FLOORCOVERING INSTALLER ROOFER
LANDSCAPE HORTICULTURIST TILESETTER
LATHER (INTERIOR SYSTEMS MECHANIC) TRANSPORT REFRIGERATION TECHNICIAN
LOCKSMITH WATER WELL DRILLER
*Data only available for some years and cohorts.
Labour Market Outcomes of Alberta’s Apprenticeship and Industry Training System | alberta.ca | February 2018 6
RESULTS1
Route to Certification
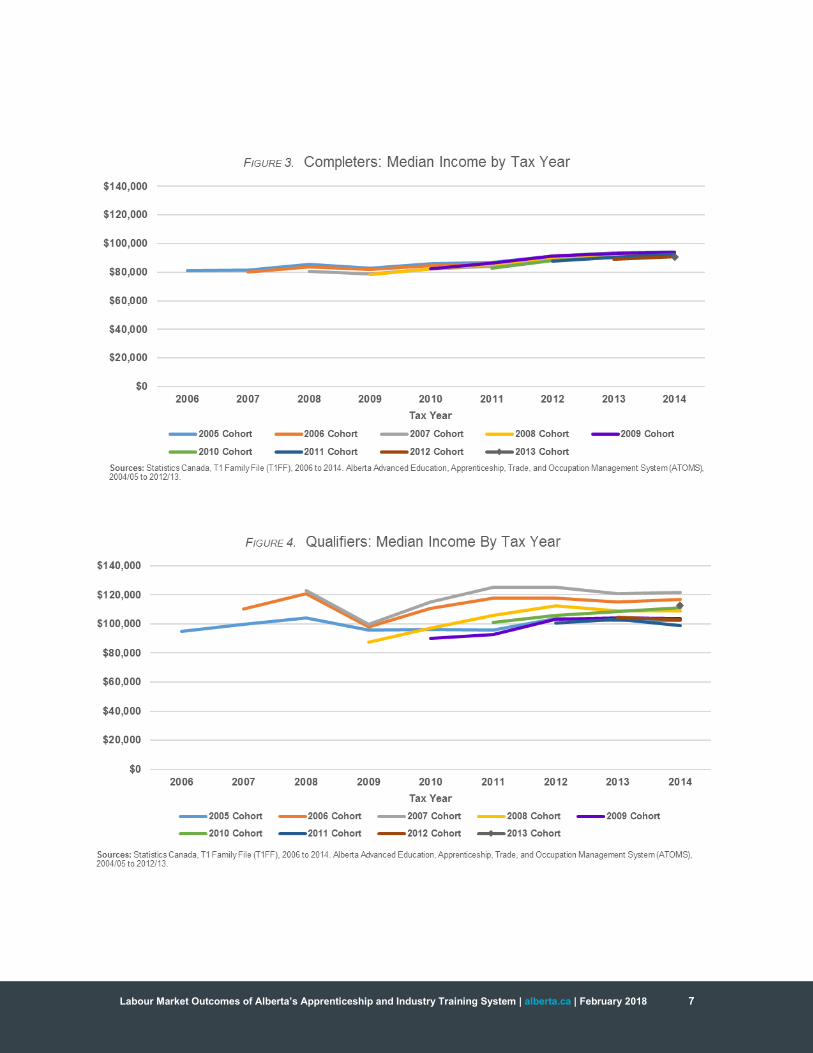
Completers and qualifiers have different median income patterns (See Figures 3 and 4; shown on
the same scale to reflect the differences). The median income of qualifiers shows more volatility
from year to year. (Note: Some variation may be due to the smaller numbers of qualifiers in the
data. See valid counts in Appendix C).
Overall completers of Alberta’s apprenticeship programs between 2005 and 2013 have a median
income ranging from $78,400 to $94,100. Employment earnings for qualifiers are higher, but are
more varied by cohort and year. Median income for qualifiers ranges from $87,300 to $125,400.
Although both groups experience temporary decreases in income, followed by recovery and
growth, the magnitude of change is generally higher for qualifiers than completers. For example,
there was a decrease in income for both completers and qualifiers between 2008 and 2009,
however the decrease is more pronounced for qualifiers.
While most completer cohorts are clustered close together depicting similar median incomes,
qualifier cohorts have more variation in median income. Most cohorts for both groups follow a
similar pattern – a decrease for one cohort is associated with decreases for all cohorts – but the
magnitude of decrease may be different among qualifier cohorts. For example, the 2005, 2006 and
2007 qualifier cohorts all experienced a decrease between 2008 and 2009, but the magnitude of
decrease is much larger for the 2006 and 2007 cohort than the 2005 cohort.
1 (See Appendix C for median income, cell counts, and response and exclusion rates for figures presented in report).
Labour Market Outcomes of Alberta’s Apprenticeship and Industry Training System | alberta.ca | February 2018 7
Labour Market Outcomes of Alberta’s Apprenticeship and Industry Training System | alberta.ca | February 2018 8
Completers Over Time
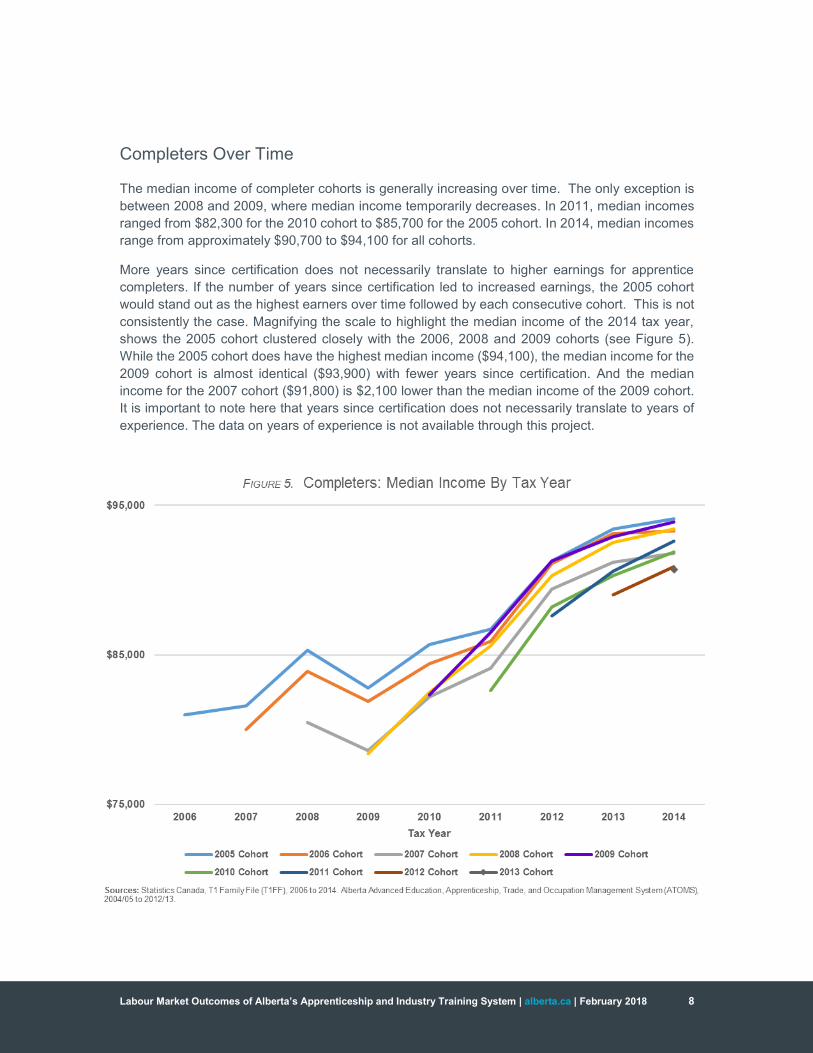
The median income of completer cohorts is generally increasing over time. The only exception is
between 2008 and 2009, where median income temporarily decreases. In 2011, median incomes
ranged from $82,300 for the 2010 cohort to $85,700 for the 2005 cohort. In 2014, median incomes
range from approximately $90,700 to $94,100 for all cohorts.
More years since certification does not necessarily translate to higher earnings for apprentice
completers. If the number of years since certification led to increased earnings, the 2005 cohort
would stand out as the highest earners over time followed by each consecutive cohort. This is not
consistently the case. Magnifying the scale to highlight the median income of the 2014 tax year,
shows the 2005 cohort clustered closely with the 2006, 2008 and 2009 cohorts (see Figure 5).
While the 2005 cohort does have the highest median income ($94,100), the median income for the
2009 cohort is almost identical ($93,900) with fewer years since certification. And the median
income for the 2007 cohort ($91,800) is $2,100 lower than the median income of the 2009 cohort.
It is important to note here that years since certification does not necessarily translate to years of
experience. The data on years of experience is not available through this project.
Labour Market Outcomes of Alberta’s Apprenticeship and Industry Training System | alberta.ca | February 2018 9
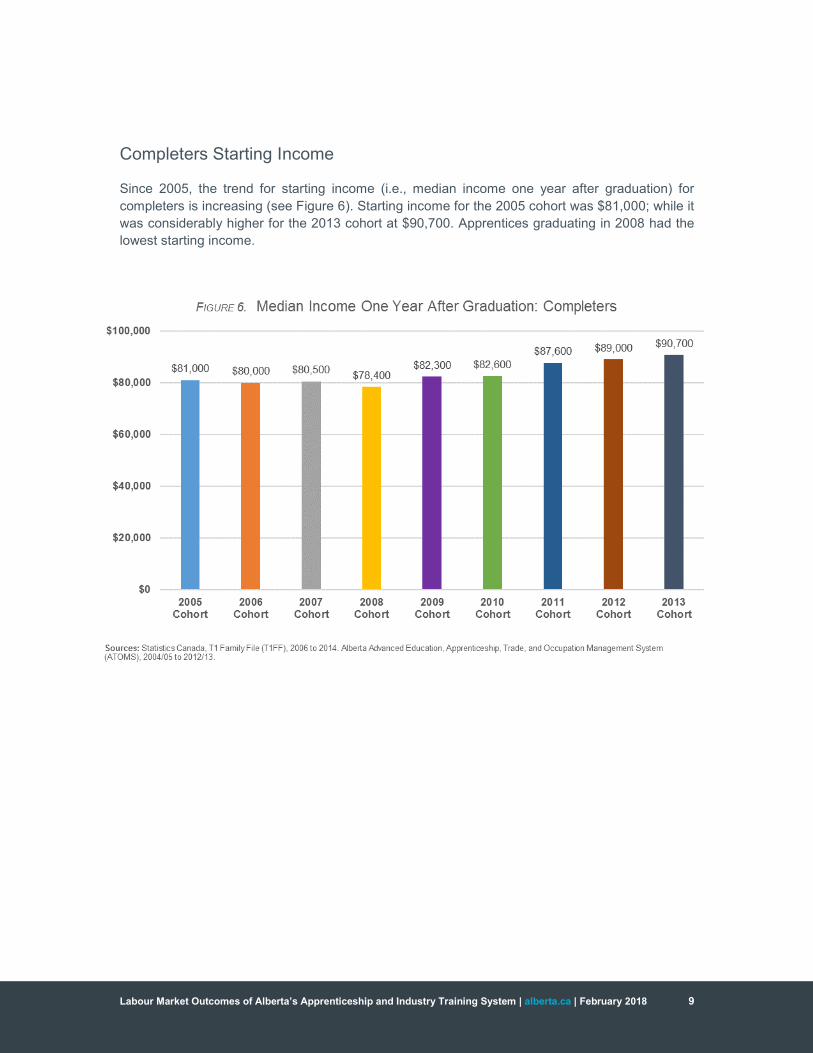
Completers Starting Income
Since 2005, the trend for starting income (i.e., median income one year after graduation) for
completers is increasing (see Figure 6). Starting income for the 2005 cohort was $81,000; while it
was considerably higher for the 2013 cohort at $90,700. Apprentices graduating in 2008 had the
lowest starting income.
Labour Market Outcomes of Alberta’s Apprenticeship and Industry Training System | alberta.ca | February 2018 10
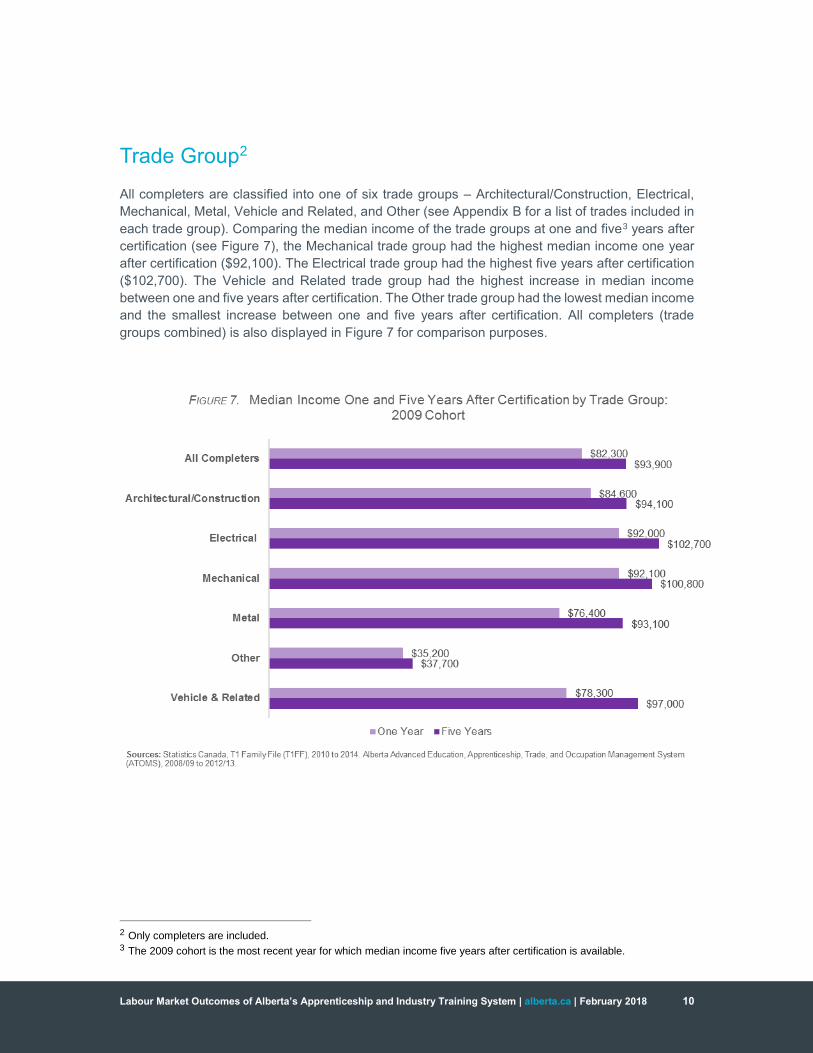
Trade Group2
All completers are classified into one of six trade groups – Architectural/Construction, Electrical,
Mechanical, Metal, Vehicle and Related, and Other (see Appendix B for a list of trades included in
each trade group). Comparing the median income of the trade groups at one and five3 years after
certification (see Figure 7), the Mechanical trade group had the highest median income one year
after certification ($92,100). The Electrical trade group had the highest five years after certification
($102,700). The Vehicle and Related trade group had the highest increase in median income
between one and five years after certification. The Other trade group had the lowest median income
and the smallest increase between one and five years after certification. All completers (trade
groups combined) is also displayed in Figure 7 for comparison purposes.
2 Only completers are included. 3 The 2009 cohort is the most recent year for which median income five years after certification is available.
Labour Market Outcomes of Alberta’s Apprenticeship and Industry Training System | alberta.ca | February 2018 11
Parent Trade4
Median income varies widely among the trades as does earning potential and patterns of income
growth. This also suggests that the economy may influence changes in income.
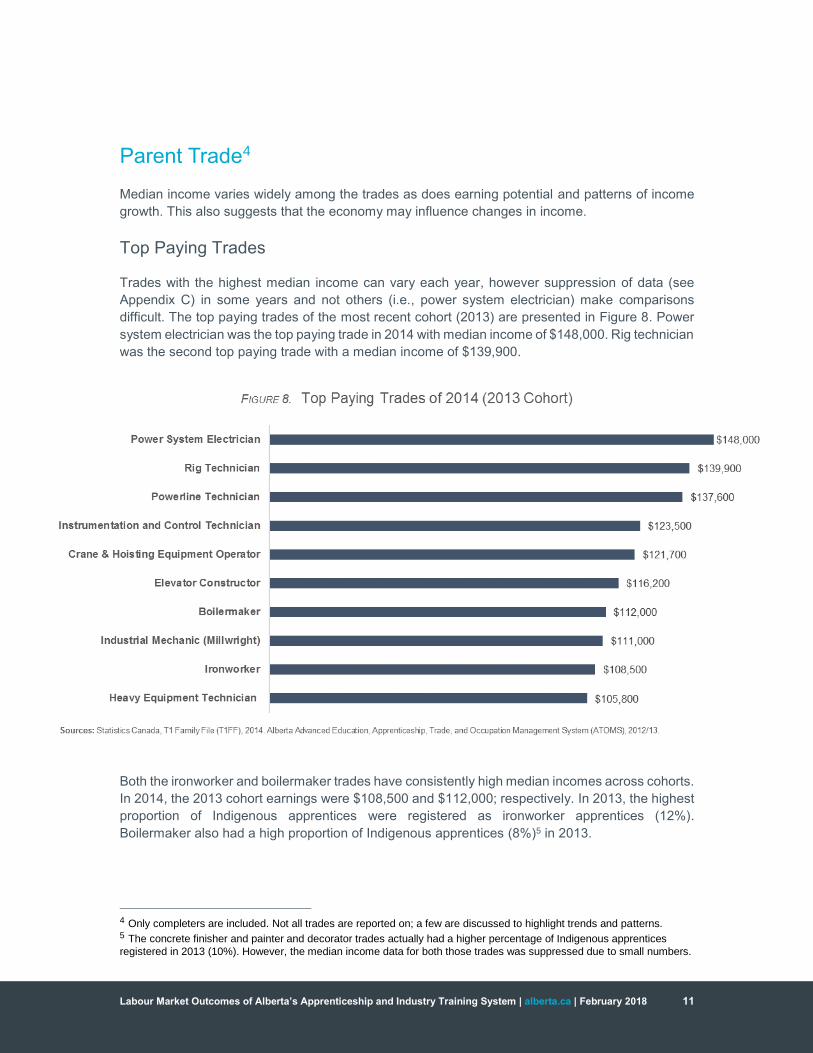
Top Paying Trades
Trades with the highest median income can vary each year, however suppression of data (see
Appendix C) in some years and not others (i.e., power system electrician) make comparisons
difficult. The top paying trades of the most recent cohort (2013) are presented in Figure 8. Power
system electrician was the top paying trade in 2014 with median income of $148,000. Rig technician
was the second top paying trade with a median income of $139,900.
Both the ironworker and boilermaker trades have consistently high median incomes across cohorts.
In 2014, the 2013 cohort earnings were $108,500 and $112,000; respectively. In 2013, the highest
proportion of Indigenous apprentices were registered as ironworker apprentices (12%).
Boilermaker also had a high proportion of Indigenous apprentices (8%)5 in 2013.
4 Only completers are included. Not all trades are reported on; a few are discussed to highlight trends and patterns. 5 The concrete finisher and painter and decorator trades actually had a higher percentage of Indigenous apprentices
registered in 2013 (10%). However, the median income data for both those trades was suppressed due to small numbers.
Labour Market Outcomes of Alberta’s Apprenticeship and Industry Training System | alberta.ca | February 2018 12
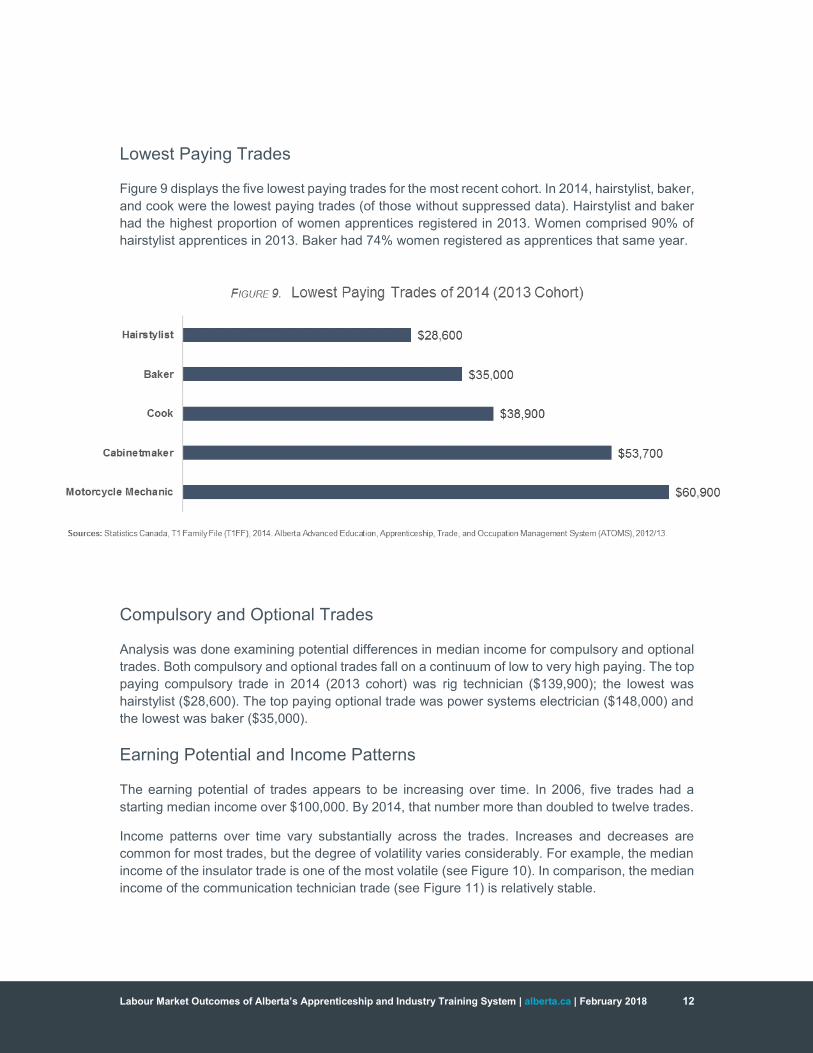
Lowest Paying Trades
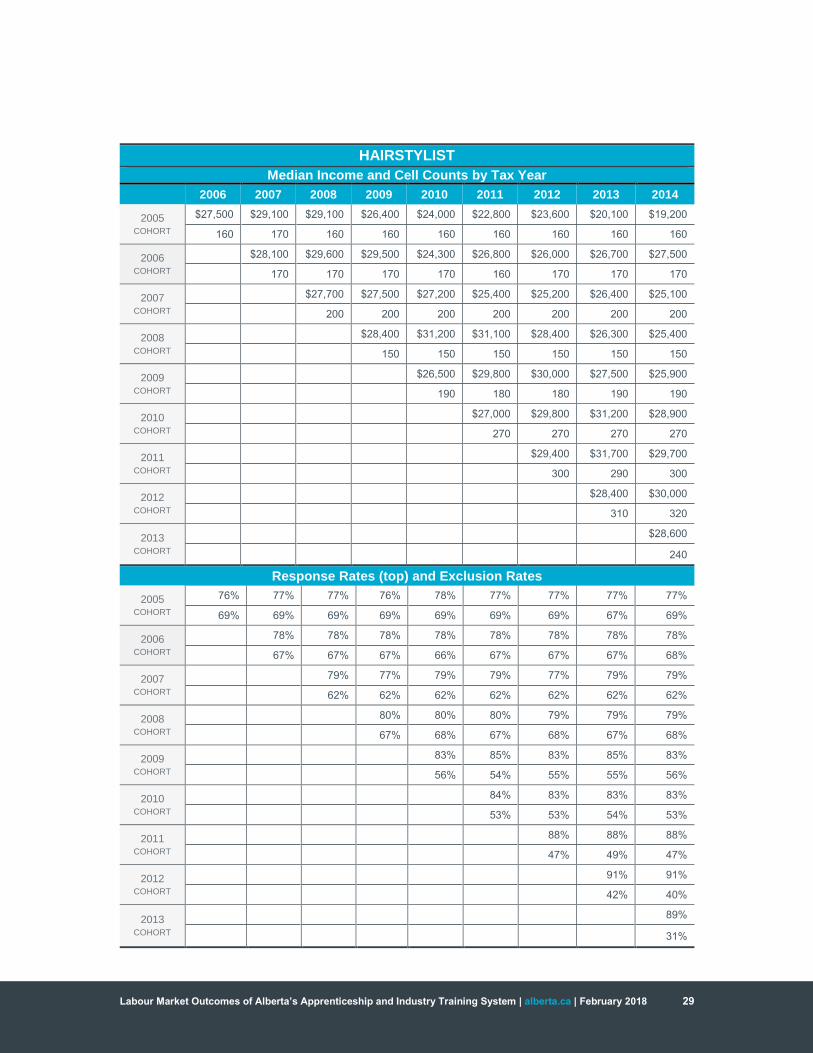
Figure 9 displays the five lowest paying trades for the most recent cohort. In 2014, hairstylist, baker,
and cook were the lowest paying trades (of those without suppressed data). Hairstylist and baker
had the highest proportion of women apprentices registered in 2013. Women comprised 90% of
hairstylist apprentices in 2013. Baker had 74% women registered as apprentices that same year.
Compulsory and Optional Trades
Analysis was done examining potential differences in median income for compulsory and optional
trades. Both compulsory and optional trades fall on a continuum of low to very high paying. The top
paying compulsory trade in 2014 (2013 cohort) was rig technician ($139,900); the lowest was
hairstylist ($28,600). The top paying optional trade was power systems electrician ($148,000) and
the lowest was baker ($35,000).
Earning Potential and Income Patterns
The earning potential of trades appears to be increasing over time. In 2006, five trades had a
starting median income over $100,000. By 2014, that number more than doubled to twelve trades.
Income patterns over time vary substantially across the trades. Increases and decreases are
common for most trades, but the degree of volatility varies considerably. For example, the median
income of the insulator trade is one of the most volatile (see Figure 10). In comparison, the median
income of the communication technician trade (see Figure 11) is relatively stable.

Labour Market Outcomes of Alberta’s Apprenticeship and Industry Training System | alberta.ca | February 2018 13
Labour Market Outcomes of Alberta’s Apprenticeship and Industry Training System | alberta.ca | February 2018 14
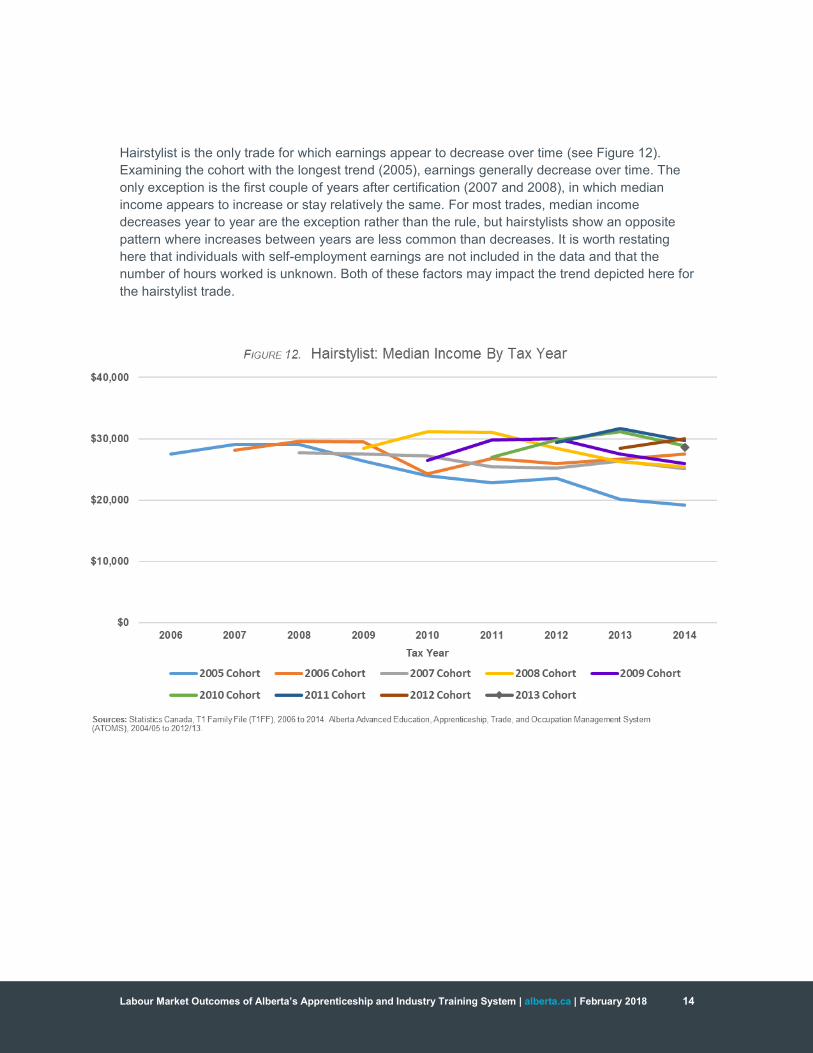
Hairstylist is the only trade for which earnings appear to decrease over time (see Figure 12).
Examining the cohort with the longest trend (2005), earnings generally decrease over time. The
only exception is the first couple of years after certification (2007 and 2008), in which median
income appears to increase or stay relatively the same. For most trades, median income
decreases year to year are the exception rather than the rule, but hairstylists show an opposite
pattern where increases between years are less common than decreases. It is worth restating
here that individuals with self-employment earnings are not included in the data and that the
number of hours worked is unknown. Both of these factors may impact the trend depicted here for
the hairstylist trade.

Labour Market Outcomes of Alberta’s Apprenticeship and Industry Training System | alberta.ca | February 2018 15
CONCLUSIONS
The Benefits to Post-Secondary Education Project (BPSEP) provides valuable insight into the
median income over time of individuals certified in a trade or occupation through Alberta’s
apprenticeship and industry training system. The data supports and validates previously conducted
surveys with self-reported income data. It also provides, for the first time, income data over time.
The information is also helpful to prospective students deciding whether to invest their time and
financial resources in an apprenticeship or another post-secondary program, and in deciding which
apprenticeship program. However, the job market can vary substantially over time. Findings should
be interpreted with caution if used in post-secondary planning. (Refer to Appendix A for further
details on methodology and limitations of the data.)
This is a descriptive study and as such, causal claims should not be made. Further research is
needed to determine and understand the impact of external factors on incomes, particularly the
economy. Further research is also needed to understand the differences in earnings over time such
as the number of hours worked and the whether the individuals are still working in the trade in
which they were certified. A better understanding of self-employment data and trends in the trades
would also provide further insight.
Labour Market Outcomes of Alberta’s Apprenticeship and Industry Training System | alberta.ca | February 2018 16
APPENDIX A: METHODOLOGY AND
LIMITATIONS
Methodology
Labour market outcomes are analyzed by linking information from Alberta’s Apprenticeship, Trade and Occupation Management System (ATOMS) database, which captures apprenticeship administrative data including individuals certified in designated trades and occupations, to Statistics Canada’s T1 Family File (T1FF) tax information.
Income information is collected in the first tax year following the year of certification in a trade or occupation. It is important to note that there are sometimes difficulties linking graduates to tax records. See Appendix C for response and exclusion rates. Additionally, not all individuals file taxes every year.
Three types of analysis were performed with the data: cross-sectional, longitudinal and true longitudinal. In the cross-sectional approach, all certified individuals that filed taxes in that year are included. They do not have to file taxes every year to be included in the analysis. In the longitudinal analysis, certified individuals are dropped from the study if they did not file taxes for two or more years in the given timeframe.
A true longitudinal approach was used to analyze data in this report. In true longitudinal analysis, an identical population is followed over time, therefore graduates who meet any of the exclusion criteria or do not file taxes in any year of the project years are not included.
The following completers and qualifiers are excluded in the income calculation:
individuals who enrolled in another post-secondary program (including apprenticeship) during the time of analysis;
students pursuing post-secondary education (including apprenticeship) outside of Alberta, who are identified when they claim education tax credits, but simultaneously lack records in ATOMS (see notes above) or Alberta’s Learner Enrolment Reporting System (LERS) which captures information about students and enrolment in all credit programs offered by public post-secondary institutions in Alberta; and
individuals with self-employment earnings, in any of the study years. Earnings for self-employed individuals are not representative of actual earnings as they may be retained within a corporation, transmitted through dividends, or allocated to family members. Sometimes negative self-employment income is also reported. Note that some trades may have a relatively larger proportion of self-employed individuals.
Linkages between ATOMS and tax data were conducted in secured facilities at Statistics Canada to safeguard the privacy of individuals. Results are published only at the aggregate level following Statistics Canada’s disclosure rules to ensure that any individual’s income cannot be directly or indirectly ascertained. The results of this project are highly policy relevant and of public interest, especially to current and future apprentices and other post-secondary students. The detailed outcomes by trade resulting from this project cannot be obtained by other sources such as surveys.

Labour Market Outcomes of Alberta’s Apprenticeship and Industry Training System | alberta.ca | February 2018 17
Limitations
Since BPSEP only contains income information for individuals certified who filed their taxes, there are some individuals certified who are not captured in the data. For instance, someone with no or very low employment earnings may have little incentive to file taxes. These individuals would have an impact on the median income of their particular cohort, but are not captured in the data.
It is important to note that BPSEP captures earnings from all sources of employment. It is possible that individuals certified may be earning income from a job outside the trade in which they are certified.
Another caveat is that income is only reported as an annual figure. As a result, it is not possible to determine how many hours an individual has worked, or for what duration of the year. For example, an individual may have a full-time and a part-time job and work a much higher number of hours a week than someone with only one job, whereas another individual may do seasonal work six months out of the year. A better understanding of hourly wage, or number of weeks worked per year could provide greater insight to the findings.
It is also not possible to determine the years of work experience. For instance, an individual may already have many years of employment experience before pursuing a new or additional certification. Years of work experience may impact first year earnings upon certification. Lastly, there are many benefits of apprenticeship education beyond employment earnings that
impact personal interest and job satisfaction such as job security, health benefits and employee
pension plans. These cannot be measured through the approach used for this project.

Labour Market Outcomes of Alberta’s Apprenticeship and Industry Training System | alberta.ca | February 2018 18
APPENDIX B: TRADE GROUP CLASSIFICATION
Architectural/Construction
Bricklayer Floorcovering Installer
Cabinetmaker Glazier
Carpenter Lather (Interior Systems Mechanic)
Concrete Finisher Painter & Decorator
Crane & Hoisting Equipment Operator Roofer
Elevator Constructor Tilesetter
Electrical
Communication Technician Powerline Technician
Electric Motor Systems Technician Power System Electrician
Electrician
Mechanical
Gasfitter Refrigeration & Air Conditioning Mechanic
Instrumentation and Control Technician Sheet Metal Worker
Insulator (Heat and Frost) Sprinkler System Installer
Natural Gas Compression Technician Steamfitter-Pipefitter
Plumber
Metal
Boilermaker Machinist
Industrial Mechanic (Millwright) Metal Fabricator (Fitter)
Ironworker Welder
Other
Appliance Service Technician Landscape Horticulturist
Baker Locksmith
Cook Rig Technician
Hairstylist Water Well Driller
Vehicle & Related
Agricultural Equipment Technician Outdoor Power Equipment Technician
Auto Body Technician Parts Technician
Automotive Service Technician Recreation Vehicle Service Technician
Heavy Equipment Technician Transport Refrigeration Technician
Motorcycle Mechanic

Labour Market Outcomes of Alberta’s Apprenticeship and Industry Training System | alberta.ca | February 2018 19
APPENDIX C: MEDIAN INCOME, CELL COUNTS,
AND RESPONSE/ EXCLUSION RATES

Labour Market Outcomes of Alberta’s Apprenticeship and Industry Training System | alberta.ca | February 2018 20
COMPLETERS
Median Income and Cell Counts by Tax Year
2006 2007 2008 2009 2010 2011 2012 2013 2014
2005
COHORT
$81,000 $81,600 $85,300 $82,800 $85,700 $86,700 $91,300 $93,400 $94,100
2440 2440 2430 2440 2440 2440 2440 2440 2430
2006
COHORT
$80,000 $83,900 $81,900 $84,400 $85,900 $91,100 $93,100 $93,300
2510 2500 2510 2510 2510 2510 2510 2510
2007
COHORT
$80,500 $78,600 $82,200 $84,100 $89,400 $91,200 $91,800
2940 2940 2950 2950 2940 2950 2940
2008
COHORT
$78,400 $82,500 $85,600 $90,300 $92,500 $93,400
3370 3370 3370 3370 3370 3370
2009
COHORT
$82,300 $86,500 $91,300 $92,900 $93,900
4100 4100 4100 4100 4100
2010
COHORT
$82,600 $88,200 $90,300 $91,900
5290 5300 5290 5290
2011
COHORT
$87,600 $90,600 $92,600
5690 5690 5690
2012
COHORT
$89,000 $90,900
5950 5950
2013
COHORT
$90,700
6120
Response Rates (top) and Exclusion Rates
2005
COHORT
74% 74% 74% 74% 74% 74% 74% 74% 74%
55% 55% 55% 55% 55% 55% 55% 55% 55%
2006
COHORT
74% 74% 74% 74% 74% 74% 74% 74%
54% 54% 54% 54% 54% 54% 54% 54%
2007
COHORT
77% 77% 77% 77% 77% 77% 77%
51% 51% 51% 51% 51% 51% 51%
2008
COHORT
79% 79% 79% 79% 79% 79%
48% 48% 48% 48% 48% 48%
2009
COHORT
82% 82% 82% 82% 82%
44% 44% 44% 44% 44%
2010
COHORT
82% 82% 82% 82%
42% 42% 42% 42%
2011
COHORT
85% 85% 85%
36% 36% 36%
2012
COHORT
89% 89%
29% 29%
2013
COHORT
92%
17%
Labour Market Outcomes of Alberta’s Apprenticeship and Industry Training System | alberta.ca | February 2018 21
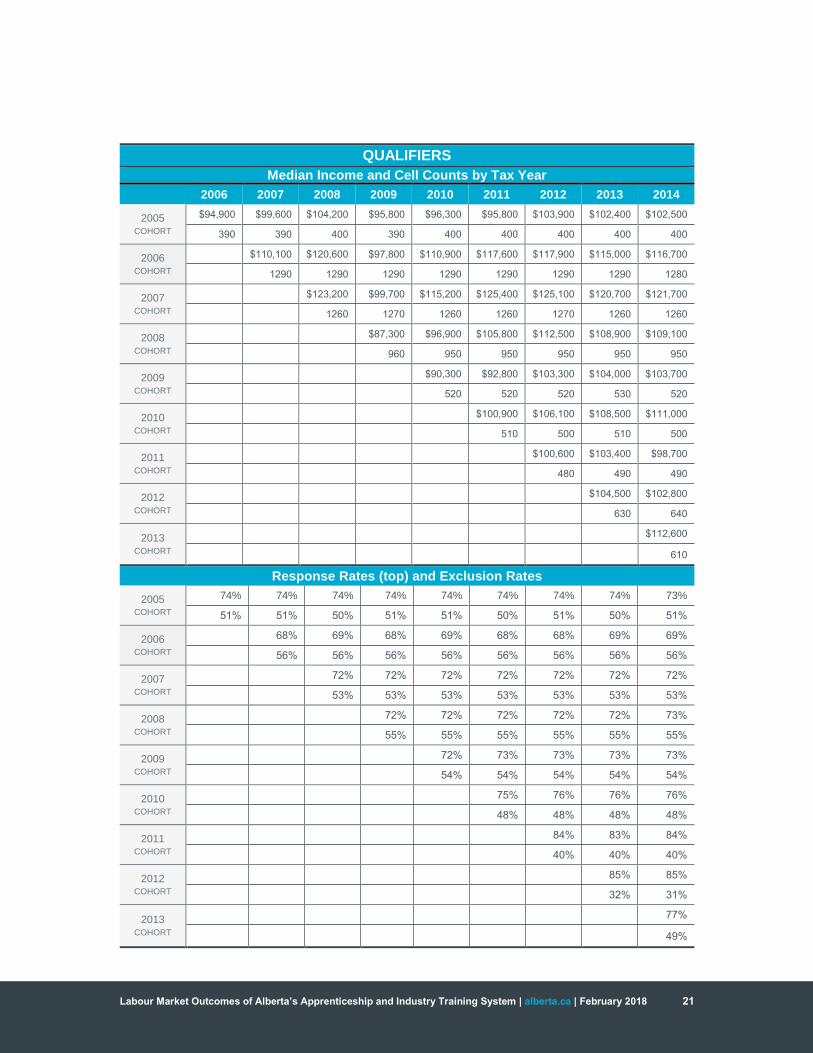
QUALIFIERS
Median Income and Cell Counts by Tax Year
2006 2007 2008 2009 2010 2011 2012 2013 2014
2005
COHORT
$94,900 $99,600 $104,200 $95,800 $96,300 $95,800 $103,900 $102,400 $102,500
390 390 400 390 400 400 400 400 400
2006
COHORT
$110,100 $120,600 $97,800 $110,900 $117,600 $117,900 $115,000 $116,700
1290 1290 1290 1290 1290 1290 1290 1280
2007
COHORT
$123,200 $99,700 $115,200 $125,400 $125,100 $120,700 $121,700
1260 1270 1260 1260 1270 1260 1260
2008
COHORT
$87,300 $96,900 $105,800 $112,500 $108,900 $109,100
960 950 950 950 950 950
2009
COHORT
$90,300 $92,800 $103,300 $104,000 $103,700
520 520 520 530 520
2010
COHORT
$100,900 $106,100 $108,500 $111,000
510 500 510 500
2011
COHORT
$100,600 $103,400 $98,700
480 490 490
2012
COHORT
$104,500 $102,800
630 640
2013
COHORT
$112,600
610
Response Rates (top) and Exclusion Rates
2005
COHORT
74% 74% 74% 74% 74% 74% 74% 74% 73%
51% 51% 50% 51% 51% 50% 51% 50% 51%
2006
COHORT
68% 69% 68% 69% 68% 68% 69% 69%
56% 56% 56% 56% 56% 56% 56% 56%
2007
COHORT
72% 72% 72% 72% 72% 72% 72%
53% 53% 53% 53% 53% 53% 53%
2008
COHORT
72% 72% 72% 72% 72% 73%
55% 55% 55% 55% 55% 55%
2009
COHORT
72% 73% 73% 73% 73%
54% 54% 54% 54% 54%
2010
COHORT
75% 76% 76% 76%
48% 48% 48% 48%
2011
COHORT
84% 83% 84%
40% 40% 40%
2012
COHORT
85% 85%
32% 31%
2013
COHORT
77%
49%

Labour Market Outcomes of Alberta’s Apprenticeship and Industry Training System | alberta.ca | February 2018 22
ARCHITECTURAL/CONSTRUCTION TRADE GROUP
Median Income and Cell Counts by Tax Year
2006 2007 2008 2009 2010 2011 2012 2013 2014
2005
COHORT
$93,300 $90,700 $94,000 $89,800 $91,800 $97,400 $101,500 $102,700 $102,300
330 330 340 330 340 330 330 330 340
2006
COHORT
$84,600 $92,400 $86,500 $92,600 $96,000 $98,700 $101,500 $98,800
310 310 310 310 310 310 310 310
2007
COHORT
$79,600 $77,100 $81,400 $86,300 $90,700 $92,400 $97,100
360 360 360 370 360 370 360
2008
COHORT
$79,500 $83,400 $91,700 $94,500 $95,400 $93,800
430 420 430 430 430 430
2009
COHORT
$84,600 $91,600 $93,400 $93,100 $94,100
470 470 470 470 460
2010
COHORT
$82,200 $89,000 $92,200 $93,500
600 600 590 590
2011
COHORT
$91,200 $94,200 $94,500
780 780 770
2012
COHORT
$89,300 $90,700
890 890
2013
COHORT
$92,600
910
Response Rates (top) and Exclusion Rates
2005
COHORT
72% 73% 71% 72% 73% 72% 72% 73% 72%
54% 55% 55% 55% 55% 55% 55% 55% 54%
2006
COHORT
74% 75% 74% 75% 75% 75% 74% 74%
54% 54% 54% 54% 54% 54% 54% 54%
2007
COHORT
76% 77% 75% 77% 76% 77% 76%
49% 50% 51% 51% 51% 49% 51%
2008
COHORT
76% 76% 77% 76% 77% 77%
46% 47% 46% 46% 46% 46%
2009
COHORT
82% 82% 82% 82% 82%
44% 44% 44% 44% 44%
2010
COHORT
82% 81% 82% 81%
44% 43% 43% 44%
2011
COHORT
84% 84% 84%
39% 40% 39%
2012
COHORT
90% 90%
28% 28%
2013
COHORT
92%
20%

Labour Market Outcomes of Alberta’s Apprenticeship and Industry Training System | alberta.ca | February 2018 23
ELECTRICAL TRADE GROUP
Median Income and Cell Counts by Tax Year
2006 2007 2008 2009 2010 2011 2012 2013 2014
2005
COHORT
$84,900 $85,000 $93,500 $92,100 $94,700 $93,400 $100,300 $104,100 $108,400
460 460 460 460 460 460 460 460 450
2006
COHORT
$84,000 $89,800 $90,200 $91,400 $91,900 $98,900 $99,600 $103,500
470 470 460 470 470 470 470 470
2007
COHORT
$91,100 $88,500 $94,800 $92,900 $101,400 $104,300 $108,700
580 580 590 580 590 580 580
2008
COHORT
$88,000 $91,700 $92,200 $98,200 $101,600 $105,100
680 680 690 680 680 680
2009
COHORT
$92,000 $92,300 $98,500 $101,300 $102,700
730 730 730 730 720
2010
COHORT
$88,100 $94,200 $98,900 $101,900
1010 1010 1010 1010
2011
COHORT
$94,800 $99,400 $103,100
1150 1160 1150
2012
COHORT
$99,500 $102,600
1300 1300
2013
COHORT
$101,100
1330
Response Rates (top) and Exclusion Rates
2005
COHORT
76% 77% 77% 77% 76% 77% 77% 77% 77%
54% 54% 54% 54% 54% 54% 54% 54% 55%
2006
COHORT
74% 74% 74% 74% 74% 74% 74% 74%
53% 54% 53% 53% 53% 53% 53% 53%
2007
COHORT
78% 78% 78% 78% 78% 78% 78%
49% 49% 49% 49% 49% 48% 49%
2008
COHORT
81% 80% 80% 80% 81% 80%
44% 43% 44% 44% 44% 44%
2009
COHORT
83% 83% 83% 83% 83%
42% 42% 42% 42% 42%
2010
COHORT
85% 86% 86% 85%
36% 36% 36% 37%
2011
COHORT
87% 87% 86%
32% 32% 32%
2012
COHORT
89% 89%
24% 24%
2013
COHORT
93%
14%

Labour Market Outcomes of Alberta’s Apprenticeship and Industry Training System | alberta.ca | February 2018 24
MECHANICAL TRADE GROUP
Median Income and Cell Counts by Tax Year
2006 2007 2008 2009 2010 2011 2012 2013 2014
2005
COHORT
$89,200 $90,700 $96,700 $92,900 $95,100 $95,900 $100,800 $102,400 $101,100
450 450 450 450 450 450 450 450 450
2006
COHORT
$87,200 $91,700 $89,900 $92,600 $93,500 $99,300 $101,200 $100,500
490 490 490 490 490 490 490 490
2007
COHORT
$88,300 $88,000 $88,500 $88,800 $93,200 $96,100 $96,400
490 490 480 480 490 490 490
2008
COHORT
$85,000 $90,300 $90,700 $94,900 $98,100 $96,900
600 600 600 590 600 600
2009
COHORT
$92,100 $92,000 $98,600 $100,100 $100,800
740 740 740 740 740
2010
COHORT
$89,600 $92,500 $96,200 $95,900
940 940 950 950
2011
COHORT
$91,600 $94,200 $97,500
1100 1090 1100
2012
COHORT
$91,500 $92,700
1150 1160
2013
COHORT
$93,000
1250
Response Rates (top) and Exclusion Rates
2005
COHORT
77% 77% 76% 77% 76% 77% 77% 76% 77%
51% 51% 51% 50% 51% 51% 51% 51% 51%
2006
COHORT
75% 75% 75% 75% 75% 75% 75% 75%
51% 52% 52% 52% 52% 52% 52% 52%
2007
COHORT
78% 77% 77% 77% 78% 78% 77%
51% 51% 51% 52% 51% 51% 51%
2008
COHORT
83% 83% 83% 83% 83% 83%
45% 45% 45% 45% 45% 45%
2009
COHORT
83% 83% 83% 83% 84%
46% 46% 46% 46% 46%
2010
COHORT
81% 81% 81% 81%
44% 44% 43% 44%
2011
COHORT
86% 86% 86%
36% 36% 36%
2012
COHORT
89% 89%
32% 32%
2013
COHORT
92%
14%

Labour Market Outcomes of Alberta’s Apprenticeship and Industry Training System | alberta.ca | February 2018 25
METAL TRADE GROUP
Median Income and Cell Counts by Tax Year
2006 2007 2008 2009 2010 2011 2012 2013 2014
2005
COHORT
$86,000 $82,300 $86,600 $82,300 $87,900 $93,500 $99,500 $98,500 $99,800
520 520 510 520 520 520 510 520 520
2006
COHORT
$82,700 $89,300 $85,600 $87,800 $91,000 $97,900 $98,500 $98,500
480 480 480 490 480 480 480 480
2007
COHORT
$82,000 $76,600 $82,200 $88,100 $94,400 $94,700 $96,000
610 610 610 600 610 600 610
2008
COHORT
$73,900 $79,100 $85,500 $90,300 $92,200 $92,000
730 730 720 730 730 730
2009
COHORT
$76,400 $84,900 $91,700 $91,100 $93,100
1010 1020 1020 1010 1010
2010
COHORT
$82,100 $90,000 $90,700 $92,300
1240 1240 1240 1240
2011
COHORT
$89,500 $92,400 $92,800
1120 1110 1120
2012
COHORT
$92,600 $95,000
970 960
2013
COHORT
$92,300
990
Response Rates (top) and Exclusion Rates
2005
COHORT
70% 70% 70% 70% 70% 70% 69% 70% 69%
59% 58% 58% 59% 58% 58% 58% 58% 58%
2006
COHORT
70% 69% 70% 70% 69% 70% 70% 69%
56% 56% 56% 56% 56% 56% 56% 56%
2007
COHORT
77% 76% 76% 77% 76% 76% 77%
53% 53% 53% 53% 53% 53% 53%
2008
COHORT
76% 76% 76% 76% 76% 76%
52% 52% 51% 52% 52% 52%
2009
COHORT
81% 81% 81% 81% 81%
48% 48% 48% 47% 47%
2010
COHORT
80% 81% 81% 81%
44% 44% 44% 44%
2011
COHORT
84% 84% 84%
35% 35% 35%
2012
COHORT
87% 87%
30% 30%
2013
COHORT
91%
16%
Labour Market Outcomes of Alberta’s Apprenticeship and Industry Training System | alberta.ca | February 2018 26
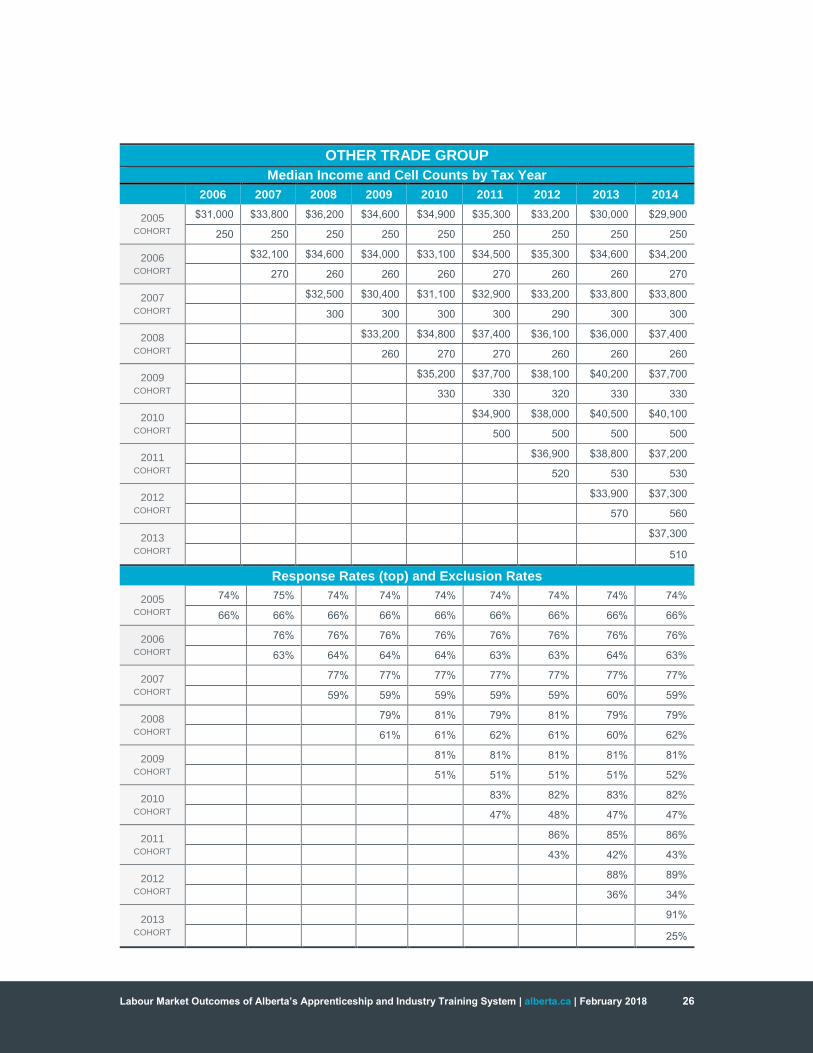
OTHER TRADE GROUP
Median Income and Cell Counts by Tax Year
2006 2007 2008 2009 2010 2011 2012 2013 2014
2005
COHORT
$31,000 $33,800 $36,200 $34,600 $34,900 $35,300 $33,200 $30,000 $29,900
250 250 250 250 250 250 250 250 250
2006
COHORT
$32,100 $34,600 $34,000 $33,100 $34,500 $35,300 $34,600 $34,200
270 260 260 260 270 260 260 270
2007
COHORT
$32,500 $30,400 $31,100 $32,900 $33,200 $33,800 $33,800
300 300 300 300 290 300 300
2008
COHORT
$33,200 $34,800 $37,400 $36,100 $36,000 $37,400
260 270 270 260 260 260
2009
COHORT
$35,200 $37,700 $38,100 $40,200 $37,700
330 330 320 330 330
2010
COHORT
$34,900 $38,000 $40,500 $40,100
500 500 500 500
2011
COHORT
$36,900 $38,800 $37,200
520 530 530
2012
COHORT
$33,900 $37,300
570 560
2013
COHORT
$37,300
510
Response Rates (top) and Exclusion Rates
2005
COHORT
74% 75% 74% 74% 74% 74% 74% 74% 74%
66% 66% 66% 66% 66% 66% 66% 66% 66%
2006
COHORT
76% 76% 76% 76% 76% 76% 76% 76%
63% 64% 64% 64% 63% 63% 64% 63%
2007
COHORT
77% 77% 77% 77% 77% 77% 77%
59% 59% 59% 59% 59% 60% 59%
2008
COHORT
79% 81% 79% 81% 79% 79%
61% 61% 62% 61% 60% 62%
2009
COHORT
81% 81% 81% 81% 81%
51% 51% 51% 51% 52%
2010
COHORT
83% 82% 83% 82%
47% 48% 47% 47%
2011
COHORT
86% 85% 86%
43% 42% 43%
2012
COHORT
88% 89%
36% 34%
2013
COHORT
91%
25%

Labour Market Outcomes of Alberta’s Apprenticeship and Industry Training System | alberta.ca | February 2018 27
VEHICLE AND RELATED TRADE GROUP
Median Income and Cell Counts by Tax Year
2006 2007 2008 2009 2010 2011 2012 2013 2014
2005
COHORT
$76,200 $79,700 $82,100 $81,000 $81,600 $83,700 $86,900 $89,100 $90,800
430 420 430 420 420 430 430 430 430
2006
COHORT
$76,200 $79,600 $78,100 $81,200 $84,100 $88,900 $91,500 $92,100
490 500 500 490 490 490 490 490
2007
COHORT
$80,100 $77,400 $80,200 $84,100 $88,500 $91,800 $90,000
600 600 600 610 610 600 610
2008
COHORT
$77,700 $80,100 $86,400 $91,400 $93,400 $94,500
660 670 660 670 670 660
2009
COHORT
$78,300 $85,300 $89,300 $93,700 $97,000
820 810 810 820 820
2010
COHORT
$83,200 $87,000 $90,000 $93,100
1000 1000 1000 1000
2011
COHORT
$85,700 $89,800 $93,500
1020 1020 1020
2012
COHORT
$86,400 $90,500
1070 1070
2013
COHORT
$88,300
1110
Response Rates (top) and Exclusion Rates
2005
COHORT
77% 77% 77% 77% 77% 77% 77% 77% 79%
49% 49% 49% 50% 49% 49% 49% 50% 50%
2006
COHORT
75% 74% 74% 74% 75% 74% 75% 75%
49% 48% 49% 49% 49% 49% 48% 49%
2007
COHORT
79% 79% 79% 78% 78% 78% 78%
44% 44% 44% 45% 45% 44% 45%
2008
COHORT
80% 80% 79% 80% 80% 80%
42% 42% 42% 42% 42% 42%
2009
COHORT
82% 82% 82% 83% 82%
37% 37% 38% 37% 37%
2010
COHORT
84% 84% 84% 84%
36% 36% 36% 36%
2011
COHORT
84% 84% 84%
34% 34% 34%
2012
COHORT
88% 88%
28% 28%
2013
COHORT
92%
17%

Labour Market Outcomes of Alberta’s Apprenticeship and Industry Training System | alberta.ca | February 2018 28
COMMUNICATION TECHNICIAN
Median Income and Cell Counts by Tax Year
2006 2007 2008 2009 2010 2011 2012 2013 2014
2005
COHORT
$80,400 $81,100 $82,100 $83,000 $80,600 $82,100 $83,200 $89,200 $88,700
30 40 30 30 30 30 30 30 40
2006
COHORT
$77,200 $81,000 $76,900 $77,700 $78,600 $81,300 $84,700 $83,300
40 40 40 40 40 40 40 40
2007
COHORT
$77,700 $76,000 $77,900 $79,300 $82,100 $85,100 $83,700
20 20 30 20 20 30 20
2008
COHORT
$76,700 $77,800 $80,800 $81,100 $86,800 $85,300
80 80 80 80 90 80
2009
COHORT
$77,000 $77,200 $78,000 $85,300 $80,900
30 20 20 30 20
2010
COHORT
$77,500 $79,600 $84,100 $82,200
20 20 30 20
2011
COHORT
$75,700 $79,500 $83,400
30 30 30
2012
COHORT
$79,000 $80,800
60 60
2013
COHORT
$76,900
50
Response Rates (top) and Exclusion Rates
2005
COHORT
X X X X X X X X X
33% 33% 40% 40% 40% 40% 40% 50% 40%
2006
COHORT
X X X X X X X X
43% 33% 33% 33% 33% 33% 33% 33%
2007
COHORT
X X X X X X X
X X X X X X X
2008
COHORT
X X X X X X
20% 20% 20% 20% 20% 20%
2009
COHORT
X X X X X
X X X X X
2010
COHORT
X X X X
X X X X
2011
COHORT
X X X
X X X
2012
COHORT
X X
X X
2013
COHORT
X
X
Labour Market Outcomes of Alberta’s Apprenticeship and Industry Training System | alberta.ca | February 2018 29
HAIRSTYLIST
Median Income and Cell Counts by Tax Year
2006 2007 2008 2009 2010 2011 2012 2013 2014
2005
COHORT
$27,500 $29,100 $29,100 $26,400 $24,000 $22,800 $23,600 $20,100 $19,200
160 170 160 160 160 160 160 160 160
2006
COHORT
$28,100 $29,600 $29,500 $24,300 $26,800 $26,000 $26,700 $27,500
170 170 170 170 160 170 170 170
2007
COHORT
$27,700 $27,500 $27,200 $25,400 $25,200 $26,400 $25,100
200 200 200 200 200 200 200
2008
COHORT
$28,400 $31,200 $31,100 $28,400 $26,300 $25,400
150 150 150 150 150 150
2009
COHORT
$26,500 $29,800 $30,000 $27,500 $25,900
190 180 180 190 190
2010
COHORT
$27,000 $29,800 $31,200 $28,900
270 270 270 270
2011
COHORT
$29,400 $31,700 $29,700
300 290 300
2012
COHORT
$28,400 $30,000
310 320
2013
COHORT
$28,600
240
Response Rates (top) and Exclusion Rates
2005
COHORT
76% 77% 77% 76% 78% 77% 77% 77% 77%
69% 69% 69% 69% 69% 69% 69% 67% 69%
2006
COHORT
78% 78% 78% 78% 78% 78% 78% 78%
67% 67% 67% 66% 67% 67% 67% 68%
2007
COHORT
79% 77% 79% 79% 77% 79% 79%
62% 62% 62% 62% 62% 62% 62%
2008
COHORT
80% 80% 80% 79% 79% 79%
67% 68% 67% 68% 67% 68%
2009
COHORT
83% 85% 83% 85% 83%
56% 54% 55% 55% 56%
2010
COHORT
84% 83% 83% 83%
53% 53% 54% 53%
2011
COHORT
88% 88% 88%
47% 49% 47%
2012
COHORT
91% 91%
42% 40%
2013
COHORT
89%
31%

Labour Market Outcomes of Alberta’s Apprenticeship and Industry Training System | alberta.ca | February 2018 30
INSULATOR (HEAT AND FROST)
Median Income and Cell Counts by Tax Year
2006 2007 2008 2009 2010 2011 2012 2013 2014
2005
COHORT
$97,200 $92,000 $117,400 $96,300 $106,100 $104,200 $113,300 $102,000 $103,700
30 40 40 30 30 40 30 30 30
2006
COHORT
$99,700 $112,000 $93,900 $118,600 $106,900 $114,200 $111,000 $121,800
40 30 30 40 40 30 40 40
2007
COHORT
$98,100 $82,800 $98,000 $109,600 $104,900 $103,700 $106,800
40 40 30 30 40 40 30
2008
COHORT
$90,500 $118,900 $101,000 $113,600 $111,200 $127,300
30 30 40 30 30 30
2009
COHORT
$110,600 $99,800 $106,700 $106,300 $107,800
40 50 40 50 50
2010
COHORT
$96,400 $110,400 $102,500 $107,900
50 40 50 50
2011
COHORT
$109,600 $100,100 $113,400
40 40 40
2012
COHORT
$105,900 $105,000
70 70
2013
COHORT
$104,700
80
Response Rates (top) and Exclusion Rates
2005
COHORT
X X X X X X X X X
40% 33% 40% 40% 40% 40% 33% 40% 40%
2006
COHORT
X X X X X X X X
25% 33% 20% 40% 40% 20% 20% 33%
2007
COHORT
X X X X X X X
33% 40% 33% 20% 40% 33% 40%
2008
COHORT
75% 67% 75% 67% 60% 75%
40% 25% 40% 25% 33% 40%
2009
COHORT
X X X X X
33% 29% 33% 29% 29%
2010
COHORT
X X X X
29% 33% 17% 29%
2011
COHORT
X X X
X X X
2012
COHORT
X X
22% 13%
2013
COHORT
X
X

Labour Market Outcomes of Alberta’s Apprenticeship and Industry Training System | alberta.ca | February 2018 31
2013 Cohort: Median Income, Cell Counts, and Response/Exclusion Rates
Trade Median Income
Cell Count
Response Rate
Exclusion Rate
Baker $35,000 20 X X
Boilermaker $112,000 60 X X
Cabinetmaker $53,700 30 X X
Cook $38,900 110 86% 15%
Crane & Hoisting Equipment Operator
$121,700 390 92% 13%
Elevator Constructor $116,200 40 X X
Heavy Equipment Technician $105,800 580 90% 16%
Industrial Mechanic (Millwright) $111,000 210 X 9%
Instrumentation and Control Technician
$123,500 160 X 16%
Ironworker $108,500 90 X 10%
Motorcycle Mechanic $60,900 20 X X
Powerline Technician $137,600 100 X X
Power System Electrician $148,000 60 X X
Rig Technician $139,900 110 X X


