
Integration and Inclusion of People with Disabilities in
Postsecondary Institutions
and Beyond…Linda M. Kelly, M. Ed.
Michelle L. Mitchell, M.Ed.Disability Support Services

If there is a need in the audience for Accommodations or Alternative Format, please let us know either now or after the presentation. We would be happy to send you a copy of the notes or provide you with an alternative format of our presentation.
Accommodations Statement

AwarenessPerceptionsThe three I’s
Introduction

Awareness
1990
2010
People with Disabilities
People without Disabilities
11 %
19%
U.S. Census Bureau& Disability Statistic Center http://dsc.ucsf.edu/UCSF/pub.taf?grow=8 U.S. Census Bureau& Disability Statistic Center http://dsc.ucsf.edu/UCSF/pub.taf?grow=8

Awareness– chart on diversity
1980 1990 2000 20100.00%
50.00%
100.00%
150.00%
200.00%
250.00%
RaceColumn1Disability

Awareness
Mobility Im-
pair-ments59%Mental Health
18%
Learning Disabili-ties5%
Visual Im-pairments
7%
Hearing Im-pairments
6%Intellectual Disabilities
7%
Disability Population
2010 U.S. Census

51% of the disability population is between the ages of 21 and 64
30% of this group is employed
A large percentage of persons with disabilities report difficulty maintaining employment
Awareness
US Census Bureau

Awareness
3%
9%
11%
19%
1978
1998
2001
2010
Percentage of Students with Disabilities Entering College
Incoming Freshman with Disabilities
Prism Summer 2010 “in Their Grasp”

Awareness
1983-1990 2001-2009
Attending college within 4 years after leaving high school –
46%
9%, 4 Year institut
ions
13%,Technic
al school
18%,Community
college
26%

Unfortunately…..advanced education did not result in improved employment for students with disabilities.
Employment declined from 62% in 1990
to 56% in 2005
Unemployment rate for individuals with disabilities in the Lehigh Valley is a
shocking 33%!
Awareness
SRI International

Perceptions

Perceptions

Perceptions

Perceptions

Perceptions
Perceptions
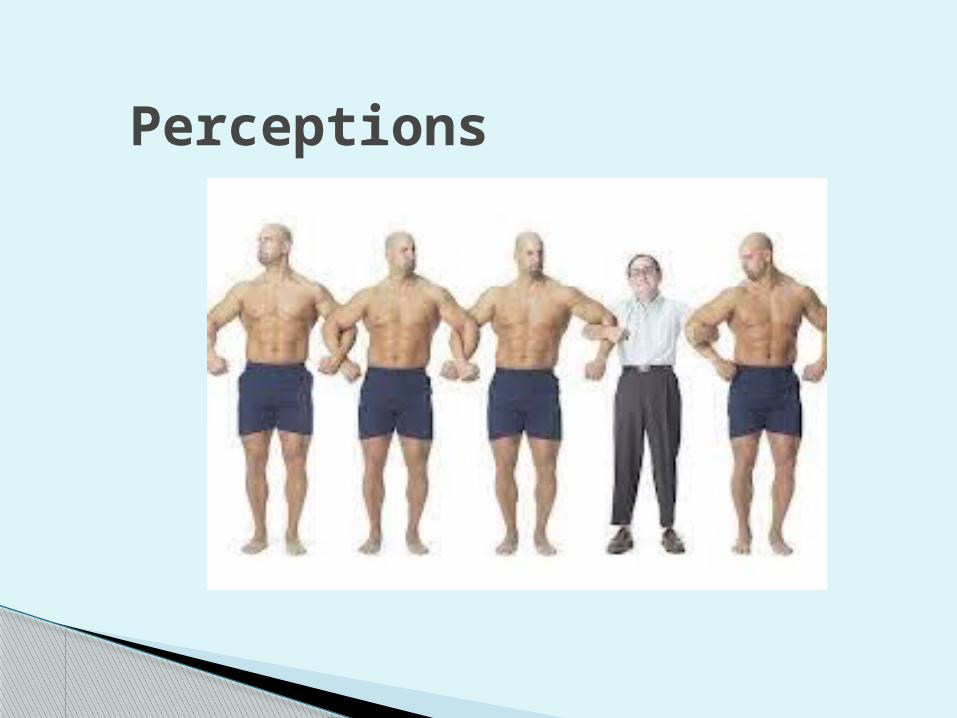
Perceptions
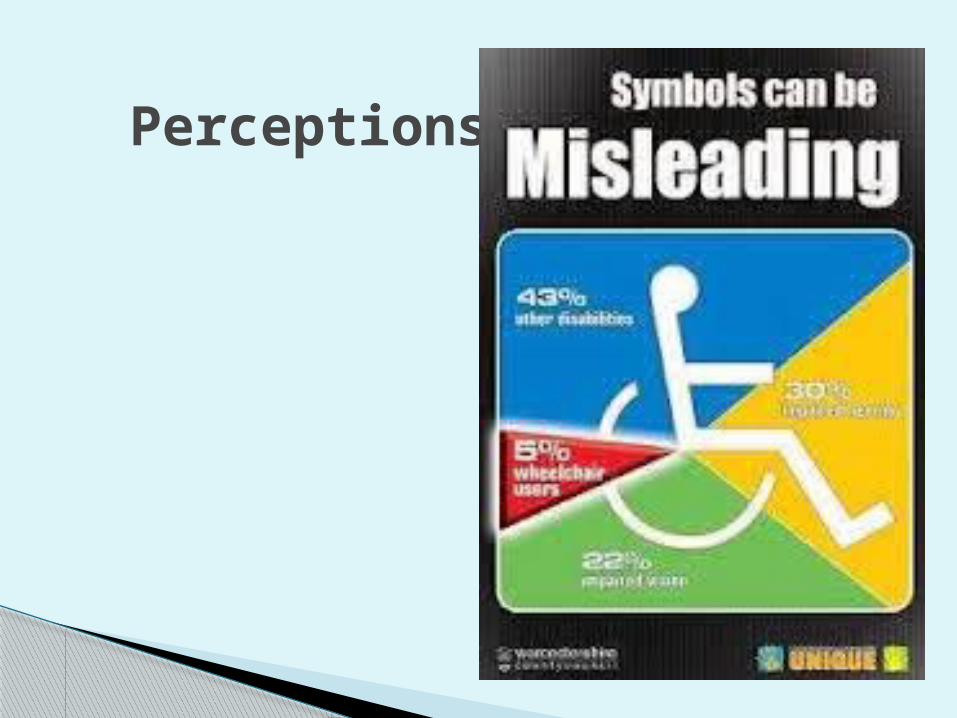
Perceptions
The Three I’s – Implementation

Perceptions

Stop Handicapped,
Victim, Invalids Wheelchair-bound,
confined Cripple, Victim,
Invalid Normal Psycho, Crazy, Mad The blind Sufferers from
Go Person with a
disability Person who uses a
wheelchair Person with a
disability Able-bodied Has a Mental illness People who are blind Has
Perceptions
Increasing Integration
and Inclusion
The Three I’s
The Three I’s – Implementation
OnThe
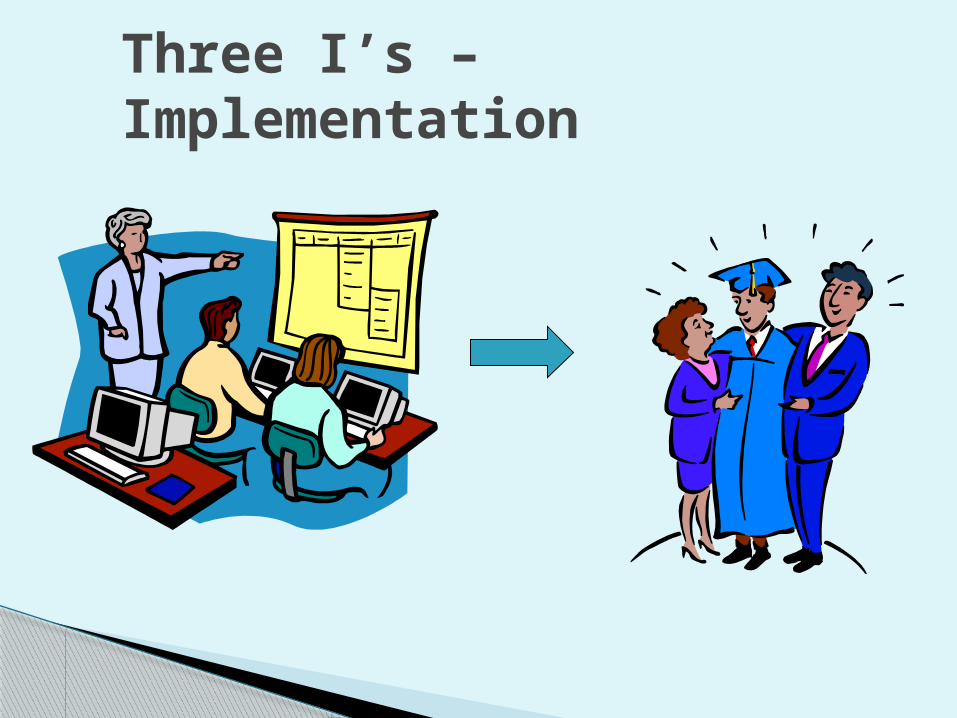
Three I’s – Implementation

Three I’s – Implementation
Flexibility
Consideration
Cooperation

QUESTIONS


