
88-3~-_. '.--- LIB R b\ RVINSTfTUTE FOR F~S~--;EP~E~~· P'~~~f~f:~?r:~i
FISHERIES DIVISIONTECHNICAL REPORT
Little Manistee River Harvest Weir andChinook Salmon Egg-Take Report, 1986
mber 88-3~~988
d&nrMichigan Department of
Natural Resources

,
MICHIGAN DEPARTMENT OF NATURAL RESOURCESFISHERIES DIVISION
Fisheries Technical Report No. 88-3
March 14, 1988
LITTLE MANISTEE RIVER HARVEST WEIR
AND CHINOOK SALMON EGG-TAKE REPORT, 1986
Ralph L. Hay
•

2
INTRODUCTION
As part of the Michigan Department of Natural Resources salmon management program
for Lake Michigan, the Little Manistee River has been planted annually since 1967 with both
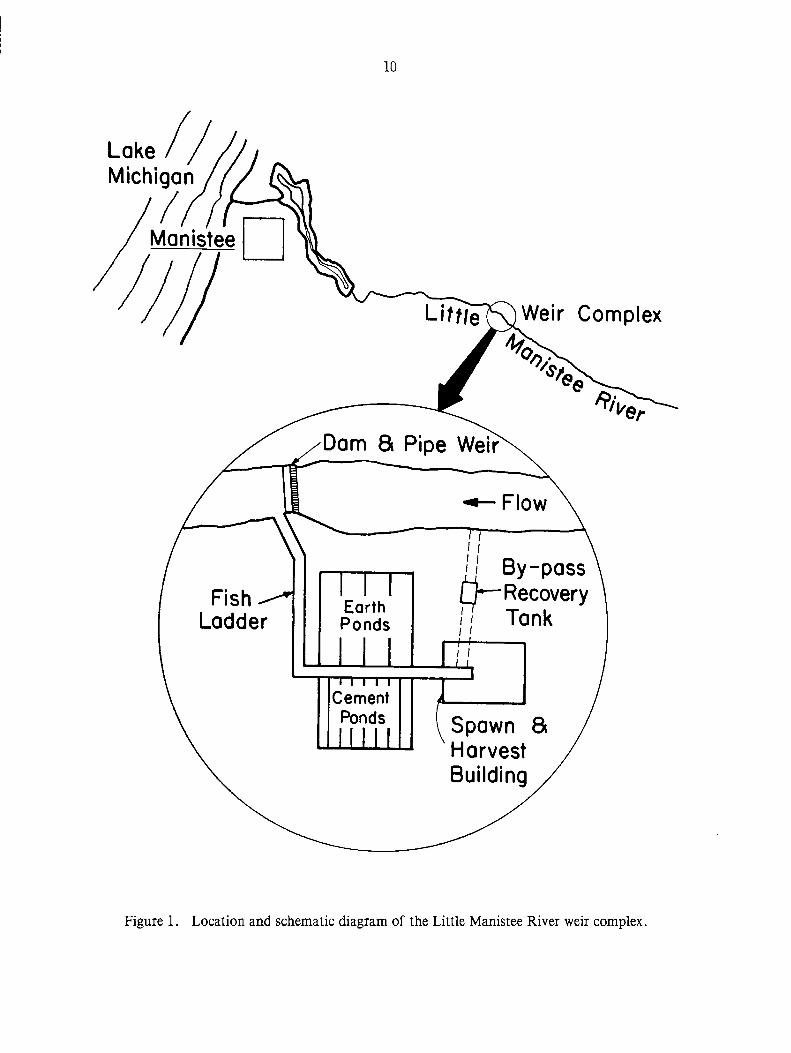
coho and chinook salmon (Table 1). Construction of a blocking weir, fish ladder, holding
ponds, and harvest facility on the river, about 5 miles upstream from Manistee Lake, Manistee
County, began in 1967 and was completed in 1968 (Fig. 1). All chinook and coho salmon
reaching the weir are harvested and sold to a commercial contractor. Normally, all other
salmonids are passed upstream. The few salmon that enter the river when the weir is not in
operation provide a limited stream fishery. The Little Manistee weir is Michigan's primary
source for chinook eggs for in-state and out-of-state hatchery rearing and serves as a back-up
(to the Platte River upper weir) for coho eggs. The facility is also used to monitor fall
steelhead runs and each spring provides the majority of steelhead eggs for in -state hatchery
rearing. Biological data have been collected on chinook and other anadromous salmonids since
1968.
From 1968 through 1978 chinook fingerlings were stocked in the Little Manistee River at
an average rate of about 322,000 per year (Table 1). Beginning in 1979, the planting rate was
increased by over 80% to an average of nearly 588,000 fingerlings. Substantial runs of
returning adults have been produced but run size has not been closely related to stocking rate.
The number of chinook actually harvested at the weir has varied between 11,136 (in 1977) and
39,359 (in 1983) (Table 2).
Chinook return to the weir at either age 0.1 (jacks), age 0.2, age 0.3, age 0.4, or age
0.5-but most commonly at age 0.2. 1 For the 1967, 1968, 1981, and 1982 year classes and
plants, return rates were 0.4 to 1.9% at age 0.1, 3.1 to 3.5% at age 0.2, and 1.7 to 3.2% at age
0.3 (Table 3). For the 1981, and 1982 year classes, return rates were 1.2 and 1.1% at 0.4,
respectively. Comparable estimates cannot be made for the 1969-80 plants because the age
composition of the run has not been monitored consistently; however, for jacks alone returns
have averaged 0.7%.
The return rate of chinook salmon to the weir was high initially (1960's), declined
(1970's), then increased (1980's). Return rates by chinook of all ages were approximately 8.5%
.for the 1967 plant, 7.2% for the 1968 plant, 6.8% for the 1981 plant, and 8.9% for the 1982
plant (Table 3). Returns from plants in the 1970's must have been lower because relatively low
lIn aging anadromous fish,.the number preceding the decimal denotes age at smolting (0 formost chinook, 1 for most coho) and the number following the decimal represents the numberof annuli formed in the Great Lakes (mostly 1,2,3,4, or 5 for chinook and 0 or 1 for coho).Note: a very recent study of scale samples from the Lake Michigan fishery indicates somechinook live to age 0.4 and 0.5. This finding suggests that some spawning chinook absorb oneor two annuli from their scales while in the rivers and that the aging data given in precedingreports may be underestimates.

3
numbers came back to the weir in 1976-77 and 1980-82 (Table 2). Large runs, averaging
32,032 fish per year, occurred from 1983 through 1986. These originated from average plants
of about 580,000 smolts in 1978-85-an average return rate of about 5.5% per plant. The
return rates represent only the weir harvest and do not include the angler harvest, which has
increased since the 1960's. In 1986, the estimated sport harvest from all stocks of chinook
salmon in Michigan waters of Lake Michigan which were surveyed was 514,000 fish
(G. Rakoczy, personal communication).
Growth rate of chinook has fluctuated considerably (Table 4, Fig. 2). Average weight
has varied from 3.0 to 9.5 pounds for age 0.1, from 7.6 to 20.9 pounds for age 0.2, and from
12.7 to 29.2 pounds for age 0.3. The fluctuations were especially large during the 1970's.
Overall, age-0.1 chinook salmon decreased in size from 5.9 pounds (1960's) to an average of
4.3 pounds (early 1980's), a 27% reduction. A similar but less dramatic reduction in size·can be
seen for older fish. Average size declined further in 1986 but this is due, in part, to better
aging techniques.
Annual plants of yearling coho salmon in the Little Manistee River have varied widely,
from 91,000 in 1971 to 700,000 in 1969 (Table 1). Annual runs of coho to the weir have varied
from 2,314 (in 1972) to 108,400 (in 1970) (Table 5). The return rate of jacks (age 1.0) has
been relatively low, <0.1% to 0.7%, compared to adults (age 1.1), 3.0% to 15.0% (Table 3,
Fig. 3). The total retJrn rate is usually between 11 and 15%, however, it declined to 8.5% for
the 1983 plant and averaged only 3.8% for the 1984-85 plants. The return of the 1985 plant to
the Platte River was low also (Pecor 1987). Possible reasons for the poor returns were
discussed by Pecor (1987). As with chinook, these return rates represent only the weir harvest
and do not include the angler harvest, which has also fluctuated annually. In 1986, anglers
harvested an estimated 135,000 coho salmon from all stocks in Michigan waters of Lake
Michigan which were surveyed (G. Rakoczy, personal communication).
The average weight of coho jacks (age 1.0) increased slightly from 1974-83, then
gradually decreased (Fig. 4, Table 6). However, the size of adult coho decreased from 8.7
pounds in 1968 to less than 5.0 pounds in 1979, then stabilized at about 6.3 pounds. Like the
chinook, there has been a decrease in average size of adult coho from the 1960's to the early
1980's, but in the last several years the average has been fairly constant. It is assumed that the
annual variations in size are primarily related to a combination of predator density and forage
density in Lake Michigan.
The Little Manistee River is one of the top quality steelhead streams in Michigan. The
fishery is supported almost entirely by natural reproduction. However, a plant of 100,188 fall
fingerlings was made in 1974, and from 1981 through 1983 annual plants were made in
conjunction with a research project on steelhead production (Table 1). In 1984 a small planting
of three strains of summer steelhead yearlings was made to extend the steelhead fishery. The

4
strains (Siletz, Rogue, and Umpqua River) were imported from the State of Oregon. The
number of steelhead returning to the weir each fall has not been consistent, ranging from 320 in
1978 to 7,622 in 1971 (Table 7). Mean weight of steelhead (all age groups) has varied from 6.5
pounds in 1973 to 9.3 pounds in 1972 (Table 7). The estim2.ted sport harvest of steelhead from
all Michigan waters of Lake Michigan which were surveyed was 35,000 in 1986 (G. Rakoczy,
personal communication). Indications are that the open -water catch will increase significantly
in future years.
Small runs of anadromous brown trout occur in the L.ittle Manistee River. The largest
run, 238, was in 1975 (Table 8). Average size has ranged from 3.4 pounds (1974) to 6.8
pounds (1979). Annual runs in excess of 100 fish have occurred since 1984. In 1986, the
estimated sport harvest from Michigan waters of Lake Michigan which were surveyed was
74,000 brown trout (G. Rakoczy, personal communication).
Atlantic salmon yearlings were first planted in the Little Manistee River in 1977
(Table 1). Subsequent plants have been made in an attempt to establish this ne\\' species.
Until 1984 only an occasional fish had been captured. Of the several strains and hybrids
planted only the Sebago strain (from Maine) shows promise.
A few pink salmon have been harvested in the last few years. Numbers harvested are
generally less than 25.
HARVEST WEIR OPERATIONS, 1986
On August 22, 1986, the weir grates were installed to block anadromous fish. On
September 4, the ponds were filled and the fish ladder was activated. Harvest began on
September 8. The weir remained operational until November 12, at which time the grates were
removed and the building was winterized. The weir was in operation for 83 days. All harvested
chinook and coho salmon were sold on contract to Tempotech Industries, Hart, Michigan.
From September 9-11, 1986, heavy precipitation (5-7 inches) created severe flooding in
the Little Manistee River. Water flowed over and around the weir for several days, allowing an
unknown number of fish to negotiate the weir structure.
Chinook salmon
Harvest of chinook salmon began September 8 and ended November 7, a period of 61
days. Fish that were not ripe were harvested because, in other years, holding early-run chinook
in maturation ponds resulted in high mortality. Two peak harvests occurred, the first during
late September and the second near mid -October (Table 9). A relatively small, but significant
run of chinook entered the facility in late August and early September. A second, major run
began in mid-September and peaked in mid-October. A total of 22,131 chinook were harvested

5
in 1986 (Table 2). The calculated total weight of all chinook, in the round, was 298,188
pounds.
For several weeks during the run, biological data were obtained from a randomly selected
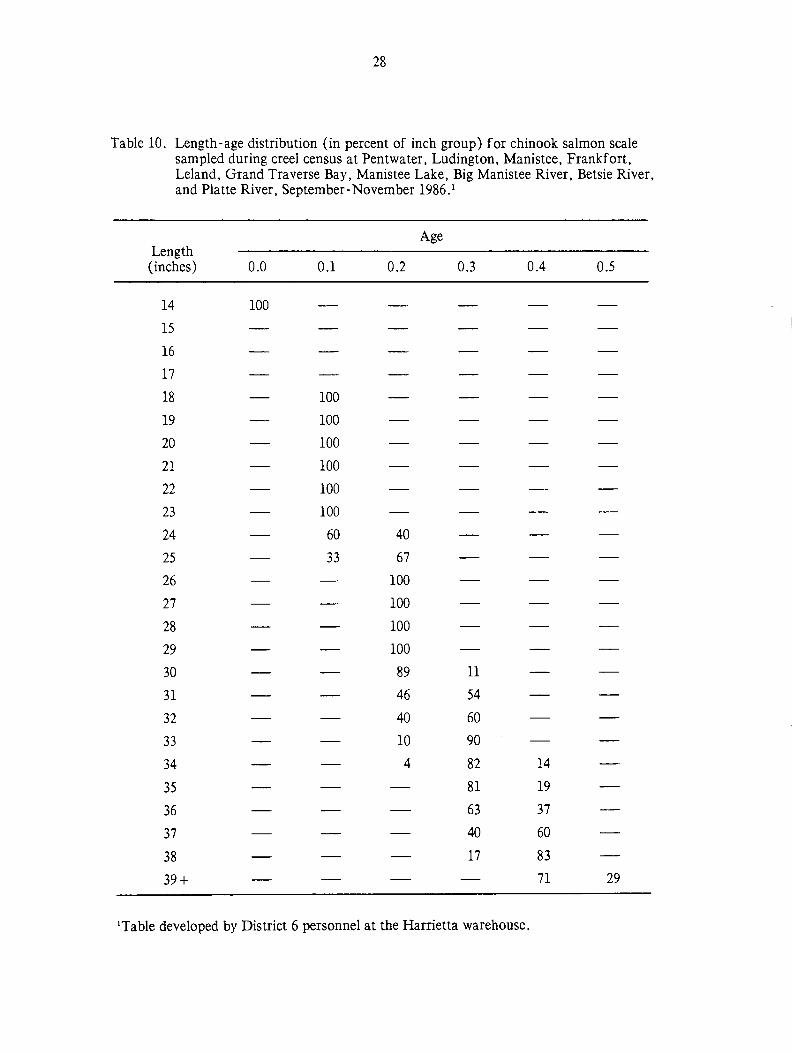
sample of 700 chinook to provide information on age composition and growth. To overcome
the problem of aging river fish with reabsorbed scales, chinook salmon length frequencies were
converted to age frequencies by means of a length-age frequency table (Table 10). Data for
this table was obtained from scale samples and length measurements collected from Lake
Michigan fish during a creel census at several sites from August to November 1986. In
applying the table to those length groups in which two or more age groups are represented, the
lighter fish were a'ssigned to the younger age group and the heavier fish to the older age group.
The estimated total harvest consisted of 397 (1.8%) age-O.l jacks weighing 1,684 pounds, 1,025
(4.6%) age-0.2 adults weighing 7,896 pounds, 13,850 (62.6%) age-0.3 adults weighing 173,230
pounds, 6,849 (30.9%) age-0.4 adults weighing 115,123 pounds, and 10 «0.1%) age-0.5 adults
weighing 255 pounds (Table 9). The 1986 run of jacks represented 0.1% of the fingerlings
stocked in 1985. The returning age-0.2 adults were 0.1% of the 1984 plant, age-0.3 adults were
2.0% of the 1983 plant, age-0.4 adults were 1.1% of the' 1982 plant, and age-0.5 adults were less
than 0.1% of the 1981 plant.
Females constituted about 50% of the total run - 5.3% of age 0.1, 19.3% of age 0.2,
56.7% of age 0.3, and 44.9% of age 0.4. No age-0.5 females were collected (Table 9). Mean
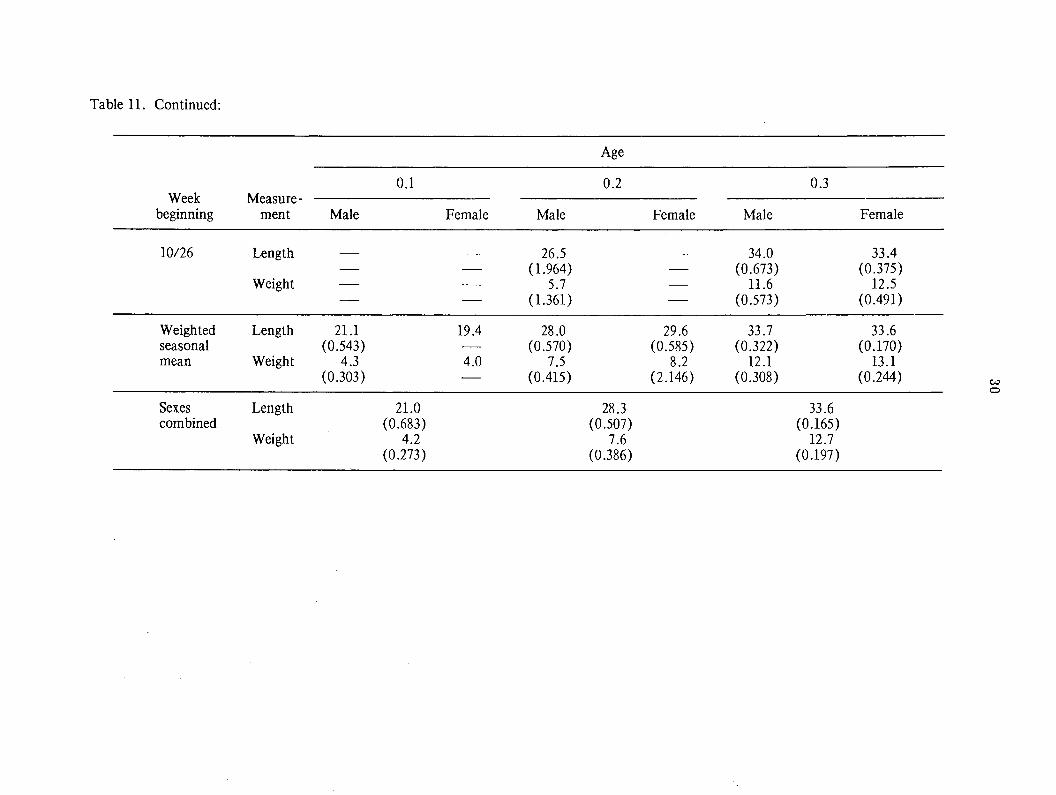
lengths and weights of males and females combined were: age 0.1, 21.0 inches and 4.2 pounds;
age 0.2,28.3 inches and 7.6 pounds; age 0.3,33.6 inches and 12.7 pounds; age 0.4,36.9 inches
and 17.1 pounds; and age 0.5 (males only), 42.0 inches and 25.5 pounds (Table 11). Growth
was nearly linear on a weight basis (Fig. 5). In general, females were slightly larger than males
at each age.
The 1986 chinook egg-take operation began September 23 and ended October 24. During
the 32-day period 17 million eggs were collected of which 13 million were for in-state rearing
and 4 million were for out-of -state commitments (Table 12). A total of 3,572 female chinook
(ages 0.2, 0.3 and 0.4) were stripped, excluding those which yielded low-quality eggs or were
otherwise unsatisfactory. Assuming that about 6,000 females were handled to provide the 17
million eggs, a total run of 12,000 chinook (6,000/50% females) should provide sufficient eggs
for current in -state and out-of -state requirements.
Egg-take operations began when the proportion of ripe females approached 40%. The
"wet U method of egg fertilization was again used in 1986. Eggs were collected in a plastic pan
and several milliliters of sperm were added. River water was quickly added, the mixture was
stirred for several seconds and then allowed to stand for several minutes. The fertilized eggs
were rinsed and allowed to water harden in milk cans (with flowing water) prior to
transportation. Excluding the egg-take on September 26, the percent eye-up was normal for

6
chinook salmon with a range of 67.3% (September 29) to 73.0% (September 23 and 24) (Table
12). No explanation can be given for the very poor eye-up for eggs taken on September 26.
During the egg-take operation, maximum river water temperature was 61 <> F (September
28) and minimum water temperature was 42 OF (October 18) (Fig. 6). Slightly over 50% of the
eggs were collected when the river water temperature exceeded 50 <> F.
Fecundity data were not collected in 1986.
No fin clips were found on 700 randomly examined chinook salmon.
Only 1.4% of the chinook sampled had a lamprey wound (Table 13). This was the
highest since 1971, but still considerably beloy\' scarring rates in the 1960's and early 1970's.
Coho salmon
In 1986 the coho harvest coincided with the chinook harvest (September 8 through
November 7, a total of 61 days). Peak harvests occurred during the first and third weeks of
September and since coho were not held for egg -take, the harvest dates roughly coincide with
migration of coho into the river (Table 14). Like the chinook, the coho runs had decre2.sed
significantly by late October.
A total of 16,724 coho were harvested. The total weight calculated from biological
samples was 92,165 pounds (Table 5). This was the second smallest harvest and rate of return
since 1975.
The age composition of the harvested coho was 125 (0.7%) age -1.0 jacks weighing 177
pounds and 16,599 (99.3%) age-l.l adults weighing 91,988 pounds (Table 14). The returning
age-l.0 jacks were 0.04% of the 1986 plant and the age-l.l adults were 4.4% of the 1985 plant.
All age-l.O and 44.4% of the age-l.l coho were males. The total run consisted of 55.2%
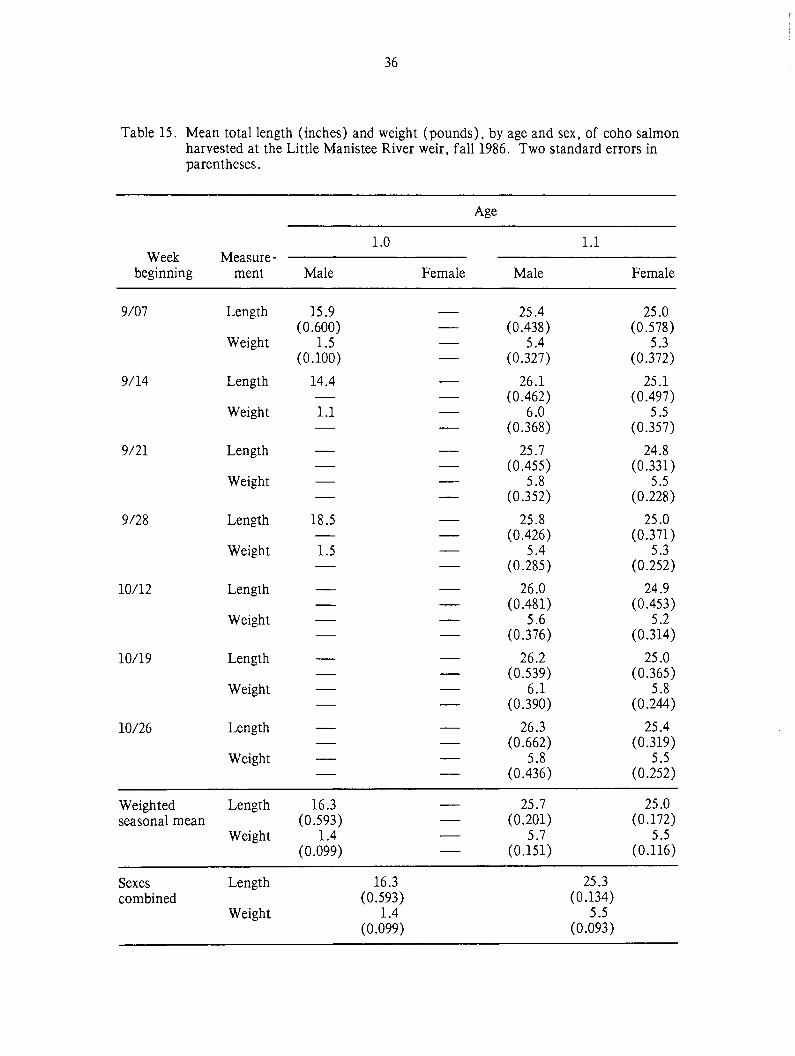
females. Mean lengths and weights \\'ere: age-I.O males, 16.3 inches and 1.4 pounds; age-I.1
males, 25.7 inches and 5.7 pounds; age-1.1 f~males, 25.0 inches and 5.5 pounds; and age-l.l
sexes combined, 25.3 inches and 5.5 pounds (Table 15). Adult males were slightly larger than
females.
Only 0.1% of the coho had lamprey wounds (Table 13). This rate was significantly less
than the 1960's.
No coho eggs were taken at the Little Manistee weir in 1986.
A total of 700 adult coho were randomly checked for fin clips. Of these fish, 2 (0.3%)
had left ventral (LV) fin clips. These fish could have been planted in 1985 by the Michigan
Department of Natural Resources into Lake Superior at Dead River (135,000Y), Black River
(70,OOOY), Portage Canal (52,OOOY), or Munising Bay (45,OOOY), or into Lake Michigan at
the Platte River (60,OOOY).
Skin color was examined on 700 coho salmon sampled at approximately weekly intervals
(Table 16). Most early run coho had silver skin, however, as the season progressed, fish lost

7
their silver speen and by late October most coho were dark colored. Females retained their
silver color long than males.
Steelhead trout
Fall steelhead began entering the river in late August and the run peaked during mid
October (Table 17). Approximately 50% of the total run occurred during this 2-week period.
As in most previous years, all steelhead were passed above the weir.
The 1986 run of 4,720 fish was less than last year (6,356), but was the second best run
since 1975 (Table 7). Forty-three percent (43%) of the returning adults were age 1.2 or 2.2
(Table 17). These two age groups also represented 49% of the total estimated weight of 34,342
pounds. Mean lengths and weights for 11 different age groups are given in Table 18 and Figure
7. Size of returning adults is more dependent upon years spent in Lake Michigan than on age at
smalting.
A total of 588 steelhead were randomly checked for fin clips. Fifty-one (8.7%) had fin
clips as follows:
Fin clip
Adipose (Ad)Dorsal-adipose (DAd)Adipose-left ventral (AdLV)Adipose-both ventrals (AdB\T)Adipose-right ventral (AdRV)Adipose-left pectoral (AdLP)Adipose-left pectoral-right ventral (AdLPRV)Adipose-left pectoral- both ventrals (AdLPBV)Left pectoral (LP)Right pectoral (RP)Right pectoral-left ventral (RPLV)Left pectoral-right ventral (LPRV)Both pectorals-right ventral (BPRV)Left ventral(LV)Both ventrals (BV)Adipose-right pectoral (AdRP)
Numberof fish
12
1317212312112111
The DAd fish (2) were planted in the Little Manistee River in 1983. The AdRV fish (2)
and AdLP fish (1) were planted in Lake Michigan by Wisconsin in 1984. The AdLV fish (13
Umpqua strain of summer steelhead), AdBV fish (17 Siletz strain of summer steelhead),
LPRV fish (1 Rogue strain of summer steelhead), and AdRP fish (1 Skamania strain of
summer steelhead) were all planted in Lake Michigan by Michigan in 1984. Origins of the 14
remaining fish could not be decided because fin clips. age (from scales), and planting records
did not coincide.

8
An intensive study of steelhead and their reproduction in the Little Manistee River has
been concluded by Paul Seelbach, Institute for Fisheries Research, Ann Arbor, Michigan.
Brown trout
The anadromous brown trout run peaked in late September and lingered into November
(Table 19). All but 10 brown trout were passed above the weir.
The 1986 run of 99 fish was down from the previous 2 years (Table 8). About 86% of
the returning adults were age 1.1 or 1.2 (Table 19). These two age groups represented 85% of
the total estimated weight of 554 pounds. Mean lengths and weights for the six represented age
groups are given in Table 20 and Figure 8. Size of returning adults is more dependent upon
years spent in Lake Michigan than on age at smolting.
A total of 93 brown trout were randomly checked for fin clips. Only 5 (5.4%) had fin
clips. Observed fin clips were included: left pectoral (LP, 1 fish); right pectoral (RP, 1 fish);
left pectoral-right pectoral (LPRP, 2 fish); and left maxillary (LM, 1 fish). Origins of these
fish could not be determined because fin clips, age 1 from scales, and planting records did not
coincide.
Brown trout are not planted in the Little Manistee River. Therefore, it is assumed that
these anadromous fish are from wild stock or from hatchery stock planted in Lake Michigan at
Manistee.
Atlantic salmon
No Atlantic salmon were collected at the weir ill 1986.
Pink salmon
No pink salmon were collected at the weir in 1986.
SUMMARY
In 1986 the Little Manistee harvest weir was in operation from August 22 through
November 12 (83 days) . Harvest of chinook and coho salmon and passage of other
anadromous salmonids occurred from September 8 through November 12.
The entire salmon run of 22,131 chinook (298,188 pounds) and 16,724 coho (92,165
pounds) was harvested and sold to Tempotech Industries, Hart, Michigan.
The chinook run consisted of 397 age-O.1 jacks (0.1% of the 1985 fingerling plant), 1,025
age-O.2 adults (0.1% of the 1984 fingerling plant), 13,850 age-0.3 adults (2.0% of the 1983
fingerling plant), 6,849 age-0.4 adults (1.1% of the 1982 fingerling plant), and 10 age-0.5
adults (less than 0.1% of the 1981 fingerling plant). Mean sizes were: age 0.1,21.0 inches (4.2
pounds); age 0.2, 28.3 inches (7.6 pounds); age 0.3, 33.6 inches (12.7 pounds); age 0.4, 36.9
inches (17.1 pounds); and age 0.5, 42.0 inches (25.5 pounds). During chinook egg-take
operations (September 23 through October 24) 3,572 females (ages 0.2, 0.3, and 0.4) were

9
stripped to obtain 16,613,648 eggs. The percent eye-up ranged from 18.5% (September 26) to
73.0% (September 23 and 24). During the first 9 days of egg -take, the river water temperature
exceeded 50 0 F .
The 1985 coho run was composed of 125 age-1.0 jacks (0.04% of the 1986 yearling plant)
and 16,599 age-1.1 adults (4.4% of the 1985 yearling plant). Mean sizes were: age 1.0, 16.3
inches (1.4 pounds); and age 1.1, 25.3 inches (5.5 pounds).
The 1986 fall steelhead run of 4,720 fish included 11 different age groups. Forty-three
percent (43%) of the fish were age 1.2 or 2.2 (three summers in Lake Michigan). Nearly two
thirds of the fin -clipped steelhead were summer strains (Umpqua, Siletz, Rogue, and
Skamania) planted in Lake Michigan by Michigan in 1984.
The fall brown trout run of 99 fish was less than the previous 2 years. About 86% of the
returning adults were age 1.1 or 1.2.
No Atlantic salmon or pink salmon returned to the weir in 1986.
RECOMMENDATIONS FOR 1987
Use only data from biological samples to calculate weekly weights of chinook and coho
salmon harvested. Do not scale sample river-run chinook salmon because their scales are
severely eroded and are missing annuli; instead, collect scale samples from Lake Michigan
chinook in the fall. Utilize the "dry" method for chinook egg-take. This method involves
mixing eggs (from several females) with sperm in a 5-gallon plastic pail without water and
letting the mixture stand for 30 minutes before water -hardening.
ACKNOWLEDGMENTS
Data collection, tabulation, and scale reading were done by Alfred Allen, Janice Sapak,
Simeon Syrewicze, and Steve Lazar. Kelley Smith developed a computer program for data
analyses and provided technical advice.
10
Dam a Pipe Weir
~Flow
II III BI, y-pass
p-Recoveryf, TankI I
Spawn aHarvestBuilding
EarthPonds
FishLadder
Figure 1. Location and schematic diagram of the Little Manistee River weir complex.

11
30
20
~
lI)Q).c 28oce--......J 26
=E, ~C 24Q)
~t ,
t ,t ,
t ,t ,t ,t ,t' t:'\t, /~t, I \
,I. \ / \n ~ / \n ......-u I' r/ \\\
(3"'-'0 ", " \ ~, /" \f::l I , I~ I \ I \
, I h' \
',&--o--e 0 e
Yeorho rvested
10".-....
CI)
-u8 c
:J0a.
6 '-'"
+-.c0)
4 e-
Q)
~
2 C0Q)
~0
Figure 2. Mean total length (inches) and round weight (pounds) of age-D.l (jack)chinook salmon harvested at the Little Manistee River weir. Vertical barsindicate two standard errors.

12750
CI)~ 650ClUJc-c
c 5501..0o (I)
~~ 450,+--c0 0 350L-CQ) Q)
.a ~ 250EC:JO
Z 0.150 PJ50 tJ
o Age 1.1
II Age 1.0
16
14
12 E:J
10 CDL.
8 ~
C6 Q)
0L.
4 Q)
a...2
?? ? ? ? ? ? ?
0fo~ ~OJ ~, ~'*' ~" ~A... t?> ~, ~'*' ~"~A\,q ,q ,OJ ,~ ,OJ ,OJ , ,OJ ,~ ,~
Year classFigure 3. Percent return, by age, of coho salmon year classes to the Little Manistee River
weir compared with the number of yearlings planted. Question marks (?)indicate incomplete return data.

13
30
28 0
10
8~~a,
B "'&t~~m""1l 6 ""........
4(I)
-C
2C::l
00a.
'---"........c0')e-O)
~
CC0)
~
3
B~~f--a....! 2
~'1D
1
Age 1. 1
26
14
24
22
ccQ) 16~
~
UJQ)
..coc
Age 1.0
Year harvested
Figure 4. Mean total length (inches) and round weight (pounds) of age-I.O and age-l.lcoho salmon harvested at the Little Manistee River weir. Vertical bars indicatetwo standard errors.

14
45~
(I)Q)
..c 40oC.-
'--" 35 ~
..c......OlC 30Q)
~ 25Q)
~
20
30
......15 ..c
Ol.-10 ~
C5 C ·
Q)
~--_----r-----__.___---__---_----.... 0
0.1 0.2 0.3
Age0.4 0.5
Figure 5. Mean total length (inches) and round weight (pounds), by age, of chinooksalmon harvested at the Little Manistee River weir, fall 1986. Vertical barsindicate two standard errors.

15
65
60
I II~ II1.L0
~55
Q)L-::J
" II+-cL-Q) 50a.E I II" I
Q)+-
I" IL-a> 45
II+-c3
I I40
35
tc--Egg take--~
14-20 21-27
Sept.28-4
I5-1·1 12-18 19-25
Oct.26-1 2-8
INov.
Figure 6. Daily minimum and maximum water temperatures for the Little ManisteeRiver) fall 1986. '

16
35~
(I)Q)
..co 30C
£ 25ClCQ)
C 20CQ)
~
15
14~
en12 -C
C:::J
10 0a.
........."
8 .......c
6 Cle-
Q)
4 ~
C
2 CQ)
~-.------.-----,---y-----r------r------,~-_r___-___r_-___,.-- --L 01.02.01.12.13.1 1.22.21.32.31.42.4
Age
Figure 7. Mean total length (inches) and round weight (pounds), by age, of steelheadpassed upstream at the Little Manistee River weir, fall 1986. Vertical barsindicate two standard errors.

17
25~
(I)Q)
..c 23oCe-
'--' 21..c......OlC 19Q)
15
_--8t:\.-------...... .:;1............
..........at........, ..."
~ ".,.----------8',,,,,,,,,,,,,,,,,r1
4.0 1.1 2. 1 1.2
Age2.2 1.3
10~
(I)
-C8 C
:J0a.
6 .........",
......
..cOl
4 e-O)
~
2 CC0)
~0
Figure 8. Mean total length (inches) and round weight (pounds), by age, of brown troutpassed upstream at the Little Manistee River weir, fall 1986. Vertical barsindicate two standard errors.

18

19
Table 2. Number, by age, of chinook salmon harvested at the Little Manistee River weir,fall 1968-86. Weight (pounds) is in parentheses.
Agel
Year 0.1 0.2 0.3 0.4 0.5 Adult2 Mortalities 3 Total
1968 9,597 0 0 1,633 11,230
1969 5,175 18,693 0 2,420 26,288
1970 4,670 11,100 18,420 0 34,190
1971 2,885 11,913 6,415 21,213
1972 1,900 23,094 24,994
1973 1,153 15,323 16,476
1974 1,938 21,412 806 24,156
1975 762 27,106 1,360 29,228
1976 2,738 '12,560 805 56 16,159
1977 11,136
1978 20,230
1979 22,925
1980 1,891 6,620 7,250 15,761(234,366)
1981 11,811(188,939)
1982 2,077 12,281 14,358(165,412)
1983 8,865 17,637 12,857 39,359(534,595)
1984 5,914 18,342 8,376 32,632(436,057)
1985 2,005 6,326 19,437 5,990 248 34,006(442,153)
1986 397 1,025 13,850 6,849 10 22,131(298,188)
lSee footnote in Introduction about aging.
2Ages 0.2 through 0.5 combined.
3Mortalities are included under age group headings in someyears.

20
Table 3. Numbers, and in parentheses percent, by age, of chinook and coho salmon invarious year classes returning to the Little Manistee River weir 1 to 5 years afterstocking.
AgeYear Numberclass stocked 0.1 0.2 0.3 0.4 0.5 Total
Chinook1
1967 590,830 11,230 20,588 18,420 50,238(1.9) (3.5) (3.1) (8.5)
1968 321,912 5,700 11,100 6,415 23,215(1.8) (3.4) (2.0) (7.2)
1981 500,204 2,077 17,637 8,376 5,990 10 34,090(0.4) (3.5) (1.7) (1.2) ( <0.0) (6.8)
1982 600~294 8,865 18,342 19,437 6,849 53,493(1.5) (3.1) (3.2) (1.1) (8.9)
Agey"ear Numberclass stocked 1.0 1.1 Total
Coho
1967 148,365 501 22,306 22,807(0.3) (15.0) (15.4)
1968 700,002 2,880 105,006 107,886(0.4) (15.0) (15.4)
1973 150,067 979 15,334 16,313(0.7) (10.2) (10.9)
1974 200,601 492 23,525 24,017(0.2) (11.7) (12.0)
1981 200,000 873 24,264 25,137(0.4) (12.1) (12.6)
1982 429,612 2,704 33,764 36,468(0.6) (7.9) (8.5)
1983 500,066 218 15,177 15,395( <0.0) (3.0) (3.1)
1984 375,283 79 16,599 16,678( <0.0) (4.4) (4.4)
lSee footnote in Introduction about aging.

21
Table 4. Mean total length (L, in inches) and weight (W, in pounds), by age, of chinooksalmon harvested at the Little Manistee weir, fall 1968-86. For chinook in 1972-75and 1982, lengths and weights shown under age 0.2 are for ages 0.2 and oldercombined.
Age
0.1 0.2 0.3 0.4 0.5
Year L W L W L W L W L W
1968 25.2 5.8
1969 24.9 6.0 34.2 15.9
1970 24.7 6.3 34.7 16.6 39.8 23.0
1971 5.2 15.0 22.7
1972 22.6 4.3 35.6 17.7
1973 22.4 4.4 36.0 17.8
1974 22.5 4.4 34.9 16.7
1975 24.2 6.4 37.1 20.2
1976 29.0 9.5 37.5 20.9 41.7 29.2
1977 23.4 4.6 34.6 15.0 38.1 20.1
1978 25.0 5.8 30.3 10.1 35.0 15.5
1979 26.5 7.4 34.6 15.1 35.7 16.9
1980 22.2 4.5 34.3 15.4 36.4 19.3
1981
1982 20.2 3.0 35.3 14.5
1983 22.0 4.4 33.6 14.0 37.0 19.3
1984 24.3 5.2 34.3 13.4 38.3 18.9
1985 22.7 4.5 30.8 9.5 34.4 13.4 37.3 17.7 41.1 22.0
1986 21.0 4.2 28.3 7.6 33.6 12.7 36.9 17.1 42.0 25.5
1 Ages of chinook prior to 1977 were determined from length -frequency distributions; in1977-80 and 1983-86, from scale samples and length-frequency distributions. Seefootnote in Introduction regarding uncertainties of aging age-0.2 and older chinook.

22
Table 5. Number, by age, of coho salmon harvested at the Little Manistee River weir, fall1968-86. Weight (pounds) is in parentheses.
Age
Year 1.0 1.1 Mortalities l Total
1968 490 58,422 1,336 60,248
1969 2,831 21,925 430 25,186
1970 3,300 102,100 3,000 108,400
1971 59,123
1972 2,314
1973 11,872
1974 939 4,928 262 6,129
1975 470 14,633 760 15,863
1976 978 23,480 47 24,505
1977 25,255
1978 23,696
1979 27,925
1980 900 49,104 50,004(353,043)
1981 (96,733)
1982 873 17,585 18,458(110,745)
1983 2,704 24,264 26,968(175,157)
1984 218 33,764 33,982(192,071)
1985 79 15,177 15,256(96,798)
1986 125 16,599 16,724(92,165)
IMortalities are included under age group headings in some years.

23
Table 6. Mean total length (L, in inches) and weight (W, in pounds), by age, of cohosalmon harvested at the Little Manistee River weir, fall 19.68-86.
Age
1.0 1.1
Year L W L W
. 1968 28.1 8.7
1969 8.9
1970 8.0
1971 8.7
1972 26.3 6.5
1973 24.5 5.8
1974 14.9 1.2 25.7 6.1
1975 15.0 1.4 26.6 7.3
1976 15.7 1.5 25.7 6.4
1977 14.3 1.2 25.5 5.5
1978 15.1 1.4 25.2 5.6
-1979 15.2 1.6 23.5 4.9
19801 16.3 1.7 26.9 6.9
1981
1982 15.7 1.6 25.6 6.1
1983 15.9 1.9 26.4 7.0
1984 16.2 1.8 24.7 5.7
1985 15.7 1.6 25.9 6.4
1986 16.3 1.4 25.3 5.5
1Ages of coho in 1980 were determined from· a length -frequency distribution.

24
Table 7. Number and mean total length (L, in inches) and weight (W, in pounds) ofsteelhead (ages combined) collected at the Little Manistee River weir, fall 1968-86.
Number Mean
Year Passed Transferred Mortalities Total L W
1968 1,297 0 25 1,322 25.1 7.3
1969 2,987 0 56 3,043 25.6 7.8
1970 7,322 0 89 7,411 8.7
1971 7,523 0 99 7,622 8.8
1972 3,515 0 46 3,561 27.4 9.3
1973 421 1,4781 27 1,926 24.3 6.5
1974 2,270 1,2001 18 3,488 26.4 7.3
1975 4,722 1,3001 99 6,121 26.7 8.0
1976 503 45 30 578 26.8 7.6
197"7 2,031 2,031 26.7 6.8
1978 320 320
1979 640 640 25.6 6.7
1980 1,111 1,111 25.6 7.0
1981 849 849
1982 347 347 25.2 6.9
1983 3,100 3,100 24.3 6.8
1984 1,830 79 1,909 26.0 7.1
1985 6,187 169 6,356 27.1 7.4
1986 4,646 162 58 4,720 26.0 7.3
ITransferred to Big Manistee and Pine rivers.
2Summer strain steelhead transferred to Wolf Lake Hatchery.

25
Table 8. Number and mean total length (L, in inches) and weight (W, in pounds) ofbrown trout (ages combined) collected at the Little Manistee River weir, fall 1968-86.
Number Mean
Year Passed Mortalities Total Length Weight
1968 28 28
1969 36 36
1970 123 123 5.6
1971 69 69
1972 5 5
1973 45 3 48
1974 159 2 161 19.4 3.4
1975 238 a 238 21.8 5.0
1976 104 2 106 22.9 5.8
1977 98 98 19.3 3.5
1978 51 51
1979 100 100 23.4 6.8
1980 28 28 18.6 3.4
1981 101 101
1982 62 62 21.4 4.9
1983 43 43 22.4 6.0
1984 134 7 141 22.4 5.3
1985 162 15 177 23.2 6.21986 89 10 99 22.4 5.6

26
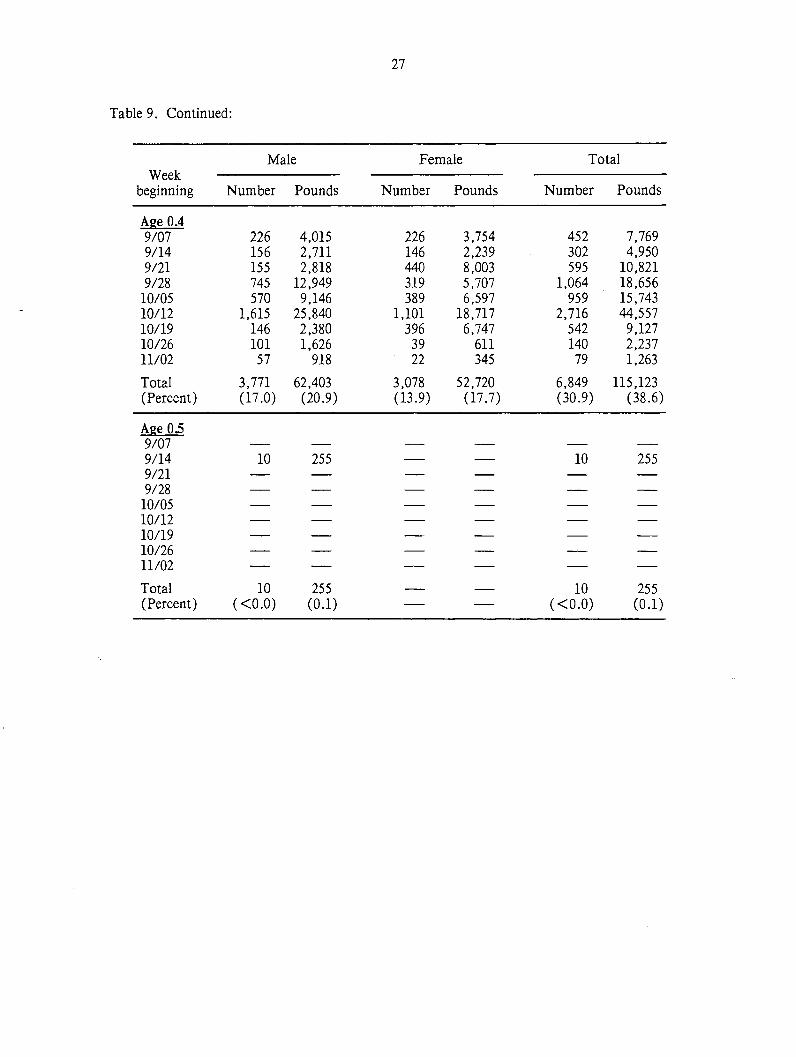
Table 9. Summary of the number and weight, by age and sex, of chinook salmon harvestedat Little Manistee River weir, fall 1986. Weight of stripped females wasrecalculated into round weight and, therefore, the total weight of chinook does notcorrespond with the weight shipped to Tempotech Industries.
Male Female TotalWeek
beginning Number Pounds Number Pounds Number Pounds
Age 0.19/07 185 872 185 8729/14 31 123 31 1239/21 104 380 104 3809/28 35 130 35 130
10/0510/1210/19 21 95 21 84 42 17910/2611/02
Total 376 1,600 21 84 397 1,684(Percent) (1.7) (0.5) (0.1) ( <0.0) (1.8) (0.6)
Age 0.29/07 82 668 41 344 123 1,0129/14 31 230 10 95 41 3259/21 130 1,011 26 156 156 1,1679/28 177 1,161 177 1,161
10/05 78 611 26 226 104 83710/12 220 1,716 74 644 294 2,36010/19 83 691 21 195 104 88610/26 17 97 17 9711/02 9 51 9 51
Total 827 6,236 198 1,660 1,025 7,896(Percent) (3.7) (2.1) (0.9) (0.6) (4.6) (2.6)
Age 039/07 411 5,121 884 11,467 1,295 16,5889/14 261 3,304 396 5,233 657 8,5379/21 518 5,905 1,218 15,748 1.,736 21,6539/28 994 12,602 1,278 17,253 2,272 29,855
10/05 752 8,855 778 9,769 1,530 18,62410/12 2,129 25,122 2,203 27,758 4,332 52,88010/19 647 7,501 751 9,986 1,398 17,48710/26 185 2,139 218 2,723 403 4,86211/02 104 1,206 123 1,538 227 2,744
Total 6,001 71,755 7,849 101,475 13,850 173,230(Percent) (27.1) (24.1) (35.5) (34.0) (62.6) (58.1)
27
Table 9. Continued:
Male Female TotalWeek
beginning Number Pounds Number Pounds Number Pounds
Age 0.49/07 226 4,015 226 3,754 452 7,7699/14 156 2,711 146 2,239 302 4,9509/21 155 2,818 440 8,003 595 10,8219/28 745 12,949 319 5,707 1,064 18,656
10/05 570 9,146 389 6,597 959 15,74310/12 1,615 25,840 1,101 18,717 2,716 44,55710/19 146 2,380 396 6,747 542 9,12710/26 101 1,626 39 611 140 2,23711/02 57 918 22 345 79 1,263
Total 3,771 62,403 3,078 52,720 6,849 115,123(Percent) (17.0) (20.9) (13.9) (17.7) (30.9) (38.6)
Age 0.59/079/14 10 255 10 2559/219/28
10/0510/1210/1910/2611/02
Total 10 255 10 255(Percent) ( <0.0) (0.1) ( <0.0) (0.1)
28

,"
Table 11. Mean total length (inches) and weight (pounds), by age and sex, of chinook salmon harvested at the Little Manistee River weir,fall 1986. Two standard errors in parentheses.
Age
0.1 0.2 0.3Week Measure-
beginning ment Male Female Male Female Male Female
9/07 Length 21.1 - 29.4 28.9 33.5 33.5(0.773) - (0.465) (0.600) (0.882) (0.396)
Weight 4.7 - 8.1 8.4 12.5 13.0(0.493) - (0.777) (2.200) (0.800) (0.526)
9/14 Length 21.6 - 27.2 31.9 33.7 33.5(0.467) - (3.180) - (1.005) (0.503)
Weight 4.0 - 7.4 9.5 12.7 13.2(0.968) - (2.439) - (0.932) (0.603) t>.:)
~
9/21 Length 20.5 - 28.9 28.7 32.9 33.5(1.005) - (0.841) - (0.904) (0.426)
Weight 3.7 - 7.8 6.0 11.4 12.9(0.252) - (1.011) - (0.908) (0.685)
9/28 J.Jength 21.0 - 26.3 - 34.2 33.7(1.743) - (0.664) (0.289)
Weight 3.7 - 6.6 - 12.7 13.5( 1.007) - (0.718) (0.518)
10/05 Length - - 28.3 30.0 34.1 33.7(0.333) - (0.831) (0.463)
Weight - - 7.8 8.7 11.8 12.6(0.851) - (0.723) (0.660)
10/19 Length 23.7 19.4 29.1 30.4 33.2 33.3(0.287) - (0.816) (0.621)
Weight 4.5 4.0 8.3 9.3 11.6 13.3(0.263) - (0.692) (0.606)

:E
Table 11. Continued:
Age
0.4 0.5Week Measure-
beginning ment Male Female Male Female
9/07 Length 37.3 35.9(0.882) (0.562)
Weight 17.8 16.6(1.390) (1.266)
9/14 Length 37.4 35.6 42.0(0.670) (0.408)
Weight 17.4 15.3 25.5(1.103) (0.697)
9/21 Length 38.1 36.7 - - c.v
(0.876) (0.612)!--"
Weight 18.2 18.2(2 ..967) (1.129)
9/28 Length 37.5 36.5(0.590) (0.607)
Weight 17.4 17.9(0.767) (1.275)
10/05 Length 37.5 36.7(0.501) (0.692)
Weight 16.0 17.0(0.851) (1.203)
10/19 Length 37.7 36.1(1.003) (0.405)
Weight 16.3 17.0(0.807) (Q.769)


33
Table 12. Summary of the chinook egg-take operation at the Little Manistee River weir,fall 1986 .. Eggs taken on September 23-24, 1986, were "eyed" at Wolf LakeHatchery then transferred to Platte River Hatchery for rearing.
Number of Number offemales eggs Percent
Date stripped collected eye-up Destination
9/19 6 24,739 MSU·
9/23 242 997,800 73.0 Wolf Lake
9/24 240 1,222,920 73.0 Wolf Lake
9/26 290 1,471,000 18.5 Thompson
9/27 284 1,200,000 72.9 Platte River
9/29 252 1,104,232 67.3 Platte River
9/30 244 1,070,972 69.4 Platte River
9/30 6 26,335 MSU·
10/01 288 1,383,616 70.0 Platte River
10/02 282 1,233,946 71.4 Platte River
10/06 198 907,428 Indiana
10/07 234 1,094,254 Illinois
10/09 20 90,000 MSU·
10/09 138 621,000 Wolf Lake(MSU)·
10/13 278 1,263,880 South Dakota
10/14 18 90,000 MSU·
10/14 132 665,200 South Dakota
10/15 204 1,147,998 Wolf Lake
10/16 210 968,328 Wolf Lake(MSU)*
10/24 6 30,000 MSU·
Total 3,572 16,613,648
In -state 2,730 12,682,886
Out-of -state 842 3,930,762
*MSU = Michigan State University.

34
Table 13. Percent lamprey scarring of c.nadromous salmonids captured at the LittleManistee River weir, fall 1968-86.
Salmon Trout
Year Chinook Coho Steelhead Brown
1968 3.7 4.3 6.0
1969 4.7 2.5 0.9
1970 4.0 1.0 2.0
1971 2.8 1.5 0.0
1972 0.4
1973 0.7 0.0 0.0
1974 0.8 0.9 0.0 0.0
1975 1.0 0.4 0.3 0.0
1976 0.0 0.0 0.0 <0.1
1977 0.0 0.0 0.0 0.0
1978
1979
1980 0.3 0.2 0.0 0.0
1981
1982 0.0 0.0 0.0 0.0
1983 0.1 0.0 0.0 0.0
1984 0.1 0.1 0.0 0.0
1985 0.5 0.2 0.0 0.0
1986 1.4 0.1 0.2 0.0

35
Table 14. Summary of the number and weight, by age and sex, of coho salmon harvested atthe Little Manistee River weir, fall 1986.
Male Female TotalWeek
beginning Number Pounds Number Pounds Number Pounds
Age 1.0
9/07 81 117 81 1179/14 14 15 14 159/219/28 26 39 26 39
10/05 4 6 4 610/1210/1910/2611/02
Total 125 177 125 177(Percent) (0.7) (0.02) (0.7) (0.2)
Age 1.1
9/07 2,425 13,152 1,536 8,133 3,961 21,2859/14 793 4,777 584 3,186 1,377 7,9639/21 1,471 8,578 2,733 15,141 4,204 23,7199/28 1,052 5,704 1,551 8,270 2,603 13,974
10/05 178 961 262 1,389 440 2,35010/12 585 3,289 687 3,595 1,272 6,88410/19 552 3,358 1,230 7,082 1,782 10,44010/26 200 1,167 406 2,223 606 3,39011/02 117 679 237 1,304 354 1,983
Total 7,373 41,665 9,226 50,323 16,599 91,988(Percent) (44.1) (45.2) (55.2) (54.6) (99.3) (99.8)
36

37
Table 16. Relationship between skin color and sex for coho salmon harvested at the LittleManistee River weir, fall 1986.
Percent
Silver DarkWeek
beginning Male Female Male Female
9/07 37 35 25 3
9/14 53 40 5 2
9/21 5 52 30 13
9/28 1 32 40 2710/12 2 3 44 5110/19 1 9 30 6010/26 3 6 30 61

38
Table 17. Summary of the number and weight, by age and sex, of steelhead passedupstream at the Little Manistee River weir, fall 1986.
Male Female Total
Weekbeginning Number Pounds Number Pounds Number Pounds
Age 1.09/07 1 1 ~ 1 19/149/21 7 14 36 67 43 819/28 8 14 67 122 75 136
10/05 3 6 26 59 29 6510/12 48 115 95 181 143 29610/19 106 233 106 23310/26 12 12 12 26 24 3811/02
Total 79 162 342 688 421 850(Percent) (1.7) (0.5) (7.3) (2.0) (8.9) (2.5)
Age 2.09/07 2 3 2 39/14 1 2 1 29/21 7 23 13 27 20 509/28 4 8 29 58 33 66
10/05 10 24 23 53 33 7710/12 48 108 71 166 119 27410/19 26 60 26 6010/2611/02 9 23 9 23
Total 80 189 163 366 243 555(Percent) (1.7) (0.6) (3.5) (1.1) (5.2) (1.6)
Age 1.19/07 2 10 3 12 5 229/14 1 3 1 7 2 109/21 16 87 10 40 26 1279/28 21 102 33 174 54 276
10/05 7 45 20 110 27 15510/12 24 127 48 290 72 41710/19 53 228 53 323 106 55110/26 36 235 36 23511/02 9 45 9 45 18 90
Total 133 647 213 1,236 346 1,883(Percent) (2.8) (1.9) (4.5) (3.6) (7.3) (5.5)

39
Table 17. Continued:
Male Female Total
Weekbeginning Number P01;lnds Number Pounds Number Pounds
Age 2.19/07 3 15 3 159/149/21 3 14 13 82 16 969/28 8 41 63 352 71 393
10/05 13 68 29 185 42 25310/12 119 697 71 419 190 1,11610/19 79 461 79 474 158 93510/26 24 145 83 587 107 73211/02 9 62 36 182 45 244
Total 258 1,503 374 2,281 632 3,784(Percent) (5.5) (4.4) (7.9) (6.6) (13.4) (11.0)
Age 3.1,9/079/149/21 3 21 3 219/28
10/0510/1210/1910/2611/02
Total 3 21 3 21(Percent) (0.1) (0.1) (0.1) (0.1)
Age 1.29/07 27 201 7 54 34 2559/14 8 60 10 76 18 1369/21 39 303 94 723 133 1,0269/28 38 338 63 500 101 838
10/05 36 313 49 398 85 71110/12 48 331 309 2~524 357 2,8~5
10/19 185 1,599 158 1,309 343 2,90810/26 71 607 95 809 166 1,41611/02 45 335 45 335
Total 452 3,752 830 6,728 1,282 10,480(Percent) (9.6) (10.9) (17.6) (19.6) (27.2) (30.5)

40
Table 17. Continued:
Male Felnale Total
Weekbeginning Number Pounds Number Pounds Number Pounds
Age 2.29/07 12 98 2 15 14 1139/14 1 8 2 13 3 219/21 39 343 20 170 59 5139/28 25 213 17 141 42 354
10/05 16 151 46 364 62 51510/12 24 149 48 403 72 55210/19 132 1,338 106 877 238 2,21510/26 107 873 36 294 143 1,16711/02 27 211 90 689 117 900
Total 383 3,384 367 2,966 750 6,350(Percent) (8.1) (9.9) (7.8) (8.6) (15.9) (18.5)
Age 1.39/07 1 8 1 89/14 1 10 2 19 3 299/21 13 126 13 1269/28 17 171 8 73 25 244
10/05 10 102 10 80 20 18210/12 119 1,211 48 398 167 1,60910/19 106 1,092 79 774 185 1,86610/26 24 190 47 481 71 67111/02 45 442 18 198 63 640
Total 335 3,344 213 2,031 548 5,375(Percent) (7.1) (9.7) (4.5) (5.9) (11.6) (15.7)
Age 2.39/07 2 21 2 219/149/21 7 72 13 121 20 1939/28 17 169 17 169
10/05 7 72 16 144 23 21610/12 71 705 71 70510/19 132 1,296 26 343 158 1,63910/26 24 268 12 134 36 40211/02 45 454 63 601 108 1,055
Total 305 3,057 130 1,343 435 4,400(Percent) (6.5) (8.9) (2.8) (3.9) (9.2) (12.8)

41
Table 17. Continued:
Male Female Total
Weekbeginning Number Pounds Number Pounds Number Pounds
Age 1.49/079/149/219/28
10/0510/1210/1910/26 12 109 12 10911/02 9 88 9 88
Total 12 109 9 88 21 197(Percent) (0.3) (0.3) (0.2) (0.3) (0.4) (0.6)
Age 2.49/079/149/219/28
10/05 3 29 3 2910/1210/1910/2611/02 36 418 36 418
Total 39 447 39 447(Percent) (0.8) (1.3) (0.8) (1.3)


Table 18. Continued:
Age
1.0 2.0 1.1 2.1Week Measure-
beginning ment Male Female Male Female Male Female Male Female
10/19 Length - 16.7 - 15.1 21.5 24.3 24.0 24.4(0.690) - - (7.000) (0.500) (2.099) (0.867)
Weight - 2.2 - 2.3 4.3 6.1 5.8 6.0(0.503) - - (2.600) (0.600) (1.444) (0.643)
10/26 Length 15.3 17.7 - - - 25.7 25.0 26.3(1.249) (0.600) (0.662)
Weight 1.0 2.2 - - - 6.5 6.1 7.1(0.940) (0.500) (0.525)
~
11/02 Length - - 18.0 - 23.1 22.4 25.7 24.0 w
(2.073)Weight - - 2.6 - 5.0 5.0 6.9 5.1
(1.509)
Weighted Length 17.1 16.8 18.3 17.2 22.6 24.1 24.5 24.8seasonal (0.415) (0.316) (0.297) (0.980) (3.696) (0.423) (0.834) (0.355)mean Weight 2.0 2.0 2.4 2.2 4.9 5.8 5.8 6.1
(0.164) (0.205) (0.087) (0.367) (1.381) (0.296) (0.612) (0.254)
Sexes Length 16.8 17.5 23.5 24.7combined (0.287) (0.609) (1.028 ) (0.373)
Weight 2.0 2.3 5.4 6.0(0.186) (0.228) (0.489) (0.272)
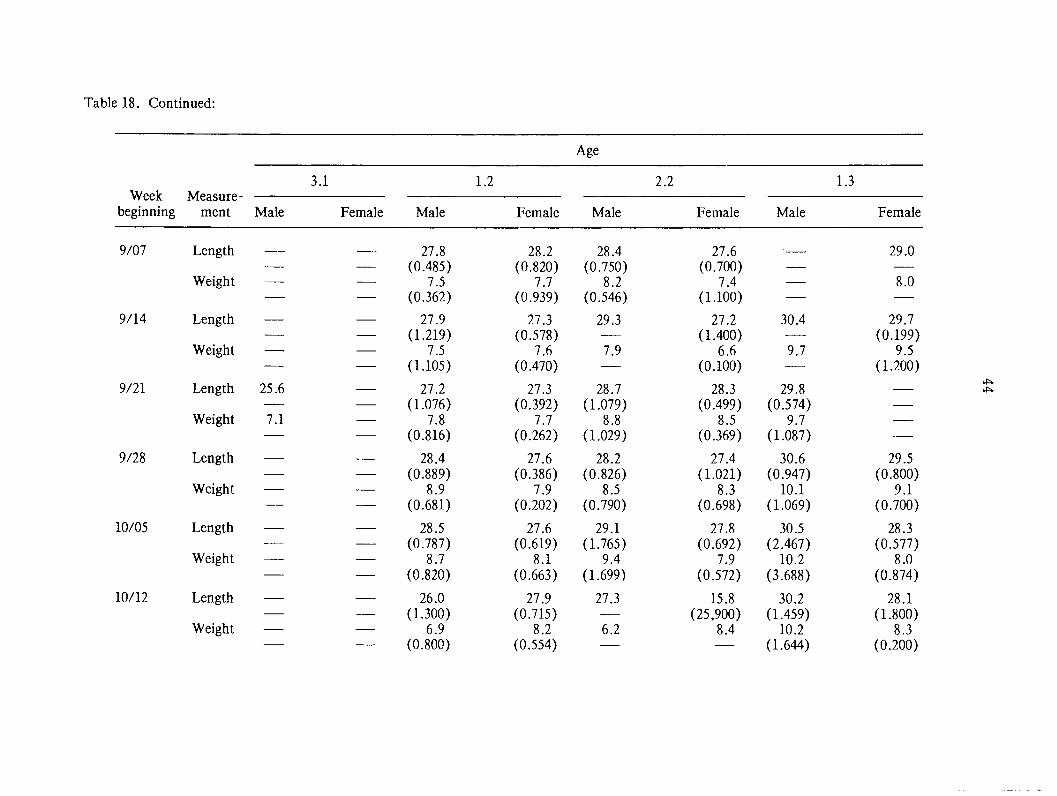
Table 18. Continued:
Age
3.1 1.2 2.2 1.3Week Measure-
beginning ment Male Female Male Female Male Female Male Female
9/07 Length -- - 27.8 28.2 28.4 27.6 - 29.0(0.485) (0.820) (0.750) (0.700)
Weight - - 7.5 7.7 8.2 7.4 - 8.0(0.362) (0.939) (0.546) (1.100)
9/14 Length - - 27.9 27.3 29.3 27.2 30.4 29.7(1.219) (0.578) - (1.400) - (0.199)
Weight - - 7.5 7.6 7.9 6.6 9.7 9.5(1.105) (0.470) - (0.100) - (1.200)
9/21 Length 25.6 27.2 27.3 28.7 28.3 29.8~
- - ~
(1.076) (0.392) (1.079) (0.499) (0.574)Weight 7.1 - 7.8 7.7 8.8 8.5 9.7
(0.816) (0.262) (1.029) (0.369) (1.087)
9/28 Length - - 28.4 27.6 28.2 27.4 30.6 29.5(0.889) (0.386) (0.826) (1.021) (0.947) (0.800)
Weight - - 8.9 7.9 8.5 8.3 10.1 9.1(0.681) (0.202) (0.790) (0.698) (1.069) (0.700)
10/05 Length - - 28.5 27.6 29.1 27.8 30.5 28.3(0.787) (0.619) (1.765) (0.692) (2.467) (0.577)
Weight - - 8.7 8.1 9.4 7.9 10.2 8.0(0.820) (0.663) (1.699) (0.572) (3.688) (0.874)
10/12 Length - - 26.0 27.9 27.3 15.8 30.2 28.1(1.300) (0.715) - (25,900) (1.459) (1.800)
Weight - - 6.9 8.2 6.2 8.4 10.2 8.3(0.800) (0.554) - - ( 1.644) (0.200)

Table 18. Continued:
Age
3.1 1.2 2.2 1.3Week Measure-
beginning ment Male Female Male Female Male Female Male Female
10/19 Length - - 28.0 27.2 29.7 27.5 30.3 29.4(1.135) (1.229) (1.623) (1.266) (1.313) (1.387)
Weight - - 8.6 8.3 10.1 8.3 10.3 9.8(1.026) (1.203) (1.136) (1.164) (0.648) (0.702)
10/26 Length - - 28.9 28.3 28.3 28.1 28.0 30.1(0.418) (0.582) (1.465) (2.117) (1.400) (0.250)
Weight - - 8.6 8.5 8.2 8.2 7.9 10.2(0.338) (0.620) (1.164) (1.683) - (0.695)
11/02 Length - - - 27.4 27.3 27.1 30.4 29.6 ~
(1.645) (1.405) (0.642) (1.167) (1.300) C1
Weight - - - 7.4 7.8 7.7 9.8 11.0(1.052) (1.419) (0.741) (1.051) (1.000)
Weighted Length 25.6 - 27.9 27.7 28.7 26.0 30.1 29.2seasonal - - (0.493) (0.367) (0.739) (3.346) (0.681) (0.657)mean Weight 7.1 - 8.3 8.1 8.8 8.1 10.0 9.5
(0.434) (0.317) (0.552) (0.410) (0.632) (0.313)
Sexes Length 25.6 27.8 27.4 29.8combined - (0.307) (1.646) (0.532)
Weight (7.1) (8.2) 8.5 9.8(0.257) (0.399) (0.464)

Table 18. Continued:
Age
Mea- 2.3 1.4 2.4Week sure-
beginning ment Male Female Male Female Male Female
9/07 Length 31.0(1.000)
Weight 10.6(1.200)
9/14 Length
Weight- - - - - -
~
9/21 Length 30.5 28.9 0)
(2.900) (0.668)Weight 10.3 9.3
(2.300) (0.812)
9/28 Length 30.3(0.699)
Weight 9.9(O.493)
10/05 Length 30.5 29.2 - - 30.2(3.600) (0.869)
Weight 10.3 9.0 - - 9.5(2.500) (0.456)
10/12 Length 30.2(2.041)
Weight 9.9(1.073)

Table 18. Continued:
Age
Mea- 2.3 1.4 2.4Week sure-
beginning ment Male Female Male Female Male Female
10/19 Length 29.5 30.0(1.810)
Weight 9.8 13.2(1.763)
10/26 Length 31.9 31.8 29.7(0.300)
Weight 11.1 11.2 9.1(0.500)
~
11/02 Length 30.5 29.3 - 29.6 32.0 -::J
(1.150) (0.733) - - (2.391)Weight 10.1 9.5 .- 9.8 11.6
(0.649) (0.938) - - (2.758)
Weighted Length 30.1 29.6 29.7 29.6 31.8seasonal (0.917) (0.496) - - (2.254)mean Weight 10.0 10.3 9.1 9.8 11.4
(0.797) (0.617) - - (2.600)
Sexes Length 30.0 29.7 31.8combined (0.647) - (2.254)
Weight 10.1 9.4 11.4(0.691) - (2.600)

48
Table 19. Summary of the number and weight, by age and sex, of brown trout passedupstream at the Little Manistee River weir, fall 1986.
Male Female TotalWeek
beginning NUITlber Pounds Number Pounds Number Pounds
Age 4.09/079/149/219/28
10/0510/12 1 1 1 110/1910/2611/02
Total 1 1 1 1(Percent) (1.0) (0.2) (1.0) (0.2)
Age 1.19/07 3 15 3 159/14 2 12 1 6 3 189/21 4 23 7 39 11 629/28 2 10 12 58 14 68
10/05 3 15 3 1510/12 1 5 8 36 9 4110/19 8 45 8 4510/26 6 30 6 3011/02 3 15 3 15
Total 9 50 51 259 60 309(Percent) (8.9) (9.0) (50.5) (46.8) (59.4) (55.8)
Age 2.19/07 2 10 1 5 3 159/149/21 1 6 1 5 2 119/28
10/0510/12 2 9 2 910/1910/2611/02
Total 3 16 4 19 7 35(Percent) (3.0) (2.9) (4.0) (3.4) (6.9) (6.3)

49
Table 19. Continued:
Male Female TotalWeek
beginning Number Pounds Number Pounds Number Pounds
Age 1.29/07 2 9 3 18 5 279/14 1 7 1 79/21 6 40 1 7 7 479/28 2 16 2 16 4 32
10/0510/12 3 22 5 26 8 4810/1910/2611/02
Total 14 94 11 67 25 161(Percent) (13.9) (17.0) (10.9) (12.1) (24.8) (29.1)
Age 2.29/07 1 7 1 79/149/219/28 1 8 1 8
10/0510/1210/1910/2611/02
Total 2 15 2 15(Percent) (2.0) (2.7) (2.0) (2.7)
Age 1.39/07 1 3 1 39/149/219/28 1 10 1 10
10/0510/12 2 20 2 2010/1910/2611/02
Total 1 3 3 30 4 33(Percent) (1.0) (0.5) (3.0) (5.4) (4.0) (6.0)

Table 20. Mean total length (inches) and weight (pounds), by age and sex, of brown trout passed upstream at the Little Manistee Riverweir, fall 1986. Two standard errors in parentheses.
Age
4.0 1.1 2.1Week Measure-
beginning ment Male Female Male Female Male Female
9/07 Length - - - 21.7 22.5 21.8(1.568) (0.900)
Weight - - - 5.1 5.2 4.9(0.462) (0.300)
9/14 Length - - 23.4 24.2(0.700)
Weight - - 6.2 6.1(1.300) c:.n- - - 0
9/21 Length - - 22.4 21.9 23.0 21.7(0.467) (0.906)
Weight - - 5.6 5.5 5.9 4.8(0.481) (0.907)
9/28 Length - - 20.9 21.4(1.300) (0.916)
Weight - - 4.8 4.8(0.900) (0.491)
10/05 Length - - - 21.5
Weight - - - 5.1
10/12 Length 15.5 - 22.0 21.3 - 21.3(0.648) - (2.100)
Weight 1.2 - 4.9 4.5 - 4.3(0.634) - (0.500)


Table 20. Continued:
Age
1.2 2.2 1.3Week Measure-
beginning ment Male Female Male Female Male Female
10/19 Length
Weight
10/26 Length
Weight- - - - - -
CJ1
11/02 Length c.v
Weight- - - - - -
Weighted Length 24.1 22.9 - 24.8 20.2 26.5seasonal (0.245) (0.462)mean Weighted 6.7 6.1 - 7.5 3.4 9.7
(0.173) (0.508 )
Sexes Length 23.6 24.8 25.0combined (0.256)
Weight 6.5 7.5 8.1(0.217)

54
LITERATURE CITED
Hay, R. L. 1986. Little Manistee River harvest weir and chinook salmon egg-take report~
1985. Michigan Department of Natural Resources, Fisheries Technical Report 8610, Ann Arbor.
Pecor, C. H. 1987. Platte River harvest weir and coho salmon egg-take report, 1986.Michigan Department of Natural Resources, Fisheries Technical Report 87-1, AnnArbor.
Pecor, C. H. 1986. Platte River harvest weir and coho salmon egg-take report, 1985.Michigan Department of Natural Resources, Fisheries Technical Report 86-3, AnnArbor.
Report approved by W. C. Latta
Typed by G. M. Zurek


