
Lekan Popoola, Iq Mead, Gregor Stewart, Ines Heimann, Christoph
Hüeglin, Michael Müeller and Rod Jones
Dr Vivien Bright University of Cambridge
Low Cost Sensor Networks for Urban Air-
Quality Monitoring Applications
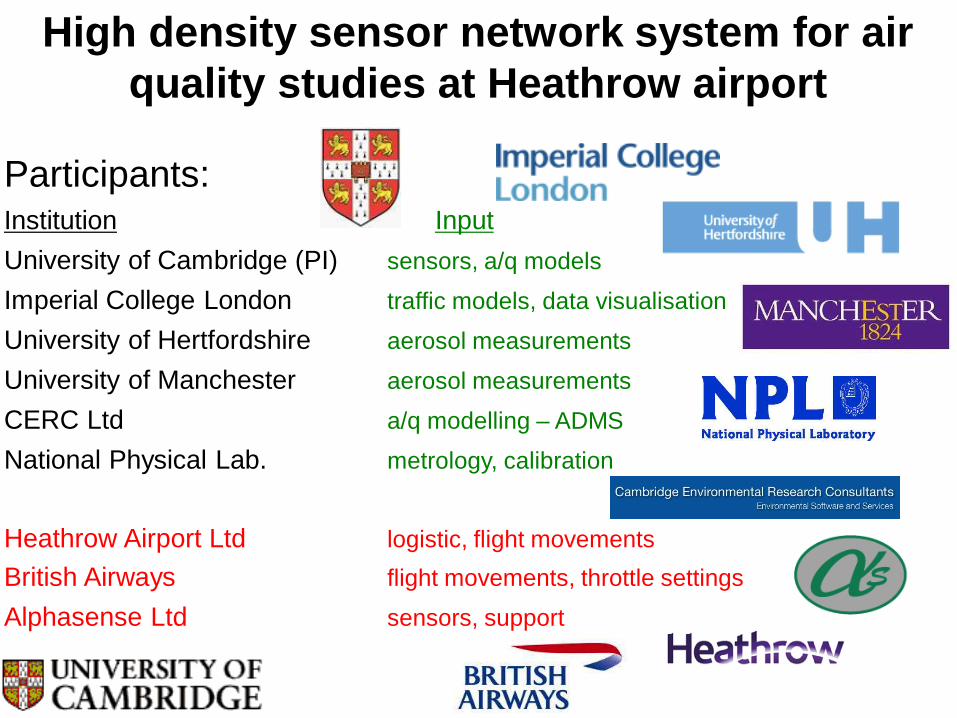
High density sensor network system for air
quality studies at Heathrow airport
Participants: Institution Input
University of Cambridge (PI) sensors, a/q models
Imperial College London traffic models, data visualisation
University of Hertfordshire aerosol measurements
University of Manchester aerosol measurements
CERC Ltd a/q modelling – ADMS
National Physical Lab. metrology, calibration
Heathrow Airport Ltd logistic, flight movements
British Airways flight movements, throttle settings
Alphasense Ltd sensors, support

• The SNAQ project
• Network calibration
• Separation of emission scales
• Source attribution
• Absolute emission factors (from data)
• ADMS model/measurement comparison
• High-resolution activity and emissions estimates
• Low cost PM – validation and next steps
• Commercial links/collaborations
• Acknowledgements
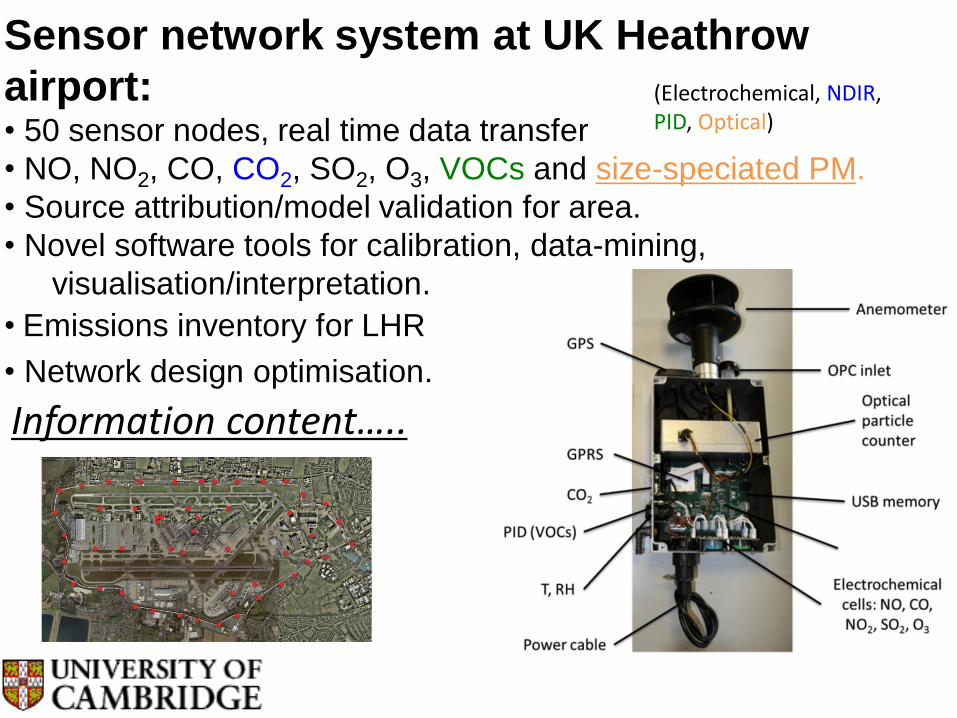
Sensor network system at UK Heathrow
airport: • 50 sensor nodes, real time data transfer
• NO, NO2, CO, CO2, SO2, O3, VOCs and size-speciated PM.
• Source attribution/model validation for area.
• Novel software tools for calibration, data-mining,
visualisation/interpretation.
• Emissions inventory for LHR
• Network design optimisation.
(Electrochemical, NDIR, PID, Optical)
Information content…..

(c)
T3
~ 7 km
T1 T5
T4
(a)
Fuel farm
LHR sensor network summary
• 40 sensor nodes
(airside/landside)
• >20 billion records….
Data collection complete, data analysis/interpretation underway

Example LHR results …….3 months
diurnal pattern……
bad data!
Sensor node 32

Example LHR results …….1 month
anti-cyclonic… PBL trapping
Sensor node 32
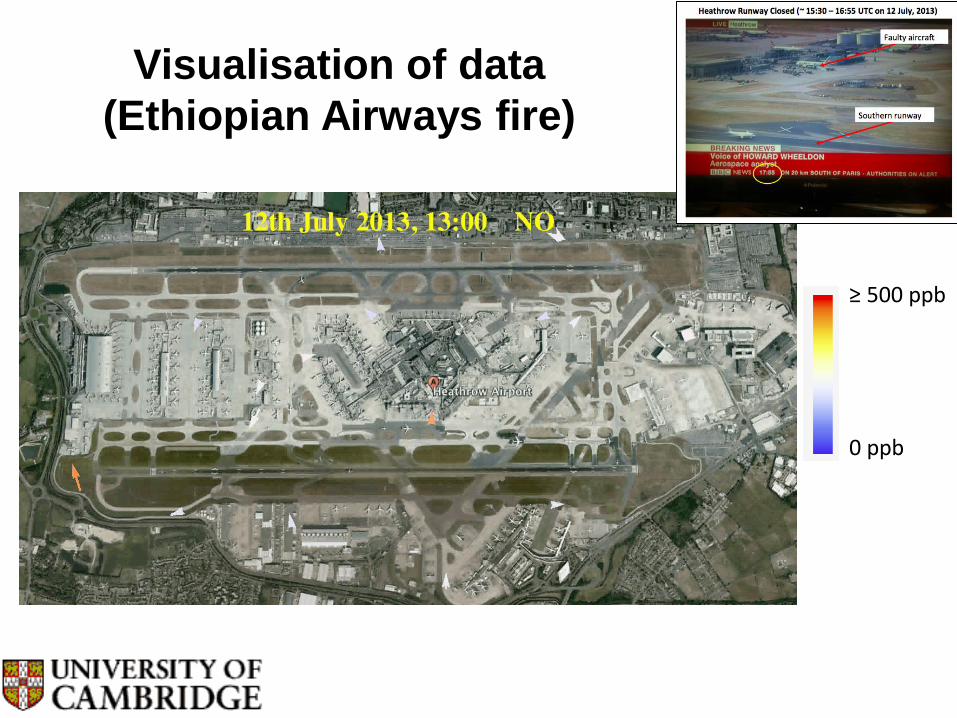
Visualisation of data
(Ethiopian Airways fire)
0 ppb
≥ 500 ppb

• The SNAQ project
• Network calibration
• Separation of emission scales
• Source attribution
• Absolute emission factors (from data)
• ADMS model/measurement comparison
• High-resolution activity and emissions estimates
• Low cost PM – validation and next steps
• Commercial links/collaborations
• Acknowledgements

Sensor baselines (usually*) similar
network calibration
Method for intra-calibrating (and error checking) sensor networks
Baseline replicated…….
Filtering methodologies
for event removal

Algorithms for correction of sensor drift, separation of
scales – interpolation methods (physical (e.g. ADMS);
statistical (LUR, Kriging))

• The SNAQ project
• Network calibration
• Separation of emission scales
• Source attribution
• Absolute emission factors (from data)
• ADMS model/measurement comparison
• High-resolution activity and emissions estimates
• Low cost PM – validation and next steps
• Commercial links/collaborations
• Acknowledgements

*Source attribution: local vs non-local
Local
Sensor node 32
Network calibration and scale information
Non-local

• The SNAQ project
• Network calibration
• Separation of emission scales
• Source attribution
• Absolute emission factors (from data)
• ADMS model/measurement comparison
• High-resolution activity and emissions estimates
• Low cost PM – validation and next steps
• Commercial links/collaborations
• Acknowledgements

Landside vs airside sources
N
Northern Perimeter Road
• High CO & NO mixing ratios at low WS (<5ms-1) in the NE quadrant of the plot suggest a suggest a pollution source to the north of the sensors (Northern Perimeter Road)
CO
CO
NO
NO

Source attribution: SNAQ17 at the west-end
of southern runway (09R) , 1 month data
CO NO NO2 CO2
< 0.5 µm > 0.5 µm > 1 µm 0.3 to 17.4 µm
OPC (number / cc)
Excluding fog events

Direct determination of transport activities
CO NO NO2 CO2
High CO2, high NOx, medium CO – take offs Medium CO2, low NOx, medium CO – taxiing
< 0.5 µm > 0.5 µm > 1 µm 0.3 to 17.4 µm
OPC (number / cc)
Also PM apportionment……

Cluster 1 in the 5-cluster solution Cluster 3 in the 5-cluster solution
CO Heathrow airport
CO Heathrow airport
Cluster 4 in the 5-cluster solution
CO Heathrow airport
CO Cambridge roadside
CO source
apportion: aircraft vs
roadside sources…
Airside/roadside source attribution:
diurnal signatures
5-cluster solution

Inferences from NOx/CO
ratios:
1. Take-off
4. Taxiway
5. Perimeter road traffic
Source attribution: Sensors at the west-end
of southern runway (09R)
NO
/ C
O r
ati
o
(c)
1
4 5
NOx/CO ratios

• The SNAQ project
• Network calibration
• Separation of emission scales
• Source attribution
• Absolute emission factors (from data)
• ADMS model/measurement comparison
• High-resolution activity and emissions estimates
• Low cost PM – validation and next steps
• Commercial links/collaborations
• Acknowledgements

Low High
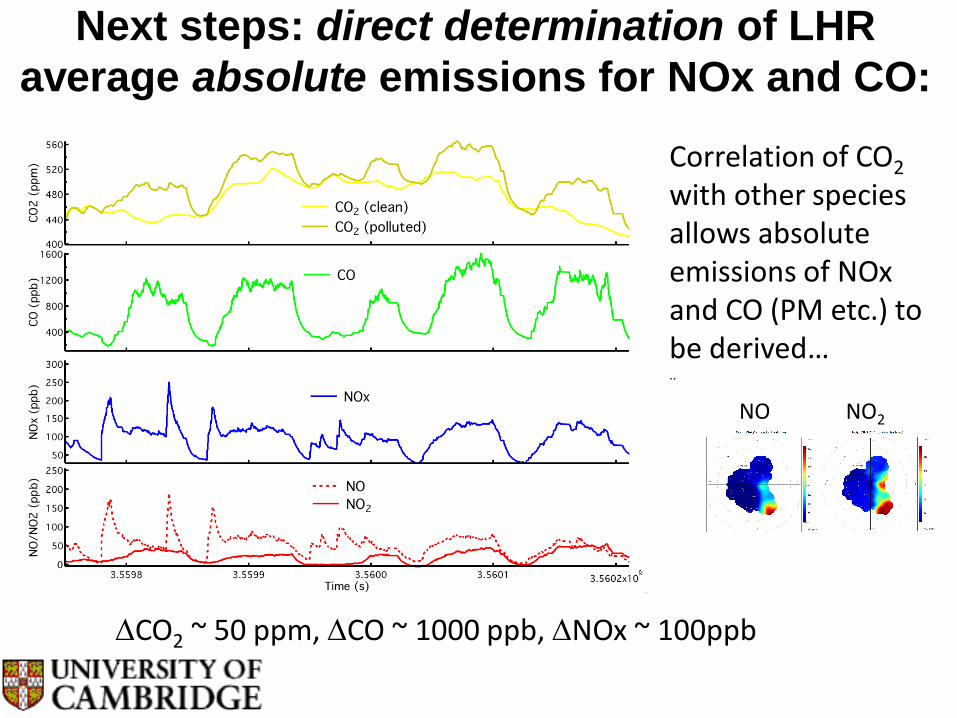
Next steps: direct determination of LHR
average absolute emissions for NOx and CO:
Correlation of CO2 with other species allows absolute emissions of NOx and CO (PM etc.) to be derived… ..
DCO2 ~ 50 ppm, DCO ~ 1000 ppb, DNOx ~ 100ppb
NO NO2

• The SNAQ project
• Network calibration
• Separation of emission scales
• Source attribution
• Absolute emission factors (from data)
• ADMS model/measurement comparison
• High-resolution activity and emissions estimates
• Low cost PM – validation and next steps
• Commercial links/collaborations
• Acknowledgements

Comparison of sensor data and ADMS-
Airport model predictions
• Hourly averages during focus period from November 2012
• Sites near runway
• Similar NOx concentration patterns for model predictions and SNAQ sensor time series
R = 0.82 SNAQ41
R = 0.85
SNAQ08
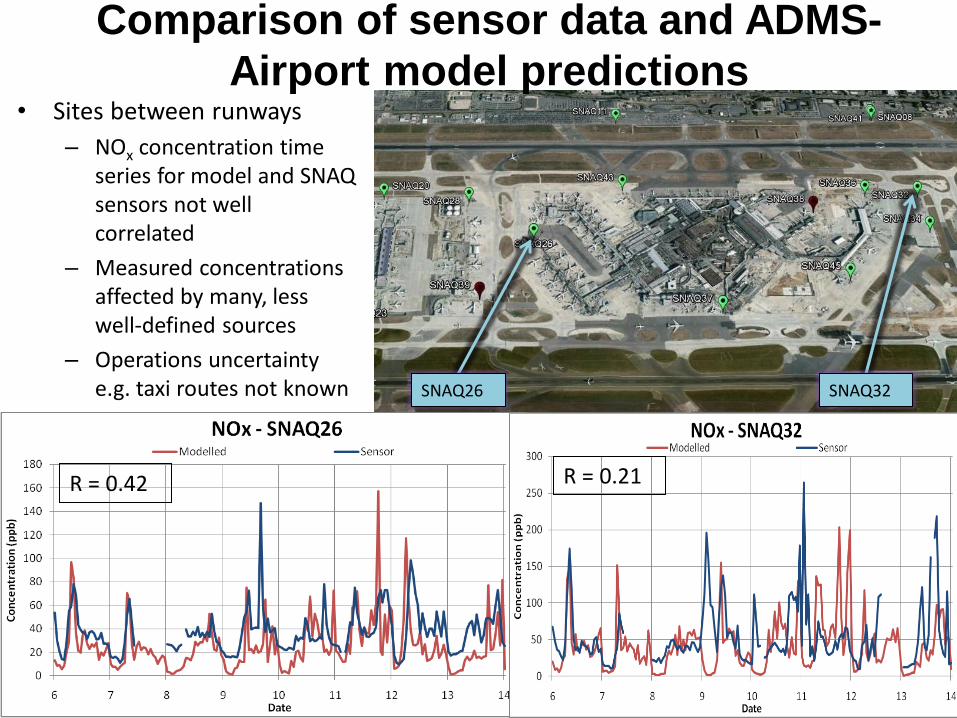
Comparison of sensor data and ADMS-
Airport model predictions • Sites between runways
– NOx concentration time series for model and SNAQ sensors not well correlated
– Measured concentrations affected by many, less well-defined sources
– Operations uncertainty e.g. taxi routes not known SNAQ32
R = 0.42 R = 0.21
SNAQ26

• The SNAQ project
• Network calibration
• Separation of emission scales
• Source attribution
• Absolute emission factors (from data)
• ADMS model/measurement comparison
• High-resolution activity and emissions estimates
• Low cost PM – validation and next steps
• Commercial links/collaborations
• Acknowledgements

High-resolution activity and emissions estimates
10,439 (52%) Summary data only;
limited trajectory, no fuel or thrust data
Airport activity database (BOSS) for 4th-18th November 2012 18,770 arrivals and departures at 1 min accuracy specifying runways, stands, aircraft type and engine
Developed to provide detail beyond the normal hourly resolution emissions inventory
~30 million source emission datapoints capturing aircraft activity at 1Hz Spatial, temporal and categorical queries used to examine behaviour
8,331 (48%) Flight Data Records;
1Hz 4D trajectory, fuel flow and thrust
Ricardo-AEA Emissions Estimator
BUCHAir A/C-Engine assignment
ICAO Emission
Factors DB SNAQ Emissions Proxiation Method
NERC showcase event 27th January 2014

NOx vs. Time for takeoff emissions and SNAQ air quality
• 1hr example; West-South-West prevailing wind, 27R takeoffs • Suggests correlation between increased modelled emissions
(g/s) and NOX concentrations (allowing for dispersion time) • Dispersion modelling and longer analysis periods required
27R Takeoff roll Emissions Source
Average wind
direction
SNAQ 08 SNAQ 41
SNAQ 41
SNAQ 08
27R Takeoffs

• The SNAQ project
• Network calibration
• Separation of emission scales
• Source attribution
• Absolute emission factors (from data)
• ADMS model/measurement comparison
• High-resolution activity and emissions estimates
• Low cost PM – validation and next steps
• Commercial links/collaborations
• Acknowledgements

Validation of low cost OPC

SNAQ OPC - mini commercial variant
- fog variant

• The SNAQ project
• Network calibration
• Separation of emission scales
• Source attribution
• Absolute emission factors (from data)
• ADMS model/measurement comparison
• High-resolution activity and emissions estimates
• Low cost PM – validation and next steps
• Commercial links/collaborations
• Acknowledgements

Commercial/technical links/partnerships
Geotech Ltd. Alphasense Ltd. (Instrument developer/manufacturer) (Sensor developer/manufacturer)

• The SNAQ project
• Network calibration
• Separation of emission scales
• Source attribution
• Absolute emission factors (from data)
• ADMS model/measurement comparison
• High-resolution activity and emissions estimates
• Low cost PM – validation and next steps
• Commercial links/collaborations
• Acknowledgements

Acknowledgements Rod Jones, Iq Mead
Lekan Popoola, Shaun Hurst, Gregor Stewart, Ines Heimann,
Greg Walters, (All UCAM)
John Saffell (Alphasense)
…..
Spencer Thomas, David Vowles (HAL/BAA, BA)
Jo Dicks, Anita Harris (Cambridge City Council)
Mark Hayes, Mark Calleja
Robin North/George Koudis et al.
Jeremy Cohen
Paul Kaye, Edwin Hirst, Warren Stanley
Alastair Forbes, Paul Quincey (NPL)
Paul Williams (UMAN)
David Carruthers, Chetan Lad…. (CERC)
…..
Funding Agencies: NERC, EPSRC

SNAQ project achievements (to date)
• Network calibration
• Separation of emission scales
• Source attribution
• Absolute emission factors (from data)
• ADMS model/measurement comparison
• High-resolution activity and emissions estimates
• Low cost PM – validation and next steps
• Commercial links/collaborations
Other applications: e.g. GHG networks, upper air,
medical/personal exposure…


