low cost sensor networks for urban air- quality monitoring ... · low cost sensor networks for...
TRANSCRIPT

Lekan Popoola, Iq Mead, Gregor Stewart, Ines Heimann, Christoph
Hüeglin, Michael Müeller and Rod Jones
Dr Vivien Bright University of Cambridge
Low Cost Sensor Networks for Urban Air-
Quality Monitoring Applications
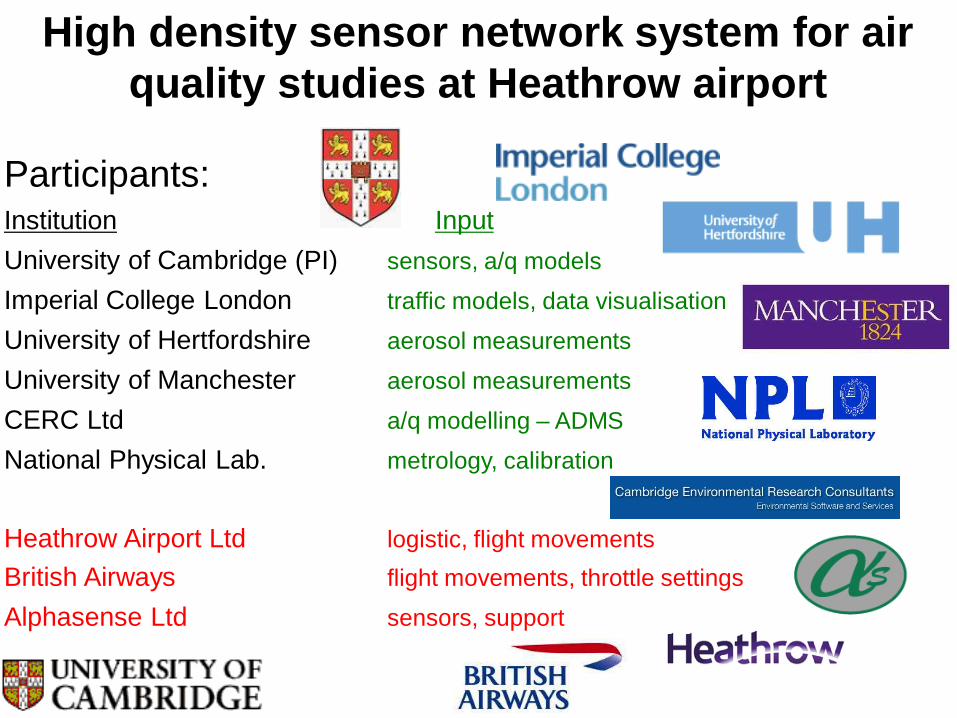
High density sensor network system for air
quality studies at Heathrow airport
Participants: Institution Input
University of Cambridge (PI) sensors, a/q models
Imperial College London traffic models, data visualisation
University of Hertfordshire aerosol measurements
University of Manchester aerosol measurements
CERC Ltd a/q modelling – ADMS
National Physical Lab. metrology, calibration
Heathrow Airport Ltd logistic, flight movements
British Airways flight movements, throttle settings
Alphasense Ltd sensors, support

• The SNAQ project
• Network calibration
• Separation of emission scales
• Source attribution
• Absolute emission factors (from data)
• ADMS model/measurement comparison
• High-resolution activity and emissions estimates
• Low cost PM – validation and next steps
• Commercial links/collaborations
• Acknowledgements
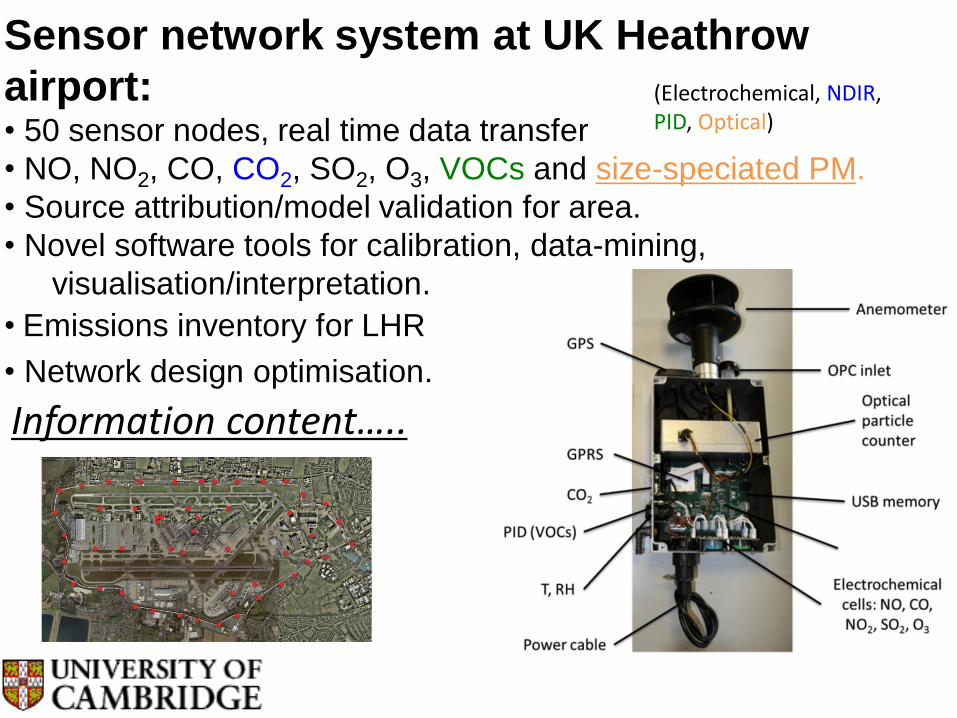
Sensor network system at UK Heathrow
airport: • 50 sensor nodes, real time data transfer
• NO, NO2, CO, CO2, SO2, O3, VOCs and size-speciated PM.
• Source attribution/model validation for area.
• Novel software tools for calibration, data-mining,
visualisation/interpretation.
• Emissions inventory for LHR
• Network design optimisation.
(Electrochemical, NDIR, PID, Optical)
Information content…..

(c)
T3
~ 7 km
T1 T5
T4
(a)
Fuel farm
LHR sensor network summary
• 40 sensor nodes
(airside/landside)
• >20 billion records….
Data collection complete, data analysis/interpretation underway

Example LHR results …….3 months
diurnal pattern……
bad data!
Sensor node 32

Example LHR results …….1 month
anti-cyclonic… PBL trapping
Sensor node 32
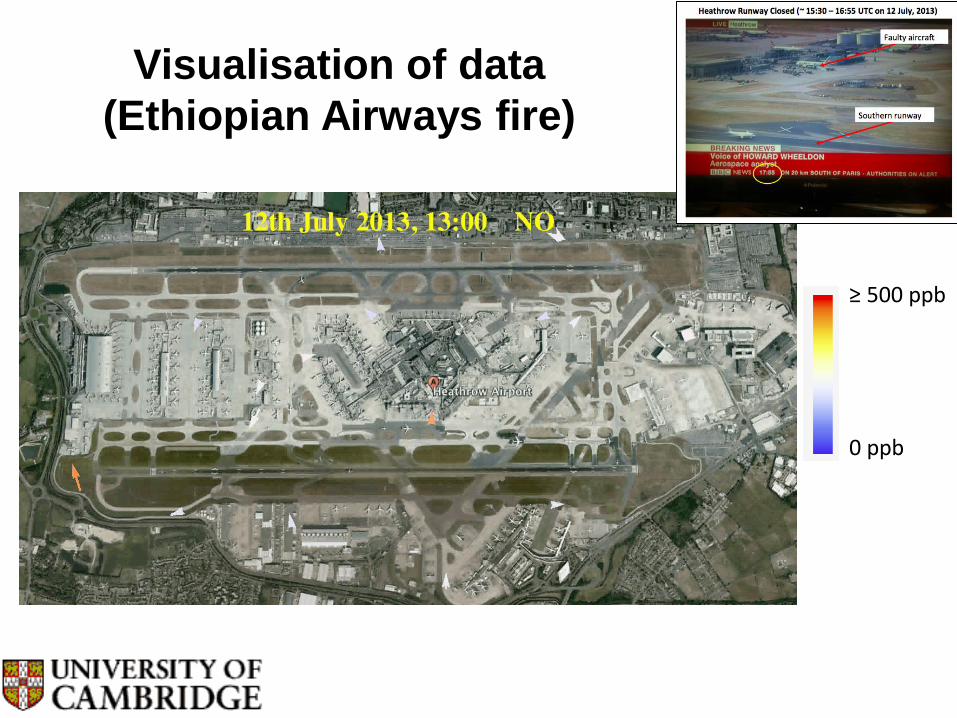
Visualisation of data
(Ethiopian Airways fire)
0 ppb
≥ 500 ppb

• The SNAQ project
• Network calibration
• Separation of emission scales
• Source attribution
• Absolute emission factors (from data)
• ADMS model/measurement comparison
• High-resolution activity and emissions estimates
• Low cost PM – validation and next steps
• Commercial links/collaborations
• Acknowledgements

Sensor baselines (usually*) similar
network calibration
Method for intra-calibrating (and error checking) sensor networks
Baseline replicated…….
Filtering methodologies
for event removal

Algorithms for correction of sensor drift, separation of
scales – interpolation methods (physical (e.g. ADMS);
statistical (LUR, Kriging))

• The SNAQ project
• Network calibration
• Separation of emission scales
• Source attribution
• Absolute emission factors (from data)
• ADMS model/measurement comparison
• High-resolution activity and emissions estimates
• Low cost PM – validation and next steps
• Commercial links/collaborations
• Acknowledgements

*Source attribution: local vs non-local
Local
Sensor node 32
Network calibration and scale information
Non-local

• The SNAQ project
• Network calibration
• Separation of emission scales
• Source attribution
• Absolute emission factors (from data)
• ADMS model/measurement comparison
• High-resolution activity and emissions estimates
• Low cost PM – validation and next steps
• Commercial links/collaborations
• Acknowledgements

Landside vs airside sources
N
Northern Perimeter Road
• High CO & NO mixing ratios at low WS (<5ms-1) in the NE quadrant of the plot suggest a suggest a pollution source to the north of the sensors (Northern Perimeter Road)
CO
CO
NO
NO

Source attribution: SNAQ17 at the west-end
of southern runway (09R) , 1 month data
CO NO NO2 CO2
< 0.5 µm > 0.5 µm > 1 µm 0.3 to 17.4 µm
OPC (number / cc)
Excluding fog events

Direct determination of transport activities
CO NO NO2 CO2
High CO2, high NOx, medium CO – take offs Medium CO2, low NOx, medium CO – taxiing
< 0.5 µm > 0.5 µm > 1 µm 0.3 to 17.4 µm
OPC (number / cc)
Also PM apportionment……

Cluster 1 in the 5-cluster solution Cluster 3 in the 5-cluster solution
CO Heathrow airport
CO Heathrow airport
Cluster 4 in the 5-cluster solution
CO Heathrow airport
CO Cambridge roadside
CO source
apportion: aircraft vs
roadside sources…
Airside/roadside source attribution:
diurnal signatures
5-cluster solution

Inferences from NOx/CO
ratios:
1. Take-off
4. Taxiway
5. Perimeter road traffic
Source attribution: Sensors at the west-end
of southern runway (09R)
NO
/ C
O r
ati
o
(c)
1
4 5
NOx/CO ratios

• The SNAQ project
• Network calibration
• Separation of emission scales
• Source attribution
• Absolute emission factors (from data)
• ADMS model/measurement comparison
• High-resolution activity and emissions estimates
• Low cost PM – validation and next steps
• Commercial links/collaborations
• Acknowledgements

Low High
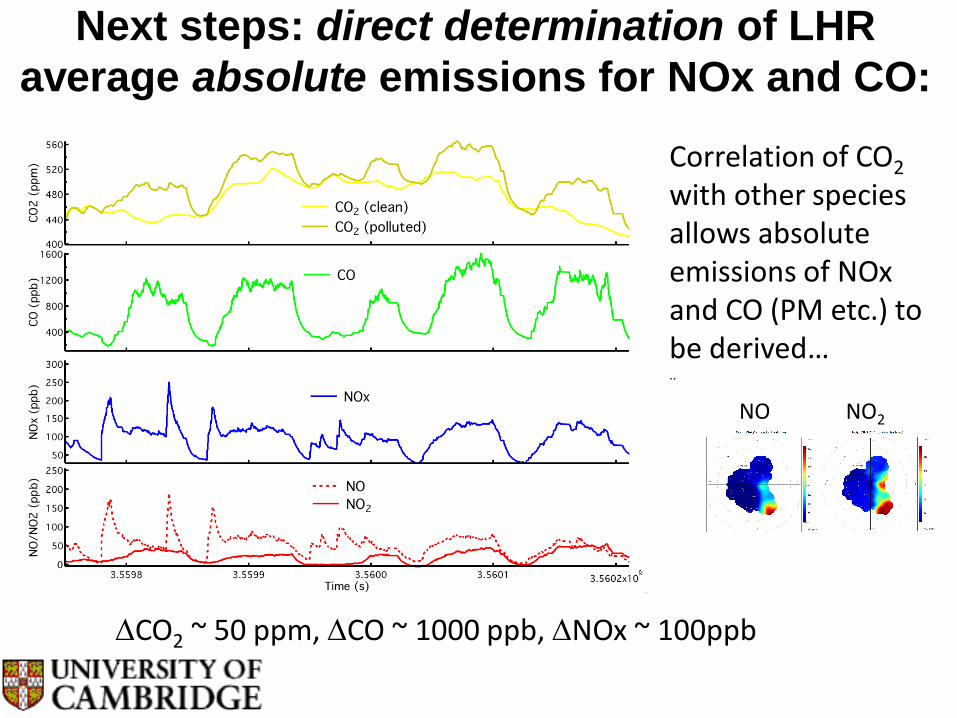
Next steps: direct determination of LHR
average absolute emissions for NOx and CO:
Correlation of CO2 with other species allows absolute emissions of NOx and CO (PM etc.) to be derived… ..
DCO2 ~ 50 ppm, DCO ~ 1000 ppb, DNOx ~ 100ppb
NO NO2

• The SNAQ project
• Network calibration
• Separation of emission scales
• Source attribution
• Absolute emission factors (from data)
• ADMS model/measurement comparison
• High-resolution activity and emissions estimates
• Low cost PM – validation and next steps
• Commercial links/collaborations
• Acknowledgements

Comparison of sensor data and ADMS-
Airport model predictions
• Hourly averages during focus period from November 2012
• Sites near runway
• Similar NOx concentration patterns for model predictions and SNAQ sensor time series
R = 0.82 SNAQ41
R = 0.85
SNAQ08
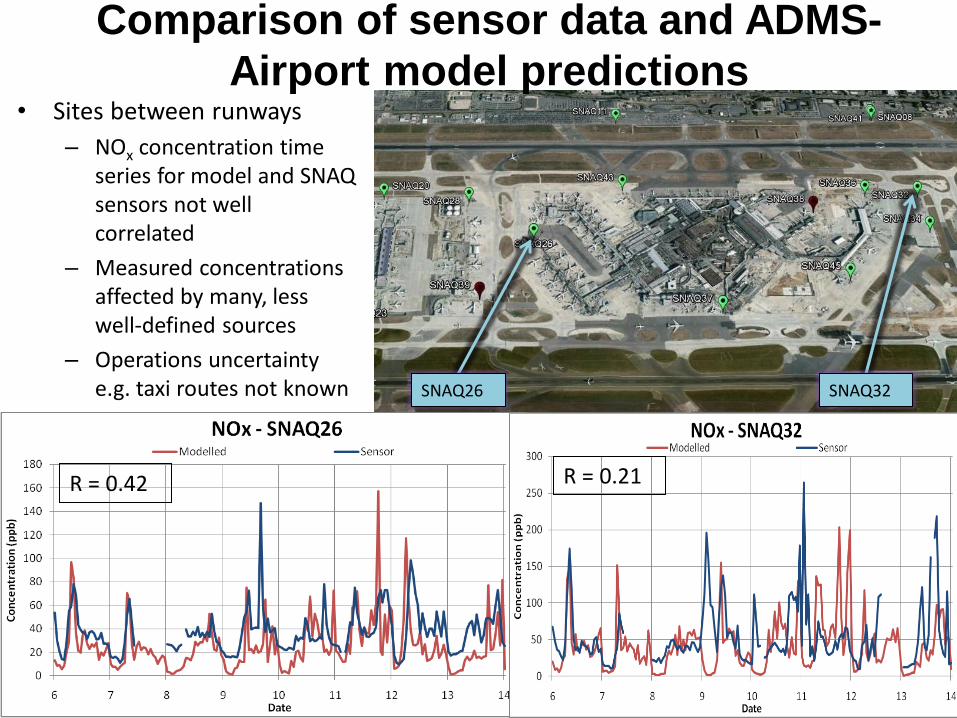
Comparison of sensor data and ADMS-
Airport model predictions • Sites between runways
– NOx concentration time series for model and SNAQ sensors not well correlated
– Measured concentrations affected by many, less well-defined sources
– Operations uncertainty e.g. taxi routes not known SNAQ32
R = 0.42 R = 0.21
SNAQ26

• The SNAQ project
• Network calibration
• Separation of emission scales
• Source attribution
• Absolute emission factors (from data)
• ADMS model/measurement comparison
• High-resolution activity and emissions estimates
• Low cost PM – validation and next steps
• Commercial links/collaborations
• Acknowledgements

High-resolution activity and emissions estimates
10,439 (52%) Summary data only;
limited trajectory, no fuel or thrust data
Airport activity database (BOSS) for 4th-18th November 2012 18,770 arrivals and departures at 1 min accuracy specifying runways, stands, aircraft type and engine
Developed to provide detail beyond the normal hourly resolution emissions inventory
~30 million source emission datapoints capturing aircraft activity at 1Hz Spatial, temporal and categorical queries used to examine behaviour
8,331 (48%) Flight Data Records;
1Hz 4D trajectory, fuel flow and thrust
Ricardo-AEA Emissions Estimator
BUCHAir A/C-Engine assignment
ICAO Emission
Factors DB SNAQ Emissions Proxiation Method
NERC showcase event 27th January 2014

NOx vs. Time for takeoff emissions and SNAQ air quality
• 1hr example; West-South-West prevailing wind, 27R takeoffs • Suggests correlation between increased modelled emissions
(g/s) and NOX concentrations (allowing for dispersion time) • Dispersion modelling and longer analysis periods required
27R Takeoff roll Emissions Source
Average wind
direction
SNAQ 08 SNAQ 41
SNAQ 41
SNAQ 08
27R Takeoffs

• The SNAQ project
• Network calibration
• Separation of emission scales
• Source attribution
• Absolute emission factors (from data)
• ADMS model/measurement comparison
• High-resolution activity and emissions estimates
• Low cost PM – validation and next steps
• Commercial links/collaborations
• Acknowledgements

Validation of low cost OPC

SNAQ OPC - mini commercial variant
- fog variant

• The SNAQ project
• Network calibration
• Separation of emission scales
• Source attribution
• Absolute emission factors (from data)
• ADMS model/measurement comparison
• High-resolution activity and emissions estimates
• Low cost PM – validation and next steps
• Commercial links/collaborations
• Acknowledgements

Commercial/technical links/partnerships
Geotech Ltd. Alphasense Ltd. (Instrument developer/manufacturer) (Sensor developer/manufacturer)

• The SNAQ project
• Network calibration
• Separation of emission scales
• Source attribution
• Absolute emission factors (from data)
• ADMS model/measurement comparison
• High-resolution activity and emissions estimates
• Low cost PM – validation and next steps
• Commercial links/collaborations
• Acknowledgements

Acknowledgements Rod Jones, Iq Mead
Lekan Popoola, Shaun Hurst, Gregor Stewart, Ines Heimann,
Greg Walters, (All UCAM)
John Saffell (Alphasense)
…..
Spencer Thomas, David Vowles (HAL/BAA, BA)
Jo Dicks, Anita Harris (Cambridge City Council)
Mark Hayes, Mark Calleja
Robin North/George Koudis et al.
Jeremy Cohen
Paul Kaye, Edwin Hirst, Warren Stanley
Alastair Forbes, Paul Quincey (NPL)
Paul Williams (UMAN)
David Carruthers, Chetan Lad…. (CERC)
…..
Funding Agencies: NERC, EPSRC

SNAQ project achievements (to date)
• Network calibration
• Separation of emission scales
• Source attribution
• Absolute emission factors (from data)
• ADMS model/measurement comparison
• High-resolution activity and emissions estimates
• Low cost PM – validation and next steps
• Commercial links/collaborations
Other applications: e.g. GHG networks, upper air,
medical/personal exposure…