
SCHOOL SAFETYSCHOOL SAFETY SCORE CONSIDERATIONS:
CONSTRUCTION, QUALITY, UTILITY
David Osher, Ph.D.American Institutes for Research
Fred Springer, Ph.D.EMT Associates
OSDFS School Climate Technical Assistance SymposiumNew Orleans, LA March 9‐11, 2011

Acknowledgements
Thanks to California Safe and Supportive SchoolsThanks to California Safe and Supportive Schools Project for use of Safety Score development informationTom Herman, Hilva ChanCA S3 Project DirectorsCA S3 Project Directors
Greg Austin, Tom HansonWestEdWestEd
Mark DuerrDuerr EvaluationDuerr Evaluation

Presentation Overview
Purpose of school safety scoresPurpose of school safety scores
Importance and implications of policy and data context for score developmentcontext for score developmentDetermining score content; domains and items
D t lit d f lData quality and score formula
Score presentationDiscussion

Why a Score? The Challenge
Information overloadInformation overloadDrowning in dataIndicators that may not matter muchIndicators that may not matter muchLack of Alignment Between and Among Levels of PerformancePerformanceCompeting, Unaligned, or Under‐aligned IndicatorsComplex/ inconclusive comparisons

Why a Score? The Benefits
A ScoreA ScoreFocuses information Facilitates comparisonFacilitates comparisonOrganizes information (components) logically and quantitativelyquantitativelyForces explicit operational definitionsCreates a conceptual framework for asking andCreates a conceptual framework for asking and answering additional questions

Importance of Context
No “Model” School Safety Scoreo ode Sc oo Sa ety Sco eDepends on:Specific purposesp p pIntended audiencesPolicy constraints and requirements (e.g., definition of conditions for learning)Data content and qualityFeasibility Stage of development

School Safety Score Purposes
Focused performance indicator for schoolsComparable metrics across schools and timeActionable
Communication to PublicRequires communication of content as well as scoreRequires clear and understandable presentation
Decision Tool for SEAs LEAs and SchoolsDecision Tool for SEAs, LEAs, and SchoolsUse/ value at each level varies with exact construction and presentationCan be used for planning (need) monitoring (surveillance) andCan be used for planning (need), monitoring (surveillance), and evaluation Policy decisionsAdministrative decisionsAdministrative decisions

Audiences
PublicPublicParents
Policy Makers/ AdministratorsPolicy Makers/ AdministratorsFederal, state, district, school
S h l C itSchool CommunityStudentsT hTeachersSchool teams

School Level Report: A Chicago Example
d l h lSent directly to schools
Guide school action


S3 Requirements
Safety Score must:yApply to individual schools Include Student survey dataSchool safety data at minimum
li bl d lidReliable and validIncident data
Be based on formula to produce single scoreBe based on formula to produce single scoreBe repeatedBe published for publicBe published for public

S3 Options
Safety Score may:Include multiple school climate domains in addition to safety
Engagement and support Environment
Include definitions / measures / data to fit contextExpanded surveys (e.g., staff)
e.g., West VirginiaIncident data other than disciplineStudent perceptions
E.g., Alaska, Chicago, Cleveland, New York City, California
B l l t d i iBe calculated in various waysWeightingCut points
Be presented to the public in various waysBe presented to the public in various ways

Perceptions of safety
Perceptions are different from incident dataPerceptions are different from incident data
People act on perceptionsPerceptual data can be measured accuratelyPerceptual data can be measured accurately
Perceptual data can be as accurate as incident d tdata
The logic of triangulation

Defining the Safety Score
Define indicators of safety at schoolySurvey‐based Incident based
Determine whether additional domains of school climate will be measuredE tEngagementEnvironmentSupportSupport
What are your program objectives?What can you measure adequately?What can you measure adequately?
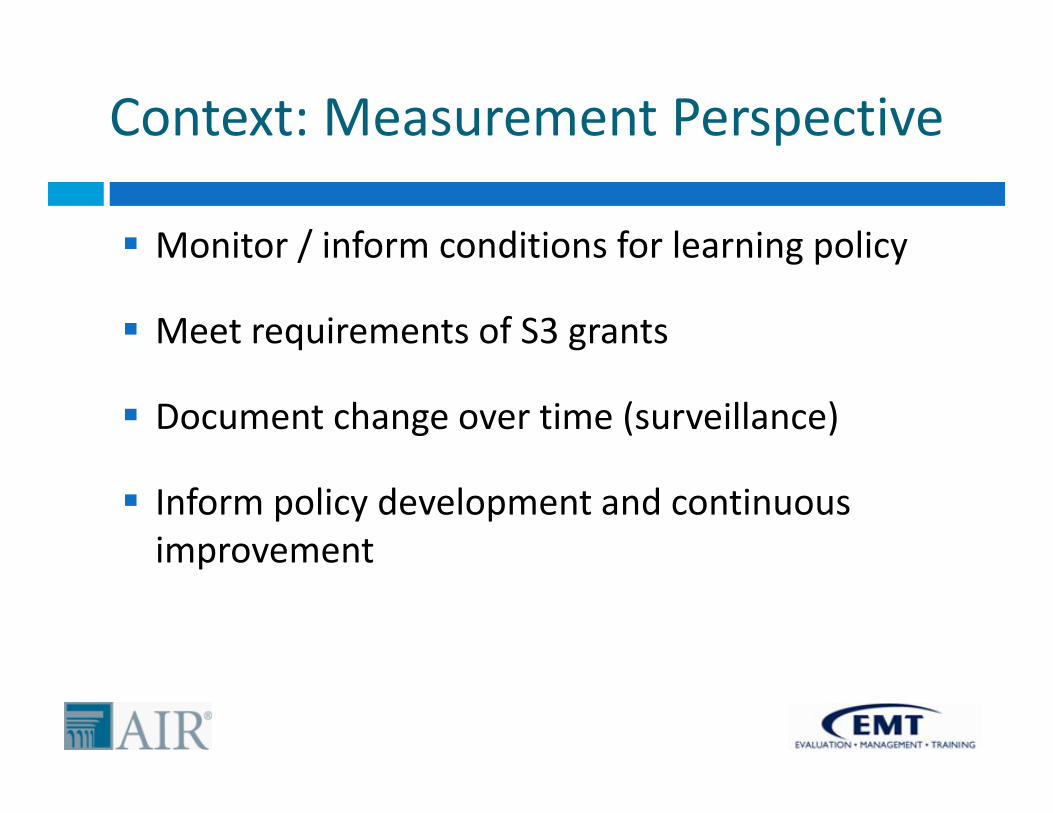
Context: Measurement Perspective
Monitor / inform conditions for learning policyMonitor / inform conditions for learning policy
Meet requirements of S3 grants
Document change over time (surveillance)
Inform policy development and continuous improvementimprovement

Balancing Measures and Program
Measures youMeasures you have?
What program elements haveelements have been / can be measured?
School Safety
What measures should be found /
Score
Measures you need?
developed?
need?

Broad Scope of School Climate
School Safety Relationships Engagement Physical Environment
• Emotional safety
• Quality of Relationships
• School connectedness
• Class disruption
Ph i l l t• Physical
safety• Respect for
diversity• School Avoidance
Behaviors
• Physical plant
• Access to necessary
• Uncivilbehavior
• Crime
• Teacher / adult support
• Peer support
• School Participation
• Family / parent
materials
• Physical activity• Crime
• Violence
• Peer support
• Performance expectations
• Family / parent involvement • Nutrition
• Fair / equitable • Weapons
• Substance abuse
disciplinary environment

The Data Context of Score Construction: Raw MaterialRaw Material
Student SurveyyExisting climate surveyFit with intended programDoes it measure what you need to know to improveDoes it measure what you need to know to improve
Social and emotional safetyConditions for learningHealthy developmentHealthy development
New surveySelecting whole surveysS l i f (d i )Selecting components of surveys (domains)Selecting scales from surveysSelecting items from scales

The Data Context of Score Construction: Raw MaterialRaw Material
Incident DataIncident DataDisciplinary (e.g., suspensions and expulsions)Attendance and truancytte da ce a d t ua cyGraduation rateOther
Existing indicators or raw dataOpportunity for constructed measurespp y

California: A Data‐based Strategy
Used California Healthy Kids Survey (CHKS) 2007‐Used California Healthy Kids Survey (CHKS) 200708, 2008‐09 data (school climate items)
Exploratory/ confirmatory statistical analysis toExploratory/ confirmatory statistical analysis to identify items that cluster in ways that are interpretable with reference to the S3 climateinterpretable with reference to the S3 climate modelTested reliability / stability of identified measuresTested reliability / stability of identified measures
Validation by examining schools differentiated by indexindex
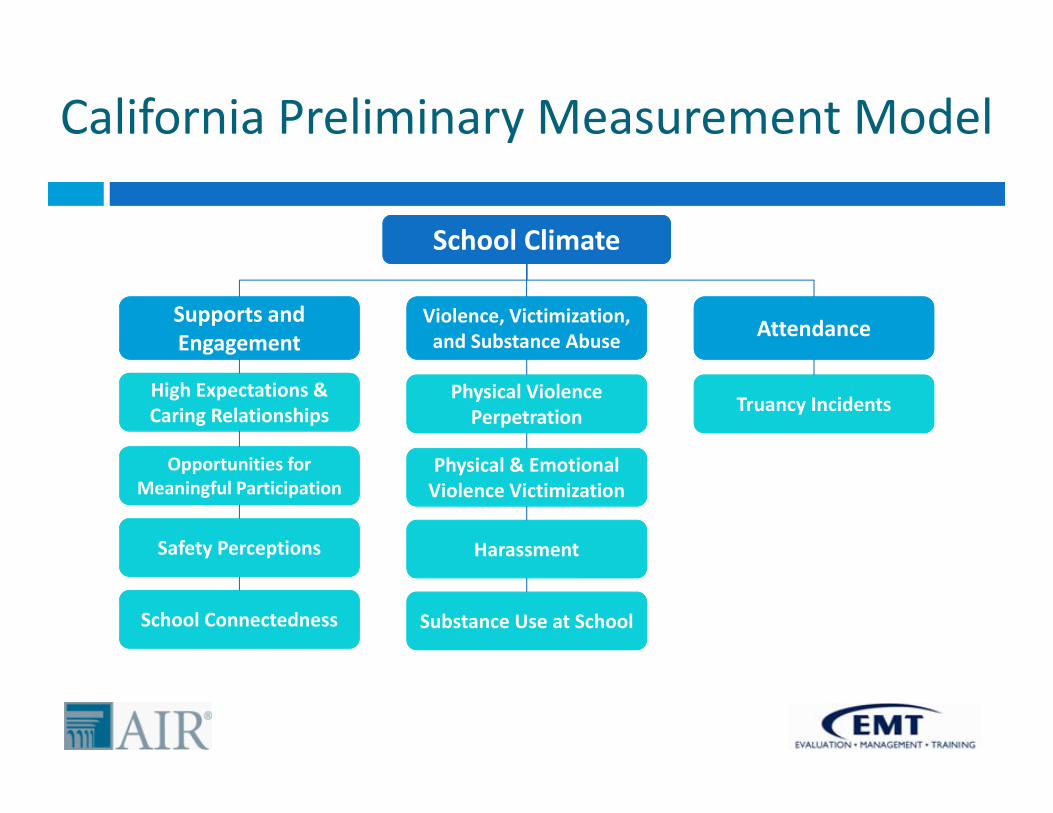
California Preliminary Measurement Model
School Climate
Supports and Engagement
Violence, Victimization, and Substance Abuse Attendance
High Expectations & Caring Relationships
O i i f
Physical Violence Perpetration
h i l & i l
Truancy Incidents
Opportunities for Meaningful Participation
Safety Perceptions
Physical & Emotional Violence Victimization
Harassment
School Connectedness Substance Use at School

Criteria for Measurement Quality
Crucial to Support Safety ScoreC uc a to Suppo t Sa ety Sco eReliability
Are measures stable and consistent? Validity
Do measures move with real world change?gAdequate variance profile
Do measures detect sufficient and adequately q ydistributed differences between schools? –between students in the same school?

Reliability
Many climate measures are perception or attitude y p pscalesInter‐item consistency is common reliability measureCareful that assumptions are appropriateIs inter‐item consistency appropriate?Alpha magnitude?Alpha magnitude?Need multiple items?Cognitive labs?
Cross‐group and cross‐time stability is important Cultural and linguistic competency

Reliability and Stability of School Climate Domains: California Example
24
Domains: California Example
Reliability Reliability of
Stability- 2 years
(student-)
School (correlation)level α) Mean
School Climate Domains
Supports and Engagement (15 item) 0.88 0.97 0.78
Violence, Victimization & Substance Use (21 items)
0.87 0.91 0.72
Truancy Rate ---- ---- 0.78
Academic Performance Index ---- ? 0.90

2007 Results: Inter‐Scale Correlations (Chicago)
Middle level 1 2 3 4
1 School Safety 1
2 Academic Rigor 0.17 1g
3 Student Support 0.25 0.62 1
4 Social & Emotional Skills 0.48 0.20 0.34 1
Note: All the correlations are statistically significant.
High school level 1 2 3 4
1 School Safety 11 School Safety 1
2 Academic Rigor 0.25 1
3 Student Support 0.26 0.65 1
4 Social & Emotional Skills 0.52 0.25 0.32 1
Note: All the correlations are statistically significant.

Validity
What are the proper criterion measures forWhat are the proper criterion measures for assessing validity?
Must valid components of the safety score correlate?correlate?
How do we know if the score discriminates?How do we know if the score discriminates?

Criteria for Validity
Does the survey measure what it is supposed toDoes the survey measure what it is supposed to measureConceptually (what do you mean by safety?)Conceptually (what do you mean by safety?)TechnicallyPsychometricsPsychometricsSelection bias (response rates)
Socially Socially

Q3: Scale Validity (Chicago example)
Safety with suspensionsSafety with suspensions
Middle Level 1 2 3
1 Sch Safety 1
2 ln school suspensions -0.43 1
3 ln N suspended students 0 43 0 99 13 ln N suspended students -0.43 0.99 1Note: All correlations are statistically significant.
High School 1 2 3
1 Sch Safety 1
2 ln school suspensions -0.65 1
3 ln N suspended students -0.62 0.99 1Note: All correlations are statistically significant.

Characteristics of schools with low, medium, and high SCI scores: California
29
and high SCI scores: California
School Climate
Low Medium High
High caring adults in school 29.6% 33.6% 38.9%30-day alcohol use at school 11.5% 7.9% 4.7%Physical fight at school 23.2% 19.3% 14.8%Weapon at school 16.9% 13.1% 9.0%Does not feel safe at school 55.6% 42.9% 26.7%Skipped school 49.8% 43.3% 33.8%Grades of A’s/B’s or higher 42.0% 47.7% 60.5%
API 655.9 726.0 815.7Free/reduced-price meals 55.3 40.1 20.8
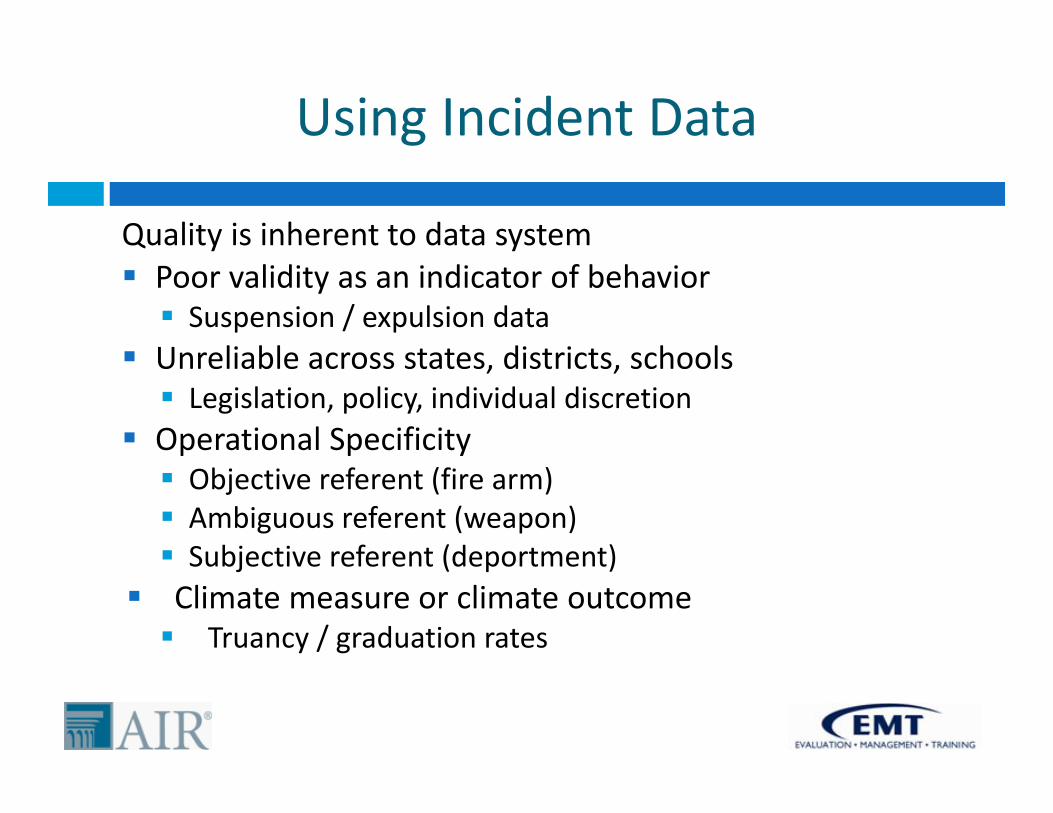
Using Incident Data
Quality is inherent to data systemPoor validity as an indicator of behavior
Suspension / expulsion dataUnreliable across states districts schoolsUnreliable across states, districts, schools
Legislation, policy, individual discretionOperational Specificity
Objective referent (fire arm)Ambiguous referent (weapon)Subjective referent (deportment)Subjective referent (deportment)Climate measure or climate outcome
Truancy / graduation rates

Using Incident Data: Possible Solutions
Not found in existing climate measures because ofNot found in existing climate measures because of quality and interpretation challenges, however
Relational measures may present opportunitiesRelational measures may present opportunities where data systems support them (e.g., Arizona)Variance in disciplinary referrals acrossVariance in disciplinary referrals across classrooms, referrals as referent not behavior
Graduation ratesGraduation rates
Attendance

Building the Score: Weighting
Should components contribute differentially toShould components contribute differentially to the total Safety Score? Potential criteriaPotential criteriaCorrelationContribution to outcomesPolicy emphasisSupport for triangulation, actionability

Communicating School Climate Scores
Score is a summaryScore is a summaryNeeds additional reporting to:Communicate meaningful information to public;Communicate meaningful information to public;Achieve credibility as an accountability measure;Provide “actionable” information for quality q yimprovement.
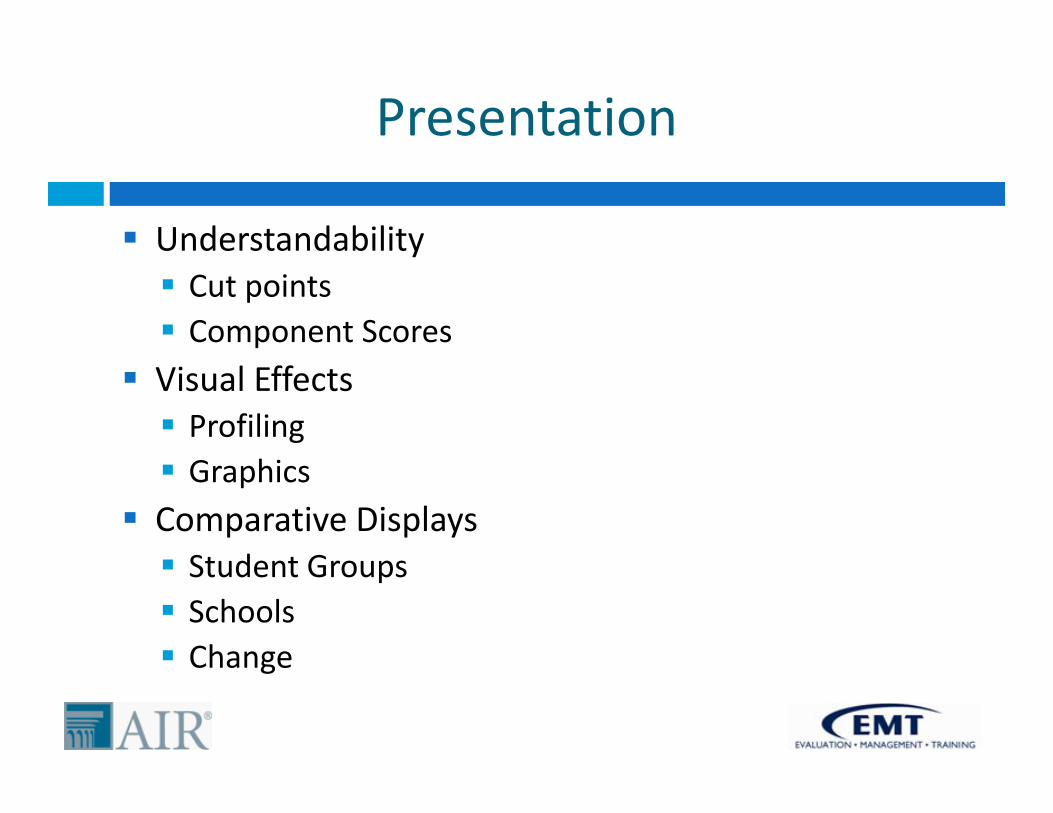
Presentation
UnderstandabilityyCut pointsComponent Scores
Visual EffectsProfilingGraphics
Comparative DisplaysSt d t GStudent GroupsSchoolsChangeChange


Comparative Displays
Enhancements to comparisonpCut PointsLabels and cut points must have explicit criteriaEmpirical or logical
Bases for comparisonSchool to norm (e g LEA state)School to norm (e.g., LEA, state)School to schoolSchool levelSchool levelStudent groupsScore components

Example of Setting A Cut Pointp g

Displaying School‐level SCI Results (California)38
20SCHOOL CLIMATE
School Climate Characteristics - School ABC
36
27
20
High expectations and caring relationships
SUPPORTS AND ENGAGEMENT
SCHOOL CLIMATE
24
35
32
School Connectedness
Safety perceptions
Opportunities for meaningful participation
27
20
17
Physical and emotional violence victimization
Physical and emotional violence perpetration
VIOLENCE, VICTIMIZATION, & SUBSTANCE USE
16
14
11
TRUANCY INCIDENTS
Substance use at school
Harassment
0 10 20 30 40 50 60 70 80 90 100
State Percentile


How Do Students Experience the Environment: Example from the Global Evaluation of UNICEF’s Child Family Schoolsthe Global Evaluation of UNICEF s Child Family Schools
In five of the six countries the majority of students felt physically and
i ll f i h lemotionally safe in school and perceive the school as inclusive
But 19‐56% provided responses that resulted inresponses that resulted in a rating of needs improvement.

QUESTIONS / CONTRIBUTIONS
???


