
Making the Switch: Unlocking the Mystery of the WISC-IV
Shelley C. Heaton, Ph.D.
Dept of Clinical & Health Psychology
Case Conference
July 24, 2004

Why another revision?
A) Keep us on our toes
B) Revisions to theoretical foundations
C) Make more money
D) The old pictures were ugly
E) Improve psychometric properties
F) B & E

It’s been longer than we think…
1949: The Beginning of time (WISC) 1974: WISC-R 1991: WISC-III “12 AW”: WISC-IV (2003)

Wechsler (1958)
“[The grouping of subtests into Verbal and Performance areas]…does not imply that these are the only abilities involved in the tests…The subtests are different measures of intelligence, not measures of different kinds of intelligence, and the dichotomy of Verbal and Performance areas is only one of several ways in which the tests could be grouped.”
In: The measurement and appraisal of adult intelligence. (pg 64)

What’s happened since then? Changes in Intelligence Theory
– Greater emphasis on multiple factors – Greater emphasis on fluid reasoning
(e.g., manipulating abstractions, rules, generalizations, and logical relationships)
– Importance of working memory in learning
– Importance of processing speed as ‘mediator’
– Process approach to evaluating performance
(how they did it is as important as whether it’s right/wrong)
…evident in structural changes to revision
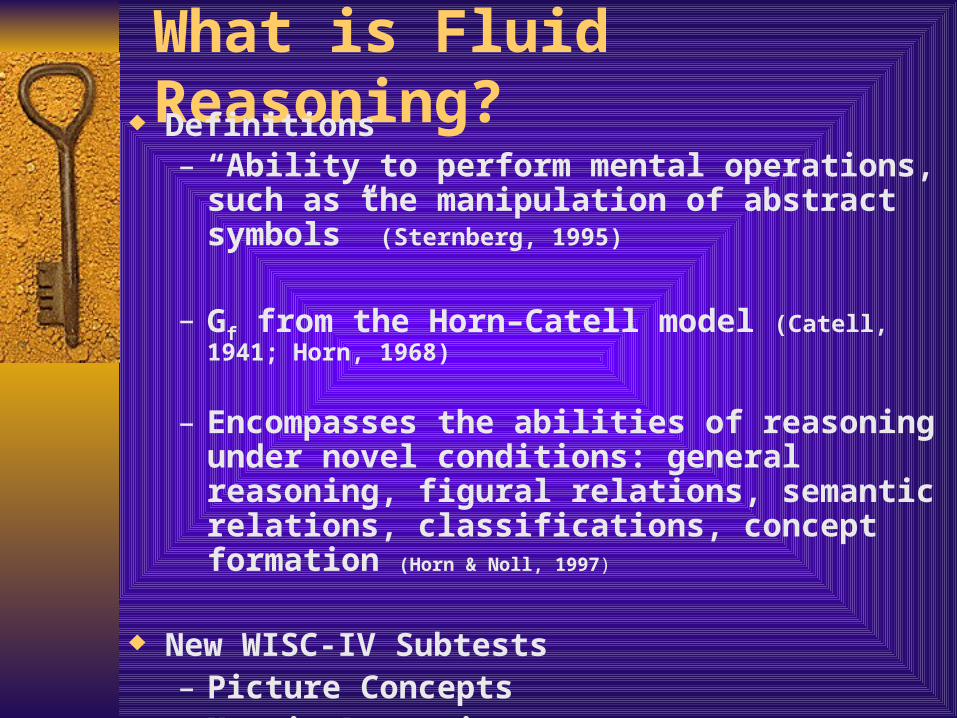
What is Fluid Reasoning? Definitions
– “Ability to perform mental operations, such as the manipulation of abstract symbols” (Sternberg, 1995)
– Gf from the Horn–Catell model (Catell, 1941; Horn, 1968)
– Encompasses the abilities of reasoning under novel conditions: general reasoning, figural relations, semantic relations, classifications, concept formation (Horn & Noll, 1997)
New WISC-IV Subtests– Picture Concepts– Matrix Reasoning– Word Reasoning

What is the Process Approach? How a child performs tasks is as important,
and often even more important, than the score obtained.
Understanding performance on individual items, including the kinds of errors a child makes, can provide rich clinical information.
Describing the strategies a child employs when performing tasks provides a basis of interpretation that resonates deeply with parents, teachers, and even with the child.

– Flynn Effect• We’re getting smarter…or at least the young one’s are
– Demographic Shifts• Ethnic growth (Hispanic 11% 15%)
• Regional growth (more in W & S than NE)
– Clinical Utility• Extending floors & ceilings• Increase linkage with other tests (WIAT-II, CMS)
• Improved Reliability/Validity evidence (Clinical Samples)
Psychometric & Normative Improvements

The Old Structure: WISC-III
(10 core subtests)
FSIQ = Verbal IQ (5) + Performance IQ (5) Index Scores
– Verbal Comprehension (VCI)– Perceptual Organization (POI)– Freedom from Distractibility (FDI)– Processing Speed (PSI)
3 optional subtests (1 useless) But…to get FDI & PSI, must add 2 subtests

The New Structure: WISC-IV (10 core subtests)
FSIQ = Sum of 4 Index Scores– Verbal Comprehension (3)– Perceptual Reasoning (3)– Working Memory (2)– Processing Speed (2)
4 optional subtests (for substitutions)
Same # of subtests, but now you get all index scores without having to add subtests (4 Indexes for the price of 10, instead of 12)

SimilaritiesVocabulary
Comprehension(Information)
** (Word Reasoning)
Block Design** Picture Concepts** Matrix Reasoning** (Picture Completion)
Digit Span** Letter-Number Sequencing
(Arithmetic)
CodingSymbol Search** (Cancellation)
VIQ
PIQ
Renamed FDI
The New Structure…FSIQ =Verbal Comprehension Index
Perceptual Reasoning Index
Working Memory Index
Processing Speed Index

What was removed (from WISC-III):Verbal Comprehension Index
Perceptual Reasoning Index
Working Memory Index
Processing Speed Index
Object AssemblyPicture Arrangement
(Mazes)

The New Subtests – 5 in all
(Word Reasoning)
Picture ConceptsMatrix Reasoning
Letter-Number Sequencing
(Cancellation)
Verbal Comprehension Index
Perceptual Reasoning Index
Working Memory Index
Processing Speed Index
(Word Reasoning)
Picture Concepts(Cancellation)

The Brand New Tests….(3)

Picture Concepts (core)Perceptual Reasoning Index
“Pick one here..
“that goes with one here..”
Sample items only: “Why do they go together?”
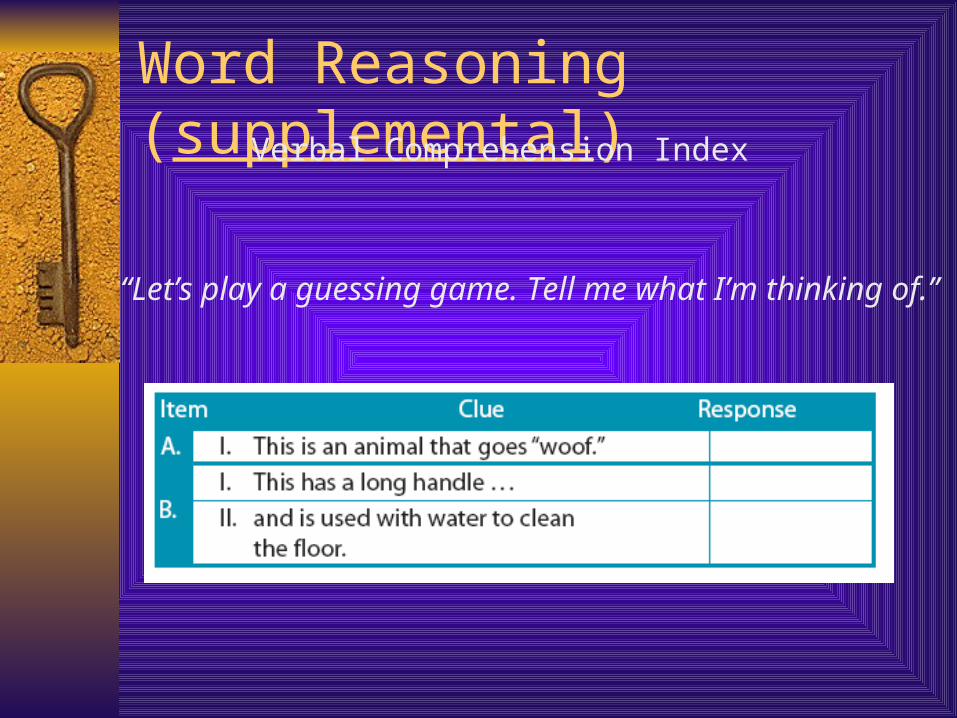
Word Reasoning (supplemental)Verbal Comprehension Index
“Let’s play a guessing game. Tell me what I’m thinking of.”

Let’s test the ceiling item…
This has never been seen or done before…
and it can make our lives better and easier…
and it is a product of the mind.
1 point: discovery, invention, innovation, technology, imagination,
creativity, dream

Cancellation (supplemental)Processing Speed Index
Random vs Structured
“When I say go, draw a line through each animal. Work as quickly as you can w/out making any mistakes. Tell me when you are finished.”
The “Borrowed” New Subtests…(2)
(new to the kiddie tests, but not new to us)

Matrix Reasoning

Letter-Number Sequencing“Tell me the numbers first, in order, starting with the lowest number. Then tell me the letters in alphabetical order.”
Credit is given if produced “in order” (i.e., correct sequence), even if letters are listed first.

Other Perks in the Revision:
Decreased testing time (arguable) Simplified administration & scoring 1 supplemental subtest for each index Dividing & Reorganizing the Manual Prettier pictures and new items Process Scores!!!
– Block Design: non bonus time items (can do comparison too)
– Digit Span: Forward vs Backward (& max digits scoring)
– Cancellation: Random vs Structured

Expanded/Improved Clinical Utility and Validity
Norms: 2,200 children (11 age groups) 16 special group studies Linking Studies
– WIAT-II (N=550)
– CMS, 110 cases, (in progress)
– Adaptive Behav. Assess. System-II (N=200)
– Bar-ON EQ (N=200)
– Gifted Rating Scale (N=240)

Administration Guidelines

Familiarize yourself
New subtests New items New scoring (even for old tests – BD)

Supplemental Subtests
Extra = don’t add into the Index scores
Substitute = add it into Index scores
– 1/Index: Only 1 substitution allowed when deriving any Index Score
– 2/FSIQ: Only 2 total substitutions allowed when deriving FSIQ

Prorating – don’t do it
Avoid prorating if at all possible VCI & PRI can be prorated if 2/3
contributing subtest scaled scores are valid WMI & PSI cannot be prorated unless
supplemental subtests were administered (but Full Scale IQ cannot be derived if you do this)

Interpretation of the WISC-IV Profile

Scores are the same:
Subtest Scaled Scores:Mean = 10, SD = 3
IQ and Index Scores:Mean = 100, SD = 15
Individual’s Rank Compared to Normative Group
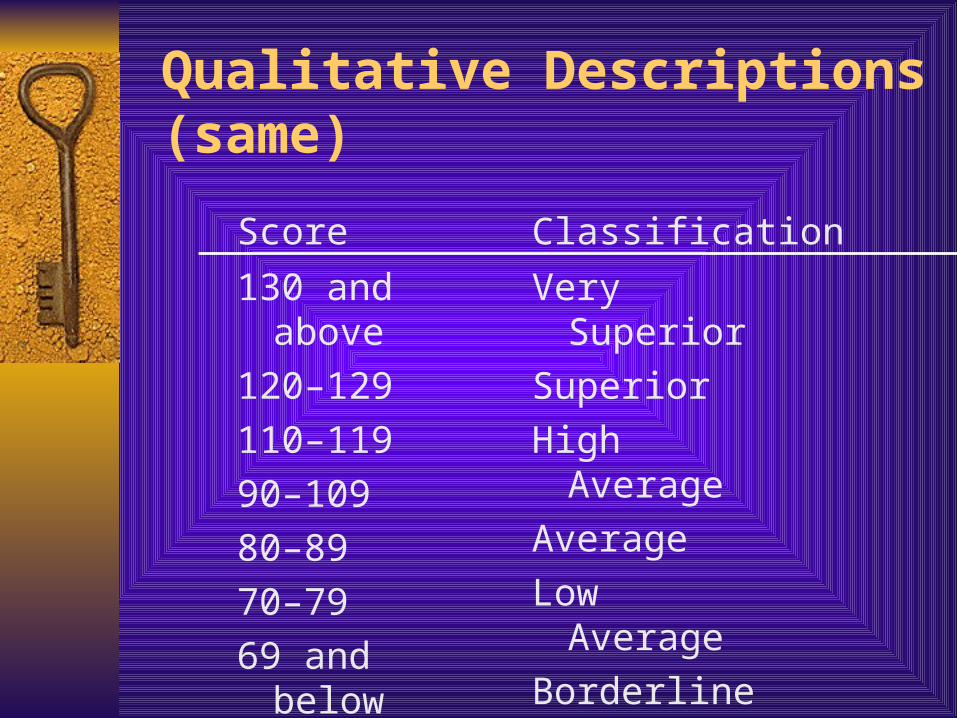
Qualitative Descriptions (same)
Score Classification
130 and above
120–129
110–119
90–109
80–89
70–79
69 and below
Very Superior
Superior
High Average
Average
Low Average
Borderline
Extremely Low

When interpreting…consider 3 things:

1. Score Differences A statistically significant difference between
scores refers to the likelihood that obtaining such a difference by chance is very low if the true difference between the scores is 0. The level of significance reflects the level of confidence you can have that the difference is a true difference ( 0.15 or 0.05).
The use of the 0.05 level of significance has been suggested for most testing purposes (Kaufman and Lichtenberger, 1999)
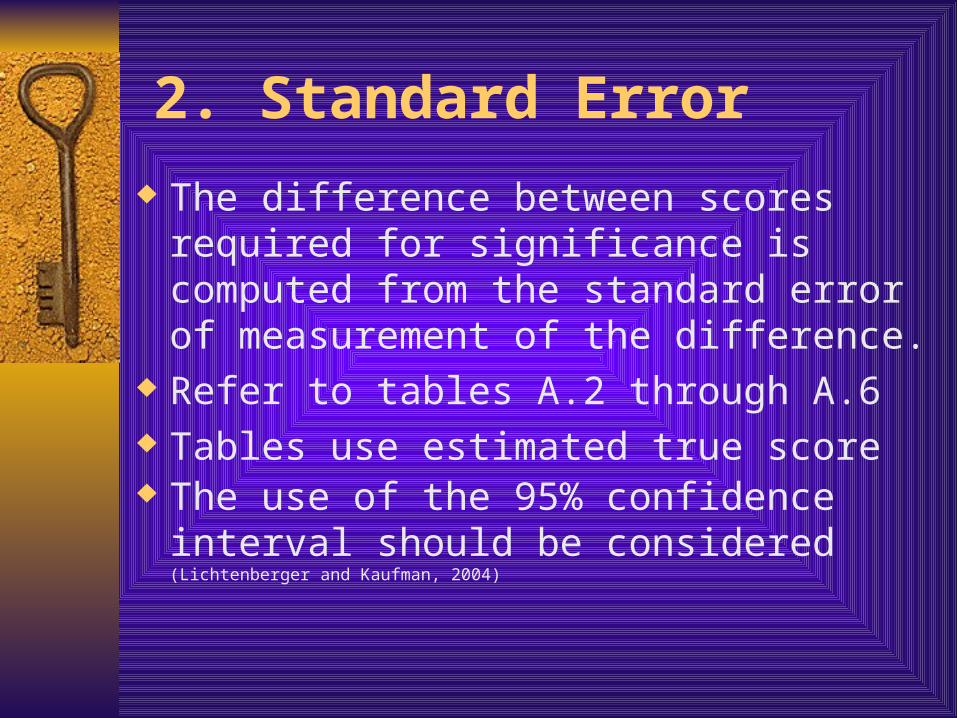
2. Standard Error
The difference between scores required for significance is computed from the standard error of measurement of the difference.
Refer to tables A.2 through A.6 Tables use estimated true score The use of the 95% confidence interval
should be considered (Lichtenberger and Kaufman, 2004)

3. Base Rates Cumulative Frequency tables or base rates
indicate how frequently a discrepancy of a specific size occurred in the standardization sample.
Index score base rates are also available by ability level. The B.2 Tables include FSIQ ≤ 79 80 ≤ FSIQ ≤ 89 90 ≤ FSIQ ≤ 109 110 ≤ FSIQ ≤ 119 FSIQ ≤ 120

GeneralInterpretation Recommendations
Give more weight to composite score differences that are infrequent than to those that are merely statistically significant
Interpret scatter among subtests carefully (more on this later)
Include relevant process information

Reporting Full Scale IQ
Most reliable score Report standard score, confidence
intervals & percentile rank Include descriptive category

Interpreting the Full Scale Score…Where Scatter Comes in
Does the full scale IQ represent a unitary construct?– Examine Index discrepancies using statistical
significance and base rate comparisons– Examine Subtest scatter (Table B.6)
Variability among subtest scores is common– Does not necessarily indicate cognitive problem
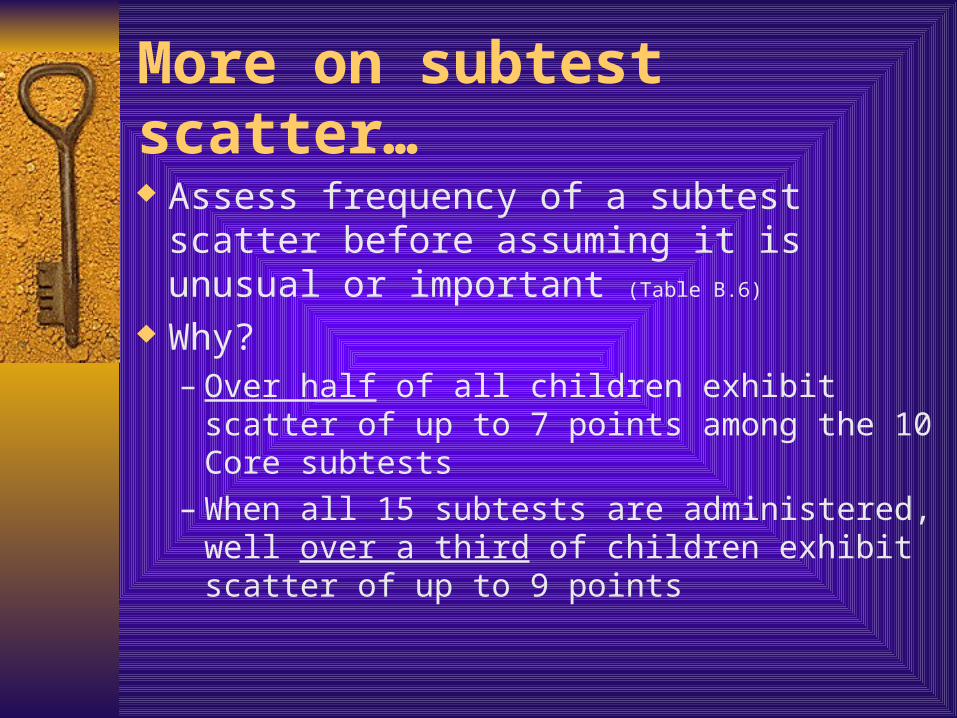
More on subtest scatter…
Assess frequency of a subtest scatter before assuming it is unusual or important (Table B.6)
Why?– Over half of all children exhibit scatter of up to
7 points among the 10 Core subtests– When all 15 subtests are administered, well
over a third of children exhibit scatter of up to 9 points

Interpreting the Full Scale Score
Interpret the Full Scale IQ if it represents a unitary construct of cognitive abilities
If the Full Scale IQ is not unitary then focus on subtests scores
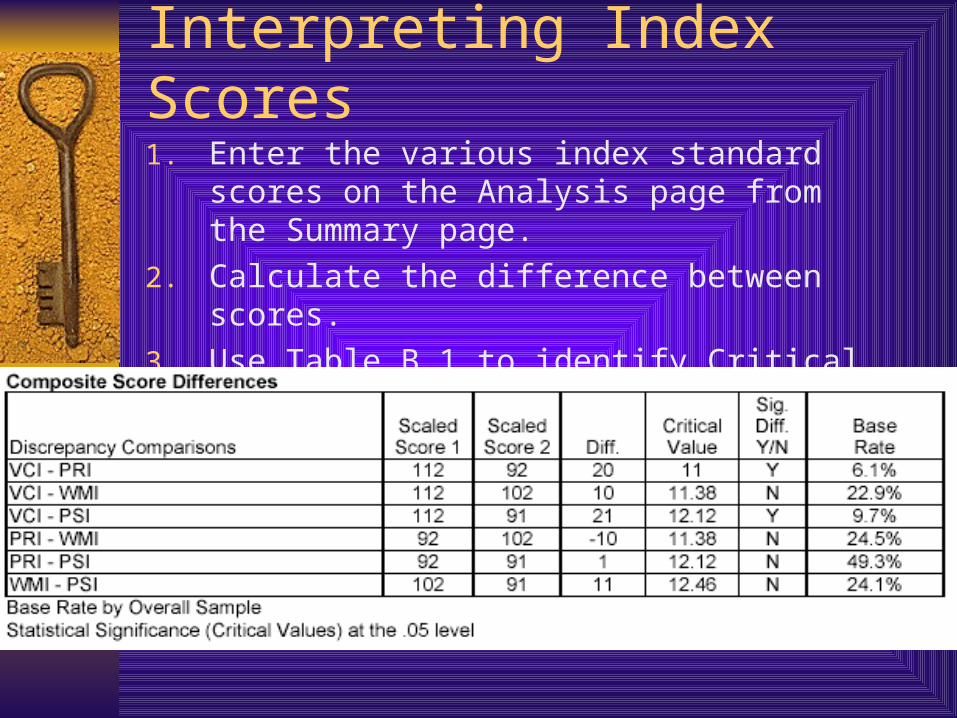
Interpreting Index Scores
1. Enter the various index standard scores on the Analysis page from the Summary page.
2. Calculate the difference between scores.
3. Use Table B.1 to identify Critical Value by age.
4. Use Table B.2 to identify the Base Rate.

Interpreting Index Scores
Are differences among index scores interpretable?– Statistical significance– Base Rates
If there is statistical significance and a low base rate then interpret differences among indexes

Interpreting Index Scores
Does index represent a unitary construct?– Evaluate scatter among subtests (Table B.6)
If the index is unitary, then interpret If index is not unitary, discuss scatter

Interpreting Subtest Scores
1. Complete subtest strengths & weaknesses section.2. Calculate the subtest mean (all subtests, VCI or PRI subtests)
3. Use Table B.5 to identify critical value.
4. Use Table B.6 for base rates.

Interpreting Process Scores
Complete the Process Analysis section
1. entering scaled scores
2. finding the difference
3. look up the critical values in Table B.9
4. Look up the base rates in Table B.10.

Supplemental Information…
Remaining slides were taken from other available presentations for your reference.

VCI Index Description
Verbal Comprehension Index (VCI)– Similarities, Comprehension, and Vocabulary subtests
– Requires verbal conceptualization, stored knowledge access and oral expression
– Child must answer orally presented questions that assess common-sense reasoning, reasoning out or retrieving word associations, and the ability to describe the nature or meaning of words.
– Verbal expression required (length of response varies)

PRI Index Description
Perceptual Reasoning Index– Matrix Reasoning, Picture Concepts, and Block Design
subtests
– Requires visual perception and organization and reasoning with visually presented, nonverbal material to solve the kinds of problems that are NOT school taught
– BD also requires visual-motor coordination and the ability to apply all skills in a quick, efficient manner. The highest scores reflect both accurate and very quick responses.

WMI Index Description
Working Memory Index– Composed of Letter-Number Sequencing and Digit
Span
– Requires working memory processes applied to the manipulation of orally presented verbal sequences
– Note that Digits Forward only requires initial encoding and a verbal response as do the initial items on LNS

PSI Index Description
Processing Speed Index– Coding and Symbol Search
– Requires visual perception and organization, visual scanning, and the efficient production of multiple motor responses
– These tasks require executive control of attention and sustained effort for a 2-minute period of time while working with visual material as quickly as possible
– Performance on Coding is also dependent on paired-associative learning


