
Market Trends and Opportunities for 2014 1:15-2:05 pm
Moderator: Gerard Sansosti, Executive Managing Director, HFF Panelists: Stacey Berger, Executive Vice President, PNC Real Estate/Midland Loan Services Keith Honig, Managing Director, AIG Investments Michael H. Lowe, Co-President and Chief Investment Officer, Lowe Enterprises Lisa Pendergast, Managing Director, Jefferies & Company LLC Mitchell Resnick, Vice President, Multifamily Loan Pricing & Securitization, Freddie Mac
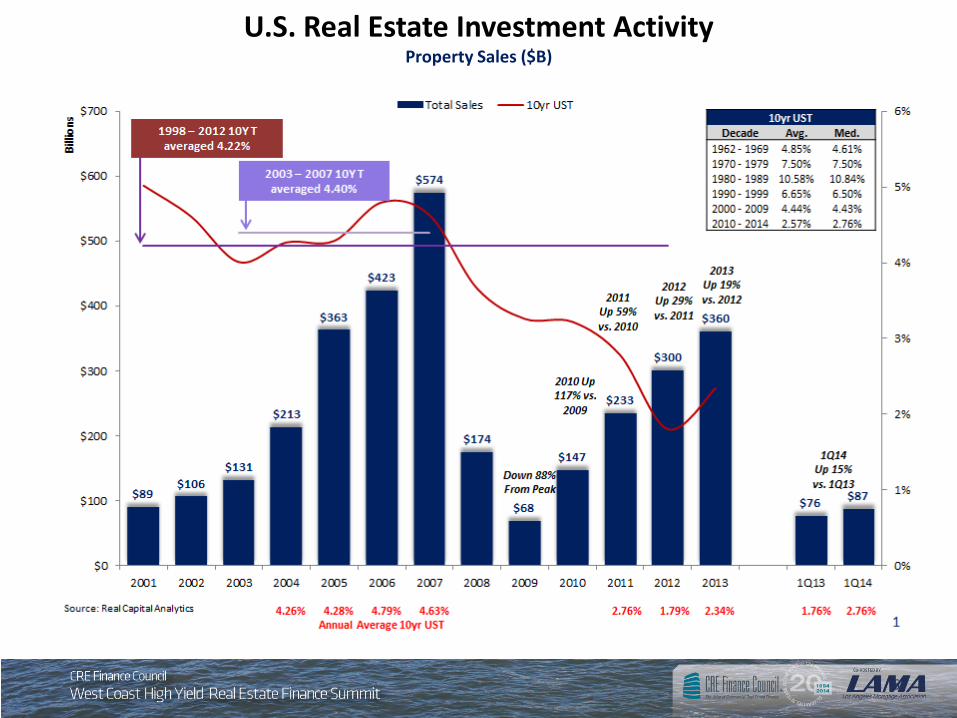
U.S. Real Estate Investment Activity Property Sales ($B)
6
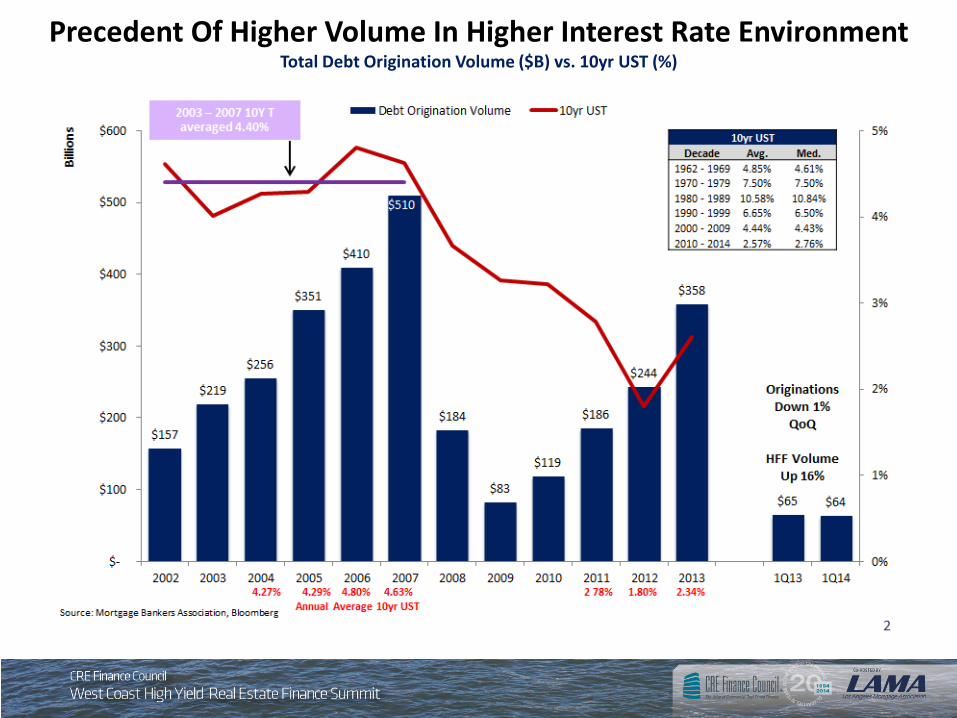
Precedent Of Higher Volume In Higher Interest Rate Environment Total Debt Origination Volume ($B) vs. 10yr UST (%)

Debt Originations Highly Correlated To Transaction Volumes Quarterly Volumes ($B)
8
Source: Mortgage Bankers Association, Real Capital Analytics

9
Debt Origination Volume 2013 Originations Exceed 2005
Source: MBA. Total Debt Origination Volume is for closed loans made by dedicated commercial real estate finance firms and does not double count loans; it can be used as a gauge of the overall volume of lending activity.
$20 $30 $46 $70 $86 $109 $64 $20 $20 $32 $57 $100 $73 $105
$112 $165
$186 $225
$7 $22 $37
$80 $26
$31 $38
$50
$54
$52
$31
$17 $31 $49
$50
$60
$16
$20 $20
$25
$26
$35
$40
$31 $31
$44
$58
$48
$168
$227
$263
$351
$410
$510
$184
$83
$119
$186
$244
$358
$-
$100
$200
$300
$400
$500
$600
2002 2003 2004 2005 2006 2007 2008 2009 2010 2011 2012 2013
Billi
ons
Commercial Banks Conduits Life InsuranceGSE's (Fannie + Freddie) REITs, Mtg REITs, Investment Funds FHACredit Other Pension Funds

10
Debt Origination Volume Commercial Banks & Conduits Increase Market Share In 2013
Source: MBA. Total Debt Origination Volume is for closed loans made by dedicated commercial real estate finance firms and does not double count loans; it can be used as a gauge of the overall volume of lending activity.
28%
23%
17%
17%
24%
35%
21%
21%
20%
18%
14%
12%
22%
15%
12%
6%
0%
2%
44%
45%
47%
44%
48%
46%
17%
21%
27%
26%
22%
18%
11%
14%
16%
17%
17%
18%
13%
24%
24%
26%
37%
22%
7%
6%
7%
8%
9%
10%
7%
2%
3%
2%
1%
5%
8%
7%
10%
7%
1%
0%
1%
1%
1%
2%
2%
1%
1%
7%
4%
3%
7%
7%
9%
14%
9%
13%
12%
9%
9%
12%
10%
11%
0% 10% 20% 30% 40% 50% 60% 70% 80% 90% 100%
2013
2012
2011
2010
2009
2008
2007
2006
2005
2004
2003
2002
Commercial Banks Conduits Life Insurance & Pension Funds
GSE's (Fannie + Freddie) REITs, Mtg REITs, Investment Funds FHA
Credit Other
2.72%
6.83%
5.59%
5.70%
0%
1%
2%
3%
4%
5%
6%
7%
8%
9%
10%
2001 2002 2003 2004 2005 2006 2007 2008 2009 2010 2011 2012 2013 2014
10yr UST RCA Cap NCREIF Cap Implied Cap
11
JPM Implied Cap Rate
RCA Cap Rate
NCREIF Cap Rate
10yr UST
(411 bps) (298 bps)
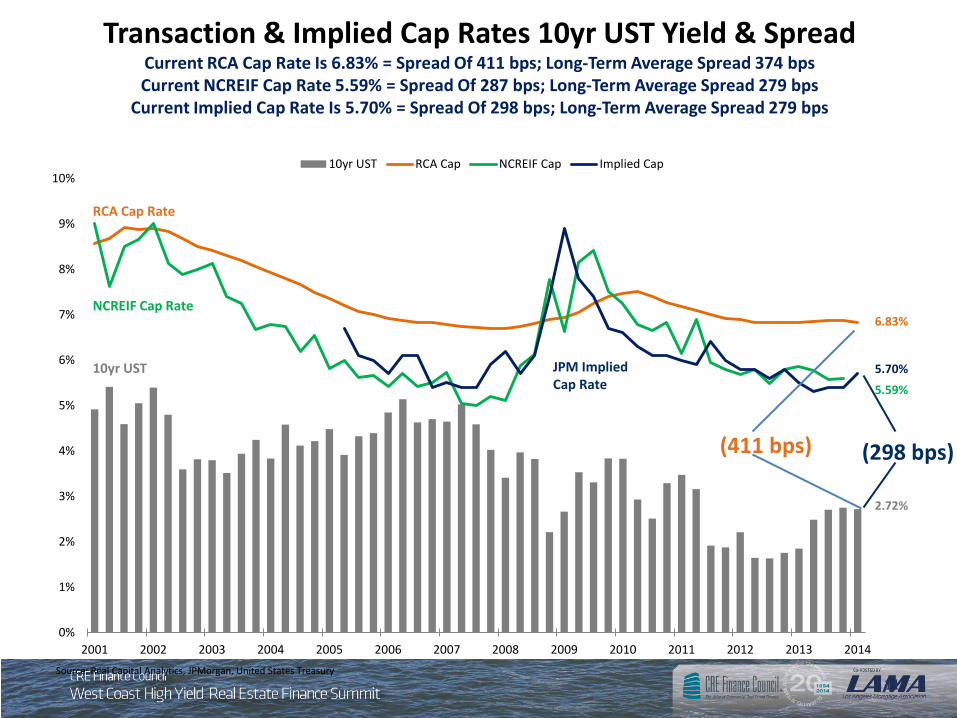
Transaction & Implied Cap Rates 10yr UST Yield & Spread Current RCA Cap Rate Is 6.83% = Spread Of 411 bps; Long-Term Average Spread 374 bps Current NCREIF Cap Rate 5.59% = Spread Of 287 bps; Long-Term Average Spread 279 bps
Current Implied Cap Rate Is 5.70% = Spread Of 298 bps; Long-Term Average Spread 279 bps
Source: Real Capital Analytics, JPMorgan, United States Treasury
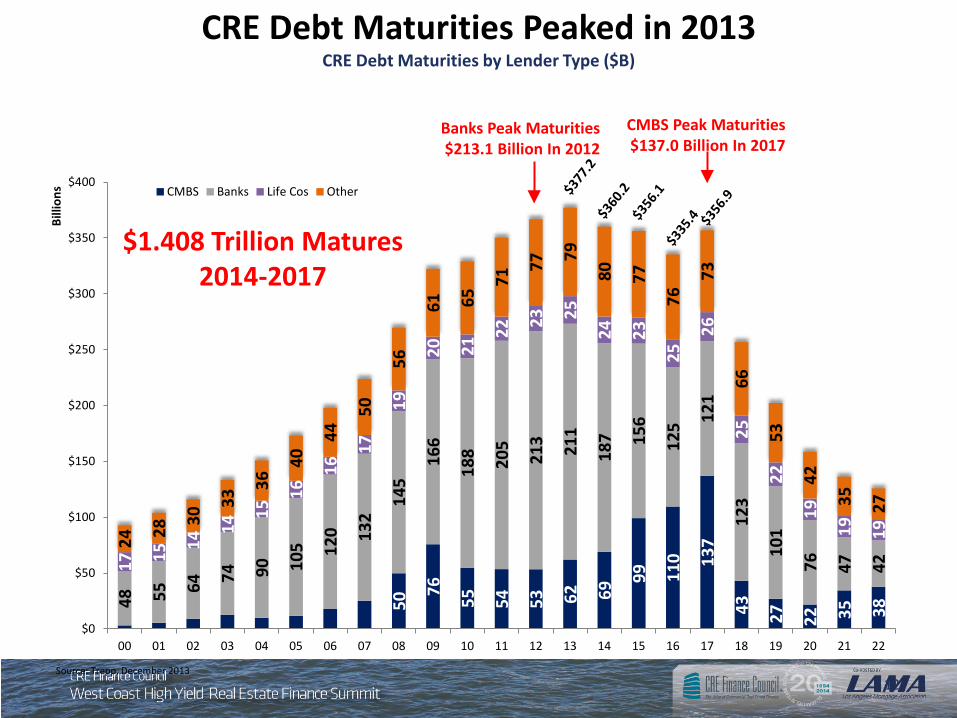
CRE Debt Maturities Peaked in 2013 CRE Debt Maturities by Lender Type ($B)
12
50 76
55
54
53
62
69 99
110 13
7
43
27
22 35
38 48
55 64
74
90
105 12
0 132
145
166
188 205
213 21
1
187 15
6
125 12
1
123
101
76
47
42
17 15
14 14
15 16
16 17
19
20
21 22
23 25
24
23
25 26
25
22
19
19
19
24 28
30 33
36 40
44 50
56
61
65 71
77 79
80
77
76 73
66
53
42
35
27
$0
$50
$100
$150
$200
$250
$300
$350
$400
00 01 02 03 04 05 06 07 08 09 10 11 12 13 14 15 16 17 18 19 20 21 22
Billi
ons CMBS Banks Life Cos Other
CMBS Peak Maturities $137.0 Billion In 2017
Banks Peak Maturities $213.1 Billion In 2012
$1.408 Trillion Matures 2014-2017
Source: Trepp, December 2013
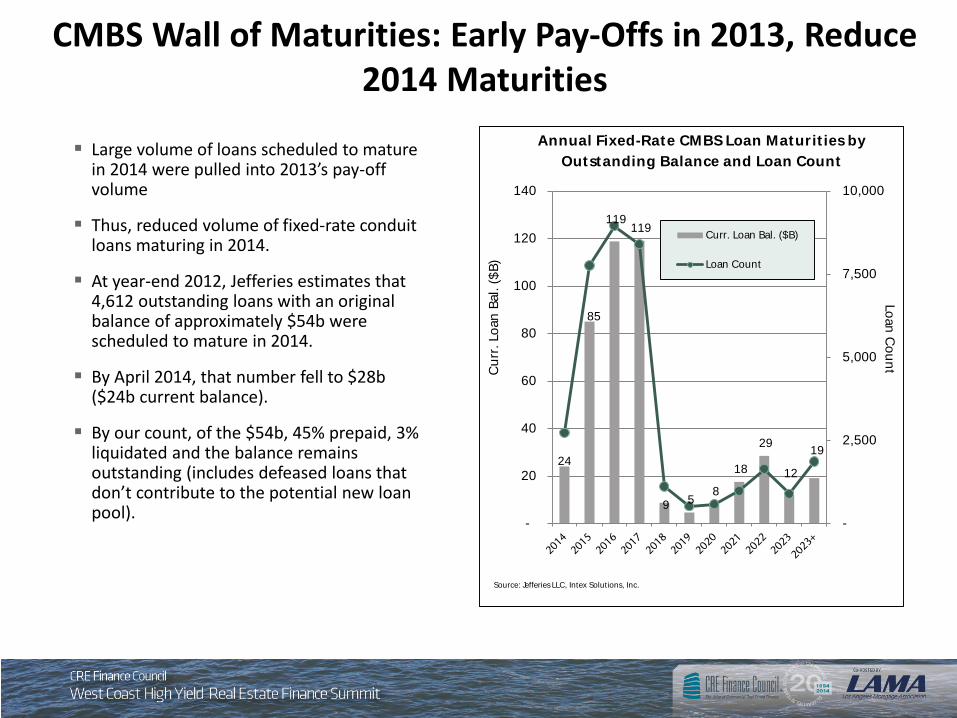
CMBS Wall of Maturities: Early Pay-Offs in 2013, Reduce 2014 Maturities
Large volume of loans scheduled to mature in 2014 were pulled into 2013’s pay-off volume
Thus, reduced volume of fixed-rate conduit loans maturing in 2014.
At year-end 2012, Jefferies estimates that 4,612 outstanding loans with an original balance of approximately $54b were scheduled to mature in 2014.
By April 2014, that number fell to $28b ($24b current balance).
By our count, of the $54b, 45% prepaid, 3% liquidated and the balance remains outstanding (includes defeased loans that don’t contribute to the potential new loan pool).
24
85
119 119
9 5 8
18
29
12
19
-
2,500
5,000
7,500
10,000
-
20
40
60
80
100
120
140
Loan CountCur
r. Lo
an B
al. (
$B)
Annual Fixed-Rate CMBS Loan Maturit ies by Outstanding Balance and Loan Count
Curr. Loan Bal. ($B)
Loan Count
Source: Jefferies LLC, Intex Solutions, Inc.

A CMBS Cycle in Hyper Drive Increase in Conduit Lenders and Growing Debt Capital Sources Elsewhere... As more and more firms take a shot at the origination side of the business, their efforts have not been met
with the demand many thought would exist in early 2014. US. CMBS Issuance Slower Than Projected U.S. CMBS issuance through first 4 months of 2014 totals $24.3b vs. $29.4b for same-period 2013 At the current pace, total U.S. CMBS 2014 issuance will total a projected $65b vs. projections of as
much as $110b and 2013 volume of $81.9b
U.S. Agency CMBS Issuance Follows Suit $22.65 for first four of months of 2013 $15.2b for first four months of 2014
What to Watch for? More investors are willing to pay a premium for better-quality collateral Focus on 2011 and 2012 conduit deals Real money investors staying at the top of the capital stack in deals with aggressively underwritten
collateral Faster money focused on BBB- bonds, pushing spreads to YTD tight of around +315 bps Recent deals experienced increase in credit enhancement to offset more aggressive loans, weaker
assets Investors continuing to focus on Single-Borrower/Single-Asset CMBS. Although 144A, most of these
deals have sufficiently less leverage than their conduit counterparts and assets tend to be trophy quality

A CMBS Cycle in Hyper-Drive: Underwriting Standards Similar to 2005
Conduit / Fusion Fixed-Rate CMBS Comparat ive Analysis2014* 2010 2007 2006 2005
Total Issuance ($B) 18.7 9.2 188.6 161.8 136.4Avg. Deal Size ($B) 1.2 0.8 3.6 2.6 2.2Issuer Debt Yield (%) 10.88 12.86 8.26 9.38 10.32Issuer LTV (%) 65.3 57.9 69.1 68.0 68.7Issuer DSCR 1.69 1.85 1.40 1.47 1.60No. of Loans 65 31 193 188 164No. of Properties 110 74 282 264 228# Properties/# Loans 0 2.38 1.46 1.40 1.39Avg. Loan Size ($M) 18.7 20.4 17.9 14.5 13.9Largest Loan (%) 9.7 15.8 10.0 9.5 8.7Top Ten (%) 0.5 68.8 43.5 41.4 41.4Hotel (%) 13.0 4.7 10.4 10.6 7.2Office (%) 16.5 33.8 27.0 30.3 32.3Retail (%) 29.8 38.8 31.1 31.7 33.2Single-Tenant Exp. (%) 8.5 26.1 11.7 12.4 9.5Avg. AAA Base CE (%) 22.25 18.09 12.00 12.02 12.67Avg. BBB- CE (%) 7.38 6.25 3.12 3.06 3.33% of IO Loans (Partial) 38.4 6.0 30.2 45.2 41.9% of IO Loans (Term) 16.3 7.4 55.8 29.2 21.8Stressed DSCR 1.01 1.36 0.91 1.00 1.05Stressed LTV (%) 105.0 82.6 111.2 100.5 96.4Stressed Debt Yield (%) 9.4 10.9 - - -Cash Flow Hair Cut (%) 5.8 6.0 8.3 5.9 4.2Subordinate Debt (%) 10.1 17.0 54.6 43.7 39.6B-notes (%) 2.2 7.4 8.1 6.9 7.1IG Rated Loans (%) 5.3 33.5 7.0 11.8 13.9Sources: Jefferies LLC, DBRS, Fitch, Kroll, Moody's, Morningstar, S&P. Notes. 2002-2005 IO % = initial and term IO loans combined. *2014 as of 4/30/14.
Rating agency (RA) DSCR ,LTV, and cash
flow haircuts currently resemble 2006 level Unfortunately, the slide continues in
early-2014 2007 RA Stressed DSCR 0.91x vs.
current level of 1.01x 2007 RA Stressed LTV of 111.2%
vs. current level of 104.6% 2007 RA cash flow haircut 5.9% vs.
current level of 5.8%
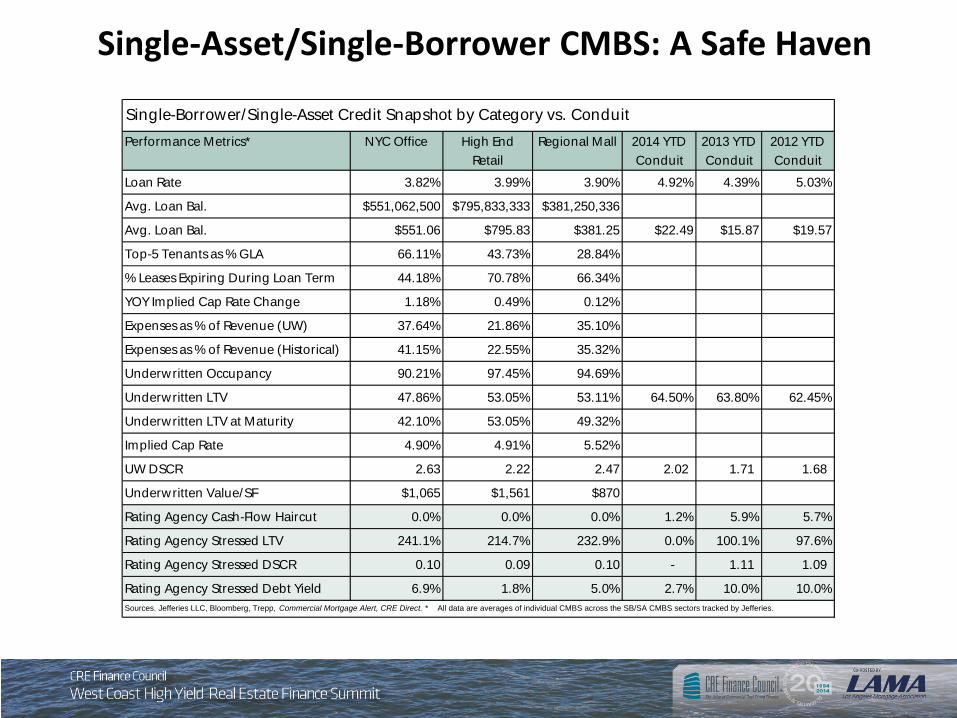
Single-Asset/Single-Borrower CMBS: A Safe Haven
Single-Borrower/Single-Asset Credit Snapshot by Category vs. ConduitPerformance Metrics* NYC Office High End
RetailRegional Mall 2014 YTD
Conduit2013 YTD Conduit
2012 YTD Conduit
Loan Rate 3.82% 3.99% 3.90% 4.92% 4.39% 5.03%
Avg. Loan Bal. $551,062,500 $795,833,333 $381,250,336
Avg. Loan Bal. $551.06 $795.83 $381.25 $22.49 $15.87 $19.57
Top-5 Tenants as % GLA 66.11% 43.73% 28.84%
% Leases Expiring During Loan Term 44.18% 70.78% 66.34%
YOY Implied Cap Rate Change 1.18% 0.49% 0.12%
Expenses as % of Revenue (UW) 37.64% 21.86% 35.10%
Expenses as % of Revenue (Historical) 41.15% 22.55% 35.32%
Underwritten Occupancy 90.21% 97.45% 94.69%
Underwritten LTV 47.86% 53.05% 53.11% 64.50% 63.80% 62.45%
Underwritten LTV at Maturity 42.10% 53.05% 49.32%
Implied Cap Rate 4.90% 4.91% 5.52%
UW DSCR 2.63 2.22 2.47 2.02 1.71 1.68
Underwritten Value/SF $1,065 $1,561 $870
Rating Agency Cash-Flow Haircut 0.0% 0.0% 0.0% 1.2% 5.9% 5.7%
Rating Agency Stressed LTV 241.1% 214.7% 232.9% 0.0% 100.1% 97.6%
Rating Agency Stressed DSCR 0.10 0.09 0.10 - 1.11 1.09
Rating Agency Stressed Debt Yield 6.9% 1.8% 5.0% 2.7% 10.0% 10.0%Sources. Jefferies LLC, Bloomberg, Trepp, Commercial Mortgage Alert, CRE Direct. * All data are averages of individual CMBS across the SB/SA CMBS sectors tracked by Jefferies.

Market Trends and Opportunities for 2014
TOP OF THE STACK REMAINS RELATIVELY UNCHANGED Money managers continue to focus on the short and long part of the curve to meet wide variety of investor
demand Banks have exhibited willingness to pay premium in return for more stable/predictable ASB (amortizing class) and
Front Pay LCF cash flows LCF still attractive to broad investor base ranging from Insurance accounts to Retirement funds as investors
continue to search for money-good assets with sufficient yields further out the curve
CREDIT STACK LOSING SPONSORSHIP As underwriting and structural leverage have increased, many money manager, banks, and insurance companies
have shied away from purchasing A- and BBB- tranches for the fear of these bonds taking losses. Insurance companies are often more comfortable originating a loan in accordance with their own underwriting
standards and holding on their books versus gaining similar yields in purchasing A- and BBB- classes
Tranche Rating WAL (Yrs) Particpant Account TypeA1/A2 AAA 2.5-5 Money ManagerA3 AAA 7 Insurance/Money ManagerASB AAA 7.5 Bank/ Insurance/Money ManagerFront Pay LCF A4 AAA 10 Bank/ Insurance/Money ManagerLCF A5 AAA 10 Money Manager/ Insurance/Retirement-Pension FundAS AAA 10 Insurance/Money ManagerB AA- 10 Money Manager/ InsuranceC A- 10 Money Manager/Hedge FundD BBB- 10 Money Manager/Hedge Fund
New Issue Conduit Capital Stack Investor Analysis


