1
Nutrition 202Animal Energetics
R. D. SainzLecture 04
Direct and indirect methods for Direct and indirect methods for estimation of energy utilizationestimation of energy utilization
ME = RE + HE
Direct calorimetry measures heat production (HE) directly

2
Long term determination of energy Long term determination of energy expenditureexpenditure
• Free ranging animals• No calorimeters required• Relatively non-invasive
H14CO3- infusion:
measure CO2 entry rate (= production)
H2O + CO2 ↔ H2CO3 ↔ HCO3- + H+

3
Double-labeled water can be used to estimate energy expenditure in humans and other animals:
H2O + CO2 ↔ H2CO3 ↔ HCO3- + H+
With injected D218O:
H2O + C18O2 ↔D2CO3 ↔ DC18O3- + D+
D2CO3 : 1 oxygen will be from 18O2 oxygen will be from CO2 = unlabeled
R CO2 = (18O flux – D flux)*(total body water/2)
From: Haggarty & McGRaw, 1988.

4
DoubleDouble--label waterlabel water
• 18O flux determined from 18O excretion in urine
• D flux determined from D2O excretion in urine
• The rate of CO2 production can be estimated from the distribution of label;
• This value can be used to calculate heat production, if you know the RQ.
• In adult humans, we can approximate this using the food quotient
From: Haggarty & McGRaw, 1988.

5
From: Haggarty & McGRaw, 1988.
Heart rate measurementsHeart rate measurements
• O2 uptake α heart rate• L O2/minute = beats/minute x L O2/beat• Must be calibrated for each animal & situation• Data logger records HR over 24 hr period• Relatively non-invasive

6
Slide courtesy of A. Brosh
Slide courtesy of A. Brosh

7
Slide courtesy of A. Brosh
The following equation represents this dependency:
VO2 = HR*SV * (A-V)HR = Rate of Heart beats
VO2 = Oxygen ConsumptionSV = Stroke Volume,
A-V = Arterial – Venous O2 concentration
Slide courtesy of A. Brosh

8
AS VO2 = HR*SV * (A-V)and VO2 Per one heart beat=O2Pulse
SV * (A-V) = O2Pulse
S0
VO2 = HR*O2Pulse
Slide courtesy of A. Brosh
Assuming SV and A-V diff are not constant
lead to use regression equation to predict VO2 and EE from HR
(Webster, 1967; Yamamoto et al., 1979; Richards and Lawrence, 1984; Renecker and Hudson, 1985; Purwanto et al., 1990)
Slide courtesy of A. Brosh

9
For feedlot cattle, HR during the day is mainly affected by the diet energy and by the time of eating
H diet
L diet
Feeding time
Slide courtesy of A. Brosh
HR
HR
VO2
VO2 & HR of Heifers at rest and during exercise on low and high diets
Slide courtesy of A. Brosh

10
y = 16.321x + 67.882R2 = 0.8605
y = 10.959x + 281.22R2 = 0.6135
y = -0.1372x2 + 45.232x - 1230.6R2 = 0.9609
y = -0.0426x2 + 23.509x - 686.34R2 = 0.9061
200
700
1200
1700
2200
2700
20 40 60 80 100 120 140 160 180 200
R L
W L
W H
Animal 2
RH
RH
R=RestW=ExerciseL=Low En' dietH=HighEn' diet
HR (beats/min)
VO2ml/(kgmet.h)
VO2 & HR of one Heifer at rest (R) and during exercise(W) on low (L) and high (H) diets
Slide courtesy of A. Brosh
Pulmonary OPulmonary O22 AA--VV
• Animals are surgically prepared with indwelling O2-sensing catheters and blood flow metering cuffs around pulmonary artery and vein
• O2 uptake = BFR (mL/min)*([O2]ven - [O2]art)• Instantaneous measurement• Extremely invasive

11
Measurement of REMeasurement of RE
ME = RE + HE
• Longitudinal studies
• Comparative slaughter
• RE = final body energy – initial body energy
• Initial and final body energy contents are determined by taking representative samples of body tissues and subjecting them to chemical analyses and/or to bomb calorimetry

12
Comparative slaughterComparative slaughter
• Advantages:– Direct estimation of recovered energy– Requires no assumptions about efficiencies of deposition, etc.– Doesn’t require sophisticated animal calorimeters
• Disadvantages:– Measurements must be made over long periods of time– Low precision often requires larger numbers of animals– Difficult to obtain accurate estimates of initial composition
• Initial composition:– Sample a representative group at the beginning of the
experiment– Determine their composition– Apply this estimate to the final group(s)
SizeSize
• Weight*
• Length
• Height

13
CompositionCompositionThe main chemical components of the body
are water, fat, protein and ash:
Lean animal
60%15%
20%
5%Fat animal
45%
37%
15%3%
Water
Fat
Protein
Ash
Measuring body compositionMeasuring body composition
• Direct– Kill, grind, sub-sample and analyze
• Indirect methods (in vivo)– Non-invasive (varying degrees)– Non-destructive

14
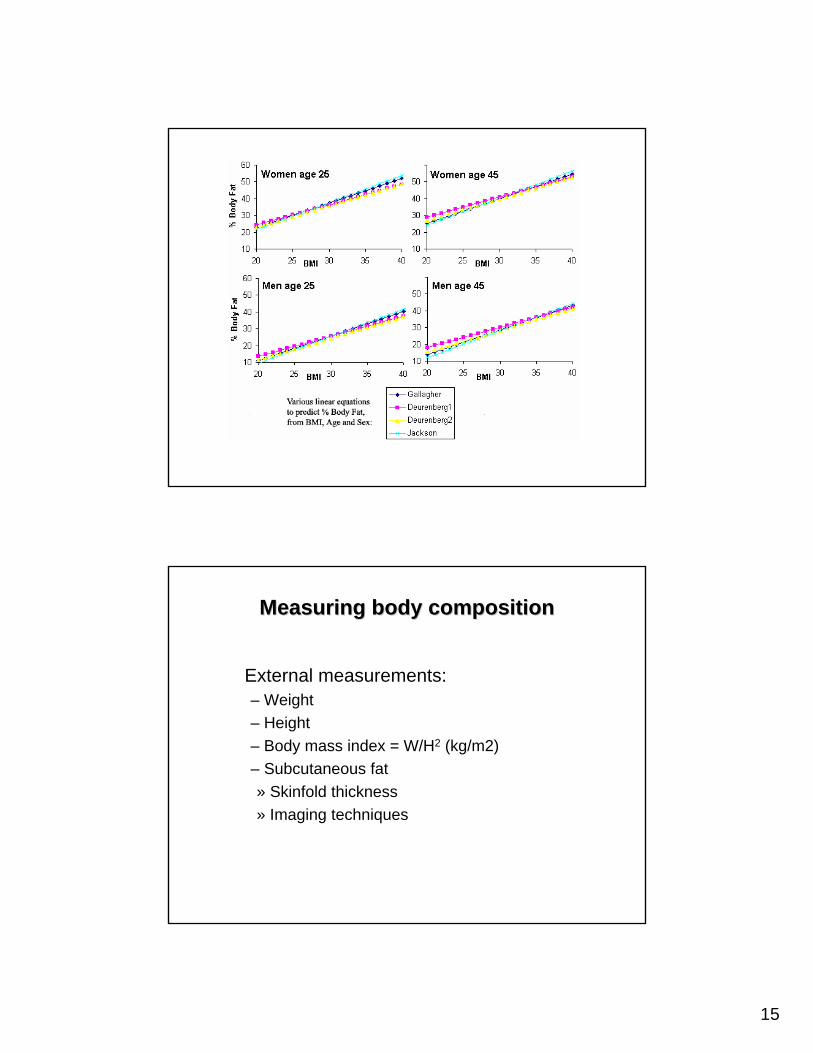
External measurements:– Weight– Height– Body mass index = W/H2 (kg/m2)
Measuring body compositionMeasuring body composition
The relationship between BMI and body composition varies between sexes, racial groups, ages, and levels of physical fitness. Shaquille O’Neal is classified as obese by this measure…
15
External measurements:– Weight– Height– Body mass index = W/H2 (kg/m2)– Subcutaneous fat» Skinfold thickness» Imaging techniques
Measuring body compositionMeasuring body composition
16
Measuring body compositionMeasuring body composition
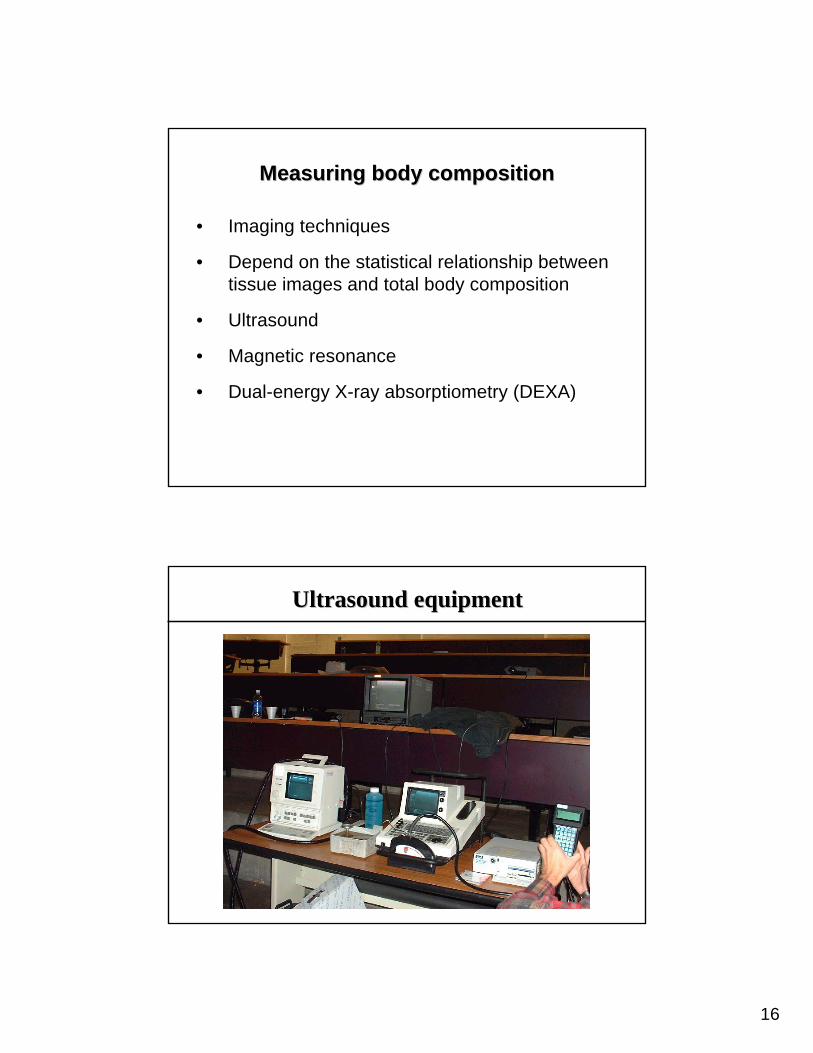
• Imaging techniques
• Depend on the statistical relationship between tissue images and total body composition
• Ultrasound
• Magnetic resonance
• Dual-energy X-ray absorptiometry (DEXA)
Ultrasound equipmentUltrasound equipment

17
Scanning locations for ultrasound measuresScanning locations for ultrasound measures
Rump fatRump fat –– ““P8P8””

18
Measurement of ribeye areaMeasurement of ribeye area
Ribeye Ribeye –– longissimus dorsi musclelongissimus dorsi muscle

19
Ribeye Ribeye –– longissimus dorsi musclelongissimus dorsi muscle
Steer 85 – young & lean
Steer 85 – older & fatter

20
21
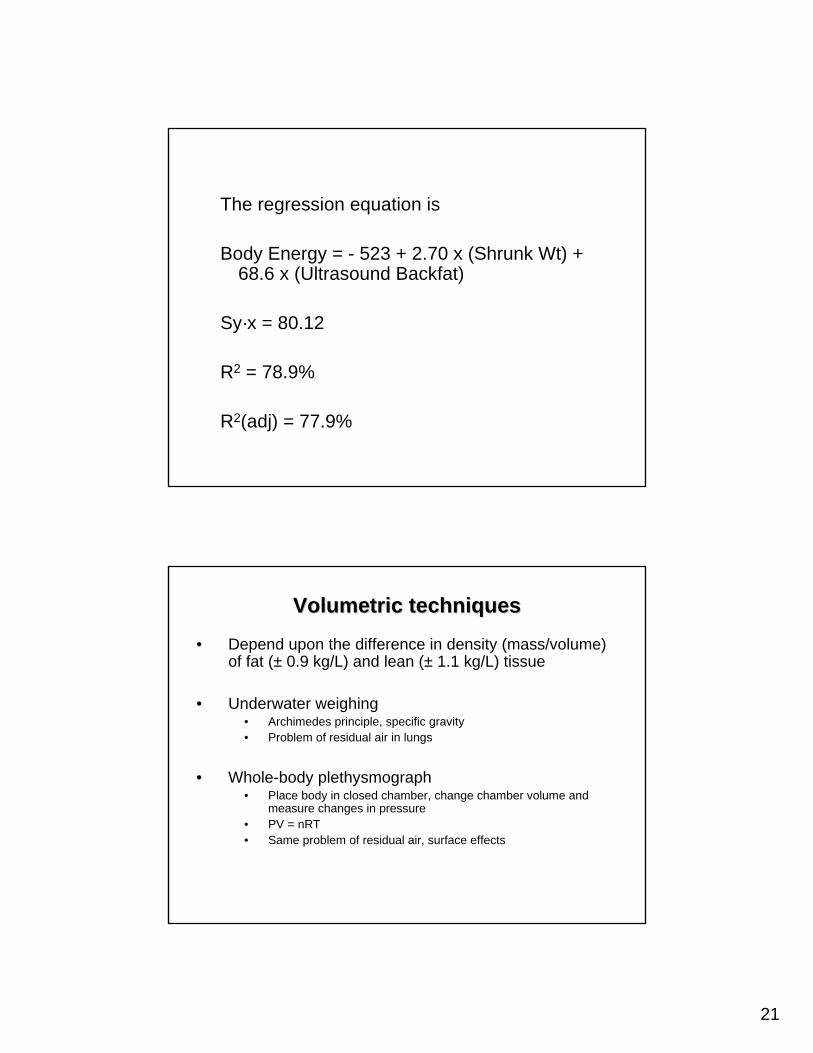
The regression equation is
Body Energy = - 523 + 2.70 x (Shrunk Wt) + 68.6 x (Ultrasound Backfat)
Sy·x = 80.12
R2 = 78.9%
R2(adj) = 77.9%
Volumetric techniquesVolumetric techniques
• Depend upon the difference in density (mass/volume) of fat (± 0.9 kg/L) and lean (± 1.1 kg/L) tissue
• Underwater weighing • Archimedes principle, specific gravity• Problem of residual air in lungs
• Whole-body plethysmograph• Place body in closed chamber, change chamber volume and
measure changes in pressure• PV = nRT• Same problem of residual air, surface effects

22
where TC (temperature coefficient) is the density of water at tank temperature ÷density of water at carcass temperature.
Then,Empty body energy (Mcal/kg) = 47.58 –
41.97 Density
R = -0.95, SEE = ± 0.15
)*( TCwaterinWtairinWtairinWtDensity
−=

23
The Bod PodTM The Pea PodTM
Performance of Pea Performance of Pea PodPodTMTM on beef tissue on beef tissue phantomsphantoms
Sainz & Urlando, 2002
0 10 20 30 40%FAT ADP (%)
0
10
20
30
40
%FA
TCA
(%)
0 10 20 30 40Mean of %FAT ADP and %FAT CA
-3
-2
-1
0
1
2
3
%FA
TA
DP -
%FA
T CA
(%)
0 10 20 30 40-3
-2
-1
0
1
2
3
0 10 20 30 40-3
-2
-1
0
1
2
3
0 10 20 30 40-3
-2
-1
0
1
2
3

24
Measuring body compositionMeasuring body composition
• Electrical properties• Depends on the differences in electrical conductivity of
fat (low) and lean (high) tissues • Bioimpedance analysis
– pass a small current through the body, resistance is a measure of total body H2O
– low precision (± 10%); acceptable for medical purposes?
• Total Body Electrical Conductivity (ToBEC)
Bioelectric Impedance ToBEC

25
Measuring body compositionMeasuring body composition
• Body water space• Depends on the inverse relationship between body
water and body fat• Relative proportions of body water, protein and ash
vary little, fat varies a great deal • Requires a tracer that distributes rapidly and uniformly
into all body water compartments, e.g.– D2O– TOH– Urea– Antipyrine
Body water spaceBody water space
0
10
20
30
40
40 45 50 55 60 65
Body water, %
Bod
y fa
t, %

26
• Example: assume lean and fat animals, both weighing 100 kg;– Inject 10 mL of D2O– Allow to equilibrate– Sample body fluid
• Body water (L) = Dose (mL) / Concentration (mL/L)
• Body water % = 100 x body water (L) / body wt (kg)
• Then: use previously determined ratios of water:protein:ash, e.g. 12:4:1, so that
• Body protein % = body water % ÷ 3
• Body fat % = 100 – [body water % * (12+4+1)/12]
Lean Fat
Body wt, kg 100 100
Body fat, kg 15 37
Body water, L 60 45
D2O concentration, mL/L 0.166 0.222


