Michigan Medicaid Pharmacy Cost Containment
Paul Reinhart, Director
Medical Services Administration
Michigan Department of
Community Health
October 8, 2004
2
Conclusions
• Preferred drug list program has reduced the rate of growth in Medicaid pharmaceutical spending
• Savings will grow as more states join the new multi-state initiative
• No adverse beneficiary impact• Medicare pharmacy reform will have both
positive and negative impact on states

3
“Medicaid is the bleeding ulcer of state government.”
State Rep. Marc ShulmanDetroit News, April 19, 2004

4
Growth in Michigan Medicaid Vs. Growth in Michigan Revenue
-20%
0%
20%
40%
60%
80%
100%
FY95 FY97 FY99 FY01 FY03 FY05
Medicaid
Revenue

5
Michigan Medicaid Caseload
1,000
1,050
1,100
1,150
1,200
1,250
1,300
1,350
1,400
1,450
Fiscal Year
In T
hou
san
ds
1999 2000 2001 2002 2003
1,071,900
1,401,800*
Previous Record
*August 2004
2004
6
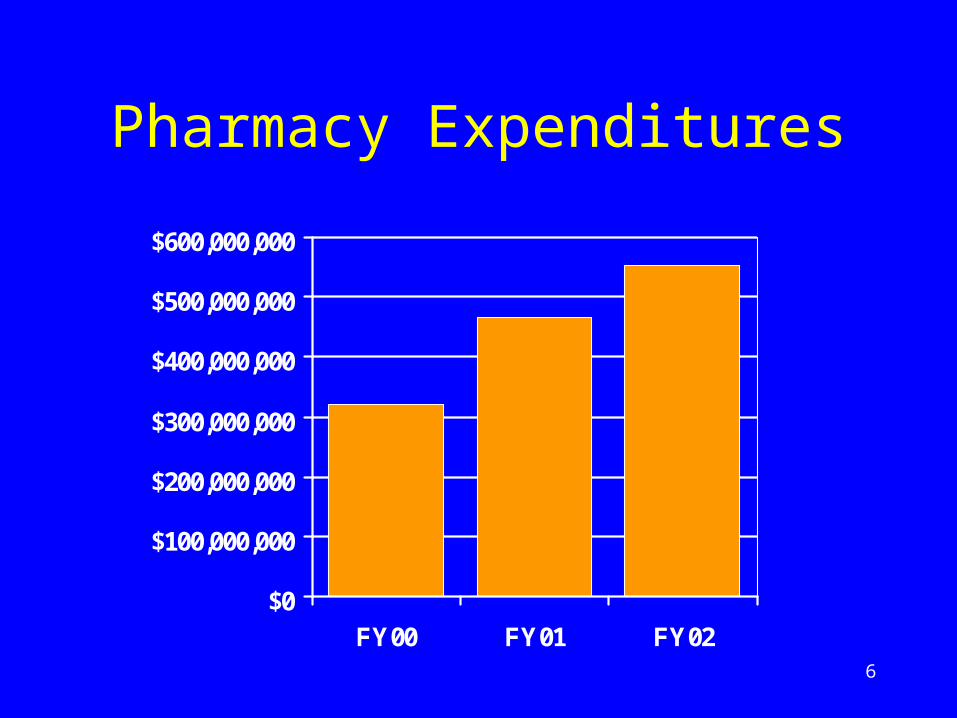
Pharmacy Expenditures
$0
$100,000,000
$200,000,000
$300,000,000
$400,000,000
$500,000,000
$600,000,000
FY00 FY01 FY02
7
Michigan Medicaid Pharmacy Cost Containment
8
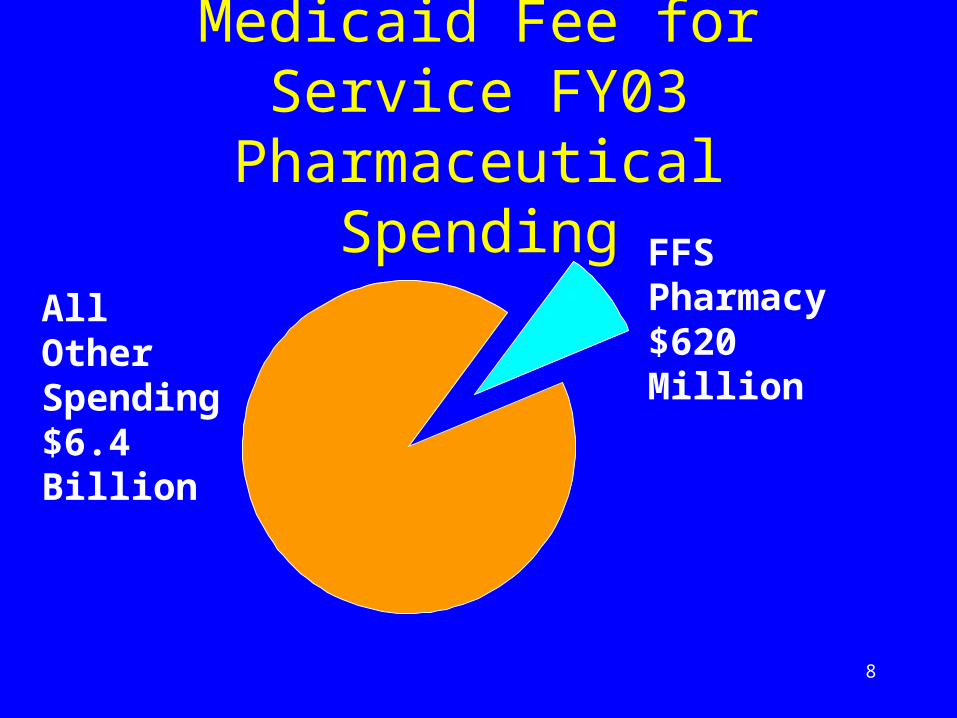
Medicaid Fee for Service FY03 Pharmaceutical Spending
FFS Pharmacy $620 MillionAll Other
Spending $6.4 Billion

9
Medicaid Pharmacy Program Prior to PDL
Pre-PDL
Preferred Drugs Some Generics
Federal Rebate Yes
Supplemental Rebate
No
Pharmacist Payments
AWP, MAC, etc.

10
Medicaid Pharmacy Program After PDL
Pre-PDL Post PDL
Preferred Drugs Some Generics Larger List
Federal Rebate Yes Yes
Supplemental Rebate
No Yes
Pharmacist Payments
AWP, MAC, etc.
Same

11
2002-2003 PDL
• Limited to Michigan• Pharmacy and Therapeutics Committee
identified clinically necessary drugs in 40 drug classes
• Contractor (First Health) negotiated supplemental rebates
• Clinically necessary and drugs with supplemental rebates are not subjected to prior authorization
12
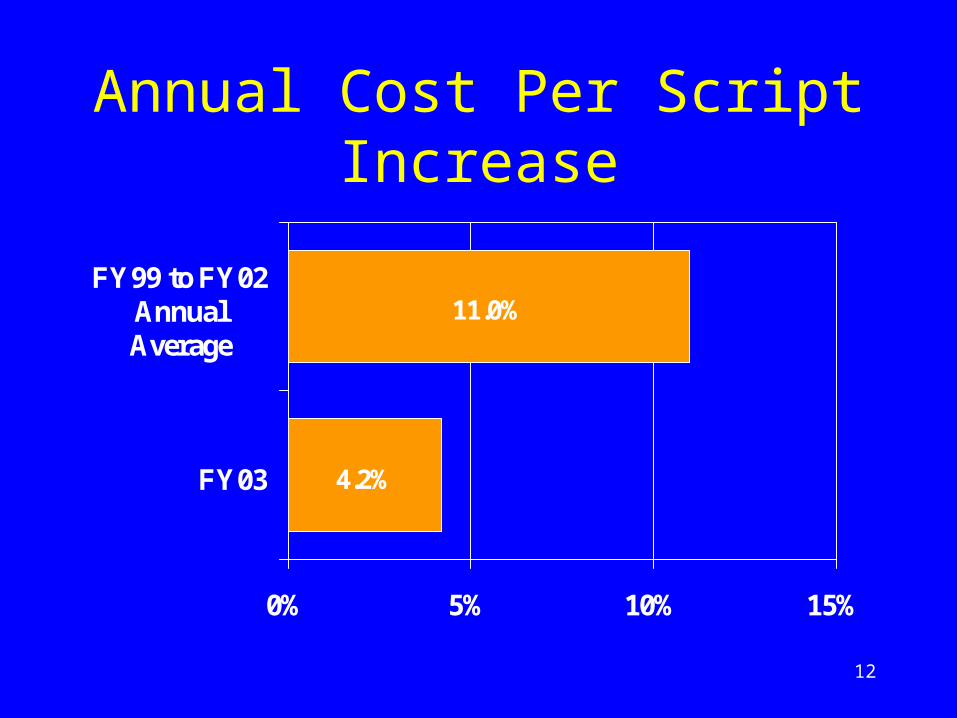
Annual Cost Per Script Increase
4.2%
11.0%
0% 5% 10% 15%
FY03
FY99 to FY02AnnualAverage

13
Estimated Pharmacy Cost Containment Savings
$0$100$200$300$400$500$600$700$800
FY99 FY 00 FY 01 FY 02 FY 03 FY 04
Mill
ions
Actual Trend

14
Preferred Drug List Impact on Beneficiaries

15
Prior Authorization Denials
• 14,300,000 claims
• 106,000 prior authorization requests
• 39,000 approved by technician
• 61,000 approved by pharmacist
• 3,500 approved by state physician
• 2,500 denied by state physician
• 1 denial reversed after administrative appeal

16
Multi-State Preferred Drug List Program

17
Michigan Multi-State Pooling Agreement• Approved by the federal government on
April 22, 2004
• States in the initial pool: Michigan, Vermont, Nevada, Alaska, New Hampshire
• Hawaii and Minnesota state plan amendments approved in September

18
“Matrix” Bid Theory: More Lives, More Exclusivity = Lower Cost
Lives 1 of 1 1 of 2 1 of 3 1 of 4
< 3 m $1.00 $1.10 $1.20 $1.30
3 – 6 m $.90 $1.00 $1.10 $1.20
6 – 9 m $.80 $.90 $1.00 $1.10
> 9 m $.70 $.80 $.90 $1.00
More Exclusivity
M
ore
Liv
es
19
Medicare Prescription Drug, Improvement, and Modernization
Act of 2003
20
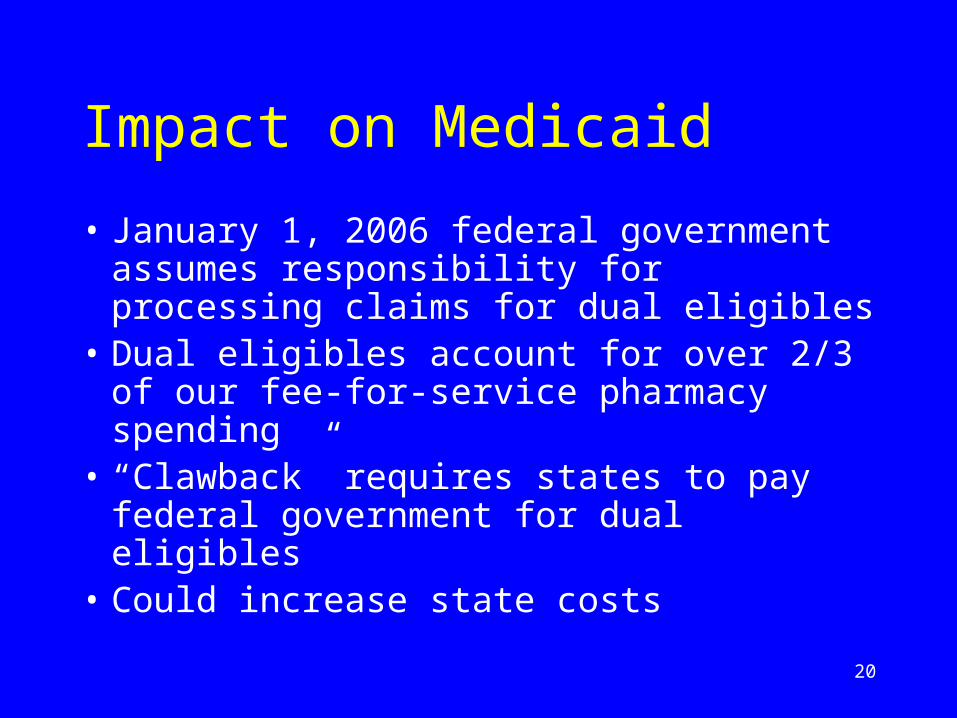
Impact on Medicaid
• January 1, 2006 federal government assumes responsibility for processing claims for dual eligibles
• Dual eligibles account for over 2/3 of our fee-for-service pharmacy spending
• “Clawback” requires states to pay federal government for dual eligibles
• Could increase state costs

21
“Clawback” Will Increase Michigan’s Costs
$180$190
$200$210
$220$230
$250
$170$180$190$200$210$220$230$240$250$260
FY03 FY04 FY05 FY06 FY07
Stat
e C
osts
in M
illi
ons
State Operated Federal Clawback

22
Other MMA Impacts
• New state administrative costs
• Reduced state pharmacy bargaining power
• State pharmacy assistance program savings
• State pharmacy assistance coverage expansion opportunities

23
Conclusions
• Preferred drug list program has reduced rate of growth in Medicaid pharmaceutical spending
• Savings will grow as more states join the new multi-state initiative
• No adverse beneficiary impact• Medicare pharmacy reform will have both
positive and negative impact on states


