
Mr. Hallvar Haugdal, finished his MSc. in Electrical Engineering at NTNU, Norway in 2016, specializing innumerical field calculations and electrical motor design. After his MSc he worked a Scientific Assistant also atNTNU, dealing with courses on electrical machines, power systems and field calculations. Since January 2018he is a PhD student on Wide Area Monitoring- and Control Systems.
“Online Mode Shape Estimation using Complex Principal Component Analysis and Clustering”, Hallvar Haugdal(NTMU Norway)

Online Mode Shape Estimationusing Complex Principal
Component Analysis and Clustering
Hallvar Haugdal

Contents
• Motivation• Background theory
• (C)PCA• Clustering
• Proposed method• Application to Kundur Two Area-system

Contents
• Motivation• Background theory
• (C)PCA• Clustering
• Proposed method• Application to Kundur Two Area-system

Motivation
• Modal analysis• Powerful tool• Understanding of system dynamics• Stability limits• Design of controllers• Difficult due to inaccurate modelling• Load dependent
• Propose empirical approach• Relying only on Wide Area PMU measurements• Correlation• Statistical learning

Two-part methodPart 1: Provide estimates of modes and mode shapes
• Moving window ~ 5 − 10 s length• Using correlation, Complex Principal Component Analysis (CPCA)• Provide point estimates of modes shapes
Part 2: Compute averaged mode shapes• Differentiate between noise and modes• Clustering points resulting from Part 1• Averaged modes and -shapes computed as centroids of clusters

Contents
• Motivation• Background theory
• (C)PCA• Clustering
• Proposed method• Application to Kundur Two Area-system

Principal Component Analysis• Matrix of 𝑀𝑀 series, 𝑁𝑁 samples:
𝐗𝐗 =
𝐱𝐱𝟏𝟏𝐱𝐱𝟐𝟐⋮𝐱𝐱𝑴𝑴
=
𝑥𝑥1(𝑡𝑡1) 𝑥𝑥1 𝑡𝑡2𝑥𝑥2 𝑡𝑡1 𝑥𝑥2 𝑡𝑡2
⋯ 𝑥𝑥1 𝑡𝑡𝑁𝑁𝑥𝑥2 𝑡𝑡𝑁𝑁
⋮𝑥𝑥𝑀𝑀 𝑡𝑡1 𝑥𝑥3 𝑡𝑡2
⋱𝑥𝑥𝑀𝑀 𝑡𝑡𝑁𝑁
• Want to transform the correlated series 𝐱𝐱𝟏𝟏, 𝐱𝐱𝟐𝟐 ⋯𝐱𝐱𝑴𝑴 into uncorrelatedseries 𝐬𝐬𝟏𝟏, 𝐬𝐬𝟐𝟐 ⋯ 𝐬𝐬𝑴𝑴:
𝐒𝐒 =
𝐬𝐬𝟏𝟏𝐬𝐬𝟐𝟐⋮𝐬𝐬𝑴𝑴
= 𝐔𝐔𝑻𝑻𝐗𝐗, 𝒔𝒔𝒊𝒊 = 𝐮𝐮𝒊𝒊𝑻𝑻𝑿𝑿
• Do this by eigendecomposition of the covariance matrix:
𝐂𝐂 =1
1 − 𝑁𝑁𝐗𝐗𝐗𝐗𝐓𝐓
• Eigenvalues (λ𝑖𝑖) and -vectors (𝐮𝐮𝒊𝒊):
𝐂𝐂𝐮𝐮𝒊𝒊 = λ𝑖𝑖𝐮𝐮𝒊𝒊, 𝑖𝑖 = 1 …𝑀𝑀𝐔𝐔 = 𝐮𝐮𝟏𝟏,𝐮𝐮𝟐𝟐 ⋯𝐮𝐮𝑴𝑴
⇒ 𝐔𝐔′𝐂𝐂𝐔𝐔 = 𝚲𝚲 =
𝜆𝜆1𝜆𝜆2
⋱𝜆𝜆𝑀𝑀
𝜆𝜆1> 𝜆𝜆2 > 𝜆𝜆3 … 𝜆𝜆𝑀𝑀
• Inversion gives time series from scores
𝐗𝐗 = 𝐔𝐔𝐒𝐒
𝐱𝐱𝒊𝒊 = �𝒋𝒋=𝟏𝟏
𝑴𝑴
𝑢𝑢𝑖𝑖,𝑗𝑗𝐬𝐬𝒋𝒋
• Contribution of 𝐬𝐬𝒋𝒋 in 𝐱𝐱𝒊𝒊 given by coefficient 𝑢𝑢𝑖𝑖,𝑗𝑗

Complex Principal Component Analysis• Similar to conventional PCA• Additional steps:
• Empirical Mode Decomposition (EMD)• Detrending• (Decomposition ⇒ Intrinsic Mode Functions)
• Hilbert Transform⇒ Complex time series 𝐳𝐳𝒊𝒊• Complex covariance matrix:
𝐂𝐂 =1
𝑁𝑁 − 1𝐙𝐙∗𝐙𝐙
• Contribution of 𝐬𝐬𝒋𝒋 in 𝐳𝐳𝒊𝒊 given by complexcoefficient 𝑢𝑢𝑖𝑖,𝑗𝑗
• Resembles observability mode shapes• Slower than PCA
• Due to EMD and Hilbert Transform• Works well with damped exponentials• Noisy during steps [3]

Clustering
[2][4]
• Various methods• K-means• Gaussian Mixture Models

Contents
• Motivation• Background theory
• (C)PCA• Clustering
• Proposed method• Application to Kundur Two Area-system

Proposed method, Part 1: Generating mode estimates
• Input: Starting out with time window1. PCA 𝐗𝐗 ⇒ 𝐒𝐒 (Scores)2. EMD Detrending3. Hilbert Transform4. CPCA 𝐒𝐒 ⇒ 𝐙𝐙 (Complex scores)
• Complex PC Scores resemble modes (𝑓𝑓, 𝜉𝜉)• Complex Coefficients resemble mode shapes
• Output: Point in 2𝑀𝑀 + 1 dimensions𝑝𝑝 = 𝑓𝑓, Re 𝐶𝐶1 , Im 𝐶𝐶1 , Re 𝐶𝐶2 , Im 𝐶𝐶2 … Re 𝐶𝐶𝑀𝑀 , Im 𝐶𝐶𝑀𝑀

Proposed method, Part 2: Averaged mode estimates using Clustering• Resulting points from Part 1 are assumed to populate input space more
densely close to areas corresponding to modes• Input: Matrix of 𝑄𝑄 point estimates
𝑃𝑃 =
𝑝𝑝1𝑝𝑝2⋮𝑝𝑝𝑄𝑄
=
𝑓𝑓, Re 𝐶𝐶1 , Im 𝐶𝐶1 … Re 𝐶𝐶𝑀𝑀 , Im 𝐶𝐶𝑀𝑀𝑓𝑓, Re 𝐶𝐶1 , Im 𝐶𝐶1 … Re 𝐶𝐶𝑀𝑀 , Im 𝐶𝐶𝑀𝑀
⋮𝑓𝑓, Re 𝐶𝐶1 , Im 𝐶𝐶1 … Re 𝐶𝐶𝑀𝑀 , Im 𝐶𝐶𝑀𝑀
• Clustering of points (number of clusters unknown)• Output: Averaged mode shapes
• Centroids of clusters

Contents
• Motivation• Background theory
• (C)PCA• Clustering
• Proposed method• Application to Kundur Two Area-system
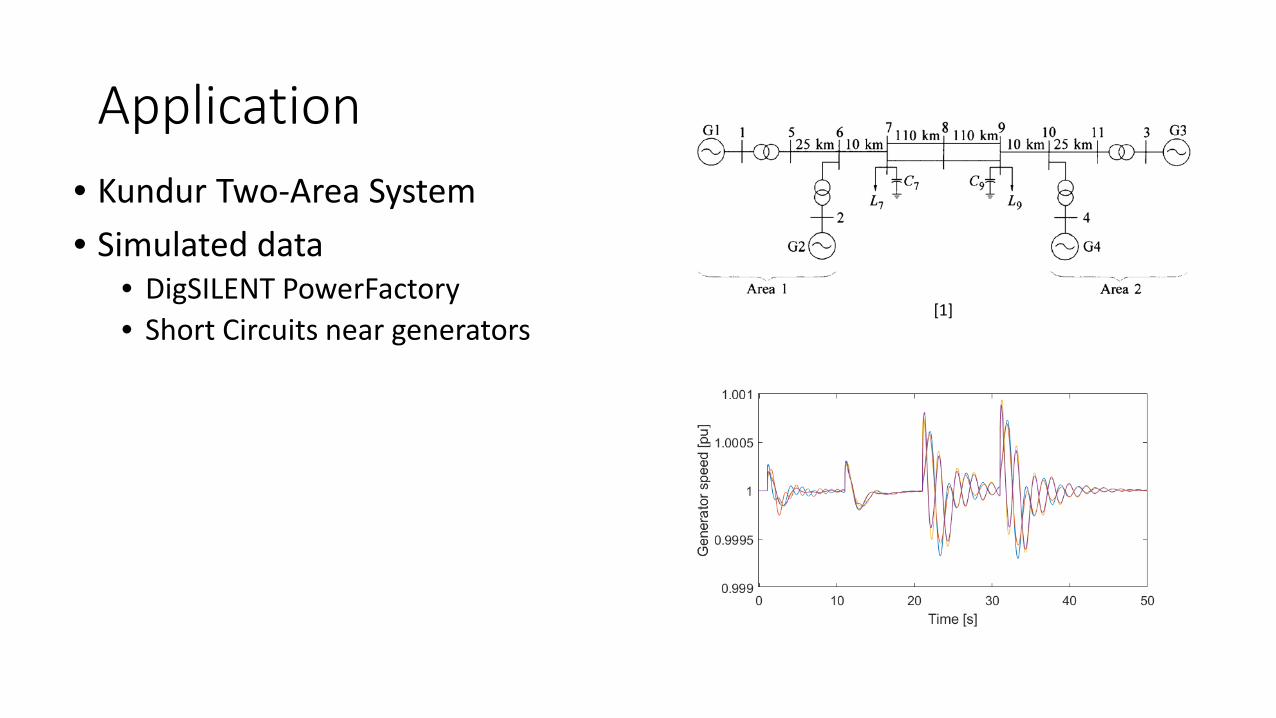
Application• Kundur Two-Area System• Simulated data
• DigSILENT PowerFactory• Short Circuits near generators
[1]

Application
𝑝𝑝1 𝑝𝑝2 𝑝𝑝3
Kundur Two-Area System – Part 1• Moving window• Point estimates

ApplicationKundur Two-Area System – Part 2• Observations• Clustering
ApplicationKundur Two-Area System – Part 2• Resulting
average mode shapes
• DigSILENTPowerFactoryModal Analysis

Concluding remarks• Appears to give reasonable results
• Possible to differentiate modes of similar frequency
• Potential improvement• Including damping• Clustering
• Remove noise• Frequency estimation• Rotation of mode shapes
• Further thoughts• Clustering on «long term» moving window• Use parallel windows of different lengths• Track modes• Adaptive controllers
• Further testing• Simulations with amibent noise• Real PMU data

References[1] P. Kundur, Power System Stability and Control. New York: McGraw-Hill, 1994.
[2] T. Hastie, R. Tibshirani, and J. Friedman, The Elements of Statistical Learning. New York, NY: Springer New York, 2009.
[3] J. D. Horel, “Complex Principal Component Analysis: Theory and Examples,” Journal of Climate and Applied Meteorology, vol. 23, no. 12. pp. 1660–1673, 1984.
[4] Yu's Machine Learning Garden, retrieved from http://yulearning.blogspot.com/2014/11/einsteins-most-famous-equation-is-emc2.html (2018)


