mr. hallvar haugdal, finished his msc. in electrical
TRANSCRIPT

Mr. Hallvar Haugdal, finished his MSc. in Electrical Engineering at NTNU, Norway in 2016, specializing innumerical field calculations and electrical motor design. After his MSc he worked a Scientific Assistant also atNTNU, dealing with courses on electrical machines, power systems and field calculations. Since January 2018he is a PhD student on Wide Area Monitoring- and Control Systems.
“Online Mode Shape Estimation using Complex Principal Component Analysis and Clustering”, Hallvar Haugdal(NTMU Norway)

Online Mode Shape Estimationusing Complex Principal
Component Analysis and Clustering
Hallvar Haugdal

Contents
• Motivation• Background theory
• (C)PCA• Clustering
• Proposed method• Application to Kundur Two Area-system

Contents
• Motivation• Background theory
• (C)PCA• Clustering
• Proposed method• Application to Kundur Two Area-system

Motivation
• Modal analysis• Powerful tool• Understanding of system dynamics• Stability limits• Design of controllers• Difficult due to inaccurate modelling• Load dependent
• Propose empirical approach• Relying only on Wide Area PMU measurements• Correlation• Statistical learning

Two-part methodPart 1: Provide estimates of modes and mode shapes
• Moving window ~ 5 − 10 s length• Using correlation, Complex Principal Component Analysis (CPCA)• Provide point estimates of modes shapes
Part 2: Compute averaged mode shapes• Differentiate between noise and modes• Clustering points resulting from Part 1• Averaged modes and -shapes computed as centroids of clusters

Contents
• Motivation• Background theory
• (C)PCA• Clustering
• Proposed method• Application to Kundur Two Area-system

Principal Component Analysis• Matrix of 𝑀𝑀 series, 𝑁𝑁 samples:
𝐗𝐗 =
𝐱𝐱𝟏𝟏𝐱𝐱𝟐𝟐⋮𝐱𝐱𝑴𝑴
=
𝑥𝑥1(𝑡𝑡1) 𝑥𝑥1 𝑡𝑡2𝑥𝑥2 𝑡𝑡1 𝑥𝑥2 𝑡𝑡2
⋯ 𝑥𝑥1 𝑡𝑡𝑁𝑁𝑥𝑥2 𝑡𝑡𝑁𝑁
⋮𝑥𝑥𝑀𝑀 𝑡𝑡1 𝑥𝑥3 𝑡𝑡2
⋱𝑥𝑥𝑀𝑀 𝑡𝑡𝑁𝑁
• Want to transform the correlated series 𝐱𝐱𝟏𝟏, 𝐱𝐱𝟐𝟐 ⋯𝐱𝐱𝑴𝑴 into uncorrelatedseries 𝐬𝐬𝟏𝟏, 𝐬𝐬𝟐𝟐 ⋯ 𝐬𝐬𝑴𝑴:
𝐒𝐒 =
𝐬𝐬𝟏𝟏𝐬𝐬𝟐𝟐⋮𝐬𝐬𝑴𝑴
= 𝐔𝐔𝑻𝑻𝐗𝐗, 𝒔𝒔𝒊𝒊 = 𝐮𝐮𝒊𝒊𝑻𝑻𝑿𝑿
• Do this by eigendecomposition of the covariance matrix:
𝐂𝐂 =1
1 − 𝑁𝑁𝐗𝐗𝐗𝐗𝐓𝐓
• Eigenvalues (λ𝑖𝑖) and -vectors (𝐮𝐮𝒊𝒊):
𝐂𝐂𝐮𝐮𝒊𝒊 = λ𝑖𝑖𝐮𝐮𝒊𝒊, 𝑖𝑖 = 1 …𝑀𝑀𝐔𝐔 = 𝐮𝐮𝟏𝟏,𝐮𝐮𝟐𝟐 ⋯𝐮𝐮𝑴𝑴
⇒ 𝐔𝐔′𝐂𝐂𝐔𝐔 = 𝚲𝚲 =
𝜆𝜆1𝜆𝜆2
⋱𝜆𝜆𝑀𝑀
𝜆𝜆1> 𝜆𝜆2 > 𝜆𝜆3 … 𝜆𝜆𝑀𝑀
• Inversion gives time series from scores
𝐗𝐗 = 𝐔𝐔𝐒𝐒
𝐱𝐱𝒊𝒊 = �𝒋𝒋=𝟏𝟏
𝑴𝑴
𝑢𝑢𝑖𝑖,𝑗𝑗𝐬𝐬𝒋𝒋
• Contribution of 𝐬𝐬𝒋𝒋 in 𝐱𝐱𝒊𝒊 given by coefficient 𝑢𝑢𝑖𝑖,𝑗𝑗

Complex Principal Component Analysis• Similar to conventional PCA• Additional steps:
• Empirical Mode Decomposition (EMD)• Detrending• (Decomposition ⇒ Intrinsic Mode Functions)
• Hilbert Transform⇒ Complex time series 𝐳𝐳𝒊𝒊• Complex covariance matrix:
𝐂𝐂 =1
𝑁𝑁 − 1𝐙𝐙∗𝐙𝐙
• Contribution of 𝐬𝐬𝒋𝒋 in 𝐳𝐳𝒊𝒊 given by complexcoefficient 𝑢𝑢𝑖𝑖,𝑗𝑗
• Resembles observability mode shapes• Slower than PCA
• Due to EMD and Hilbert Transform• Works well with damped exponentials• Noisy during steps [3]

Clustering
[2][4]
• Various methods• K-means• Gaussian Mixture Models

Contents
• Motivation• Background theory
• (C)PCA• Clustering
• Proposed method• Application to Kundur Two Area-system

Proposed method, Part 1: Generating mode estimates
• Input: Starting out with time window1. PCA 𝐗𝐗 ⇒ 𝐒𝐒 (Scores)2. EMD Detrending3. Hilbert Transform4. CPCA 𝐒𝐒 ⇒ 𝐙𝐙 (Complex scores)
• Complex PC Scores resemble modes (𝑓𝑓, 𝜉𝜉)• Complex Coefficients resemble mode shapes
• Output: Point in 2𝑀𝑀 + 1 dimensions𝑝𝑝 = 𝑓𝑓, Re 𝐶𝐶1 , Im 𝐶𝐶1 , Re 𝐶𝐶2 , Im 𝐶𝐶2 … Re 𝐶𝐶𝑀𝑀 , Im 𝐶𝐶𝑀𝑀

Proposed method, Part 2: Averaged mode estimates using Clustering• Resulting points from Part 1 are assumed to populate input space more
densely close to areas corresponding to modes• Input: Matrix of 𝑄𝑄 point estimates
𝑃𝑃 =
𝑝𝑝1𝑝𝑝2⋮𝑝𝑝𝑄𝑄
=
𝑓𝑓, Re 𝐶𝐶1 , Im 𝐶𝐶1 … Re 𝐶𝐶𝑀𝑀 , Im 𝐶𝐶𝑀𝑀𝑓𝑓, Re 𝐶𝐶1 , Im 𝐶𝐶1 … Re 𝐶𝐶𝑀𝑀 , Im 𝐶𝐶𝑀𝑀
⋮𝑓𝑓, Re 𝐶𝐶1 , Im 𝐶𝐶1 … Re 𝐶𝐶𝑀𝑀 , Im 𝐶𝐶𝑀𝑀
• Clustering of points (number of clusters unknown)• Output: Averaged mode shapes
• Centroids of clusters

Contents
• Motivation• Background theory
• (C)PCA• Clustering
• Proposed method• Application to Kundur Two Area-system
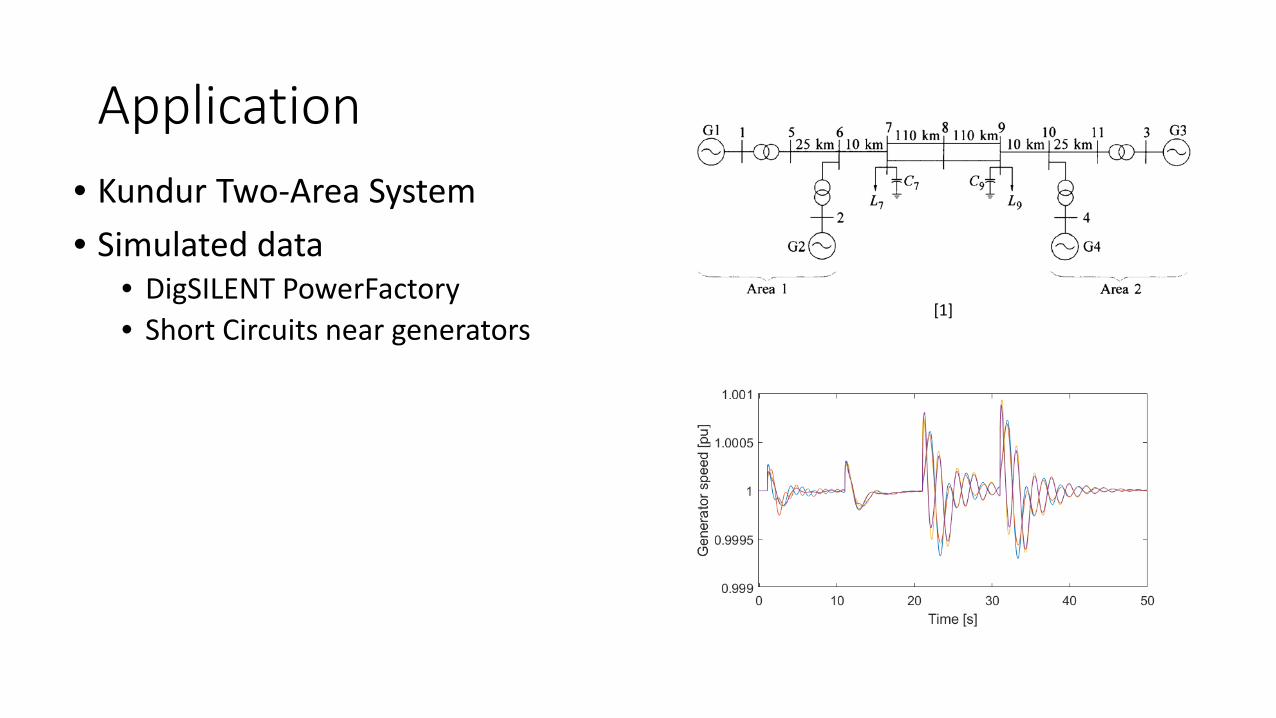
Application• Kundur Two-Area System• Simulated data
• DigSILENT PowerFactory• Short Circuits near generators
[1]

Application
𝑝𝑝1 𝑝𝑝2 𝑝𝑝3
Kundur Two-Area System – Part 1• Moving window• Point estimates

ApplicationKundur Two-Area System – Part 2• Observations• Clustering
ApplicationKundur Two-Area System – Part 2• Resulting
average mode shapes
• DigSILENTPowerFactoryModal Analysis

Concluding remarks• Appears to give reasonable results
• Possible to differentiate modes of similar frequency
• Potential improvement• Including damping• Clustering
• Remove noise• Frequency estimation• Rotation of mode shapes
• Further thoughts• Clustering on «long term» moving window• Use parallel windows of different lengths• Track modes• Adaptive controllers
• Further testing• Simulations with amibent noise• Real PMU data

References[1] P. Kundur, Power System Stability and Control. New York: McGraw-Hill, 1994.
[2] T. Hastie, R. Tibshirani, and J. Friedman, The Elements of Statistical Learning. New York, NY: Springer New York, 2009.
[3] J. D. Horel, “Complex Principal Component Analysis: Theory and Examples,” Journal of Climate and Applied Meteorology, vol. 23, no. 12. pp. 1660–1673, 1984.
[4] Yu's Machine Learning Garden, retrieved from http://yulearning.blogspot.com/2014/11/einsteins-most-famous-equation-is-emc2.html (2018)