Download - Observing Handbook No. 1
2004Part1.qxp 5/25/06 2:18 PM Page Cov-A
NAT
IONAL WE A T HER SERVICE
U.S. DEPARTME N T OF COMM
ERCE
NAT
IO N
AL
OCE
ANICAND A T M O SPHERIC ADM
INISTR
A TIO
N
Observing Handbook No. 1
Marine Surface Weather Observations
2004Part1.qxp 5/25/06 2:18 PM Page Cov-B
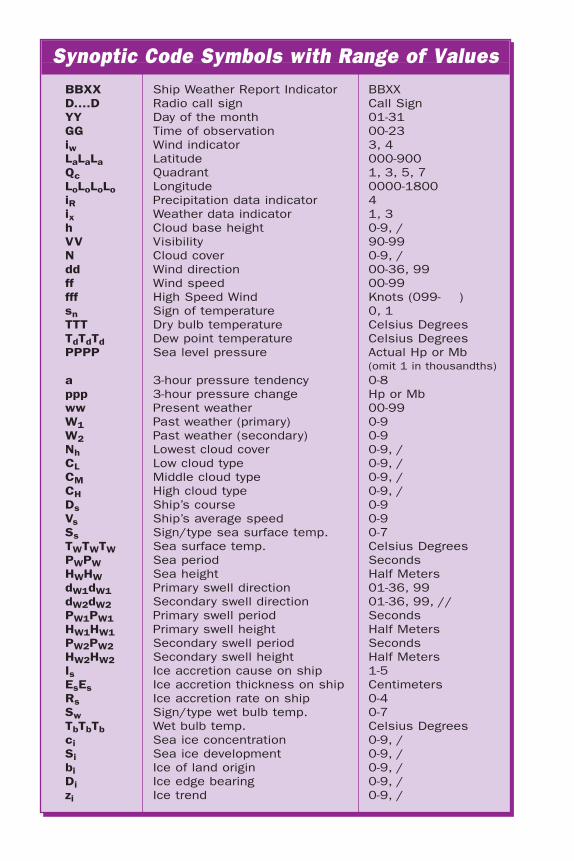
Synoptic Code Symbols with Range of Values BBXX r Report Indicator BBXX
Radio call sign Call Sign YY nth 01-31 GG Time of observation 00-23 iw Wind indicator LaLaLa Latitude 000-900 Qc Quadrant LoLoLoLo Longitude 0000-1800 iR Precipitation data indicator 4 ix r data indicator h Cloud base height VV 90-99 N r dd Wind direction ff Wind speed 00-99 fff High Speed Wind Knots (099- ) sn Sign of temperature TTT Dry bulb temperature Celsius Degrees TdTdTd nt temperature Celsius Degrees PPPP ressure Actual Hp or Mb
(omit 1 in thousandths) a 3-hour pressure tendency 0-8 ppp 3-hour pressure change Hp or Mb ww Presen r 00-99 W1 r (primary) 0-9 W2 r (secondary) 0-9 Nh r CL Low cloud type CM Middle cloud type CH High cloud type Ds rse 0-9 Vs rage speed 0-9 Ss Sign/type sea surface temp. 0-7 TWTWTW Sea surface temp. Celsius Degrees PWPW Sea period Seconds HWHW Sea height Half Meters dW1dW1 Primar rection dW2dW2 Secondar rection PW1PW1 Primar riod Seconds HW1HW1 Primar Half Meters PW2PW2 Secondar riod Seconds HW2HW2 Secondar Half Meters Is Ice accretion cause on ship 1-5 EsEs Ice accretion thickness on ship ntimeters Rs Ice accretio ate on ship 0-4 Sw Sign 0-7 TbTbTb Celsius Degrees ci Sea ice concentration Si nt bi Ice of land origin Di Ice edge bearing zi Ice trend
Ship WeatheD....D
Day of the mo
3, 4
1, 3, 5, 7
Weathe 1, 3 0-9, /
Visibility Cloud cove 0-9, /
00-36, 99
0, 1
Dew poiSea level p
t weathePast weathePast weatheLowest cloud cove 0-9, /
0-9, / 0-9, / 0-9, /
Ship’s couShip’s ave
y swell di 01-36, 99 y swell di 01-36, 99, //
y swell pey swell height
y swell pey swell height
Cen r
/type wet bulb temp. Wet bulb temp.
0-9, / Sea ice developme 0-9, /
0-9, / 0-9, / 0-9, /

2004Part1.qxp 5/25/06 2:18 PM Page i
U.S. DEPARTM E N T OF COMM
ERCE
NAT
IO N
AL
OCE
ANICAND AT M O SPHERIC ADM
INISTR
A TIO
N
National Weather ServiceObserving Handbook No. 1
Marine Surface Weather Observations
July 2004
U.S. DEPARTMENT OF COMMERCE National Oceanic and Atmospheric Administration National Weather Service National Data Buoy Center Voluntary Observing Ship (VOS) Program Building 1100 Stennis Space Center, MS 39529-6000
2004Part1.qxp 5/25/06 2:18 PM Page iii
Preface
In writing this new edition of NWS Observing Handbook No. 1, it has been our intent to include as much useful information as possible in the available space. The compact size and design, and “field guide” format, should allow for easy handling and quick reference. We hope this simplifies your work as weather observers, and makes it easier to locate the information you need.
Weather has an almost magical hold on the mariner. Every change in the weather at sea is noted with a sense of trepidation. Reporting weather not only contributes to your safety, but adds to your basic knowledge of seamanship. It is part of keeping a good lookout.
For every 100 observations on land, there is only about 1 observation at sea. Without your participation in the Voluntary Observing Ship (VOS) program, there would be vast marine areas without data, making weather forecasting nearly impossible for these areas. The importance of ship reports cannot be overstated. We thank ships officers for their fine work, dedication, and committment.
Please follow the weather reporting schedule for ships as best you can (0000, 0600, 1200, 1800 UTC from all areas; every 3-hours from the Great Lakes, from within 200 miles of the United States and Canadian coastlines, and from within 300 miles of named tropical storms or hurricanes). For assistance, contact a Port Meteorological Officer (PMO), who will come aboard your vessel and provide all the information you need to observe, code, and transmit weather (see page 1-3 through 1-6).
NWSOH No. 1 iii July 2004

2004Part1.qxp 5/25/06 2:18 PM Page v
Table of Contents
Prefaceiii Introductionvii
2-1 1-1 Chapter 1: Program Description
Chapter 2: Ship’s Synoptic Code and
4-1 3-1
Observing Methods
Chapter 3: Transmitting the Observation
Chapter 4: The Weatherwise Mariner
5-1 Glossary
B-1 A-1 Appendix A: Observing Forms and Supplies
Appendix B: Conversion Factors and Equivalents
C-1 Appendix C: Interpretation of Weather Map Symbols
D-1 Appendix D: Marine Warning and Forecast Areas
NWSOH No. 1 v July 2004
2004Part1.qxp 5/25/06 2:18 PM Page vii
Introduction
For beginners and established observers alike, this new edition of the National Weather Service Observing Handbook No. 1 (NWSOH1) explains how to observe, how to code, and how to transmit weather observations from moving ships at sea.
IMPORTANCE OF OBSERVATIONS FROM SHIPS
Accomplishments in the atmospheric sciences have their roots in observations. They are a critical first step in the end-to-end forecast process. This process consists of the taking and coding of observations, the transmission and receipt of data, the processing and analysis of data (including numerical and computer modeling), followed by the preparation and issuance of forecasts and warnings.
More specifically, observations are used by meteorologists to evaluate your local weather conditions, and to locate and determine the strength of weather systems such as fronts, air masses, high and low pressure systems, tropical storms, and hurricanes. Your observations are especially important in the preparation of the surface weather chart. Isobars (lines of equal barometric pressure), which are crucial for defining and delineating all weather systems, could not be drawn over marine areas without ship reports.
Ships observations are not only important for weather forecasts at sea, but also for forecasts over land areas, because marine weather systems often move inland. Notable examples include (1) North Pacific Ocean weather systems, which frequently move eastward to effect the weather over much of North America, especially during the winter season, (2) tropical storms and hurricanes, which develop over the oceans, and can cause great devastation over highly populated coastal areas, (3) weather systems over the North Atlantic Ocean, which have a great impact on the weather of Europe.
Accurate marine data is also used to prepare long range forecasts of climate, temperature, and precipitation, in the monitoring of climatic change, ocean currents, and eddies, and to study the interaction of air and sea. This is important for agriculture, industrial planning, ship routing, fishing, and many other activities. Pilot charts and climatological atlases of the oceans are largely based on observations from ships. Your weather observations will also help you interpret the forecast and changes in weather that occur at your position or along your route.
ELEMENTS TO BE OBSERVED
Ships taking meteorological observations should be familiar with the methods for observing or measuring the following elements:
(1) Cloud height, amount, and type; (2) Visibility;
NWSOH No. 1 vii July 2004
2004Part1.qxp 5/25/06 2:18 PM Page viii
Introduction
(3) Wind speed and direction; (4) Air and wet-bulb temperatures, and dew point;(5) Atmospheric pressure, tendency and its characteristic;(6) Weather - present and past; (7) Course and speed of ship;(8) Sea surface temperature; (9) Sea waves and swell - period, direction, and height;(10) Ice conditions, including icing on board ship;
EQUIPMENT REQUIRED
Suitable instruments for use on ships are the following:
(1) Precision aneroid barometer or marine mercury barometer; (2) Dry and wet-bulb psychrometer (sling, or housed in an outdoor shelter); (3) Barograph;(4) Sea temperature thermometer, either a continuously immersed sensor
(intake or hull mounted) or sea water bucket;
An anemometer to measure wind force may be used as an alternative to visual wind estimates using the beaufort scale.
OBSERVING ORDER
In general, instrumental observations requiring the use of a light should be made after non-instrumental ones, so that eye function in the dark is not impaired. Efforts should be made to observe elements other than pressure within the ten minutes preceeding the reporting hour. Ideally, atmospheric pressure should be read at exactly the standard time.
HISTORICAL NOTE
Since the invention of meteorological instruments did not begin until the seventeenth century, instrumental records of the weather elements cover little more than 200 years anywhere, while for many parts of the world, the period of observation is a good deal less than 100 years. The best records are available from well-populated land areas.
Notable inventions include the air thermometer (Galileo, 1592), alcohol and mercury thermometer (Fahrenheit, 1714), the mercury barometer (Torricelli, 1643), the aneroid barometer (Vidie, 1843), and the anemometer (Hooke, 1667).
During the eighteenth and nineteenth centuries, mariners began keeping weather and oceanographic records and logs. Knowledge of prevailing winds and ocean currents came about as a result of these records. The Voluntary Observing Ship (VOS) Program as we know it today is rooted in the work of Mathew Fontaine Maury, head of the U.S. Navy Hydrographic Office, who organized a meeting in Brussels in 1853, attended by delegates of ten major maritime nations. The purpose of the meeting was to discusss the establishment
NWSOH No. 1 viii July 2004
2004Part1.qxp 5/25/06 2:18 PM Page ix
Introduction
of a uniform system for the collection of marine meteorology and oceanography data, and the use of these data for the benefit of shipping in return.
In the present century, the VOS program was recognized in 1948 in the International Convention For The Safety Of Life At Sea (SOLAS):
The contracting governments undertake to encourage the collection of meteorological data by ships at sea and to arrange for their examination, dissemination and exchange in the manner most suitable for the purpose of aiding navigation. Administrations shall encourage the use of instruments of a high degree of accuracy, and shall facilitate the checking of such instruments upon request.
HAVE YOUR INSTRUMENTS CALIBRATED AND REPORT ACCURATE DATA
Always ensure that your equipment is accurate and properly calibrated. A Port Meteorological Officer (PMO) should calibrate your barometer and barograph once every 3 months, and also check your psychrometer during every ship visit. Sea-water thermometers (whether hull-mounted or located in the condenser intake) should be calibrated annually, and checked every time your vessel is in the yard for service. If your vessel has an anemometer, it should be calibrated once every 6 months (U.S. PMOs do not perform this service). Make sure the anemometer is located where the ships superstructure will not interfere with the air motion.
When observing and recording data, always proceed in a very careful and meticulous manner. An inaccurate observation can mislead the forecaster and result in an incorrect forecast. On the other hand, a reliable observation can hold the key to an obscure or complex meteorological condition. When recording dry and wet bulb temperatures, always take your psychrometer to the windward side of the ship. This allows contact with air fresh from the sea which has not passed over the deck prior to your measurement.
Accuracy is not only important for forecasting — it is also very important for climatological purposes and for investigators who may use your observations at a later time. A few inaccurate observations can bias results and cause erroneous conclusions. A researcher has little to go by when deciding about the accuracy of a particular observation, and must depend on the competence of the observer aboard ship.
TRANSMIT REPORTS WITHOUT DELAY (REAL-TIME)
Always transmit your observations without delay as soon as possible after you’ve observed the data. Ship reports are used to indicate current, up-to-date conditions at your vessel (so called real-time conditions). Make your observation as close to the reporting hour as you can. Any transmission problems or difficulties with radio stations should be reported back to your PMO, and written in the appropriate space on the back of WS Form B-81 (Ships Weather Observations), if used.
Report arrival times tend to be later at night and for Southern Hemisphere reports. Timely submission of these reports is most important.
NWSOH No. 1 ix July 2004
2004Part1.qxp 5/25/06 2:18 PM Page x
Introduction
Data is most readily available from the main shipping routes in both hemispheres. There is a chronic shortage of data from coastal waters out 200 miles (for this reason, 3-hourly reports are requested from U.S. and Canadian waters out 200 miles from shore). There is also a widespread shortage of data from the Southern Hemisphere and from the arctic ocean. More data is also needed from the tropics and easterly trade wind belt (5-35˚ N), especially during the N. Hemisphere hurricane season (May - November). From the North Atlantic and North Pacific oceans, more data is needed at 0600 and 1200 UTC (these are late night and early morning times). If you are operating from a data-sparse area, please report weather regularly.
NWSOH No. 1 x July 2004
2004Part1.qxp 5/25/06 2:18 PM Page 1-1
Chapter 1 — Program Description
THE VOLUNTARY OBSERVING SHIP PROGRAM
The Voluntary Observing Ship (VOS) program is organized for the purpose of obtaining weather and oceanographic observations from moving ships. An international program under World Meteorological Organization (WMO) auspices, the VOS has over 7300 vessels participating from 60 nations. It is part of the WMO Global Observing System of the World Weather Watch.
The United States National Weather Service (NWS) VOS program is the largest in the world with over 600 vessels participating. It closely follows WMO guidelines for VOS programs. The U.S. program is supported by 12 full-time Port Meteorological Officers ((PMOs) in New York, Baltimore, Norfolk, Jacksonville, Port Everglades, New Orleans, Houston, Los Angeles, Oakland, Seattle, Charleston and Chicago), and 4 part-time PMOs (in Honolulu, Anchorage, Kodiak, and Valdez). The national program office at Stennis Space Center, MS manages the program and oversees PMO activities. Observing forms, handbooks, supplies, and operating instructions are prepared at the program office. The national office also maintains a VOS Program Computerized Data Management System to record PMO ship visits, vessel mailing addresses, vessel equipment inventories, and information about vessel reports. All U.S. PMOs have direct access to this database.
Both U.S. and foreign flag vessels participate in the U.S. VOS program. Any vessel willing to take and transmit observations in marine areas where the NWS prepares weather forecasts (see appendix D) can join the program.
The WMO establishes the ships synoptic code, and procedures and standards for the collection and dissemination of observations worldwide. The WMO also maintains information about countries and vessels participating in the program (available in WMO Publication No. 47, International List Of Selected, Supplementary, And Auxiliary Ships).
WMO SHIPS’ SYNOPTIC CODE, FM 13-X
Coded messages are used for the international exchange of meteorological information. This is because code makes it practical to understand and process data, manually or by computer, for real-time use or later compilation into climatological records. The code also allows data to be transferred internationally at high speed, on special data circuits known as the Global Telecommunications System (GTS).
The WMO code form Code FM 13-X is the ships’ synoptic code, used by weather reporting ships. The code form is composed of a set of symbolic letters (actually groups of letters) representing meteorological elements. Examples of
NWSOH No. 1 1-1 July 2004
2004Part1.qxp 5/25/06 2:18 PM Page 1-2
Program Description
symbolic letter groups include Nddff snTTT etc. To report weather, the symbolic letters are transcribed into figures indicating the value or state of the elements described. Code tables are often used to specify the appropriate values of the different symbolic letters. See Chapter 2.
Universal code has been called the twentieth century’s greatest improvement in the collection of meteorological data. Prior to code standardization, lack of consistency and difficulty deciphering observations posed enormous problems for the meteorologist.
Code forms and specifications are determined by international agreement at WMO committee meetings, usually held in Geneva. Codes are changed occasionally to meet operational needs — the last major change was in January 1982. Some minor changes were made in November, 1994.
STANDARD WEATHER REPORTING SCHEDULE FOR SHIPS
The worldwide weather reporting schedule for Voluntary Observing Ships is 4 times daily — at 0000, 0600, 1200, and 1800 UTC. These are the “main synoptic” times, when weather forecasts are prepared and, therefore, when data is needed most. Two of these times, 0000 and 1200 UTC, are most important — when the numerical weather prediction models are initialized with data and also when soundings are released from upper air stations all over the world. Reporting weather once every 3 hours when within 300 miles of a named tropical storm or hurricane is also standard practice worldwide. Storm (wind speed 48 knots or higher) or special reports for conditions not forecast, much worse than forecast, or for sudden weather changes) should be sent whenever conditions warrant.
3-HOURLY WEATHER REPORTING SCHEDULE
Vessels operating on the Great Lakes, and within 200 miles of the U.S. or Canadian coastlines (including the coasts of Alaska, Hawaii, and Gulf coast states), are asked to transmit their observations once every three hours — at 0000, 0300, 0600, 0900, 1200, 1500, 1800, and 2100 UTC. This special schedule is maintained because of a data shortage from near-shore areas. All weather reports are voluntary — try to follow the recommended reporting schedule as best you can. Always give top priority to reports at the main synoptic hours (6hour intervals). When shipboard routine permits, follow the 3-hour schedule from coastal waters.
PORT METEOROLOGICAL OFFICERS (PMOs)
Port Meteorological Officers (PMOs) spend most of their time visiting ships in support of the VOS program. This is to encourage vessels to report weather; to instruct observers about procedures and the use of code; to provide observing supplies, handbooks, and instructions; to calibrate equipment; and, in some cases, to install, on loan, meteorological instrumentation. A top priority of the PMO is recruiting new vessels into the VOS program. When the PMO comes
NWSOH No. 1 1-2 July 2004

2004Part1.qxp 5/25/06 2:18 PM Page 1-3
Program Description
aboard your vessel, remember to ask questions about observing, coding, and reporting weather. If you’re in the VOS program, keep the PMO informed about changes to your mailing address. Discuss weather forecasts, warnings, and facsimile products with the PMO — especially any specific problems you’ve had. The PMO will contact the appropriate party for investigation and corrective action. If you have any suggestions to improve the VOS program, make them known to the PMO.
NWS PORT METEOROLOGICAL OFFICES
More information about the Voluntary Observing Ship Program and Port Meteorological Officers is available on the Worldwide Web at http://www.vos.noaa.gov.
NWSOH No. 1 1-3 July 2004
2004Part1.qxp 5/25/06 2:18 PM Page 1-4
Program Description
NAMES AND LOCATIONS OF UNITED STATES PMOS
HEADQUARTERS Jim Luciani, PMO National Weather Service, NOAA
Robert A. Luke 110 Main Street, Suite 201 Voluntary Observing Ship Program Leader South Amboy, NJ 08879-1367 National Data Buoy Center Tel: 732-316-5409 Building Bldg. 3203, Room 305B Fax: 732-316-7643 Stennis Space Center, MS 39529-6000 E-mail: [email protected] Tel: 228-688-1457 Fax: 228-688-3923 James Saunders, PMO E-mail: [email protected] National Weather Service, NOAA
Maritime Center I, Suite 287 ATLANTIC PORTS 2200 Broening Highway
Baltimore, MD 21224-6623 Peggy Alander, PMO Tel: 410-633-4709 National Weather Service, NOAA Fax: 410-633-4713 2550 Eisenhower Blvd, Suite 312 E-mail: [email protected] P.O. Box 165504 Port Everglades, FL 33316 GREAT LAKES PORTS Tel: 954-463-4271 Fax: 954-462-8963 Amy Seeley, PMO E-mail: [email protected] National Weather Service, NOAA
333 West University Dr. John Warrelmann, PMO Romeoville, IL 60446-1804 National Weather Service, NOAA Tel: 815-834-0600 Ext. 269 13701 Fang Road Fax: 815-834-0645 Jacksonville, FL 32218-7933 E-mail: [email protected] Tel: 904-741-5186 Ext. 117 Fax: 904-741-0078 GULF OF MEXICO PORTS E-mail: [email protected]
Paula Campbell, PMO Tim Kenefick, PMO National Weather Service, NOAA NOAA Coastal Services Center Louis Armstrong International Airport 2234 South Hobson Avenue Box 20026 Charleston, SC 29405-2413 New Orleans, LA 70141 Tel: 843-740-1281 Tel: 504-589-4839 Fax: 843-740-1289 E-mail: [email protected] E-mail: [email protected]
Chris Fakes, PMO Peter Gibino, PMO, National Weather Service, NOAA National Weather Service, NOAA Houston Area Weather Office 4034-B Geo. Wash. Mem. Hwy. 1620 Gill Road Yorktown, VA 23692-2724 Dickinson, TX 77539-3409 Tel: 757-877-1692 Tel: 281-534-2640 Ext. 277 Fax: 757-877-9561 Fax: 281-337-3798 E-mail: [email protected] E-mail: [email protected]
NWSOH No. 1 1-4 July 2004

2004Part1.qxp 5/25/06 2:18 PM Page 1-5
Program Description
PACIFIC PORTS
Robert Webster, PMO National Weather Service, NOAA 501 West Ocean Blvd., Room 4480 Long Beach, CA 90802-4213 Tel: 562-980-4090 Fax: 562-980-4089 E-mail: [email protected]
Robert Novak, PMO National Weather Service, NOAA 1301 Clay Street, Suite 1190N Oakland, CA 94612-5217 Tel: 510-637-2960 Fax: 510-637-2961 E-mail: [email protected]
Patrick Brandow, PMO National Weather Service, NOAA 7600 Sand Point Way, N.E. BIN C15700 Seattle, WA 98115-6349 Tel: 206-526-6100 Fax: 206-526-4571 or 6094 E-mail: [email protected]
Richard Courtney National Weather Service, NOAA 600 Sandy Hook Street, Suite 1 Kodiak, AK 99615-6814 Tel: 907-487-2102 Fax: 907-487-9730 E-mail: [email protected]
Debra Russell, OIC National Weather Service, NOAA Box 427 Valdez, AK 99686-0427 Tel: 907-835-4505 Fax: 907-835-4598 E-mail: [email protected]
Larry Hubble National Weather Service Alaska Region 222 West 7th Avenue #23 Anchorage, AK 99513-7575 Tel: 907-271-5135 Fax: 907-271-3711 E-mail: [email protected]
Derek LeeLoy Ocean Services Program Coordinator National Weather Service Pacific Region HQ Grosvenor Center, Mauka Tower 737 Bishop Street, Suite 2200 Honolulu, HI 96813-3201 Tel: 808-532-6439 Fax: 808-532-5569 E-mail: [email protected]
UNITED KINGDOM HEADQUARTERS
Marine Superintendent, BD (OM) Meteorological Office, Met O (OM) Scott Building, Eastern Road Bracknell, Berks RG12 2PW Tel: +44-1344 855654 Fax: +44-1344 855921 Telex: 849801 WEABKA G
AUSTRALIA HEADQUARTERS
A.D. (Tony) Baxter, Headquarters Bureau of Meteorology Regional Office for Victoria, 26 floor 150 Lonsdale Street Melbourne, Vic 30001 Tel: +61396694651 FAX: +61396694168
NWSOH No. 1 1-5 July 2004

2004Part1.qxp 5/25/06 2:18 PM Page 1-6
Program Description
EQUIPMENT LOAN
For dedicated vessels, the NWS may supply barometers, barographs, or psychrometers as a loan for use in taking weather observations. The equipment is expensive and hard to replace. A loan agreement form between the PMO and the ship will have to be filled out. If you have such equipment, and are no longer participating in the VOS program, please contact a Port Meteorological Officer. An equipment pick-up, drop-off, or delivery will be scheduled. Equipment supplies are very limited. Please help ensure that equipment is accounted for and available for new VOS program recruits.
WHAT TO MAIL IN
All of your observations (completed on Ships Weather Observations WS Form B-81 or on SEAS archive disks), and, if you have a barograph, your barograms, should be mailed to your PMO when you reach port, using the postage paid envelopes. Make sure the month and year and your vessel’s call letters are clearly shown on each page of the B-81 or disk envelope. After reviewing the reports, the PMO sends them to the National Climatic Data Center (NCDC) in Asheville, NC., where they are archived and used in the compilation of climatological and historical records. These records are available to the general public.
NWSOH No. 1 1-6 July 2004
2004Part2A.qxp 5/25/06 2:16 PM Page 2-1
Chapter 2 — Ships Synoptic Code and Observing Methods
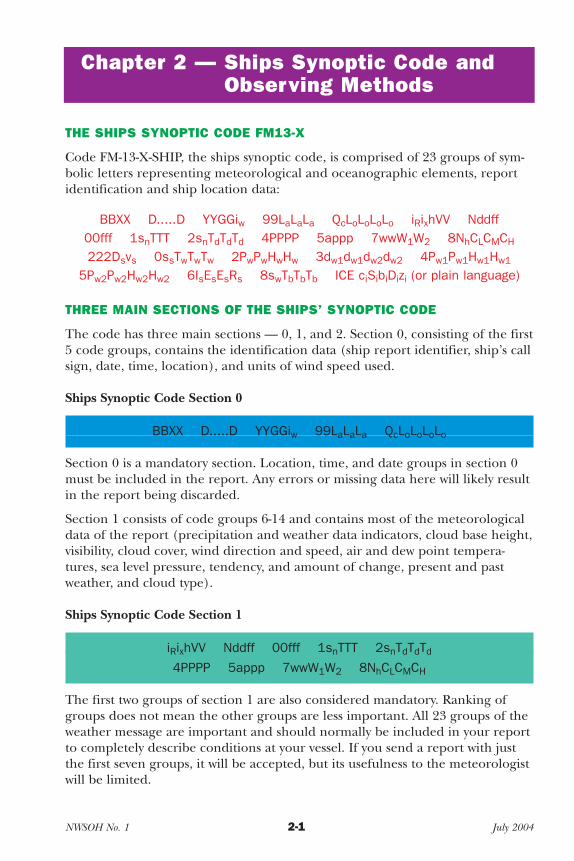
THE SHIPS SYNOPTIC CODE FM13-X
Code FM-13-X-SHIP, the ships synoptic code, is comprised of 23 groups of symbolic letters representing meteorological and oceanographic elements, report identification and ship location data:
BBXX D.....D YYGGiw 99LaLaLa QcLoLoLoLo iRixhVV Nddff 00fff 1snTTT 2snTdTdTd 4PPPP 5appp 7wwW1W2 8NhCLCMCH
222Dsvs 0ssTwTwTw 2PwPwHwHw 3dw1dw1dw2dw2 4Pw1Pw1Hw1Hw1
5Pw2Pw2Hw2Hw2 6IsEsEsRs 8swTbTbTb ICE ciSibiDizi (or plain language)
THREE MAIN SECTIONS OF THE SHIPS’ SYNOPTIC CODE
The code has three main sections — 0, 1, and 2. Section 0, consisting of the first 5 code groups, contains the identification data (ship report identifier, ship’s call sign, date, time, location), and units of wind speed used.
Ships Synoptic Code Section 0
BBXX D.....D YYGGiw 99LaLaLa QcLoLoLoLo
Section 0 is a mandatory section. Location, time, and date groups in section 0 must be included in the report. Any errors or missing data here will likely result in the report being discarded.
Section 1 consists of code groups 6-14 and contains most of the meteorological data of the report (precipitation and weather data indicators, cloud base height, visibility, cloud cover, wind direction and speed, air and dew point temperatures, sea level pressure, tendency, and amount of change, present and past weather, and cloud type).
Ships Synoptic Code Section 1
iRixhVV Nddff 00fff 1snTTT 2snTdTdTd
4PPPP 5appp 7wwW1W2 8NhCLCMCH
The first two groups of section 1 are also considered mandatory. Ranking of groups does not mean the other groups are less important. All 23 groups of the weather message are important and should normally be included in your report to completely describe conditions at your vessel. If you send a report with just the first seven groups, it will be accepted, but its usefulness to the meteorologist will be limited.
NWSOH No. 1 2-1 July 2004
2004Part2A.qxp 5/25/06 2:16 PM Page 2-2
Ships Synoptic Code and Observing Methods
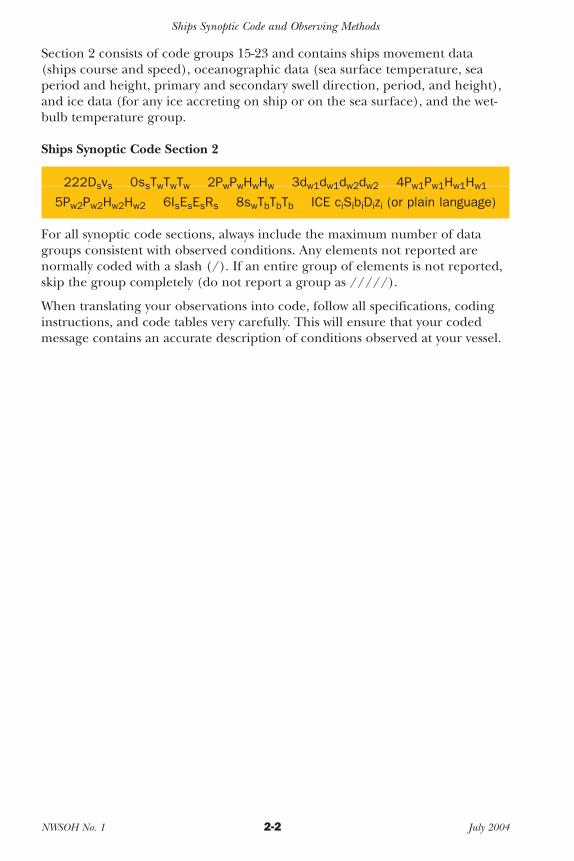
Section 2 consists of code groups 15-23 and contains ships movement data (ships course and speed), oceanographic data (sea surface temperature, sea period and height, primary and secondary swell direction, period, and height), and ice data (for any ice accreting on ship or on the sea surface), and the wet-bulb temperature group.
Ships Synoptic Code Section 2
222Dsvs 0ssTwTwTw 2PwPwHwHw 3dw1dw1dw2dw2 4Pw1Pw1Hw1Hw1
5Pw2Pw2Hw2Hw2 6IsEsEsRs 8swTbTbTb ICE ciSibiDizi (or plain language)
For all synoptic code sections, always include the maximum number of data groups consistent with observed conditions. Any elements not reported are normally coded with a slash (/). If an entire group of elements is not reported, skip the group completely (do not report a group as /////).
When translating your observations into code, follow all specifications, coding instructions, and code tables very carefully. This will ensure that your coded message contains an accurate description of conditions observed at your vessel.
NWSOH No. 1 2-2 July 2004
2004Part2A.qxp 5/25/06 2:16 PM Page 2-3
Ships Synoptic Code and Observing Methods
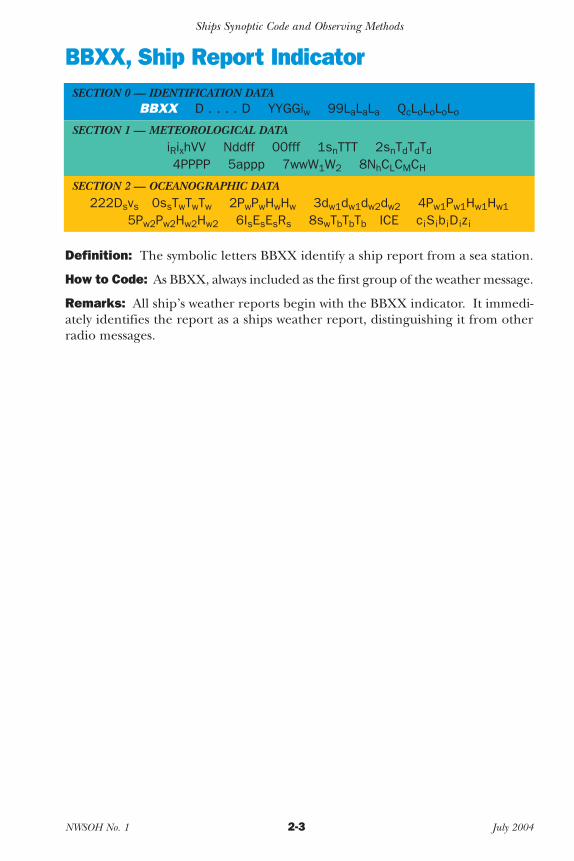
BBXX, Ship Report Indicator SECTION 0 — IDENTIFICATION DATA
BBXX D . . . . D YYGGiw 99LaLaLa QcLoLoLoLo
SECTION 1 — METEOROLOGICAL DATA iRixhVV Nddff 00fff 1snTTT 2snTdTdTd
4PPPP 5appp 7wwW1W2 8NhCLCMCH
SECTION 2 — OCEANOGRAPHIC DATA 222Dsvs 0ssTwTwTw 2PwPwHwHw 3dw1dw1dw2dw2 4Pw1Pw1Hw1Hw1
5Pw2Pw2Hw2Hw2 6IsEsEsRs 8swTbTbTb ICE ciSibiDizi
Definition: The symbolic letters BBXX identify a ship report from a sea station.
How to Code: As BBXX, always included as the first group of the weather message.
Remarks: All ship’s weather reports begin with the BBXX indicator. It immediately identifies the report as a ships weather report, distinguishing it from other radio messages.
NWSOH No. 1 2-3 July 2004
2004Part2A.qxp 5/25/06 2:16 PM Page 2-4
Ships Synoptic Code and Observing Methods
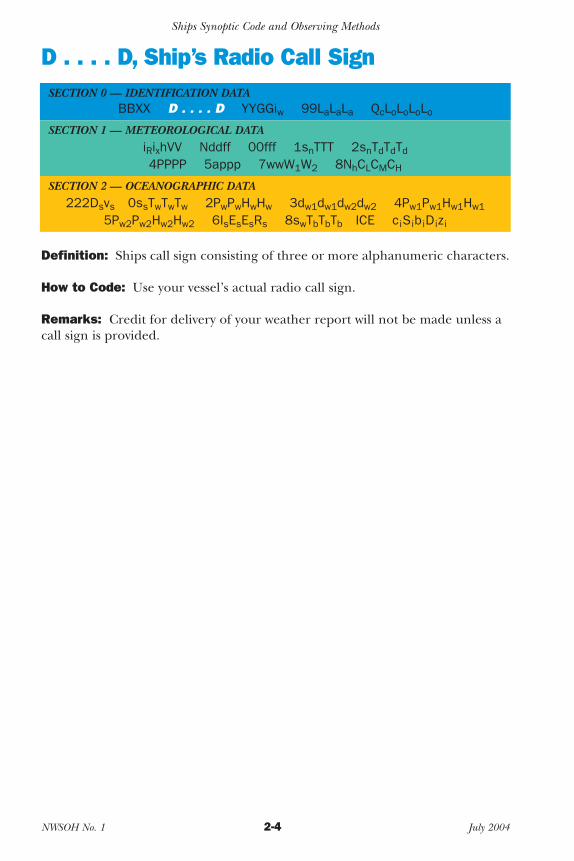
D . . . . D, Ship’s Radio Call Sign SECTION 0 — IDENTIFICATION DATA
BBXX D . . . . D YYGGiw 99LaLaLa QcLoLoLoLo
SECTION 1 — METEOROLOGICAL DATA iRixhVV Nddff 00fff 1snTTT 2snTdTdTd
4PPPP 5appp 7wwW1W2 8NhCLCMCH
SECTION 2 — OCEANOGRAPHIC DATA 222Dsvs 0ssTwTwTw 2PwPwHwHw 3dw1dw1dw2dw2 4Pw1Pw1Hw1Hw1
5Pw2Pw2Hw2Hw2 6IsEsEsRs 8swTbTbTb ICE ciSibiDizi
Definition: Ships call sign consisting of three or more alphanumeric characters.
How to Code: Use your vessel’s actual radio call sign.
Remarks: Credit for delivery of your weather report will not be made unless acall sign is provided.
NWSOH No. 1 2-4 July 2004

2004Part2A.qxp 5/25/06 2:16 PM Page 2-5
Ships Synoptic Code and Observing Methods
YY, Day of the Month SECTION 0 — IDENTIFICATION DATA
BBXX D . . . . D YYGGiw 99LaLaLa QcLoLoLoLo
SECTION 1 — METEOROLOGICAL DATA iRixhVV Nddff 00fff 1snTTT 2snTdTdTd
4PPPP 5appp 7wwW1W2 8NhCLCMCH
SECTION 2 — OCEANOGRAPHIC DATA 222Dsvs 0ssTwTwTw 2PwPwHwHw 3dw1dw1dw2dw2 4Pw1Pw1Hw1Hw1
5Pw2Pw2Hw2Hw2 6IsEsEsRs 8swTbTbTb ICE ciSibiDizi
Definition: Day of the month (UTC) on which the actual observation falls.
Units: Days.
Method of Measurement: Determined according to Universal Time Coordinated (UTC), not by local date or time.
How to Code: Always with two digits. 01 for the first day of the month, 02 for the second day, etc.
Remarks: At 0000 UTC, record the day just beginning, not the day which has just ended. Forgetting to change the day at 0000 UTC is a common observer error.
NWSOH No. 1 2-5 July 2004
2004Part2A.qxp 5/25/06 2:16 PM Page 2-6
Ships Synoptic Code and Observing Methods
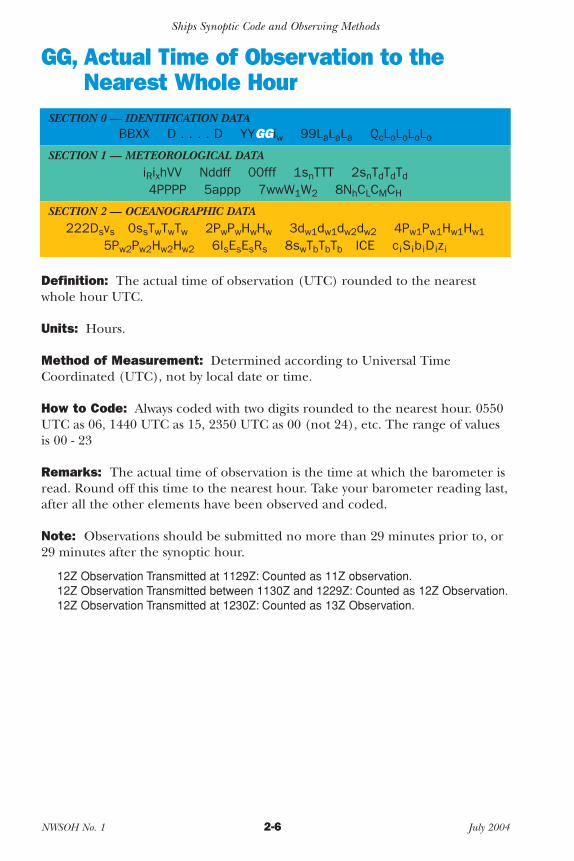
GG, Actual Time of Observation to the Nearest Whole Hour
SECTION 0 — IDENTIFICATION DATA BBXX D . . . . D YYGGiw 99LaLaLa QcLoLoLoLo
SECTION 1 — METEOROLOGICAL DATA iRixhVV Nddff 00fff 1snTTT 2snTdTdTd
4PPPP 5appp 7wwW1W2 8NhCLCMCH
SECTION 2 — OCEANOGRAPHIC DATA 222Dsvs 0ssTwTwTw 2PwPwHwHw 3dw1dw1dw2dw2 4Pw1Pw1Hw1Hw1
5Pw2Pw2Hw2Hw2 6IsEsEsRs 8swTbTbTb ICE ciSibiDizi
Definition: The actual time of observation (UTC) rounded to the nearest whole hour UTC.
Units: Hours.
Method of Measurement: Determined according to Universal Time Coordinated (UTC), not by local date or time.
How to Code: Always coded with two digits rounded to the nearest hour. 0550 UTC as 06, 1440 UTC as 15, 2350 UTC as 00 (not 24), etc. The range of values is 00 - 23
Remarks: The actual time of observation is the time at which the barometer is read. Round off this time to the nearest hour. Take your barometer reading last, after all the other elements have been observed and coded.
Note: Observations should be submitted no more than 29 minutes prior to, or 29 minutes after the synoptic hour.
12Z Observation Transmitted at 1129Z: Counted as 11Z observation.12Z Observation Transmitted between 1130Z and 1229Z: Counted as 12Z Observation.12Z Observation Transmitted at 1230Z: Counted as 13Z Observation.
NWSOH No. 1 2-6 July 2004
2004Part2A.qxp 5/25/06 2:16 PM Page 2-7
Ships Synoptic Code and Observing Methods
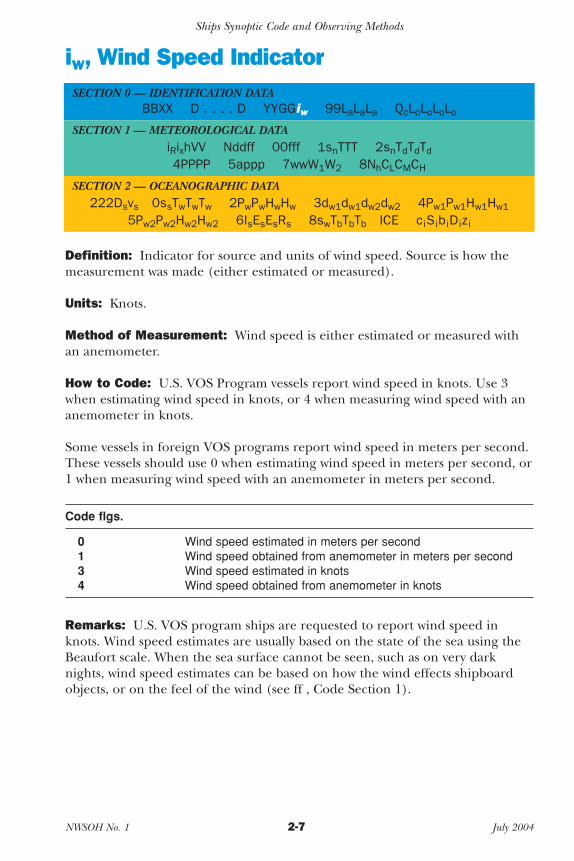
iw, Wind Speed Indicator SECTION 0 — IDENTIFICATION DATA
BBXX D . . . . D YYGGiw 99LaLaLa QcLoLoLoLo
SECTION 1 — METEOROLOGICAL DATA iRixhVV Nddff 00fff 1snTTT 2snTdTdTd
4PPPP 5appp 7wwW1W2 8NhCLCMCH
SECTION 2 — OCEANOGRAPHIC DATA 222Dsvs 0ssTwTwTw 2PwPwHwHw 3dw1dw1dw2dw2 4Pw1Pw1Hw1Hw1
5Pw2Pw2Hw2Hw2 6IsEsEsRs 8swTbTbTb ICE ciSibiDizi
Definition: Indicator for source and units of wind speed. Source is how the measurement was made (either estimated or measured).
Units: Knots.
Method of Measurement: Wind speed is either estimated or measured with an anemometer.
How to Code: U.S. VOS Program vessels report wind speed in knots. Use 3 when estimating wind speed in knots, or 4 when measuring wind speed with an anemometer in knots.
Some vessels in foreign VOS programs report wind speed in meters per second. These vessels should use 0 when estimating wind speed in meters per second, or 1 when measuring wind speed with an anemometer in meters per second.
Code flgs.
0 Wind speed estimated in meters per second 1 Wind speed obtained from anemometer in meters per second 3 Wind speed estimated in knots 4 Wind speed obtained from anemometer in knots
Remarks: U.S. VOS program ships are requested to report wind speed in knots. Wind speed estimates are usually based on the state of the sea using the Beaufort scale. When the sea surface cannot be seen, such as on very dark nights, wind speed estimates can be based on how the wind effects shipboard objects, or on the feel of the wind (see ff , Code Section 1).
NWSOH No. 1 2-7 July 2004

2004Part2A.qxp 5/25/06 2:16 PM Page 2-8
Ships Synoptic Code and Observing Methods
LaLaLa, Latitude in Tenths of a Degree 99, Data on Position Follow
SECTION 0 — IDENTIFICATION DATA BBXX D . . . . D YYGGiw 99LaLaLa QcLoLoLoLo
SECTION 1 — METEOROLOGICAL DATA iRixhVV Nddff 00fff 1snTTT 2snTdTdTd
4PPPP 5appp 7wwW1W2 8NhCLCMCH
SECTION 2 — OCEANOGRAPHIC DATA 222Dsvs 0ssTwTwTw 2PwPwHwHw 3dw1dw1dw2dw2 4Pw1Pw1Hw1Hw1
5Pw2Pw2Hw2Hw2 6IsEsEsRs 8swTbTbTb ICE ciSibiDizi
Definition: Ship’s latitude, in degrees and tenths of a degree, measured in terms of degrees north or south of the equator.
Units: Degrees and tenths of a degree.
Method of Measurement: Determine latitude using standard shipboard methods. Tenths is obtained by dividing the number of minutes by 6, and disregarding the remainder. Ignore seconds.
How to Code: Always coded with three digits, the first two digits are actual degrees, the last digit for tenths of a degree. Code 46˚ 41’ as 466 (46˚ is coded as is, 41’ divided by 6 is 6 5/6, 5/6 is disregarded); 33˚ 04’ as 330 (33˚ is coded as is, 04’ divided by 6 is 4/6 which is disregarded and coded as 0 in this case); 23˚ 00’ as 230;
Conversion of Minutes to Tenths of a Degree
Minutes Degree
00’-05’ .0 06’-11’ .1 12’-17’ .2 18’-23’ .3 24’-29’ .4 30’-35’ .5 36’-41’ .6 42’-47’ .7 48’-54’ .8 54’-59’ .9
Remarks: Latitude can vary from 0˚ (coded 000) to 90˚ (coded 900). Quadrant of the globe (Qc) is used to specify whether the latitude is north or south.
NWSOH No. 1 2-8 July 2004
2004Part2A.qxp 5/25/06 2:16 PM Page 2-9
Ships Synoptic Code and Observing Methods
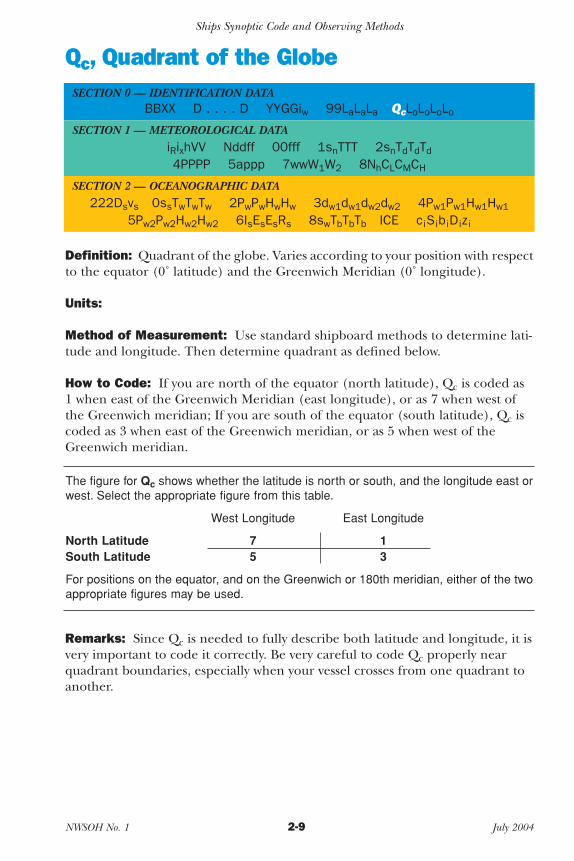
Qc, Quadrant of the Globe SECTION 0 — IDENTIFICATION DATA
BBXX D . . . . D YYGGiw 99LaLaLa QcLoLoLoLo
SECTION 1 — METEOROLOGICAL DATA iRixhVV Nddff 00fff 1snTTT 2snTdTdTd
4PPPP 5appp 7wwW1W2 8NhCLCMCH
SECTION 2 — OCEANOGRAPHIC DATA 222Dsvs 0ssTwTwTw 2PwPwHwHw 3dw1dw1dw2dw2 4Pw1Pw1Hw1Hw1
5Pw2Pw2Hw2Hw2 6IsEsEsRs 8swTbTbTb ICE ciSibiDizi
Definition: Quadrant of the globe. Varies according to your position with respect to the equator (0˚ latitude) and the Greenwich Meridian (0˚ longitude).
Units:
Method of Measurement: Use standard shipboard methods to determine latitude and longitude. Then determine quadrant as defined below.
How to Code: If you are north of the equator (north latitude), Qc is coded as 1 when east of the Greenwich Meridian (east longitude), or as 7 when west of the Greenwich meridian; If you are south of the equator (south latitude), Qc is coded as 3 when east of the Greenwich meridian, or as 5 when west of the Greenwich meridian.
The figure for Qc shows whether the latitude is north or south, and the longitude east or west. Select the appropriate figure from this table.
West Longitude East Longitude
North Latitude 7 1 South Latitude 5 3
For positions on the equator, and on the Greenwich or 180th meridian, either of the two appropriate figures may be used.
Remarks: Since Qc is needed to fully describe both latitude and longitude, it is very important to code it correctly. Be very careful to code Qc properly near quadrant boundaries, especially when your vessel crosses from one quadrant to another.
NWSOH No. 1 2-9 July 2004

2004Part2A.qxp 5/25/06 2:16 PM Page 2-10
Ships Synoptic Code and Observing Methods
LoLoLoLo, Longitude SECTION 0 — IDENTIFICATION DATA
BBXX D . . . . D YYGGiw 99LaLaLa QcLoLoLoLo
SECTION 1 — METEOROLOGICAL DATA iRixhVV Nddff 00fff 1snTTT 2snTdTdTd
4PPPP 5appp 7wwW1W2 8NhCLCMCH
SECTION 2 — OCEANOGRAPHIC DATA 222Dsvs 0ssTwTwTw 2PwPwHwHw 3dw1dw1dw2dw2 4Pw1Pw1Hw1Hw1
5Pw2Pw2Hw2Hw2 6IsEsEsRs 8swTbTbTb ICE ciSibiDizi
Definition: Longitude in degrees and tenths of a degree. Measured in degrees east or west of the Greenwich Meridian. Values reverse at the international dateline.
Units: Degrees and tenths of a degree.
Method of Measurement: Use standard shipboard methods. Tenths are obtained by dividing the number of minutes by 6, and disregarding the remainder. Ignore seconds.
How to Code: Always coded with four digits, with the leading (hundreds) figure coded as 0 or 1. The first three digits are actual degrees, the last digit for tenths of a degree. Code 142˚ 55’ as 1429 (142˚ is coded as is, 55’ divided by 6 is 9, the remainder is ignored); code 60˚ 31’ as 0605 (60˚ is coded as 060, 31 divided by 6 is 5, the remainder is ignored); code 9˚ 40” as 0096 (9° is coded as 009, 40” is coded as 6); code 0˚ 16’ as 0002 (0° is coded as 000, 16” is coded as 2).
Conversion of Minutes to Tenths of a Degree
Minutes Degree
00’-05’ .0 06’-11’ .1 12’-17’ .2 18’-23’ .3 24’-29’ .4 30’-35’ .5 36’-41’ .6 42’-47’ .7 48’-54’ .8 54’-59’ .9
Remarks: Longitude can vary from 0˚ (coded 0000 on the Greenwich Meridian) to 180˚ (coded 1800 on the dateline). Quadrant of the globe (Qc) is used to specify whether the longitude is east or west.
NWSOH No. 1 2-10 July 2004

2004Part2A.qxp 5/25/06 2:16 PM Page 2-11
Ships Synoptic Code and Observing Methods
iR, Precipitation Data Indicator SECTION 0 — IDENTIFICATION DATA
BBXX D . . . . D YYGGiw 99LaLaLa QcLoLoLoLo
SECTION 1 — METEOROLOGICAL DATA iRixhVV Nddff 00fff 1snTTT 2snTdTdTd
4PPPP 5appp 7wwW1W2 8NhCLCMCH
SECTION 2 — OCEANOGRAPHIC DATA 222Dsvs 0ssTwTwTw 2PwPwHwHw 3dw1dw1dw2dw2 4Pw1Pw1Hw1Hw1
5Pw2Pw2Hw2Hw2 6IsEsEsRs 8swTbTbTb ICE ciSibiDizi
Definition: Indicator For Inclusion or Omission of Precipitation Data.
Units:
Method of Measurement:
How to Code: Always coded as 4 for U.S. VOS program ships. This indicatesthat the precipitation group is omitted.
Remarks: Precipitation measurements from moving ships are of questionablevalue. U.S. VOS program ships do not report precipitation amount.
NWSOH No. 1 2-11 July 2004

2004Part2A.qxp 5/25/06 2:16 PM Page 2-12
Ships Synoptic Code and Observing Methods
iX, Weather Data Indicator SECTION 0 — IDENTIFICATION DATA
BBXX D . . . . D YYGGiw 99LaLaLa QcLoLoLoLo
SECTION 1 — METEOROLOGICAL DATA iRixhVV Nddff 00fff 1snTTT 2snTdTdTd
4PPPP 5appp 7wwW1W2 8NhCLCMCH
SECTION 2 — OCEANOGRAPHIC DATA 222Dsvs 0ssTwTwTw 2PwPwHwHw 3dw1dw1dw2dw2 4Pw1Pw1Hw1Hw1
5Pw2Pw2Hw2Hw2 6IsEsEsRs 8swTbTbTb ICE ciSibiDizi
Definition: ix is the indicator for present and past weather data group 7wwW1W2. Tells whether the group is included or omitted from the weather message.
Units:
Method of Measurement:
How to Code: Code as 1 when group 7wwW1W2 is included in the weather message. Code as 3 if group 7wwW1W2 is to be omitted (if present or past weather has not been observed).
When weather group 7wwW1W2 is: Code iX as:
included 1
omitted (no observation, or data not available) 3
Remarks: ix is usually coded as 1, because present and past weather are important information, and are normally included in the weather message. When there is no significant weather to report, you should report the kind of no significant weather there is, such as cloud development not observable (ww = 00), or cloud cover 1/2 or less throughout period (W1 = 0). ix is coded as 3 only when present and past weather have not been observed at all (in this case group 7wwW1W2 is omitted (skipped over) from the weather message. Incidentally, never transmit a slashed out group as /////; when no data is available for an entire group, it is excluded from the weather message.
NWSOH No. 1 2-12 July 2004

2004Part2A.qxp 5/25/06 2:16 PM Page 2-13
Ships Synoptic Code and Observing Methods
h, Cloud Height SECTION 0 — IDENTIFICATION DATA
BBXX D . . . . D YYGGiw 99LaLaLa QcLoLoLoLo
SECTION 1 — METEOROLOGICAL DATA iRixhVV Nddff 00fff 1snTTT 2snTdTdTd
4PPPP 5appp 7wwW1W2 8NhCLCMCH
SECTION 2 — OCEANOGRAPHIC DATA 222Dsvs 0ssTwTwTw 2PwPwHwHw 3dw1dw1dw2dw2 4Pw1Pw1Hw1Hw1
5Pw2Pw2Hw2Hw2 6IsEsEsRs 8swTbTbTb ICE ciSibiDizi
Definition: Height above sea surface of the base of the lowest cloud seen.
Units: Feet or meters.
Method of Measurement: Visual estimate. First determine the type of the lowest cloud seen, and then refer to it’s normal height range. As a rule of thumb, for a given cloud type, heights are higher in the tropics and during the summer months.
Approximate Cloud Heights
Range Polar Regions Temperate Regions Tropical Regions
High 3,000 to 7,600 meters (10,000 to 25,000 feet)
5,000 to 13,700 meters (16,5000 to 45,000 feet)
6,100 to 18,300 meters (20,000 to 60,000 feet)
Middle 2,000 to 4,000 meters (6,500 to 13,000 feet)
2,000 to 7,000 meters (6,500 to 23,000 feet)
2,000 to 7,600 meters (6,500 to 25,000 feet)
Low Surface to 2,000 meters (Surface to 6,500 feet)
Surface to 2,000 meters (Surface to 6,500 feet)
Surface to 2,000 meters (Surface to 6,500 feet)
How to Code: Code as 0 - 7 for Cumulus, Stratus, Stratocumulus, Cumulonimbus, or Nimbostratus clouds (these clouds have bases up to 6500 feet). Code as 8 or 9 for Altostratus, Altocumulus, and Nimbostratus (these clouds have bases above 6500 feet). Code as 9 for Cirrus, Cirrostratus, and Cirrocumulus (these clouds have bases above 8200 feet). Also code as 9 when no clouds are present. Code as / when the sky is obscured by fog or snow, or when reporting at night and cloud base height cannot be determined. Code in accordance with the table on the following page.
NWSOH No. 1 2-13 July 2004
2004Part2A.qxp 5/25/06 2:16 PM Page 2-14
Ships Synoptic Code and Observing Methods
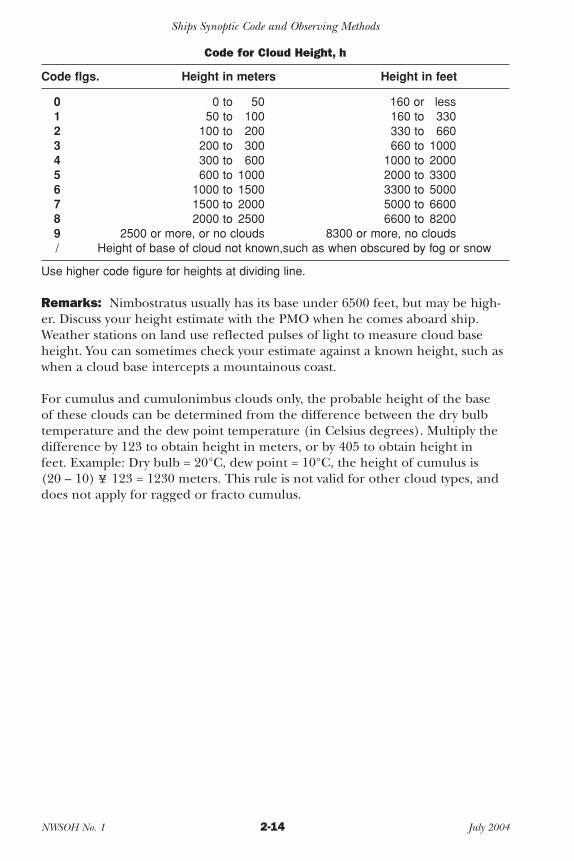
Code for Cloud Height, h
Code flgs. Height in meters Height in feet
0 0 to 50 160 or less 1 50 to 100 160 to 330 2 100 to 200 330 to 660 3 200 to 300 660 to 1000 4 300 to 600 1000 to 2000 5 600 to 1000 2000 to 3300 6 1000 to 1500 3300 to 5000 7 1500 to 2000 5000 to 6600 8 2000 to 2500 6600 to 8200 9 2500 or more, or no clouds 8300 or more, no clouds / Height of base of cloud not known,such as when obscured by fog or snow
Use higher code figure for heights at dividing line.
Remarks: Nimbostratus usually has its base under 6500 feet, but may be higher. Discuss your height estimate with the PMO when he comes aboard ship. Weather stations on land use reflected pulses of light to measure cloud base height. You can sometimes check your estimate against a known height, such as when a cloud base intercepts a mountainous coast.
For cumulus and cumulonimbus clouds only, the probable height of the base of these clouds can be determined from the difference between the dry bulb temperature and the dew point temperature (in Celsius degrees). Multiply the difference by 123 to obtain height in meters, or by 405 to obtain height in feet. Example: Dry bulb = 20°C, dew point = 10°C, the height of cumulus is (20 – 10) ¥ 123 = 1230 meters. This rule is not valid for other cloud types, and does not apply for ragged or fracto cumulus.
NWSOH No. 1 2-14 July 2004
2004Part2A.qxp 5/25/06 2:16 PM Page 2-15
Ships Synoptic Code and Observing Methods
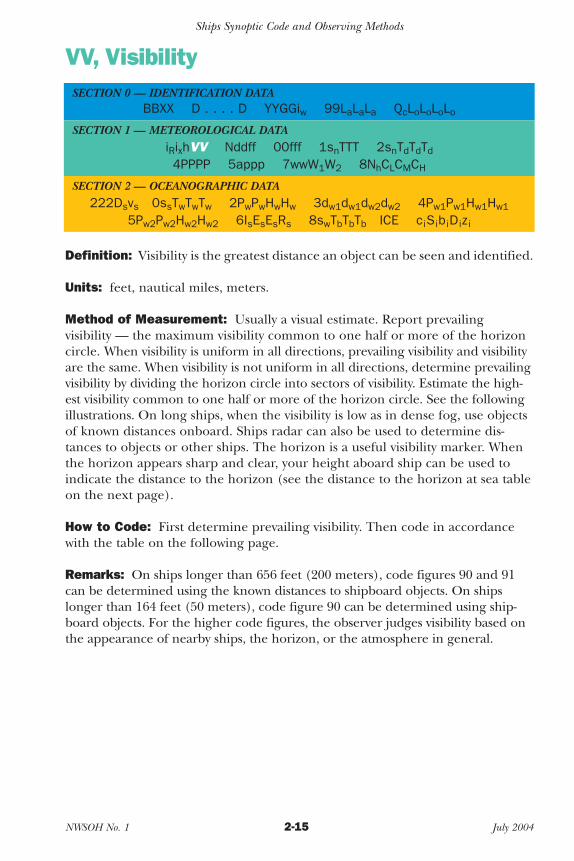
VV, Visibility SECTION 0 — IDENTIFICATION DATA
BBXX D . . . . D YYGGiw 99LaLaLa QcLoLoLoLo
SECTION 1 — METEOROLOGICAL DATA iRixhVV Nddff 00fff 1snTTT 2snTdTdTd
4PPPP 5appp 7wwW1W2 8NhCLCMCH
SECTION 2 — OCEANOGRAPHIC DATA 222Dsvs 0ssTwTwTw 2PwPwHwHw 3dw1dw1dw2dw2 4Pw1Pw1Hw1Hw1
5Pw2Pw2Hw2Hw2 6IsEsEsRs 8swTbTbTb ICE ciSibiDizi
Definition: Visibility is the greatest distance an object can be seen and identified.
Units: feet, nautical miles, meters.
Method of Measurement: Usually a visual estimate. Report prevailing visibility — the maximum visibility common to one half or more of the horizon circle. When visibility is uniform in all directions, prevailing visibility and visibility are the same. When visibility is not uniform in all directions, determine prevailing visibility by dividing the horizon circle into sectors of visibility. Estimate the highest visibility common to one half or more of the horizon circle. See the following illustrations. On long ships, when the visibility is low as in dense fog, use objects of known distances onboard. Ships radar can also be used to determine distances to objects or other ships. The horizon is a useful visibility marker. When the horizon appears sharp and clear, your height aboard ship can be used to indicate the distance to the horizon (see the distance to the horizon at sea table on the next page).
How to Code: First determine prevailing visibility. Then code in accordance with the table on the following page.
Remarks: On ships longer than 656 feet (200 meters), code figures 90 and 91 can be determined using the known distances to shipboard objects. On ships longer than 164 feet (50 meters), code figure 90 can be determined using shipboard objects. For the higher code figures, the observer judges visibility based on the appearance of nearby ships, the horizon, or the atmosphere in general.
NWSOH No. 1 2-15 July 2004
2004Part2A.qxp 5/25/06 2:16 PM Page 2-16
Ships Synoptic Code and Observing Methods
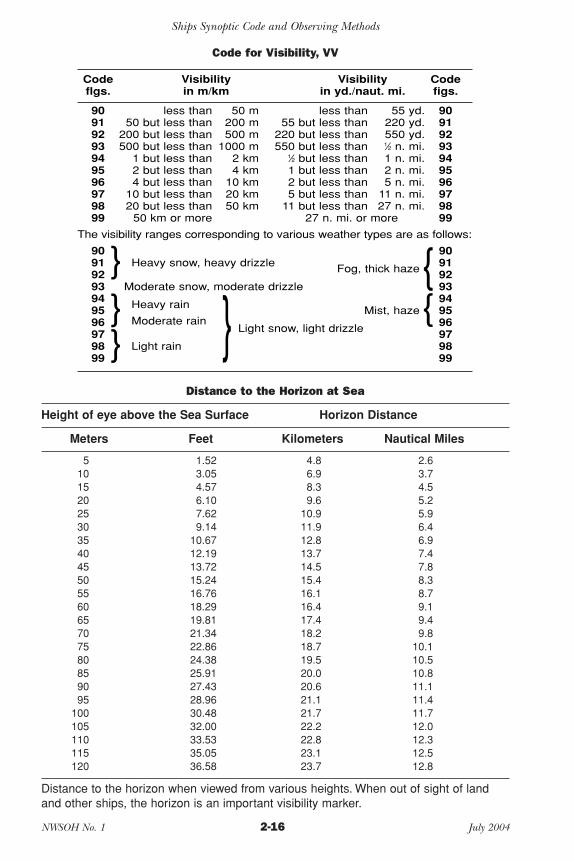
Code for Visibility, VV
Code Visibility Visibility Code flgs. in m/km in yd./naut. mi. figs.
90 less than 50 m less than 55 yd. 90 91 50 but less than 200 m 55 but less than 220 yd. 91 92 200 but less than 500 m 220 but less than 550 yd. 92 93 500 but less than 1000 m 550 but less than 1⁄2 n. mi. 93
194 1 but less than 2 km ⁄2 but less than 1 n. mi. 94 95 2 but less than 4 km 1 but less than 2 n. mi. 95 96 4 but less than 10 km97 10 but less than 20 km98 20 but less than 50 km99 50 km or more
2 but less than 5 n. mi. 96 5 but less than 11 n. mi. 97
11 but less than 27 n. mi. 98 27 n. mi. or more 99
The visibility ranges corresponding to various weather types are as follows:
90 90 91 Heavy snow, heavy drizzle 91} Fog, thick haze{92 92 93 Moderate snow, moderate drizzle 93 94 94 95 Heavy rain {Mist, haze 95 96 } Moderate rain } Light snow, light drizzle 96
97 97 98 Light rain 98}99 99
Distance to the Horizon at Sea
Height of eye above the Sea Surface Horizon Distance
Meters Feet Kilometers Nautical Miles
5 1.52 4.8 2.6 10 3.05 6.9 3.7 15 4.57 8.3 4.5 20 6.10 9.6 5.2 25 7.62 10.9 5.9 30 9.14 11.9 6.4 35 10.67 12.8 6.9 40 12.19 13.7 7.4 45 13.72 14.5 7.8 50 15.24 15.4 8.3 55 16.76 16.1 8.7 60 18.29 16.4 9.1 65 19.81 17.4 9.4 70 21.34 18.2 9.8 75 22.86 18.7 10.1 80 24.38 19.5 10.5 85 25.91 20.0 10.8 90 27.43 20.6 11.1 95 28.96 21.1 11.4
100 30.48 21.7 11.7 105 32.00 22.2 12.0 110 33.53 22.8 12.3 115 35.05 23.1 12.5 120 36.58 23.7 12.8
Distance to the horizon when viewed from various heights. When out of sight of land and other ships, the horizon is an important visibility marker.
NWSOH No. 1 2-16 July 2004
2004Part2A.qxp 5/25/06 2:16 PM Page 2-17
Ships Synoptic Code and Observing Methods
Determining Prevailing Visibility (Prevailing visibility indicated by asteriks and shading)
Prevailing visibility is the maximum visibility common to one half (180°) or more of the horizon circle.
NWSOH No. 1 2-17 July 2004
2004Part2A.qxp 5/25/06 2:16 PM Page 2-18
Ships Synoptic Code and Observing Methods
N, Total Cloud Cover SECTION 0 — IDENTIFICATION DATA
BBXX D . . . . D YYGGiw 99LaLaLa QcLoLoLoLo
SECTION 1 — METEOROLOGICAL DATA iRixhVV Nddff 00fff 1snTTT 2snTdTdTd
4PPPP 5appp 7wwW1W2 8NhCLCMCH
SECTION 2 — OCEANOGRAPHIC DATA 222Dsvs 0ssTwTwTw 2PwPwHwHw 3dw1dw1dw2dw2 4Pw1Pw1Hw1Hw1
5Pw2Pw2Hw2Hw2 6IsEsEsRs 8swTbTbTb ICE ciSibiDizi
Definition: The total fraction of the sky covered by clouds of all types.
Units: Eighths of the sky.
Method of Measurement: Visually estimate how many eighths of the sky are covered by cloud, regardless of type. It is sometimes easier to estimate how much of the sky without clouds can be seen, i.e. if two eighths of the sky is clear, then 6 eighths is covered by cloud.
How to Code: See table below.
Code for Total Cloud Cover, N
Code flgs. Fraction of sky covered
0 Cloudless 1 1 eighth or less, but not zero 2 2 eighths 3 3 eighths 4 4 eighths 5 5 eighths 6 6 eighths 7 7 eighths or more but not totally covered 8 8 eighths, sky completely covered by clouds 9 Sky obscured by fog, snow, or other meteorological
phenomena / Cloud cover indescernible for reasons other than
Code fig. 9, or observation is not made
Remarks: A mackeral sky (Altocumulus, stratocumulus, or cirrocumulus covering the whole sky) should be coded as N = 7, since breaks are always present in these cloud forms. When observing clouds through fog, base your estimate for N on the amount of clouds that can be seen through the fog. When a completely clear sky is observed through fog or haze, report N as 0.
NWSOH No. 1 2-18 July 2004
2004Part2A.qxp 5/25/06 2:16 PM Page 2-19
Ships Synoptic Code and Observing Methods
dd, Wind Direction SECTION 0 — IDENTIFICATION DATA
BBXX D . . . . D YYGGiw 99LaLaLa QcLoLoLoLo
SECTION 1 — METEOROLOGICAL DATA iRixhVV Nddff 00fff 1snTTT 2snTdTdTd
4PPPP 5appp 7wwW1W2 8NhCLCMCH
SECTION 2 — OCEANOGRAPHIC DATA 222Dsvs 0ssTwTwTw 2PwPwHwHw 3dw1dw1dw2dw2 4Pw1Pw1Hw1Hw1
5Pw2Pw2Hw2Hw2 6IsEsEsRs 8swTbTbTb ICE ciSibiDizi
Definition: True direction, in tens of degrees, from which wind is blowing. This is a mean direction averaged over a period of ten minutes.
Units: Degrees, referred to true north (0˚T).
Method of Measurement: Determine true wind direction from either (1) the orientation of sea (wind) waves, or streaks of foam on the sea surface, or (2) the apparent wind direction observed aboard ship.
Method (1) is easiest, because it provides true wind direction independent of the ships movement. Sight along the lines of the sea wave crests. Since true wind direction is the same as the direction from which the sea waves are coming, dd is perpendicular (90˚) to the advancing waves crests. Also, use lines of foam on the sea surface (which may appear for Force 7 or greater wind speeds). Wind blown foam streaks are parallel to the direction of the true wind.
Method (2) determines true wind direction from the apparent wind (the wind experienced on board when the ship is underway). Apparent wind results from two motions — the actual motion of the air (true wind), and the motion of the ship. Apparent wind direction is best determined by facing directly into the wind on the windward side of the ship. Other good apparent wind indicators are funnel smoke, the orientation of shipboard flags or pennants, or a wind vane. Once apparent wind direction is obtained, you must remove the motion of the ship to obtain true wind. See ff for methods of determining true wind from apparent wind.
How to Code: Coded on a scale from 00 to 36 (and 99 for variable), expressed in tens of degrees. Code true north as 36, east as 09, south as 18, west as 27. See the table on the following page.
NWSOH No. 1 2-19 July 2004
2004Part2A.qxp 5/25/06 2:16 PM Page 2-20
00
Ships Synoptic Code and Observing Methods
Code for Wind Direction, dd
Code figure Code flgure
00 Calm 01 5°-14° 21 205°-214° 02 15°-24° 22 215°-224° 03 25°-34° 23 225°-234° 04 35°-44° 24 235°-244° 05 45°-54° 25 245°-254° 06 55°-64° 26 255°-264° 07 65°-74° 27 265°-274° 08 75°-84° 28 275°-284° 09 85°-94° 29 285°-294° 10 95°-104° 30 295°-304° 11 105°-114° 31 305°-314° 12 115°-124° 32 315°-324° 13 125°-134° 33 325°-334° 14 135°-144° 34 335°-344° 15 145°-154° 35 345°-354° 16 155°-164° 36 355°- 4° 17 165°-174° 99 Variable, or all 18 175°-184° directions. 19 185°-194° 20 195°-204°
Remarks: Report the mean wind direction over the ten minute period immediately preceding observation time. If this time period includes an abrupt change in wind direction, only average data obtained after the change. If using apparent or relative wind direction, remember to determine true wind before reporting.
NWSOH No. 1 2-20 July 2004
2004Part2A.qxp 5/25/06 2:16 PM Page 2-21
Ships Synoptic Code and Observing Methods
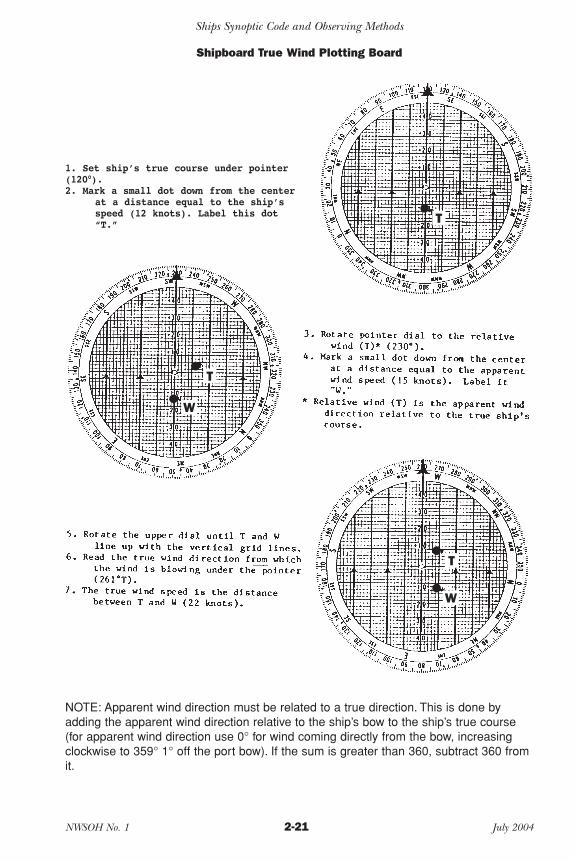
Shipboard True Wind Plotting Board
1. Set ship’s true course under pointer(120°).2. Mark a small dot down from the center
at a distance equal to the ship’sspeed (12 knots). Label this dot T“T.”
T
W
T
W
NOTE: Apparent wind direction must be related to a true direction. This is done by adding the apparent wind direction relative to the ship’s bow to the ship’s true course (for apparent wind direction use 0° for wind coming directly from the bow, increasing clockwise to 359° 1° off the port bow). If the sum is greater than 360, subtract 360 from it.
NWSOH No. 1 2-21 July 2004
2004Part2A.qxp 5/25/06 2:16 PM Page 2-22
Ships Synoptic Code and Observing Methods
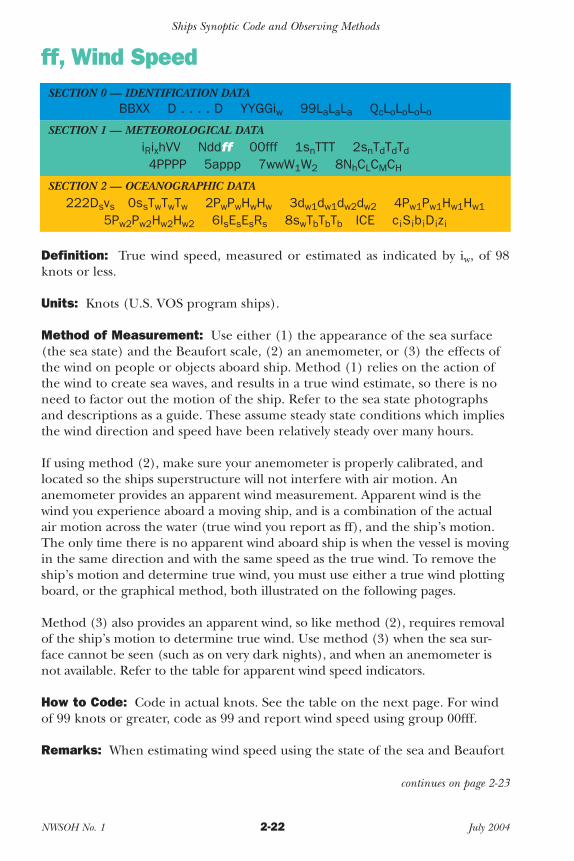
ff, Wind Speed SECTION 0 — IDENTIFICATION DATA
BBXX D . . . . D YYGGiw 99LaLaLa QcLoLoLoLo
SECTION 1 — METEOROLOGICAL DATA iRixhVV Nddff 00fff 1snTTT 2snTdTdTd
4PPPP 5appp 7wwW1W2 8NhCLCMCH
SECTION 2 — OCEANOGRAPHIC DATA 222Dsvs 0ssTwTwTw 2PwPwHwHw 3dw1dw1dw2dw2 4Pw1Pw1Hw1Hw1
5Pw2Pw2Hw2Hw2 6IsEsEsRs 8swTbTbTb ICE ciSibiDizi
Definition: True wind speed, measured or estimated as indicated by iw, of 98 knots or less.
Units: Knots (U.S. VOS program ships).
Method of Measurement: Use either (1) the appearance of the sea surface (the sea state) and the Beaufort scale, (2) an anemometer, or (3) the effects of the wind on people or objects aboard ship. Method (1) relies on the action of the wind to create sea waves, and results in a true wind estimate, so there is no need to factor out the motion of the ship. Refer to the sea state photographs and descriptions as a guide. These assume steady state conditions which implies the wind direction and speed have been relatively steady over many hours.
If using method (2), make sure your anemometer is properly calibrated, and located so the ships superstructure will not interfere with air motion. An anemometer provides an apparent wind measurement. Apparent wind is the wind you experience aboard a moving ship, and is a combination of the actual air motion across the water (true wind you report as ff), and the ship’s motion. The only time there is no apparent wind aboard ship is when the vessel is moving in the same direction and with the same speed as the true wind. To remove the ship’s motion and determine true wind, you must use either a true wind plotting board, or the graphical method, both illustrated on the following pages.
Method (3) also provides an apparent wind, so like method (2), requires removal of the ship’s motion to determine true wind. Use method (3) when the sea surface cannot be seen (such as on very dark nights), and when an anemometer is not available. Refer to the table for apparent wind speed indicators.
How to Code: Code in actual knots. See the table on the next page. For wind of 99 knots or greater, code as 99 and report wind speed using group 00fff.
Remarks: When estimating wind speed using the state of the sea and Beaufort
continues on page 2-23
NWSOH No. 1 2-22 July 2004
2004Part2A.qxp 5/25/06 2:16 PM Page 2-23
- 00
Ships Synoptic Code and Observing Methods
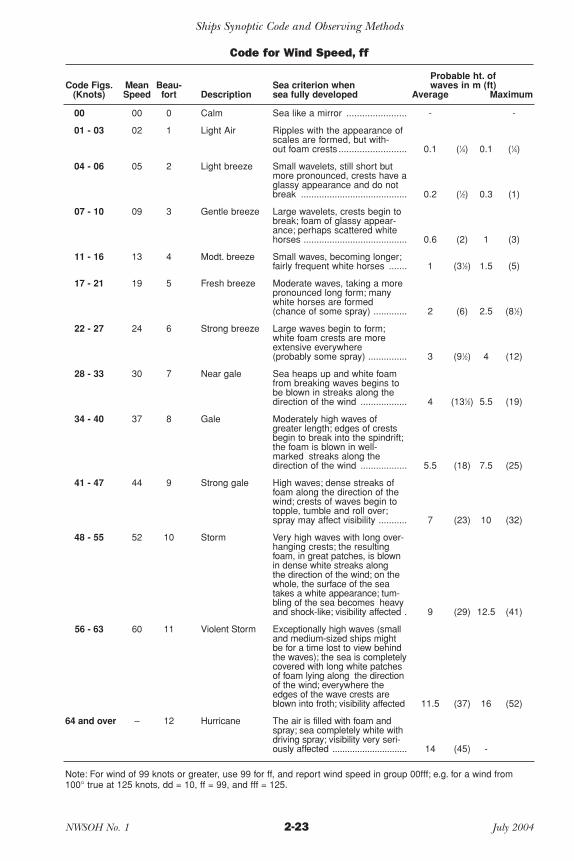
Code for Wind Speed, ff
Probable ht. of Code Figs.
(Knots) Mean Beau-Speed fort Description
Sea criterion when sea fully developed
waves in m (ft) Average Maximum
00 00 0 Calm Sea like a mirror ....................... - -
01 - 03 02 1 Light Air Ripples with the appearance of scales are formed, but without foam crests .......................... 0.1 (1⁄4) 0.1 (1⁄4)
04 - 06 05 2 Light breeze Small wavelets, still short but more pronounced, crests have a glassy appearance and do not break ......................................... 0.2 (1⁄2) 0.3 (1)
07 - 10 09 3 Gentle breeze Large wavelets, crests begin to break; foam of glassy appearance; perhaps scattered white horses ........................................ 0.6 (2) 1 (3)
11 - 16 13 4 Modt. breeze Small waves, becoming longer; fairly frequent white horses ....... 1 (31⁄2) 1.5 (5)
17 - 21 19 5 Fresh breeze Moderate waves, taking a more pronounced long form; many white horses are formed (chance of some spray) ............. 2 (6) 2.5 (81⁄2)
22 - 27 24 6 Strong breeze Large waves begin to form; white foam crests are more extensive everywhere (probably some spray) ............... 3 (91⁄2) 4 (12)
28 - 33 30 7 Near gale Sea heaps up and white foam from breaking waves begins to be blown in streaks along the direction of the wind .................. 4 (131⁄2) 5.5 (19)
34 - 40 37 8 Gale Moderately high waves of greater length; edges of crests begin to break into the spindrift; the foam is blown in well-marked streaks along the direction of the wind .................. 5.5 (18) 7.5 (25)
41 - 47 44 9 Strong gale High waves; dense streaks of foam along the direction of the wind; crests of waves begin to topple, tumble and roll over; spray may affect visibility ........... 7 (23) 10 (32)
48 - 55 52 10 Storm Very high waves with long overhanging crests; the resulting foam, in great patches, is blown in dense white streaks along the direction of the wind; on the whole, the surface of the sea takes a white appearance; tumbling of the sea becomes heavy and shock-like; visibility affected . 9 (29) 12.5 (41)
56 - 63 60 11 Violent Storm Exceptionally high waves (small and medium-sized ships might be for a time lost to view behind the waves); the sea is completely covered with long white patches of foam lying along the direction of the wind; everywhere the edges of the wave crests are blown into froth; visibility affected 11.5 (37) 16 (52)
64 and over – 12 Hurricane The air is filled with foam and spray; sea completely white with driving spray; visibility very seriously affected .............................. 14 (45) -
Note: For wind of 99 knots or greater, use 99 for ff, and report wind speed in group 00fff; e.g. for a wind from 100° true at 125 knots, dd = 10, ff = 99, and fff = 125.
NWSOH No. 1 2-23 July 2004

2004Part2A.qxp 5/25/06 2:16 PM Page 2-24
Ships Synoptic Code and Observing Methods
Effect of Apparent Wind on Ships
Apparent Speed (Knots) Indication
Less than 1 Calm, smoke rises vertically.
1 - 3 Smoke drifts from funnel.
4 - 6 Wind felt on face. Smoke rises at about 80°.
7 - 10 Wind extends light flag and pennants. Smoke rises at about 70°.
11 - 16 Wind raises dust and loose paper on deck. Smoke rises at about 50˚. No noticeable sound in the rigging. Slack halyards curve and sway. Heavy flag flaps limply.
17 - 21 Wind felt strongly on face. Smoke rises at 30˚. Slack halyards whip while bending continuously to leeward. Taut halyards maintain slightly bent position. Low whistle in the rigging. Heavy flag doesn’t fully extend but flaps over entire length.
22 - 27 Wind stings face in temperature below 2˚C. Slight effort in maintaining balance against the wind. Smoke rises at 15˚. Both slack and taut halyards whip slightly in bent position. Low moaning, rather than whistle, in the rigging. Heavy flag extends and flaps more vigorously.
28 - 33 Necessary to lean slightly into the wind to maintain balance. Smoke rises at 5˚ to 10˚. Higher pitched moaning and whistling heard from rigging. Halyards still whip slightly. Heavy flag extends fully and flaps only at the end. Oilskins and loose clothing inflate and pull against the body.
34 - 40 Head pushed back by the force of the wind if allowed to relax. Oilskins and loose clothing inflate and pull strongly. Halyards rigidly bent. Loud whistle from rigging. Heavy flag straight out and whipping.
continued from 2-21
scale, remember that heavy rain and floating ice have a dampening effect on the sea surface, so under these conditions, wind speed may be greater than the sea state indicates. There will always be a lag period between the wind speed increasing or decreasing and the sea wave height rising or falling, especially during a sudden change in wind speed. Wind blowing against a tide or strong current causes a greater than normal sea wave height, while wind blowing with the tide or current causes a smaller than normal sea wave height. When any of these conditions exist, an adjustment may be needed to your wind speed estimate.
NWSOH No. 1 2-24 July 2004

2004Part2A.qxp 5/25/06 2:16 PM Page 2-25
Ships Synoptic Code and Observing Methods
Graphic Method for Determining the True Wind
NORTH0°
270° 90°
261°
22 Knots23
0°
15Kno
ts
W
R
T 12 Knots
Direction from which true wind is blowing
Wind is blowing
from th
is dire
ction
toward the sh
ip
120° Ship’s Course T
Direction from which the apparent wind is blowing related to the course T of the ship
180°
Ship’s Course 120° (True)
Ship’s speed 12 knots
Apparent wind directionrelative to the bow 110° R
Apparent wind directionrelative to ship’s course 120° + 110° = 230°Apparent wind speed 15 knots
1. Select a center position. Place a dot and label it “T”.
2. With a vertical line through point T designated as the 0° line, draw a line for the ship’s course at 120°.
3. Select a scale and draw an arc across the course line at 12 scale units (12 knots) representing the ship’s speed as shown in Figure 2.3. Mark the intersection with a dot and label it “R”. The ship’s course and speed are represented by the vector TR.
4. From point R, draw a line for the apparent wind direction (from 230°) and, using the same scale, the apparent wind speed (15 knots); label this point “W”. The vector RW is the relative wind.
5. Complete the triangle by drawing the line TW for the true wind as shown in the figure above. The direction is from the same direction as the label reads, TW for True Wind, from the “T”. True wind is from 261° (true), 22 knots, which is coded N2622.
NWSOH No. 1 2-25 July 2004

2004Part2A.qxp 5/25/06 2:16 PM Page 2-26
Ships Synoptic Code and Observing Methods
BEAUFORT SCALE
Beaufort Descriptive Number Term Knots Specification
0 Calm 0 Sea like a mirror.
Beaufort Descriptive Number Term Knots Specification
1 Light Air 1-3 Ripples with the appearance of scales are formed, without foam crests.
NWSOH No. 1 2-26 July 2004

2004Part2A.qxp 5/25/06 2:17 PM Page 2-27
Ships Synoptic Code and Observing Methods
Beaufort Descriptive Number Term Knots Specification
2 Light breeze 4-6 Small wavelets, still short, but more pronounced; crests have a glassy appearance but do not break.
Beaufort Descriptive Number Term Knots Specification
3 Gentle 7-10 Large wavelets; crests begin to break; foam of glassy appearance; perhaps scattered white horses (white caps).
NWSOH No. 1 2-27 July 2004
2004Part2A.qxp 5/25/06 2:17 PM Page 2-28
Ships Synoptic Code and Observing Methods
Beaufort Descriptive Number Term Knots Specification
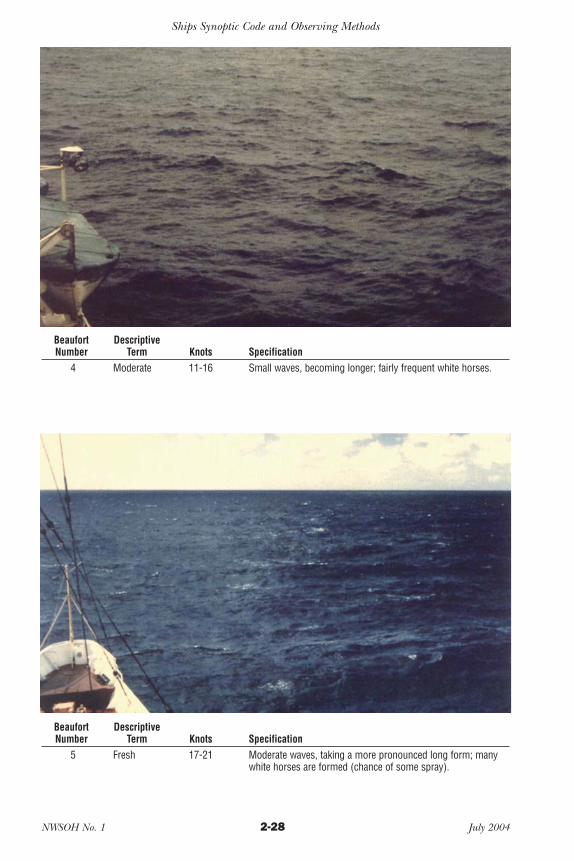
4 Moderate 11-16 Small waves, becoming longer; fairly frequent white horses.
Beaufort Descriptive Number Term Knots Specification
5 Fresh 17-21 Moderate waves, taking a more pronounced long form; many white horses are formed (chance of some spray).
NWSOH No. 1 2-28 July 2004
2004Part2A.qxp 5/25/06 2:17 PM Page 2-29
Ships Synoptic Code and Observing Methods
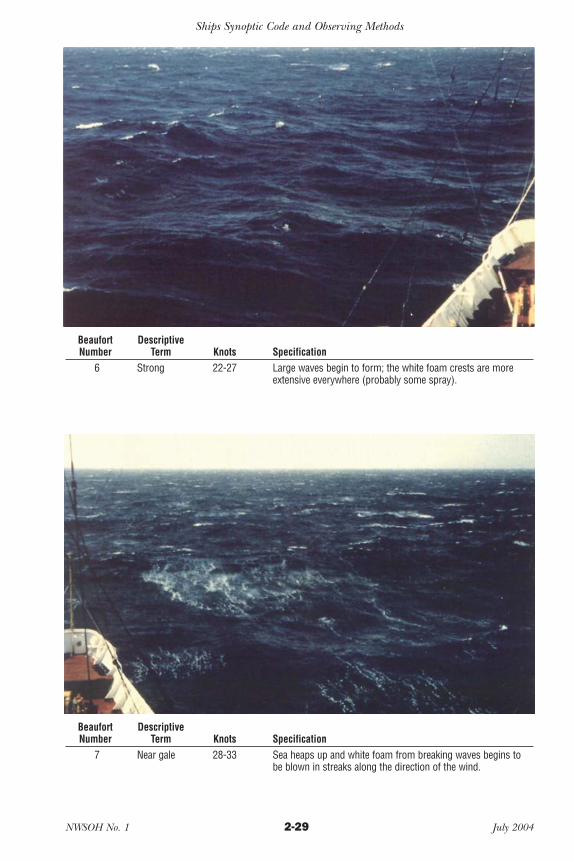
Beaufort Descriptive Number Term Knots Specification
6 Strong 22-27 Large waves begin to form; the white foam crests are more extensive everywhere (probably some spray).
Beaufort Descriptive Number Term Knots Specification
7 Near gale 28-33 Sea heaps up and white foam from breaking waves begins to be blown in streaks along the direction of the wind.
NWSOH No. 1 2-29 July 2004
2004Part2A.qxp 5/25/06 2:17 PM Page 2-30
Ships Synoptic Code and Observing Methods
Beaufort Descriptive Number Term Knots Specification
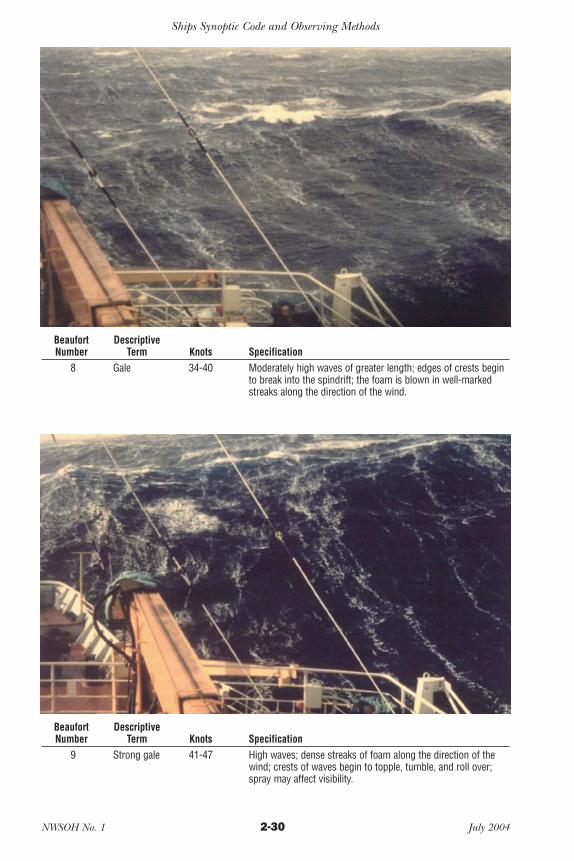
8 Gale 34-40 Moderately high waves of greater length; edges of crests begin to break into the spindrift; the foam is blown in well-marked streaks along the direction of the wind.
Beaufort Descriptive Number Term Knots Specification
9 Strong gale 41-47 High waves; dense streaks of foam along the direction of the wind; crests of waves begin to topple, tumble, and roll over; spray may affect visibility.
NWSOH No. 1 2-30 July 2004
2004Part2A.qxp 5/25/06 2:17 PM Page 2-31
Ships Synoptic Code and Observing Methods
Beaufort Descriptive Number Term Knots Specification
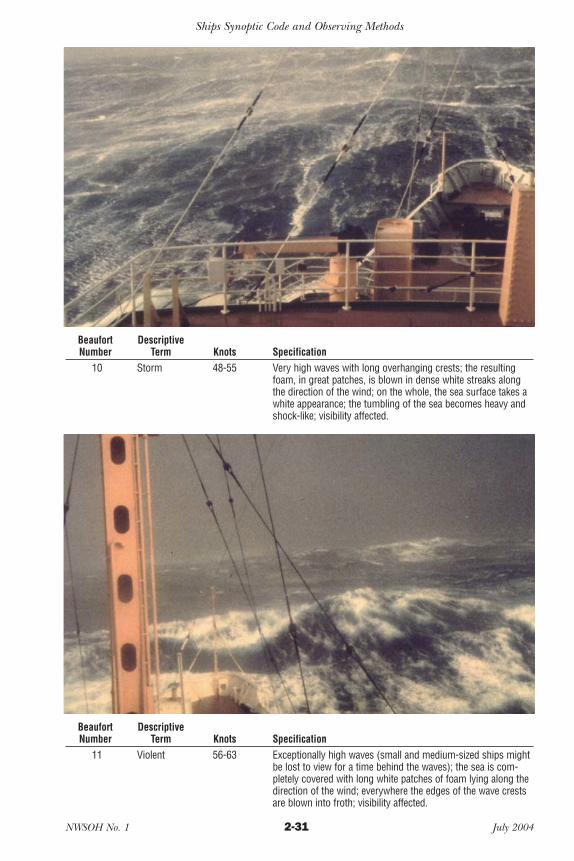
10 Storm 48-55 Very high waves with long overhanging crests; the resulting foam, in great patches, is blown in dense white streaks along the direction of the wind; on the whole, the sea surface takes a white appearance; the tumbling of the sea becomes heavy and shock-like; visibility affected.
Beaufort Descriptive Number Term Knots Specification
11 Violent 56-63 Exceptionally high waves (small and medium-sized ships might be lost to view for a time behind the waves); the sea is completely covered with long white patches of foam lying along the direction of the wind; everywhere the edges of the wave crests are blown into froth; visibility affected.
NWSOH No. 1 2-31 July 2004

2004Part2A.qxp 5/25/06 2:17 PM Page 2-32
WHEN USING THE BEAUFORT SCALE, THE VELOCITY EQUIVALENT ISAT A STANDARD HEIGHT OF 10 METERS ABOVE THE WATER SURFACE.
Ships Synoptic Code and Observing Methods
Beaufort Descriptive Number Term Knots Specification
12 Hurricane 64 and The air is filled with foam and spray; sea completely over white with driving spray; visibility very seriously affected.
In enclosed waters, or when near land, with an off-shore wind, wave heights will be smaller and the waves steeper.
NWSOH No. 1 2-32 July 2004
2004Part2A.qxp 5/25/06 2:17 PM Page 2-33
Ships Synoptic Code and Observing Methods
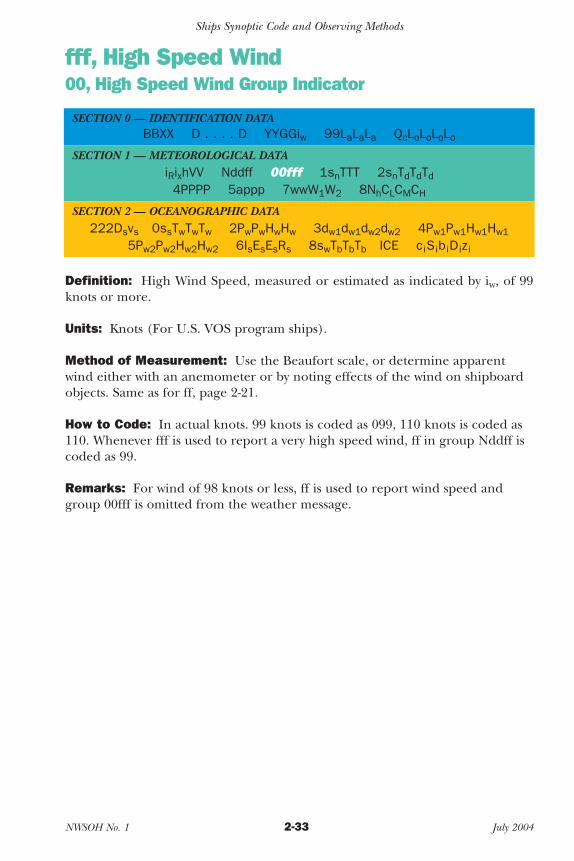
fff, High Speed Wind 00, High Speed Wind Group Indicator
SECTION 0 — IDENTIFICATION DATA BBXX D . . . . D YYGGiw 99LaLaLa QcLoLoLoLo
SECTION 1 — METEOROLOGICAL DATA iRixhVV Nddff 00fff 1snTTT 2snTdTdTd
4PPPP 5appp 7wwW1W2 8NhCLCMCH
SECTION 2 — OCEANOGRAPHIC DATA 222Dsvs 0ssTwTwTw 2PwPwHwHw 3dw1dw1dw2dw2 4Pw1Pw1Hw1Hw1
5Pw2Pw2Hw2Hw2 6IsEsEsRs 8swTbTbTb ICE ciSibiDizi
Definition: High Wind Speed, measured or estimated as indicated by iw, of 99 knots or more.
Units: Knots (For U.S. VOS program ships).
Method of Measurement: Use the Beaufort scale, or determine apparent wind either with an anemometer or by noting effects of the wind on shipboard objects. Same as for ff, page 2-21.
How to Code: In actual knots. 99 knots is coded as 099, 110 knots is coded as 110. Whenever fff is used to report a very high speed wind, ff in group Nddff is coded as 99.
Remarks: For wind of 98 knots or less, ff is used to report wind speed and group 00fff is omitted from the weather message.
NWSOH No. 1 2-33 July 2004
2004Part2A.qxp 5/25/06 2:17 PM Page 2-34
Ships Synoptic Code and Observing Methods
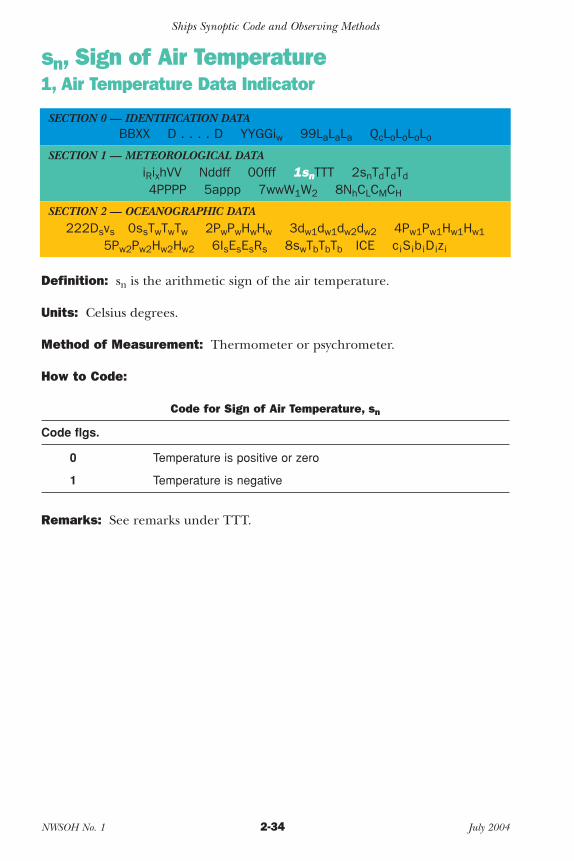
sn, Sign of Air Temperature 1, Air Temperature Data Indicator
SECTION 0 — IDENTIFICATION DATA BBXX D . . . . D YYGGiw 99LaLaLa QcLoLoLoLo
SECTION 1 — METEOROLOGICAL DATA iRixhVV Nddff 00fff 1snTTT 2snTdTdTd
4PPPP 5appp 7wwW1W2 8NhCLCMCH
SECTION 2 — OCEANOGRAPHIC DATA 222Dsvs 0ssTwTwTw 2PwPwHwHw 3dw1dw1dw2dw2 4Pw1Pw1Hw1Hw1
5Pw2Pw2Hw2Hw2 6IsEsEsRs 8swTbTbTb ICE ciSibiDizi
Definition: sn is the arithmetic sign of the air temperature.
Units: Celsius degrees.
Method of Measurement: Thermometer or psychrometer.
How to Code:
Code for Sign of Air Temperature, sn
Code flgs.
0 Temperature is positive or zero
1 Temperature is negative
Remarks: See remarks under TTT.
NWSOH No. 1 2-34 July 2004

2004Part2A.qxp 5/25/06 2:17 PM Page 2-35
Ships Synoptic Code and Observing Methods
TTT, Air Temperature (Dry-bulb) SECTION 0 — IDENTIFICATION DATA
BBXX D . . . . D YYGGiw 99LaLaLa QcLoLoLoLo
SECTION 1 — METEOROLOGICAL DATA iRixhVV Nddff 00fff 1snTTT 2snTdTdTd
4PPPP 5appp 7wwW1W2 8NhCLCMCH
SECTION 2 — OCEANOGRAPHIC DATA 222Dsvs 0ssTwTwTw 2PwPwHwHw 3dw1dw1dw2dw2 4Pw1Pw1Hw1Hw1
5Pw2Pw2Hw2Hw2 6IsEsEsRs 8swTbTbTb ICE ciSibiDizi
Definition: Air temperature, in whole degrees and tenths of a degree Celsius, its sign being given by Sn. It is a measure of the heat content of the air.
Units: Celsius degrees.
Method of Measurement: Thermometer or psychrometer. When reading the thermometer, the eye must be at the same level as the end of the mercury column. Take the reading from the windward side of the ship in a stream of air fresh from the sea, which has not been in contact with, or passed over the ship. The thermometer should be shielded from radiation, precipitation, and spray.
How to Code: In actual Celsius degrees (to tenths of a degree).
Examples: 12.1°C: TTT= 121 and Sn= 0 4.2°C: TTT= 042 and Sn= 0 0.8°C: TTT= 008 and Sn= 0
–0.8°C: TTT= 008 and Sn= 1 –6.2°C: TTT= 062 and Sn= 1
Remarks: If a fixed location louvered screen psychrometer is used, one must be installed on each side of the ship, so the observation can always be made from the windward side. If using a sling psychrometer stored inside, allow sufficient time for the thermometer to adjust to the outside temperature.
NWSOH No. 1 2-35 July 2004
2004Part2A.qxp 5/25/06 2:17 PM Page 2-36
Ships Synoptic Code and Observing Methods
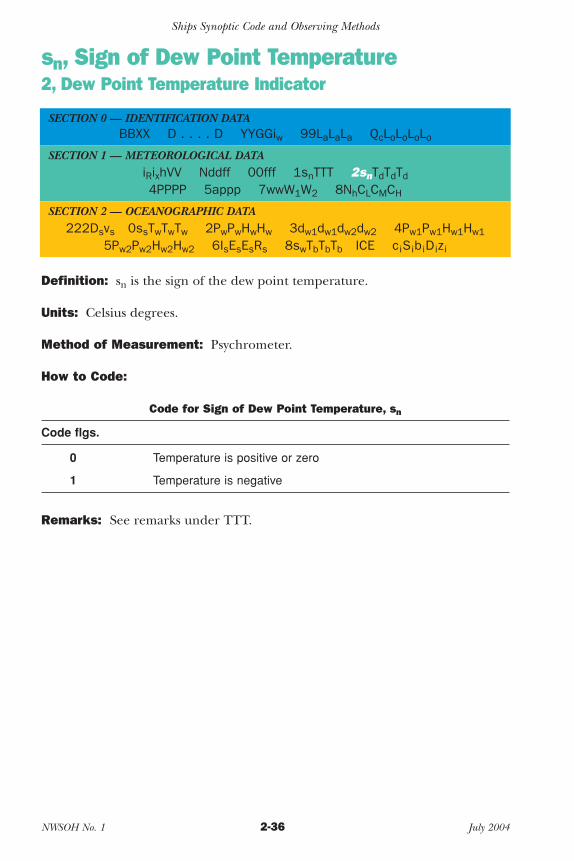
sn, Sign of Dew Point Temperature 2, Dew Point Temperature Indicator
SECTION 0 — IDENTIFICATION DATA BBXX D . . . . D YYGGiw 99LaLaLa QcLoLoLoLo
SECTION 1 — METEOROLOGICAL DATA iRixhVV Nddff 00fff 1snTTT 2snTdTdTd
4PPPP 5appp 7wwW1W2 8NhCLCMCH
SECTION 2 — OCEANOGRAPHIC DATA 222Dsvs 0ssTwTwTw 2PwPwHwHw 3dw1dw1dw2dw2 4Pw1Pw1Hw1Hw1
5Pw2Pw2Hw2Hw2 6IsEsEsRs 8swTbTbTb ICE ciSibiDizi
Definition: sn is the sign of the dew point temperature.
Units: Celsius degrees.
Method of Measurement: Psychrometer.
How to Code:
Code for Sign of Dew Point Temperature, sn
Code flgs.
0 Temperature is positive or zero
1 Temperature is negative
Remarks: See remarks under TTT.
NWSOH No. 1 2-36 July 2004
2004Part2A.qxp 5/25/06 2:17 PM Page 2-37
Ships Synoptic Code and Observing Methods
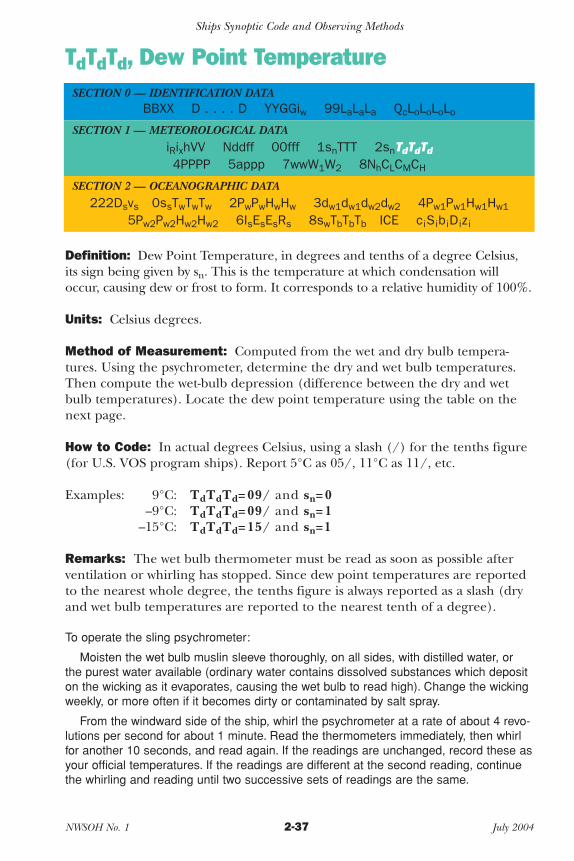
TdTdTd, Dew Point Temperature SECTION 0 — IDENTIFICATION DATA
BBXX D . . . . D YYGGiw 99LaLaLa QcLoLoLoLo
SECTION 1 — METEOROLOGICAL DATA iRixhVV Nddff 00fff 1snTTT 2snTdTdTd 4PPPP 5appp 7wwW1W2 8NhCLCMCH
SECTION 2 — OCEANOGRAPHIC DATA 222Dsvs 0ssTwTwTw 2PwPwHwHw 3dw1dw1dw2dw2 4Pw1Pw1Hw1Hw1
5Pw2Pw2Hw2Hw2 6IsEsEsRs 8swTbTbTb ICE ciSibiDizi
Definition: Dew Point Temperature, in degrees and tenths of a degree Celsius, its sign being given by sn. This is the temperature at which condensation will occur, causing dew or frost to form. It corresponds to a relative humidity of 100%.
Units: Celsius degrees.
Method of Measurement: Computed from the wet and dry bulb temperatures. Using the psychrometer, determine the dry and wet bulb temperatures. Then compute the wet-bulb depression (difference between the dry and wet bulb temperatures). Locate the dew point temperature using the table on the next page.
How to Code: In actual degrees Celsius, using a slash (/) for the tenths figure (for U.S. VOS program ships). Report 5°C as 05/, 11°C as 11/, etc.
Examples: 9°C: TdTdTd= 09/ and sn= 0 –9°C: TdTdTd= 09/ and sn= 1
–15°C: TdTdTd= 15/ and sn=1
Remarks: The wet bulb thermometer must be read as soon as possible after ventilation or whirling has stopped. Since dew point temperatures are reported to the nearest whole degree, the tenths figure is always reported as a slash (dry and wet bulb temperatures are reported to the nearest tenth of a degree).
To operate the sling psychrometer:
Moisten the wet bulb muslin sleeve thoroughly, on all sides, with distilled water, or the purest water available (ordinary water contains dissolved substances which deposit on the wicking as it evaporates, causing the wet bulb to read high). Change the wicking weekly, or more often if it becomes dirty or contaminated by salt spray.
From the windward side of the ship, whirl the psychrometer at a rate of about 4 revolutions per second for about 1 minute. Read the thermometers immediately, then whirl for another 10 seconds, and read again. If the readings are unchanged, record these as your official temperatures. If the readings are different at the second reading, continue the whirling and reading until two successive sets of readings are the same.
NWSOH No. 1 2-37 July 2004
2004Part2A.qxp 5/25/06 2:17 PM Page 2-38
Ships Synoptic Code and Observing Methods
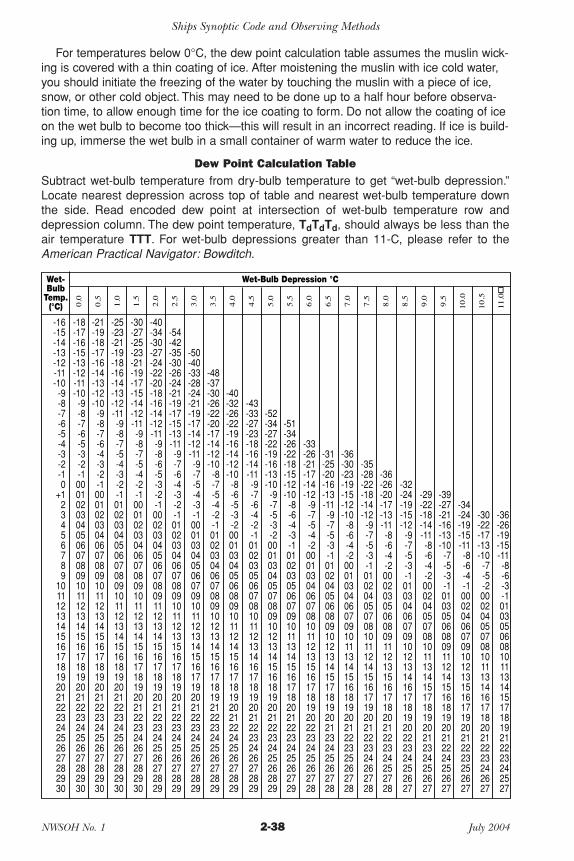
For temperatures below 0°C, the dew point calculation table assumes the muslin wicking is covered with a thin coating of ice. After moistening the muslin with ice cold water, you should initiate the freezing of the water by touching the muslin with a piece of ice, snow, or other cold object. This may need to be done up to a half hour before observation time, to allow enough time for the ice coating to form. Do not allow the coating of ice on the wet bulb to become too thick—this will result in an incorrect reading. If ice is building up, immerse the wet bulb in a small container of warm water to reduce the ice.
Dew Point Calculation Table Subtract wet-bulb temperature from dry-bulb temperature to get “wet-bulb depression.” Locate nearest depression across top of table and nearest wet-bulb temperature down the side. Read encoded dew point at intersection of wet-bulb temperature row and depression column. The dew point temperature, TdTdTd, should always be less than the air temperature TTT. For wet-bulb depressions greater than 11-C, please refer to the American Practical Navigator: Bowditch.
-16 -15 -14 -13 -12 -11 -10
-9 -8 -7 -6 -5 -4 -3 -2 -1 0
+1 2 3 4 5 6 7 8 9
10 11 12 13 14 15 16 17 18 19 20 21 22 23 24 25 26 27 28 29 30
Wet-Bulb
Temp. (°C)
-18 -21 -25 -30 -40 -17 -19 -23 -27 -34 -54 -16 -18 -21 -25 -30 -42 -15 -17 -19 -23 -27 -35 -13 -16 -18 -21 -24 -30 -12 -14 -16 -19 -22 -26 -11 -13 -14 -17 -20 -24 -10 -12 -13 -15 -18 -21
-9 -10 -12 -14 -16 -19 -8 -9 -11 -12 -14 -17 -7 -8 -9 -11 -12 -15 -6 -7 -8 -9 -11 -13 -5 -6 -7 -8 -9 -11 -3 -4 -5 -7 -8 -9 -2 -3 -4 -5 -6 -7 -1 -2 -3 -4 -5 -6 00 -1 -2 -2 -3 -4 01 00 -1 -1 -2 -3 02 01 01 00 -1 -2 03 02 02 01 00 -1 04 03 03 02 02 01 05 04 04 03 03 02 06 06 05 04 04 03 07 07 06 06 05 04 08 08 07 07 06 06 09 09 08 08 07 07 10 10 09 09 08 08 11 11 10 10 09 09 12 12 11 11 11 10 13 13 12 12 12 11 14 14 13 13 13 12 15 15 14 14 14 13 16 16 15 15 15 15 17 17 16 16 16 16 18 18 18 17 17 17 19 19 19 18 18 18 20 20 20 19 19 19 21 21 21 20 20 20 22 22 22 21 21 21 23 23 23 22 22 22 24 24 24 23 23 23 25 25 25 24 24 24 26 26 26 26 25 25 27 27 27 27 26 26 28 28 28 28 27 27 29 29 29 29 28 28 30 30 30 30 29 29
0.0
0.5
1.0
1.5
2.0
2.5
-50 -40 -33 -28 -24 -21 -19 -17 -14 -12 -11 -9 -7 -5 -4 -3 -1 00 01 03 04 05 06 07 09 10 11 12 13 14 15 16 17 19 20 21 22 23 24 25 26 27 28 29
3.0
-48 -37 -30 -40 -26 -32 -22 -26 -20 -22 -17 -19 -14 -16 -12 -14 -10 -12
-8 -10 -7 -8 -5 -6 -4 -5 -2 -3 -1 -2 01 00 02 01 03 03 04 04 06 05 07 06 08 08 09 09 10 10 12 11 13 12 14 14 15 15 16 16 17 17 18 18 19 19 21 20 22 21 23 22 24 24 25 25 26 26 27 27 28 28 29 29
3.5
4.0
-43 -33 -52 -27 -34 -51 -23 -27 -34 -18 -22 -26 -33 -16 -19 -22 -26 -31 -14 -16 -18 -21 -25 -11 -13 -15 -17 -20 -9 -10 -12 -14 -16 -7 -9 -10 -12 -13 -6 -7 -8 -9 -11 -4 -5 -6 -7 -9 -2 -3 -4 -5 -7 -1 -2 -3 -4 -5 01 00 -1 -2 -3 02 01 01 00 -1 03 03 02 01 01 05 04 03 03 02 06 05 05 04 04 07 07 06 06 05 08 08 07 07 06 10 09 09 08 08 11 10 10 10 09 12 12 11 11 10 13 13 13 12 12 14 14 14 13 13 16 15 15 15 14 17 16 16 16 15 18 18 17 17 17 19 19 18 18 18 20 20 20 19 19 21 21 21 20 20 22 22 22 22 21 23 23 23 23 23 24 24 24 24 24 26 25 25 25 25 27 26 26 26 26 28 28 27 27 27 29 29 29 28 28
Wet-Bulb Depression °C
4.5
5.0
5.5
6.0
6.5
-36 -30 -23 -19 -15 -12 -10 -8 -6 -4 -2 00 01 03 04 06 07 09 10 11 13 14 15 16 18 19 20 21 22 23 25 26 27 28
7.0
-35 -28 -22 -18 -14 -12 -9 -7 -5 -3 -1 01 02 04 05 07 08 10 11 12 14 15 16 17 19 20 21 22 23 24 26 27 28
7.5
-36 -26 -20 -17 -13 -11 -8 -6 -4 -2 00 02 03 05 06 08 09 11 12 13 15 16 17 18 20 21 22 23 24 25 27 28
8.0
-32 -24 -19 -15 -12
-9 -7 -5 -3 -1 01 03 04 06 07 09 10 12 13 14 16 17 18 19 20 22 23 24 25 26 27
8.5
-29 -22 -18 -14 -11 -8 -6 -4 -2 00 02 04 05 07 08 10 11 13 14 15 17 18 19 20 21 23 24 25 26 27
9.0
-39 -27 -21 -16 -13 -10
-7 -5 -3 -1 01 03 05 06 08 09 11 12 14 15 16 18 19 20 21 22 24 25 26 27
9.5
-34 -24 -19 -15 -11 -8 -6 -4 -1 00 02 04 06 07 09 10 12 13 15 16 17 19 20 21 22 23 25 26 27
10.0
-30 -22 -17 -13 -10
-7 -5 -2 00 02 04 05 07 08 10 11 13 14 16 17 18 20 21 22 23 24 26 27
10.5
-36 -26 -19 -15 -11 -8 -6 -3 -1 01 03 05 06 08 10 11 13 14 15 17 18 19 21 22 23 24 25 27
11.0
NWSOH No. 1 2-38 July 2004

2004Part2A.qxp 5/25/06 2:17 PM Page 2-39
Ships Synoptic Code and Observing Methods
PPPP, Sea Level Pressure 4, Sea Level Pressure Data Indicator
SECTION 0 — IDENTIFICATION DATA BBXX D . . . . D YYGGiw 99LaLaLa QcLoLoLoLo
SECTION 1 — METEOROLOGICAL DATA iRixhVV Nddff 00fff 1snTTT 2snTdTdTd
4PPPP 5appp 7wwW1W2 8NhCLCMCH
SECTION 2 — OCEANOGRAPHIC DATA 222Dsvs 0ssTwTwTw 2PwPwHwHw 3dw1dw1dw2dw2 4Pw1Pw1Hw1Hw1
5Pw2Pw2Hw2Hw2 6IsEsEsRs 8swTbTbTb ICE ciSibiDizi
Definition: PPPP is the atmospheric pressure at mean sea level, in tenths of a hectopascal (millibar), omitting the thousands digit. It represents the weight or force exerted by the air above a given point.
Units: Hectopascals ((hp) which are numerically the same as millibars).
Method of Measurement: Usually measured with a precision aneroid barometer, although a mercury barometer can also be used. Gently tap the face of the aneroid barometer just before measurement. To obtain an accurate reading, your eye should be level with the barometer face. The mercury in the tube of the mercury barometer will oscillate up and down. Average the high and low points of the oscillation before recording.
How to Code: Report the reading in actual hectopascals, omitting the decimal point. When the sea level pressure is 1000 hp or greater, the leading 1 is omitted.
Examples: 992.4 hp: PPPP = 9924 1000.0 hp: PPPP = 0000 1002.8 hp: PPPP = 0028 1032.1 hp: PPPP = 0321
Remarks: Great precision is required for the pressure measurement, and a PMO should calibrate your barometer once every three months. The PMO will attach a correction tab with a correction to sea level to be made before reporting. The barometer should be installed in a position where it is least likely to be affected by vibration, concussion, or movement of the ship (generally as close to the center of flotation as possible. The barograph should be installed with the pen arm installed athwart ship (parallel to beam), to minimize the risk of its swinging off the chart.
NWSOH No. 1 2-39 July 2004

2004Part2A.qxp 5/25/06 2:17 PM Page 2-40
Ships Synoptic Code and Observing Methods
Correcting Station Pressure to Sea Level Pressure (hp)
Height of Barometer Outside Air Temperature (°C)
m ft. –20 –10 0 10 20 30
1.5 5 0.2 0.2 0.2 0.2 0.2 0.2 3.0 10 0.4 0.4 0.4 0.4 0.4 0.3 4.6 15 0.6 0.6 0.6 0.6 0.5 0.5 6.1 20 0.8 0.8 0.8 0.7 0.7 0.7 7.8 25 1.0 1.0 1.0 0.9 0.9 0.9 9.1 30 1.2 1.2 1.2 1.1 1.1 1.0
10.7 35 1.5 1.4 1.4 1.3 1.3 1.2 12.2 40 1.7 1.6 1.5 1.5 1.4 1.4 13.7 45 1.9 1.8 1.7 1.7 1.6 1.6 15.2 50 2.1 2.0 1.9 1.9 1.8 1.7 16.8 55 2.3 2.2 2.1 2.0 2.0 1.9 18.3 60 2.5 2.4 2.3 2.2 2.2 2.1 19.8 65 2.7 2.6 2.5 2.4 2.3 2.3 21.3 70 2.9 2.8 2.7 2.6 2.5 2.4 22.9 75 3.1 2.9 2.8 2.7 2.6 2.5 24.4 80 3.3 3.2 3.1 3.0 2.9 2.8 25.9 85 3.5 3.4 3.3 3.2 3.1 3.0 27.4 90 3.8 3.6 3.5 3.4 3.2 3.1 29.0 95 4.0 3.8 3.7 3.5 3.4 3.3 30.5 100 4.2 4.0 3.9 3.7 3.6 3.5 32.0 105 4.4 4.2 4.1 3.9 3.8 3.7 33.5 110 4.6 4.4 4.2 4.1 4.0 3.8 35.1 115 4.8 4.6 4.4 4.3 4.1 4.0 36.6 120 5.0 4.8 4.6 4.5 4.3 4.2 38.2 125 5.2 5.0 4.8 4.7 4.5 4.3
Station pressure is the actual pressure at the level of the barometer.This table should only be used if your barometer has not been calibrated to read sealevel pressure, or if a PMO has not attached a correction sticker. This is normally thecase for vessels of British Commonwealth countries only.Barometers aboard NWS VOS program ships are calibrated to read sea level pressure.Any correction to be applied will be indicated on the correction sticker and this tableshould be ignored.For Great Lakes vessels: PMOs in Cleveland and Chicago calibrate your barometers toread sea level pressure using the elevation of Lake Erie in the correction factor. Fromother Great Lakes, to obtain sea level pressure you must know the difference in elevation between Lake Erie and the lake you are on, and add or subtract a correction.From Lake Huron or Lake Michigan (both 10 feet above Lake Erie), please add .4 hp(see table above) to your pressure reading before reporting. For Lake Superior (30 feetabove Lake Erie), add 1.1 hp. For Lake Ontario (325 feet below Lake Erie), subtract 12 hp.
NWSOH No. 1 2-40 July 2004

2004Part2A.qxp 5/25/06 2:17 PM Page 2-41
Ships Synoptic Code and Observing Methods
a, Three Hour Characteristic of Pressure Tendency
5, Three Hour Pressure Tendency Data Indicator
SECTION 0 — IDENTIFICATION DATA BBXX D . . . . D YYGGiw 99LaLaLa QcLoLoLoLo
SECTION 1 — METEOROLOGICAL DATA iRixhVV Nddff 00fff 1snTTT 2snTdTdTd
4PPPP 5appp 7wwW1W2 8NhCLCMCH
SECTION 2 — OCEANOGRAPHIC DATA 222Dsvs 0ssTwTwTw 2PwPwHwHw 3dw1dw1dw2dw2 4Pw1Pw1Hw1Hw1
5Pw2Pw2Hw2Hw2 6IsEsEsRs 8swTbTbTb ICE ciSibiDizi
Definition: (a) is the characteristic of pressure tendency during the three hours preceding the time of observation. It describes how pressure has varied, e.g. increasing then decreasing, decreasing then increasing, decreasing thensteady, etc.
Units: Hectopascals.
Method of Measurement: The barograph provides the best indication of the pressure tendency characteristic. Study the barograph trace in the three hour period preceding the time of observation. The shape of the trace determines which code figure to use.
How to Code: Code according to the table on the next page.
Remarks: The actual pressure change during the three hours preceding the time of observation is recorded by ppp.
1. Remember that:
(a) If the pressure is higher than three hours ago, there are four choices for a; 0, 1, 2, and 3.
(b) If the pressure is lower than three hours ago, there are also four choices for a; 5, 6, 7, and 8.
(c) If the pressure is exactly the same as it was three hours ago, there are three choices for a; 0, 4, and 5.
2. If the trace contains minor irregularities but in general resembles one of the pictures in the code Table, disregard the minor irregularities and code the general characteristics of the trace.
Examples: = 8 =3
NWSOH No. 1 2-41 July 2004

2004Part2A.qxp 5/25/06 2:17 PM Page 2-42
Ships Synoptic Code and Observing Methods
3. When the trace can apparently be represented by two characteristics, code the characteristics which describes the last part of the trace provided this agrees with the three-hour pressure change.
Examples: = 1 = 0
= 3 (not 5 as the pressure is now higher than 3 hours ago).
4. When the trace may apparently be represented by two characteristics and the characteristics of the last part of the trace does not agree with the 3-hour pressure change, choose the characteristics which is most descriptive of the whole 3-hour trace and which also agrees with the net 3-hour pressure change.
Examples: = 5 (not 1 as the pressure is
lower than 3 hours ago).
= 0 (not 8 as the pressure is higher than 3 hours ago).
= 0 (not 6 as the pressure is higher than 3 hours ago).
5. When the trace is not steady but the 3-hour pressure change is zero, use code figure 0 or 5 as appropriate for the last part of the trace (code figure 4 is only used when the trace is absolutely steady).
Examples: = 5 = 0
NWSOH No. 1 2-42 July 2004
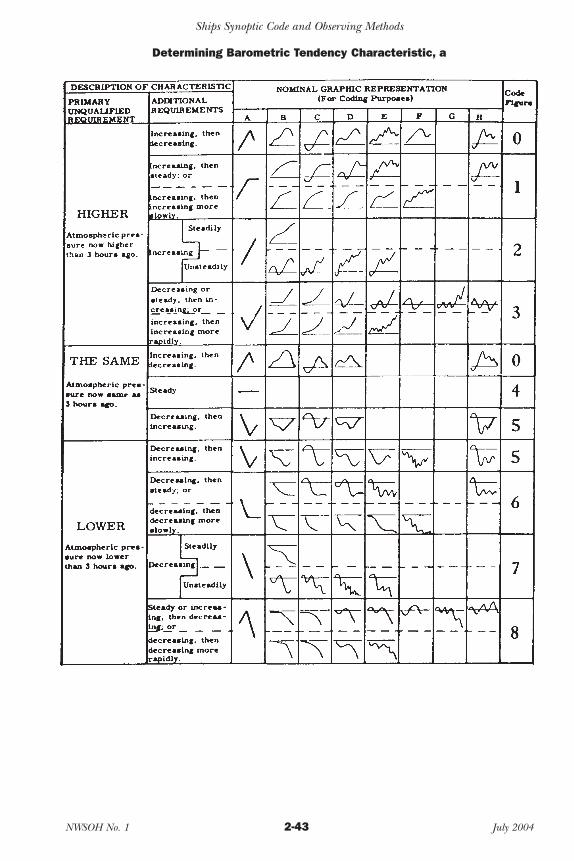
2004Part2A.qxp 5/25/06 2:17 PM Page 2-43
Ships Synoptic Code and Observing Methods
Determining Barometric Tendency Characteristic, a
NWSOH No. 1 2-43 July 2004

2004Part2A.qxp 5/25/06 2:17 PM Page 2-44
Ships Synoptic Code and Observing Methods
ppp, Amount of Pressure Tendency SECTION 0 — IDENTIFICATION DATA
BBXX D . . . . D YYGGiw 99LaLaLa QcLoLoLoLo
SECTION 1 — METEOROLOGICAL DATA iRixhVV Nddff 00fff 1snTTT 2snTdTdTd
4PPPP 5appp 7wwW1W2 8NhCLCMCH
SECTION 2 — OCEANOGRAPHIC DATA 222Dsvs 0ssTwTwTw 2PwPwHwHw 3dw1dw1dw2dw2 4Pw1Pw1Hw1Hw1
5Pw2Pw2Hw2Hw2 6IsEsEsRs 8swTbTbTb ICE ciSibiDizi
Definition: Amount of pressure tendency during the three hours preceding the time of observation, expressed in tenths of a hectopascal (millibar). This is the net pressure change during the three hour period.
Units: Hectopascals.
Method of Measurement: Either use the barograph trace, or read your barometer at the beginning and end of the three hour interval. Determine the difference in pressure and code according to the instructions below.
How to Code: In actual hectopascals.
Examples: 0.0 hp, ppp = 000 0.4 hp, ppp = 004 4.7 hp, ppp = 047
10.2 hp, ppp = 102
Remarks: If the pressure at time of observation is 1015.3 hp, and the pressure three hours earlier was 1012.9 hp, the net pressure change (amount of pressure tendency) was 2.4 hp. Code ppp as 024.
NWSOH No. 1 2-44 July 2004
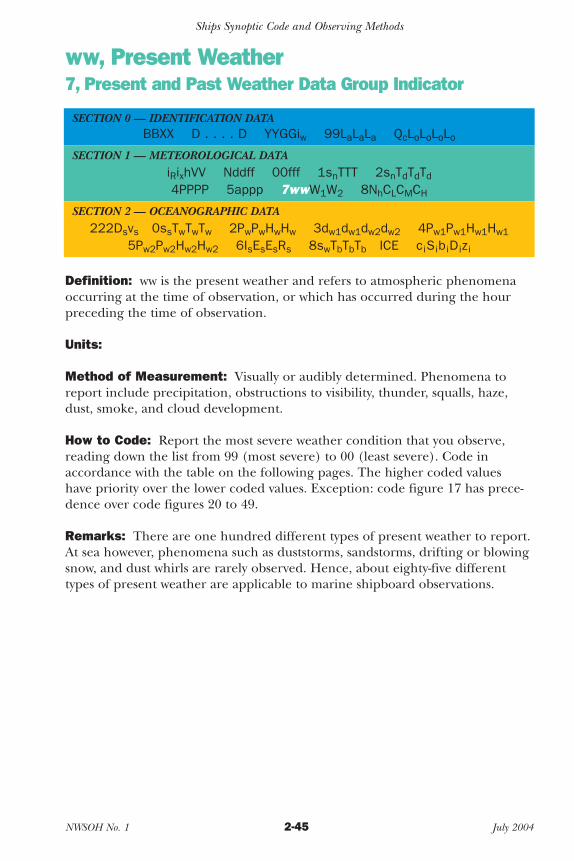
2004Part2A.qxp 5/25/06 2:17 PM Page 2-45
Ships Synoptic Code and Observing Methods
ww, Present Weather 7, Present and Past Weather Data Group Indicator
SECTION 0 — IDENTIFICATION DATA BBXX D . . . . D YYGGiw 99LaLaLa QcLoLoLoLo
SECTION 1 — METEOROLOGICAL DATA iRixhVV Nddff 00fff 1snTTT 2snTdTdTd
4PPPP 5appp 7wwW1W2 8NhCLCMCH
SECTION 2 — OCEANOGRAPHIC DATA 222Dsvs 0ssTwTwTw 2PwPwHwHw 3dw1dw1dw2dw2 4Pw1Pw1Hw1Hw1
5Pw2Pw2Hw2Hw2 6IsEsEsRs 8swTbTbTb ICE ciSibiDizi
Definition: ww is the present weather and refers to atmospheric phenomena occurring at the time of observation, or which has occurred during the hour preceding the time of observation.
Units:
Method of Measurement: Visually or audibly determined. Phenomena to report include precipitation, obstructions to visibility, thunder, squalls, haze, dust, smoke, and cloud development.
How to Code: Report the most severe weather condition that you observe, reading down the list from 99 (most severe) to 00 (least severe). Code in accordance with the table on the following pages. The higher coded values have priority over the lower coded values. Exception: code figure 17 has precedence over code figures 20 to 49.
Remarks: There are one hundred different types of present weather to report. At sea however, phenomena such as duststorms, sandstorms, drifting or blowing snow, and dust whirls are rarely observed. Hence, about eighty-five different types of present weather are applicable to marine shipboard observations.
NWSOH No. 1 2-45 July 2004
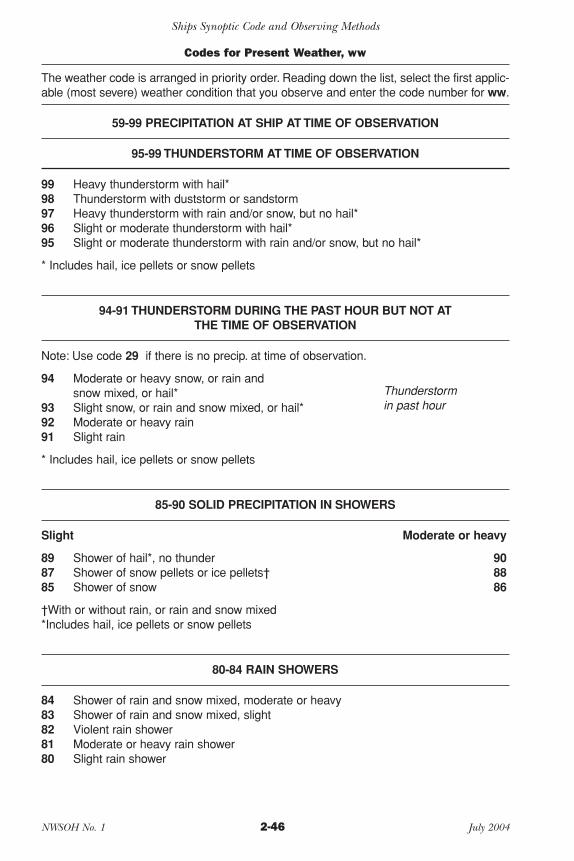
2004Part2A.qxp 5/25/06 2:17 PM Page 2-46
Ships Synoptic Code and Observing Methods
Codes for Present Weather, ww
The weather code is arranged in priority order. Reading down the list, select the first applicable (most severe) weather condition that you observe and enter the code number for ww.
59-99 PRECIPITATION AT SHIP AT TIME OF OBSERVATION
95-99 THUNDERSTORM AT TIME OF OBSERVATION
99 Heavy thunderstorm with hail* 98 Thunderstorm with duststorm or sandstorm 97 Heavy thunderstorm with rain and/or snow, but no hail* 96 Slight or moderate thunderstorm with hail* 95 Slight or moderate thunderstorm with rain and/or snow, but no hail*
* Includes hail, ice pellets or snow pellets
94-91 THUNDERSTORM DURING THE PAST HOUR BUT NOT AT THE TIME OF OBSERVATION
Note: Use code 29 if there is no precip. at time of observation.
94 Moderate or heavy snow, or rain and snow mixed, or hail* Thunderstorm
93 Slight snow, or rain and snow mixed, or hail* in past hour 92 Moderate or heavy rain 91 Slight rain
* Includes hail, ice pellets or snow pellets
85-90 SOLID PRECIPITATION IN SHOWERS
Slight Moderate or heavy
89 Shower of hail*, no thunder 90 87 Shower of snow pellets or ice pellets† 88 85 Shower of snow 86
†With or without rain, or rain and snow mixed *Includes hail, ice pellets or snow pellets
80-84 RAIN SHOWERS
84 Shower of rain and snow mixed, moderate or heavy 83 Shower of rain and snow mixed, slight 82 Violent rain shower 81 Moderate or heavy rain shower 80 Slight rain shower
NWSOH No. 1 2-46 July 2004
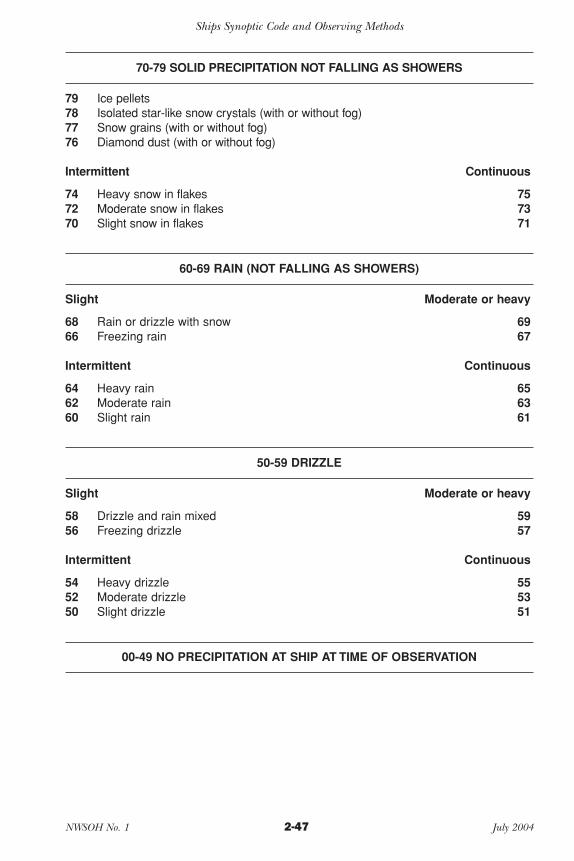
2004Part2A.qxp 5/25/06 2:17 PM Page 2-47
Ships Synoptic Code and Observing Methods
70-79 SOLID PRECIPITATION NOT FALLING AS SHOWERS
79 Ice pellets78 Isolated star-like snow crystals (with or without fog)77 Snow grains (with or without fog)76 Diamond dust (with or without fog)
Intermittent Continuous
74 Heavy snow in flakes 75 72 Moderate snow in flakes 73 70 Slight snow in flakes 71
60-69 RAIN (NOT FALLING AS SHOWERS)
Slight Moderate or heavy
68 Rain or drizzle with snow 69 66 Freezing rain 67
Intermittent Continuous
64 Heavy rain 65 62 Moderate rain 63 60 Slight rain 61
50-59 DRIZZLE
Slight Moderate or heavy
58 Drizzle and rain mixed 59 56 Freezing drizzle 57
Intermittent Continuous
54 Heavy drizzle 55 52 Moderate drizzle 53 50 Slight drizzle 51
00-49 NO PRECIPITATION AT SHIP AT TIME OF OBSERVATION
NWSOH No. 1 2-47 July 2004
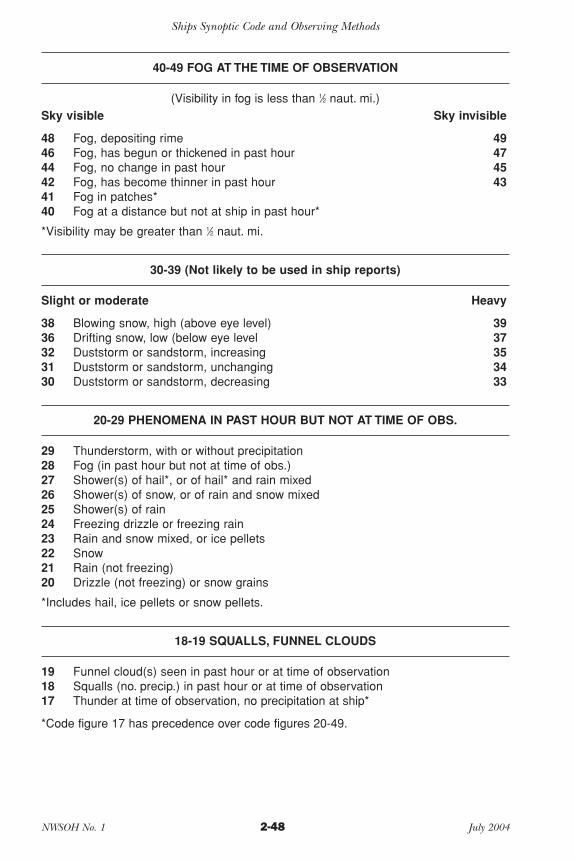
2004Part2A.qxp 5/25/06 2:17 PM Page 2-48
Ships Synoptic Code and Observing Methods
40-49 FOG AT THE TIME OF OBSERVATION
(Visibility in fog is less than 1⁄2 naut. mi.) Sky visible Sky invisible
48 Fog, depositing rime 49 46 Fog, has begun or thickened in past hour 47 44 Fog, no change in past hour 45 42 Fog, has become thinner in past hour 43 41 Fog in patches* 40 Fog at a distance but not at ship in past hour*
*Visibility may be greater than 1⁄ naut. mi. 2
30-39 (Not likely to be used in ship reports)
Slight or moderate Heavy
38 Blowing snow, high (above eye level) 39 36 Drifting snow, low (below eye level 37 32 Duststorm or sandstorm, increasing 35 31 Duststorm or sandstorm, unchanging 34 30 Duststorm or sandstorm, decreasing 33
20-29 PHENOMENA IN PAST HOUR BUT NOT AT TIME OF OBS.
29 Thunderstorm, with or without precipitation 28 Fog (in past hour but not at time of obs.) 27 Shower(s) of hail*, or of hail* and rain mixed 26 Shower(s) of snow, or of rain and snow mixed 25 Shower(s) of rain 24 Freezing drizzle or freezing rain 23 Rain and snow mixed, or ice pellets 22 Snow 21 Rain (not freezing) 20 Drizzle (not freezing) or snow grains
*Includes hail, ice pellets or snow pellets.
18-19 SQUALLS, FUNNEL CLOUDS
19 Funnel cloud(s) seen in past hour or at time of observation 18 Squalls (no. precip.) in past hour or at time of observation 17 Thunder at time of observation, no precipitation at ship*
*Code figure 17 has precedence over code figures 20-49.
NWSOH No. 1 2-48 July 2004
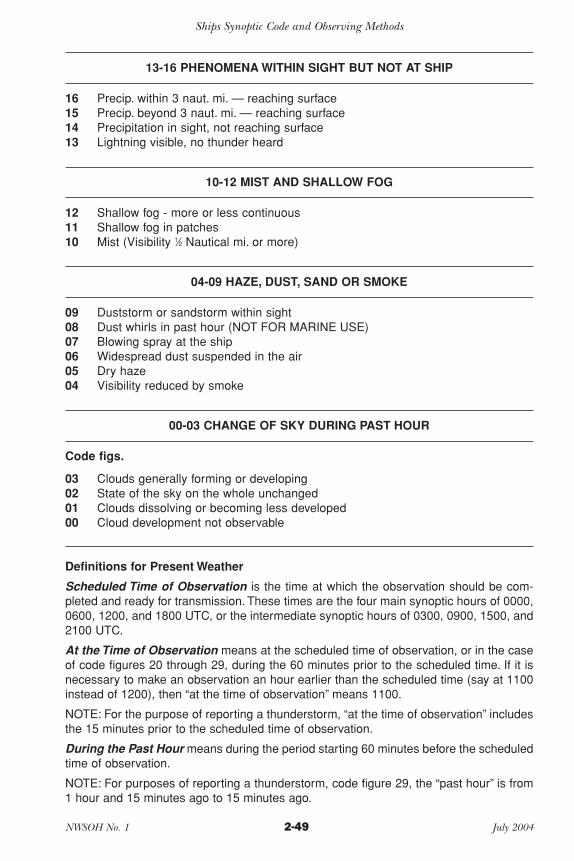
2004Part2A.qxp 5/25/06 2:17 PM Page 2-49
Ships Synoptic Code and Observing Methods
13-16 PHENOMENA WITHIN SIGHT BUT NOT AT SHIP
16 Precip. within 3 naut. mi. — reaching surface 15 Precip. beyond 3 naut. mi. — reaching surface 14 Precipitation in sight, not reaching surface 13 Lightning visible, no thunder heard
10-12 MIST AND SHALLOW FOG
12 Shallow fog - more or less continuous 11 Shallow fog in patches 10 Mist (Visibility 1⁄2 Nautical mi. or more)
04-09 HAZE, DUST, SAND OR SMOKE
09 Duststorm or sandstorm within sight 08 Dust whirls in past hour (NOT FOR MARINE USE) 07 Blowing spray at the ship 06 Widespread dust suspended in the air 05 Dry haze 04 Visibility reduced by smoke
00-03 CHANGE OF SKY DURING PAST HOUR
Code figs.
03 Clouds generally forming or developing 02 State of the sky on the whole unchanged 01 Clouds dissolving or becoming less developed 00 Cloud development not observable
Definitions for Present Weather
Scheduled Time of Observation is the time at which the observation should be completed and ready for transmission. These times are the four main synoptic hours of 0000, 0600, 1200, and 1800 UTC, or the intermediate synoptic hours of 0300, 0900, 1500, and 2100 UTC.
At the Time of Observation means at the scheduled time of observation, or in the case of code figures 20 through 29, during the 60 minutes prior to the scheduled time. If it is necessary to make an observation an hour earlier than the scheduled time (say at 1100 instead of 1200), then “at the time of observation” means 1100.
NOTE: For the purpose of reporting a thunderstorm, “at the time of observation” includes the 15 minutes prior to the scheduled time of observation.
During the Past Hour means during the period starting 60 minutes before the scheduled time of observation.
NOTE: For purposes of reporting a thunderstorm, code figure 29, the “past hour” is from 1 hour and 15 minutes ago to 15 minutes ago.
NWSOH No. 1 2-49 July 2004
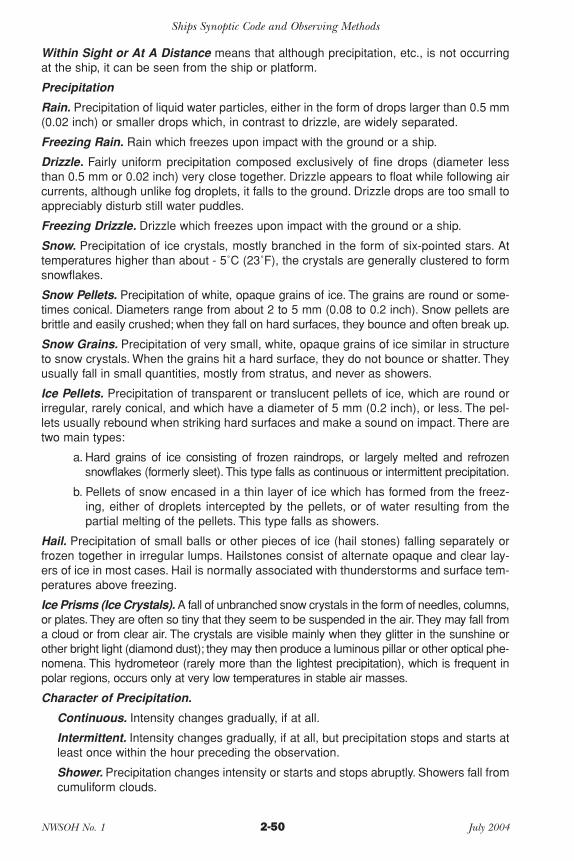
2004Part2A.qxp 5/25/06 2:17 PM Page 2-50
Ships Synoptic Code and Observing Methods
Within Sight or At A Distance means that although precipitation, etc., is not occurring at the ship, it can be seen from the ship or platform.
Precipitation
Rain. Precipitation of liquid water particles, either in the form of drops larger than 0.5 mm (0.02 inch) or smaller drops which, in contrast to drizzle, are widely separated.
Freezing Rain. Rain which freezes upon impact with the ground or a ship.
Drizzle. Fairly uniform precipitation composed exclusively of fine drops (diameter less than 0.5 mm or 0.02 inch) very close together. Drizzle appears to float while following air currents, although unlike fog droplets, it falls to the ground. Drizzle drops are too small to appreciably disturb still water puddles.
Freezing Drizzle. Drizzle which freezes upon impact with the ground or a ship.
Snow. Precipitation of ice crystals, mostly branched in the form of six-pointed stars. At temperatures higher than about - 5˚C (23˚F), the crystals are generally clustered to form snowflakes.
Snow Pellets. Precipitation of white, opaque grains of ice. The grains are round or sometimes conical. Diameters range from about 2 to 5 mm (0.08 to 0.2 inch). Snow pellets are brittle and easily crushed; when they fall on hard surfaces, they bounce and often break up.
Snow Grains. Precipitation of very small, white, opaque grains of ice similar in structure to snow crystals. When the grains hit a hard surface, they do not bounce or shatter. They usually fall in small quantities, mostly from stratus, and never as showers.
Ice Pellets. Precipitation of transparent or translucent pellets of ice, which are round or irregular, rarely conical, and which have a diameter of 5 mm (0.2 inch), or less. The pellets usually rebound when striking hard surfaces and make a sound on impact. There are two main types:
a. Hard grains of ice consisting of frozen raindrops, or largely melted and refrozen snowflakes (formerly sleet). This type falls as continuous or intermittent precipitation.
b. Pellets of snow encased in a thin layer of ice which has formed from the freezing, either of droplets intercepted by the pellets, or of water resulting from the partial melting of the pellets. This type falls as showers.
Hail. Precipitation of small balls or other pieces of ice (hail stones) falling separately or frozen together in irregular lumps. Hailstones consist of alternate opaque and clear layers of ice in most cases. Hail is normally associated with thunderstorms and surface temperatures above freezing.
Ice Prisms (Ice Crystals). A fall of unbranched snow crystals in the form of needles, columns, or plates. They are often so tiny that they seem to be suspended in the air. They may fall from a cloud or from clear air. The crystals are visible mainly when they glitter in the sunshine or other bright light (diamond dust); they may then produce a luminous pillar or other optical phenomena. This hydrometeor (rarely more than the lightest precipitation), which is frequent in polar regions, occurs only at very low temperatures in stable air masses.
Character of Precipitation.
Continuous. Intensity changes gradually, if at all.
Intermittent. Intensity changes gradually, if at all, but precipitation stops and starts at least once within the hour preceding the observation.
Shower. Precipitation changes intensity or starts and stops abruptly. Showers fall fromcumuliform clouds.
NWSOH No. 1 2-50 July 2004
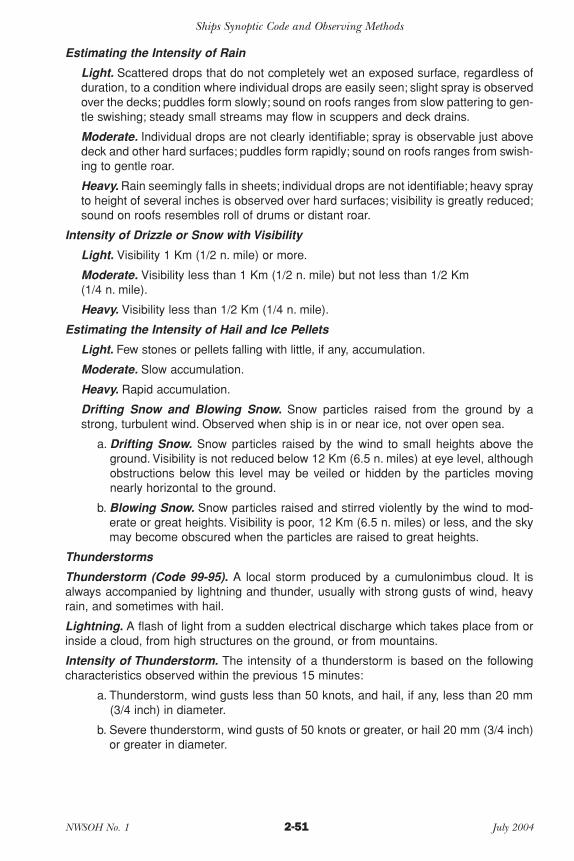
2004Part2A.qxp 5/25/06 2:17 PM Page 2-51
Ships Synoptic Code and Observing Methods
Estimating the Intensity of Rain
Light. Scattered drops that do not completely wet an exposed surface, regardless of duration, to a condition where individual drops are easily seen; slight spray is observed over the decks; puddles form slowly; sound on roofs ranges from slow pattering to gentle swishing; steady small streams may flow in scuppers and deck drains.
Moderate. Individual drops are not clearly identifiable; spray is observable just above deck and other hard surfaces; puddles form rapidly; sound on roofs ranges from swishing to gentle roar.
Heavy. Rain seemingly falls in sheets; individual drops are not identifiable; heavy spray to height of several inches is observed over hard surfaces; visibility is greatly reduced; sound on roofs resembles roll of drums or distant roar.
Intensity of Drizzle or Snow with Visibility
Light. Visibility 1 Km (1/2 n. mile) or more.
Moderate. Visibility less than 1 Km (1/2 n. mile) but not less than 1/2 Km (1/4 n. mile).
Heavy. Visibility less than 1/2 Km (1/4 n. mile).
Estimating the Intensity of Hail and Ice Pellets
Light. Few stones or pellets falling with little, if any, accumulation.
Moderate. Slow accumulation.
Heavy. Rapid accumulation.
Drifting Snow and Blowing Snow. Snow particles raised from the ground by a strong, turbulent wind. Observed when ship is in or near ice, not over open sea.
a. Drifting Snow. Snow particles raised by the wind to small heights above the ground. Visibility is not reduced below 12 Km (6.5 n. miles) at eye level, although obstructions below this level may be veiled or hidden by the particles moving nearly horizontal to the ground.
b. Blowing Snow. Snow particles raised and stirred violently by the wind to moderate or great heights. Visibility is poor, 12 Km (6.5 n. miles) or less, and the sky may become obscured when the particles are raised to great heights.
Thunderstorms
Thunderstorm (Code 99-95). A local storm produced by a cumulonimbus cloud. It is always accompanied by lightning and thunder, usually with strong gusts of wind, heavy rain, and sometimes with hail.
Lightning. A flash of light from a sudden electrical discharge which takes place from or inside a cloud, from high structures on the ground, or from mountains.
Intensity of Thunderstorm. The intensity of a thunderstorm is based on the following characteristics observed within the previous 15 minutes:
a. Thunderstorm, wind gusts less than 50 knots, and hail, if any, less than 20 mm (3/4 inch) in diameter.
b. Severe thunderstorm, wind gusts of 50 knots or greater, or hail 20 mm (3/4 inch) or greater in diameter.
NWSOH No. 1 2-51 July 2004
2004Part2A.qxp 5/25/06 2:17 PM Page 2-52
Ships Synoptic Code and Observing Methods
Beginning of Thunderstorm. A thunderstorm is considered to begin at a station when:
a. Thunder is heard, or
b. Overhead lightning or hail is observed, but the local noise level might prevent hearing thunder.
Ending of Thunderstorm. A thunderstorm is considered to have ended 15 minutes after the last occurrence of thunder.
Fog and Shallow Fog. A visible aggregate of minute water particles (droplets) which are based at the earth’s surface. The difference between a cloud and fog is that a cloud has a base above the surface.
a. Fog (code 40-49) reduces horizontal visibility (to less than 1/2 n. mile) and verticle visibility, and may extend over a sizable area. Fog is reported when the depth of the phenomena is greater than approximately 10 meters (33 feet) at sea.
b. Shallow fog has little vertical extent, normally less than 10 meters (33 feet), and reduces visibility horizontally, but to a lesser extent vertically. The stars may often be seen by night and the sun by day. This is a local phenomena usually formed by radiational cooling of the air. It is often patchy, forming first over cooler surface water areas.
c. When fog is present and the occurrence does not clearly fit the definition of shallow fog, the phenomenon will be reported as fog. If visibility is greater than 1/2 n. mile, it is mist, code 10.
Ice Fog. A suspension of numerous minute ice crystals in the air, based at the earth’s surface, which reduces horizontal visibility. Unlike fog, ice fog does not produce rime or glaze on cold exposed objects. Temperatures are usually at or below approximately –30˚C (–22˚F) when ice fog forms. However, a mixture of liquid and ice fog occasionally forms at temperatures below freezing. This condition may persist for a few hours as the fog changes to ice fog and dissipates due to a drying of the air, even though temperatures continue to fall. Optical effects similar to those associated with ice prisms are observed in ice fog (diamond dust, etc.).
Temperature-dew point differences may approach 4˚C (8˚F) or more.
Spray and Blowing Spray.
a. Spray. Water droplets torn by the wind from the crests of waves and carried up a short distance into the air.
b. Blowing Spray. Spray raised in such quantities as to reduce the visibility at eye level (6 feet on shore, 10 meters (33 feet) at sea) to 12 Km (6.5 n. miles) or less.
Dew. A deposit of water drops on objects at or near the surface produced by condensation of water vapor from the surrounding clear air.
White Dew. A deposit of white, frozen dew drops. White dew forms as liquid dew, then freezes.
Hoar Frost. A deposit of ice having a crystalline appearance, generally assuming the form of scales, needles, or fans. It is formed when water vapor is deposited on surfaces whose temperatures are at or below freezing, as compared to white dew, which is formed before freezing occurs.
Rime. A deposit of ice, produced by fog at temperatures below freezing. It is composed of grains separated by air, sometimes adorned with crystalline branches.
NWSOH No. 1 2-52 July 2004

2004Part2A.qxp 5/25/06 2:17 PM Page 2-53
Ships Synoptic Code and Observing Methods
Glaze (Clear Ice). A coating of ice, generally clear and smooth, but with some air pockets. It is formed on exposed objects at temperatures below or slightly above the freezing temperature by the freezing of super-cooled drizzle, rain drops, or spray. Glaze is denser, harder, and more transparent than either rime or hoar frost.
Tornado. A violent, rotating column of air, forming a pendant, usually from a cumulonimbus cloud over land and touching the ground. It nearly always starts as a funnel cloud and is accompanied by a loud roaring noise.
Funnel Cloud. A violent, rotating column of air which does not touch the ground, usually a pendant from a cumulonimbus cloud.
Waterspout. If a funnel cloud forms over the water and touches the water surface, it is called a waterspout.
Lithometeors. A lithometeor is a meteor consisting of a visible concentration of mostly solid, dry particles. The particles are more or less suspended in the air or lifted from the ground by wind. The more common lithometeors are defined below.
Haze. A suspension in the air of extremely small, dry particles invisible to the naked eye and sufficiently numerous to give the air an opalescent appearance. This phenomenon resembles a uniform veil that subdues all colors. Dark objects viewed through this veil tend to have a bluish tinge while bright objects, such as the sun or distant lights, tend to have a dirty yellow or reddish hue.
When haze is present and the sun is well above the horizon, its light may have a peculiar silvery tinge. Haze particles may be composed of a variety of substances; e.g., dust, salt, residue from distant fires or volcanoes, pollen, etc., which generally are well diffused through the atmosphere.
Dust. Fine particles suspended in the air by a duststorm or sandstorm that may have occurred at some distance from the ship. Dust gives a tan or gray tinge to distant objects. The sun’s disk is pale and colorless, or has a yellow tinge.
Smoke. A suspension in the air of small particles produced by combustion. This phenomenon may be present either near the earth’s surface or in the free atmosphere. When viewed through smoke, the disk of the sun at sunrise and sunset appears very red. The disk may have an orange tinge when the sun is above the horizon. Evenly distributed smoke from distant sources generally has a light grayish or bluish appearance. A transition to haze may occur when smoke particles have traveled great distances; for example, 25 to 100 miles or more, and when the larger particles have settled and the remaining particles have become widely scattered through the atmosphere.
Blowing Dust. Dust raised by the wind to moderate heights above the ground and restricting horizontal visibility to less than 12 Km (6.5 n. miles).
a. Duststorm. Same as blowing dust, except visibility is reduced to less than 1 Km (1/2 nautical mile) but not less than 1/2 Km (1/4 n. mile).
b. Severe Duststorm. Same as blowing dust, except visibility is reduced to less than 1/2 Km (1/4 n. mile).
Blowing Sand. Sand raised by the wind to moderate heights above the ground, reducing horizontal visibility to less than 12 Km (6.5 n. miles).
a. Sandstorm. Same as blowing sand, except horizontal visibility is reduced to less than 1 Km (1/2 n. mile) but not less than 1/2 Km (1/4 n. mile).
b. Severe Sandstorm. Same as blowing sand, except horizontal visibility is reduced to less than 1/2 Km (1/4 n. mile).
NWSOH No. 1 2-53 July 2004

2004Part2B.qxp 5/25/06 2:19 PM Page 1
Ships Synoptic Code and Observing Methods
Glaze (Clear Ice). A coating of ice, generally clear and smooth, but with some air pockets. It is formed on exposed objects at temperatures below or slightly above the freezing temperature by the freezing of super-cooled drizzle, rain drops, or spray. Glaze is denser, harder, and more transparent than either rime or hoar frost.
Tornado. A violent, rotating column of air, forming a pendant, usually from a cumulonimbus cloud over land and touching the ground. It nearly always starts as a funnel cloud and is accompanied by a loud roaring noise.
Funnel Cloud. A violent, rotating column of air which does not touch the ground, usually a pendant from a cumulonimbus cloud.
Waterspout. If a funnel cloud forms over the water and touches the water surface, it is called a waterspout.
Lithometeors. A lithometeor is a meteor consisting of a visible concentration of mostly solid, dry particles. The particles are more or less suspended in the air or lifted from the ground by wind. The more common lithometeors are defined below.
Haze. A suspension in the air of extremely small, dry particles invisible to the naked eye and sufficiently numerous to give the air an opalescent appearance. This phenomenon resembles a uniform veil that subdues all colors. Dark objects viewed through this veil tend to have a bluish tinge while bright objects, such as the sun or distant lights, tend to have a dirty yellow or reddish hue.
When haze is present and the sun is well above the horizon, its light may have a peculiar silvery tinge. Haze particles may be composed of a variety of substances; e.g., dust, salt, residue from distant fires or volcanoes, pollen, etc., which generally are well diffused through the atmosphere.
Dust. Fine particles suspended in the air by a duststorm or sandstorm that may have occurred at some distance from the ship. Dust gives a tan or gray tinge to distant objects. The sun’s disk is pale and colorless, or has a yellow tinge.
Smoke. A suspension in the air of small particles produced by combustion. This phenomenon may be present either near the earth’s surface or in the free atmosphere. When viewed through smoke, the disk of the sun at sunrise and sunset appears very red. The disk may have an orange tinge when the sun is above the horizon. Evenly distributed smoke from distant sources generally has a light grayish or bluish appearance. A transition to haze may occur when smoke particles have traveled great distances; for example, 25 to 100 miles or more, and when the larger particles have settled and the remaining particles have become widely scattered through the atmosphere.
Blowing Dust. Dust raised by the wind to moderate heights above the ground and restricting horizontal visibility to less than 12 Km (6.5 n. miles).
a. Duststorm. Same as blowing dust, except visibility is reduced to less than 1 Km (1/2 nautical mile) but not less than 1/2 Km (1/4 n. mile).
b. Severe Duststorm. Same as blowing dust, except visibility is reduced to less than 1/2 Km (1/4 n. mile).
Blowing Sand. Sand raised by the wind to moderate heights above the ground, reducing horizontal visibility to less than 12 Km (6.5 n. miles).
a. Sandstorm. Same as blowing sand, except horizontal visibility is reduced to less than 1 Km (1/2 n. mile) but not less than 1/2 Km (1/4 n. mile).
b. Severe Sandstorm. Same as blowing sand, except horizontal visibility is reduced to less than 1/2 Km (1/4 n. mile).
NWSOH No. 1 2-53 July 2004

2004Part2B.qxp 5/25/06 2:19 PM Page 2-54
Ships Synoptic Code and Observing Methods
W1W2, Past Weather SECTION 0 — IDENTIFICATION DATA
BBXX D . . . . D YYGGiw 99LaLaLa QcLoLoLoLo
SECTION 1 — METEOROLOGICAL DATA iRixhVV Nddff 00fff 1snTTT 2snTdTdTd
4PPPP 5appp 7wwW1W2 8NhCLCMCH
SECTION 2 — OCEANOGRAPHIC DATA 222Dsvs 0ssTwTwTw 2PwPwHwHw 3dw1dw1dw2dw2 4Pw1Pw1Hw1Hw1
5Pw2Pw2Hw2Hw2 6IsEsEsRs 8swTbTbTb ICE ciSibiDizi
Definition: The types of weather since the previous main synoptic hour (0000, 0600, 1200, 1800 UTC), usually different from that being reported by ww. Thus, for an observation made at 1200 UTC, the past weather period began six hours ago at 0600 UTC. For an observation made at an intermediate time, say 2100 UTC, the past weather period began three hours ago at 1800 UTC.
Units:
Method of Measurement: Visually or audibly determined.
How to Code: If two or more different types of reportable weather have occurred, use W1 for the highest code figure, and W2 for the second highest code figure. If the past weather has been continuous and unchanging since the last main synoptic hour, W1 and W2 are coded the same. W1 is always greater than or equal to W2.
Code for Past Weather, W1W2
Code Figures
9 Thunderstorm(s) with or without precipitation 8 Shower(s) 7 Snow, or rain and snow mixed 6 Rain 5 Drizzle 4 Fog, ice fog, or thick haze (visibility was less than 1⁄2 nautical mile) 3 Sandstorm, duststorm, or blowing snow 2 Cloud cover more than 1⁄2 throughout period 1 Cloud cover more than 1⁄2 for part of period, and 1⁄2 or less for
another part of period 0 Cloud cover 1⁄2 or less throughout period
NWSOH No. 1 2-54 July 2004
2004Part2B.qxp 5/25/06 2:19 PM Page 2-55
Ships Synoptic Code and Observing Methods
Remarks: Some examples:
(1) It has been raining during the entire period since the last main synoptichour. Code W1W2 as 66.
(2) During the past six hours thunder was heard (code figure 9), and up untilabout one hour ago there were showers (code figure 8). Code W1W2 as 98.
(3) It has been cloudy since the previous main synoptic hour (code figure 2). Itrained for about an hour (code figure 6). There was some fog (code figure 4) and there were some showers (code figure 8). CodeW1W2 as 86.
NWSOH No. 1 2-55 July 2004

2004Part2B.qxp 5/25/06 2:19 PM Page 2-56
Ships Synoptic Code and Observing Methods
Nh, Amount of CL or CM Cloud Present 8, Cloud Data Indicator
SECTION 0 — IDENTIFICATION DATA BBXX D . . . . D YYGGiw 99LaLaLa QcLoLoLoLo
SECTION 1 — METEOROLOGICAL DATA iRixhVV Nddff 00fff 1snTTT 2snTdTdTd
4PPPP 5appp 7wwW1W2 8NhCLCMCH
SECTION 2 — OCEANOGRAPHIC DATA 222Dsvs 0ssTwTwTw 2PwPwHwHw 3dw1dw1dw2dw2 4Pw1Pw1Hw1Hw1
5Pw2Pw2Hw2Hw2 6IsEsEsRs 8swTbTbTb ICE ciSibiDizi
Definition: Nh is the amount of all the CL cloud present or, if no CL cloud ispresent, the amount of all the CM cloud present.
Units: Fraction of the sky in eighths.
Method of Measurement: Visual observation.
How to Code:
Code for Amount of CL or CM Cloud Present, Nh
Code Figures
0 No CL or CM clouds present 1 1 eighth or less, but not zero 2 2 eighths 3 3 eighths 4 4 eighths 5 5 eighths 6 6 eighths 7 7 eighths or more but not totally covered 8 8 eighths; sky totally covered 9 Sky obscured by fog, snow, or other meteorological phenomena / Cloud cover indiscernible for reasons other than code figure 9,
or observation not made
Remarks: If the cloud can be seen through the fog, estimate cloud amount as well as circumstances permit. If the sun, moon, or stars can be seen through the fog and there is no evidence of cloud above the fog, use code figure 0 for Nh.
NWSOH No. 1 2-56 July 2004
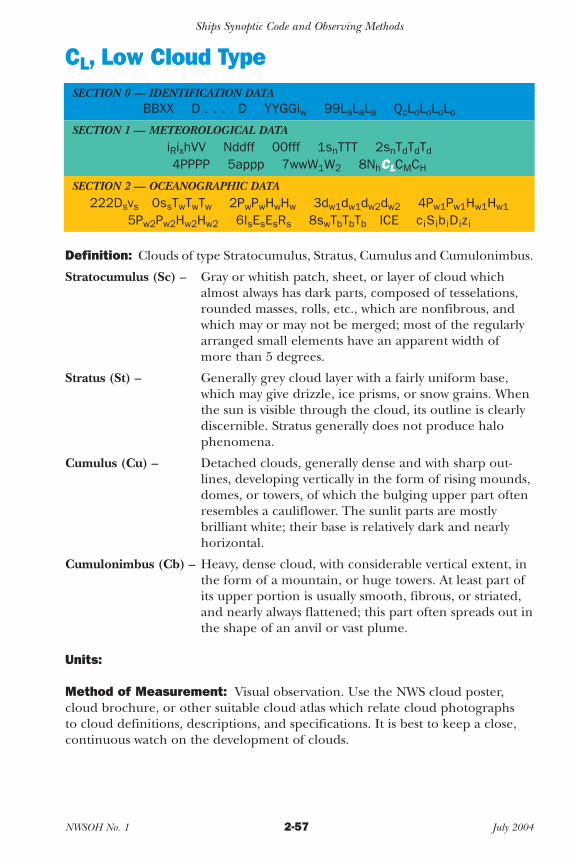
2004Part2B.qxp 5/25/06 2:19 PM Page 2-57
Ships Synoptic Code and Observing Methods
CL, Low Cloud Type SECTION 0 — IDENTIFICATION DATA
BBXX D . . . . D YYGGiw 99LaLaLa QcLoLoLoLo
SECTION 1 — METEOROLOGICAL DATA iRixhVV Nddff 00fff 1snTTT 2snTdTdTd
4PPPP 5appp 7wwW1W2 8NhCLCMCH
SECTION 2 — OCEANOGRAPHIC DATA 222Dsvs 0ssTwTwTw 2PwPwHwHw 3dw1dw1dw2dw2 4Pw1Pw1Hw1Hw1
5Pw2Pw2Hw2Hw2 6IsEsEsRs 8swTbTbTb ICE ciSibiDizi
Definition: Clouds of type Stratocumulus, Stratus, Cumulus and Cumulonimbus.
Stratocumulus (Sc) – Gray or whitish patch, sheet, or layer of cloud which almost always has dark parts, composed of tesselations, rounded masses, rolls, etc., which are nonfibrous, and which may or may not be merged; most of the regularly arranged small elements have an apparent width of more than 5 degrees.
Stratus (St) – Generally grey cloud layer with a fairly uniform base, which may give drizzle, ice prisms, or snow grains. When the sun is visible through the cloud, its outline is clearly discernible. Stratus generally does not produce halo phenomena.
Cumulus (Cu) – Detached clouds, generally dense and with sharp outlines, developing vertically in the form of rising mounds, domes, or towers, of which the bulging upper part often resembles a cauliflower. The sunlit parts are mostly brilliant white; their base is relatively dark and nearly horizontal.
Cumulonimbus (Cb) – Heavy, dense cloud, with considerable vertical extent, in the form of a mountain, or huge towers. At least part of its upper portion is usually smooth, fibrous, or striated, and nearly always flattened; this part often spreads out in the shape of an anvil or vast plume.
Units:
Method of Measurement: Visual observation. Use the NWS cloud poster, cloud brochure, or other suitable cloud atlas which relate cloud photographs to cloud definitions, descriptions, and specifications. It is best to keep a close, continuous watch on the development of clouds.
NWSOH No. 1 2-57 July 2004
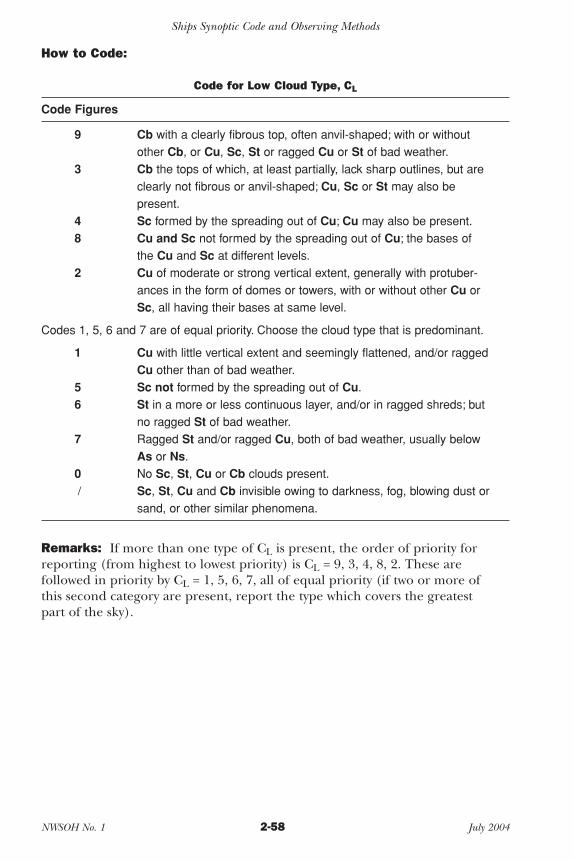
2004Part2B.qxp 5/25/06 2:19 PM Page 2-58
Ships Synoptic Code and Observing Methods
How to Code:
Code for Low Cloud Type, CL
Code Figures
9 Cb with a clearly fibrous top, often anvil-shaped; with or without other Cb, or Cu, Sc, St or ragged Cu or St of bad weather.
3 Cb the tops of which, at least partially, lack sharp outlines, but are clearly not fibrous or anvil-shaped; Cu, Sc or St may also be present.
4 Sc formed by the spreading out of Cu; Cu may also be present. 8 Cu and Sc not formed by the spreading out of Cu; the bases of
the Cu and Sc at different levels. 2 Cu of moderate or strong vertical extent, generally with protuber
ances in the form of domes or towers, with or without other Cu or Sc, all having their bases at same level.
Codes 1, 5, 6 and 7 are of equal priority. Choose the cloud type that is predominant.
1 Cu with little vertical extent and seemingly flattened, and/or ragged Cu other than of bad weather.
5 Sc not formed by the spreading out of Cu. 6 St in a more or less continuous layer, and/or in ragged shreds; but
no ragged St of bad weather. 7 Ragged St and/or ragged Cu, both of bad weather, usually below
As or Ns. 0 No Sc, St, Cu or Cb clouds present. / Sc, St, Cu and Cb invisible owing to darkness, fog, blowing dust or
sand, or other similar phenomena.
Remarks: If more than one type of CL is present, the order of priority for reporting (from highest to lowest priority) is CL = 9, 3, 4, 8, 2. These are followed in priority by CL = 1, 5, 6, 7, all of equal priority (if two or more of this second category are present, report the type which covers the greatest part of the sky).
NWSOH No. 1 2-58 July 2004
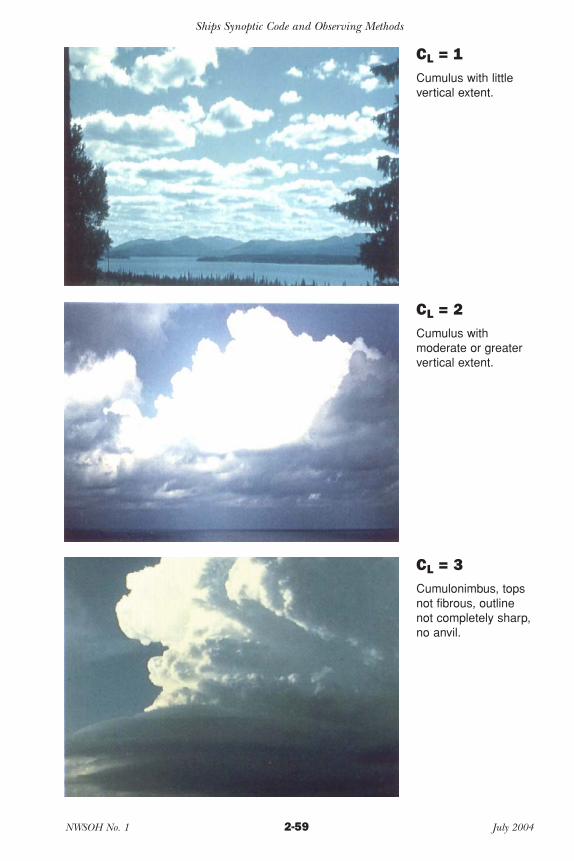
2004Part2B.qxp 5/25/06 2:19 PM Page 2-59
Ships Synoptic Code and Observing Methods
CL = 1 Cumulus with little vertical extent.
CL = 2 Cumulus with moderate or greater vertical extent.
CL = 3 Cumulonimbus, tops not fibrous, outline not completely sharp, no anvil.
NWSOH No. 1 2-59 July 2004
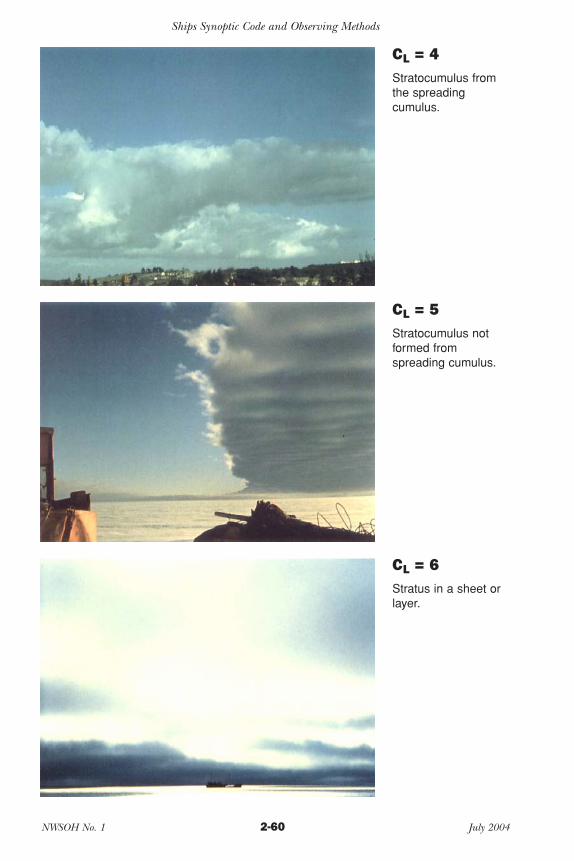
2004Part2B.qxp 5/25/06 2:19 PM Page 2-60
Ships Synoptic Code and Observing Methods
CL = 4 Stratocumulus from the spreading cumulus.
CL = 5 Stratocumulus not formed from spreading cumulus.
CL = 6 Stratus in a sheet or layer.
NWSOH No. 1 2-60 July 2004
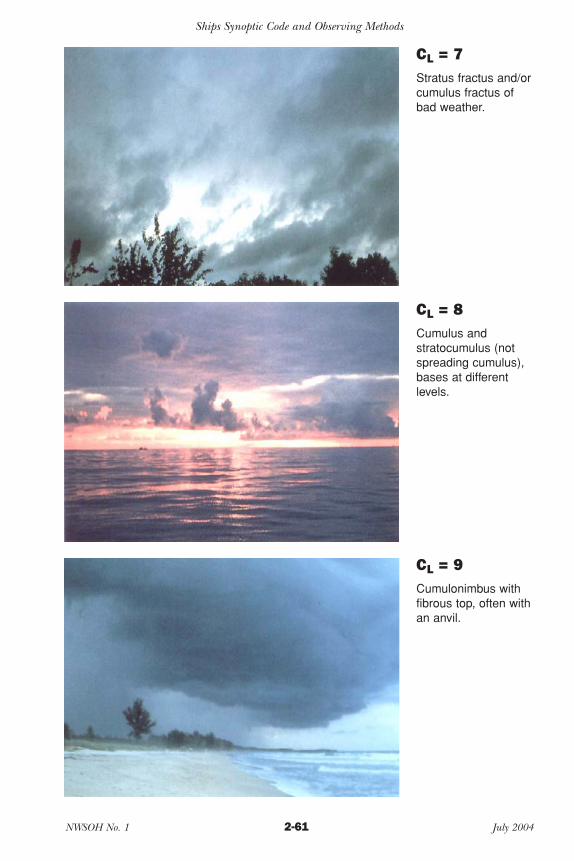
2004Part2B.qxp 5/25/06 2:19 PM Page 2-61
Ships Synoptic Code and Observing Methods
CL = 7 Stratus fractus and/or cumulus fractus of bad weather.
CL = 8 Cumulus and stratocumulus (not spreading cumulus), bases at different levels.
CL = 9 Cumulonimbus with fibrous top, often with an anvil.
NWSOH No. 1 2-61 July 2004
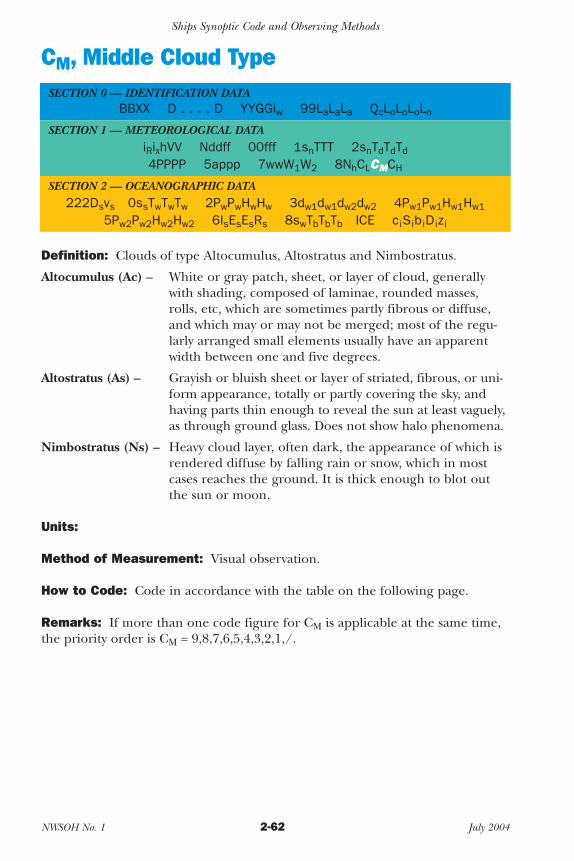
2004Part2B.qxp 5/25/06 2:19 PM Page 2-62
Ships Synoptic Code and Observing Methods
CM, Middle Cloud Type SECTION 0 — IDENTIFICATION DATA
BBXX D . . . . D YYGGiw 99LaLaLa QcLoLoLoLo
SECTION 1 — METEOROLOGICAL DATA iRixhVV Nddff 00fff 1snTTT 2snTdTdTd
4PPPP 5appp 7wwW1W2 8NhCLCMCH
SECTION 2 — OCEANOGRAPHIC DATA 222Dsvs 0ssTwTwTw 2PwPwHwHw 3dw1dw1dw2dw2 4Pw1Pw1Hw1Hw1
5Pw2Pw2Hw2Hw2 6IsEsEsRs 8swTbTbTb ICE ciSibiDizi
Definition: Clouds of type Altocumulus, Altostratus and Nimbostratus.
Altocumulus (Ac) – White or gray patch, sheet, or layer of cloud, generally with shading, composed of laminae, rounded masses, rolls, etc, which are sometimes partly fibrous or diffuse, and which may or may not be merged; most of the regularly arranged small elements usually have an apparent width between one and five degrees.
Altostratus (As) – Grayish or bluish sheet or layer of striated, fibrous, or uniform appearance, totally or partly covering the sky, and having parts thin enough to reveal the sun at least vaguely, as through ground glass. Does not show halo phenomena.
Nimbostratus (Ns) – Heavy cloud layer, often dark, the appearance of which is rendered diffuse by falling rain or snow, which in most cases reaches the ground. It is thick enough to blot out the sun or moon.
Units:
Method of Measurement: Visual observation.
How to Code: Code in accordance with the table on the following page.
Remarks: If more than one code figure for CM is applicable at the same time, the priority order is CM = 9,8,7,6,5,4,3,2,1,/.
NWSOH No. 1 2-62 July 2004
2004Part2B.qxp 5/25/06 2:19 PM Page 2-63
Ships Synoptic Code and Observing Methods
Code for Middle Cloud Type, CM
Code Figures
9 Ac of a chaotic sky, generally at several levels. 8 Ac with sproutings like small towers or battlements, or Ac having
the appearance cumulus-shaped tufts. 7 Either: (a) Ac in two or more layers, opaque in places, not increasing.
(b) Opaque layer of Ac, not increasing. (c) Ac together with As or Ns. 6 Ac resulting from the spreading out of Cu (or Cb). 5 Ac, semi-transparent; in bands or Ac in one or more layers, progres
sively invading the sky; these Ac clouds generally thicken as a whole. 4 Patches (often almond or fish-shaped) of Ac, mostly semi-trans-
parent; clouds occur at one or more levels and continually change in appearance.
3 Ac, mostly semi-transparent; cloud elements change only slowly and are all at a single level..
2 Either As, most of which is sufficiently dense to hide the sun or moon; or Nimbostratus.
1 Ac, mostly semi-transparent, through which the sun or moon may be weakly visible, as through ground glass.
0 No Ac, As or Ns clouds present / Ac, As, and Ns invisible owing to darkness, or because of an over
cast layer of CL cloud.
NWSOH No. 1 2-63 July 2004

2004Part2B.qxp 5/25/06 2:19 PM Page 2-64
Ships Synoptic Code and Observing Methods
CM = 1 Altostratus, semitransparent, sun or moon dimly visible.
CM = 2 Altostratus, dense enough to hide sun or moon, or nimbostratus.
CM = 3 Altocumulus, semitransparent, cloud elements change slowly, one level.
NWSOH No. 1 2-64 July 2004

2004Part2B.qxp 5/25/06 2:19 PM Page 2-65
Ships Synoptic Code and Observing Methods
CM = 4 Altocumulus patches semi-transparent, multilevel, cloud elements changing. Also altocumulus lenticular.
CM = 5 Altocumulus, one or more bands or layers, expanding, thickening.
CM = 6 Altocumulus from the spreading of cumulus or cumulonimbus.
NWSOH No. 1 2-65 July 2004
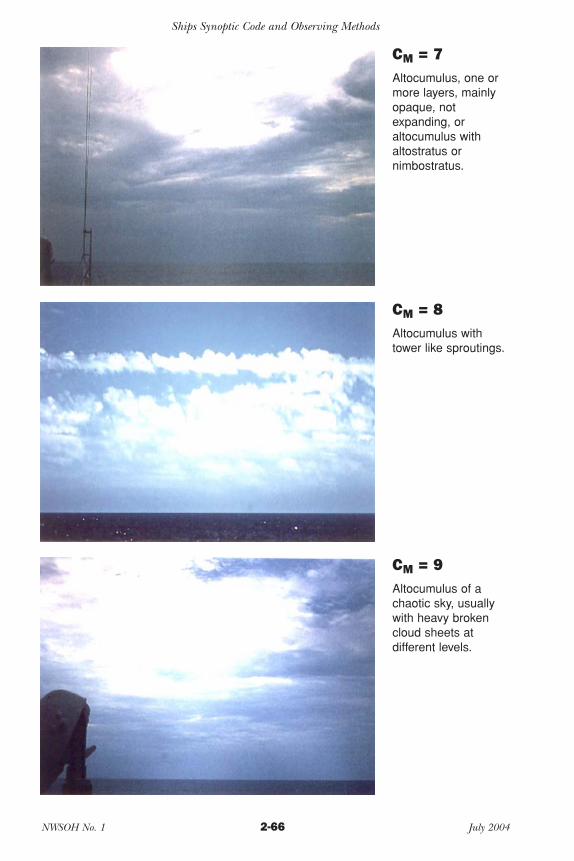
2004Part2B.qxp 5/25/06 2:19 PM Page 2-66
Ships Synoptic Code and Observing Methods
CM = 7 Altocumulus, one or more layers, mainly opaque, not expanding, or altocumulus with altostratus or nimbostratus.
CM = 8 Altocumulus with tower like sproutings.
CM = 9 Altocumulus of a chaotic sky, usually with heavy broken cloud sheets at different levels.
NWSOH No. 1 2-66 July 2004
2004Part2B.qxp 5/25/06 2:19 PM Page 2-67
Ships Synoptic Code and Observing Methods
CH, High Cloud Type SECTION 0 — IDENTIFICATION DATA
BBXX D . . . . D YYGGiw 99LaLaLa QcLoLoLoLo
SECTION 1 — METEOROLOGICAL DATA iRixhVV Nddff 00fff 1snTTT 2snTdTdTd
4PPPP 5appp 7wwW1W2 8NhCLCMCH
SECTION 2 — OCEANOGRAPHIC DATA 222Dsvs 0ssTwTwTw 2PwPwHwHw 3dw1dw1dw2dw2 4Pw1Pw1Hw1Hw1
5Pw2Pw2Hw2Hw2 6IsEsEsRs 8swTbTbTb ICE ciSibiDizi
Definition: Clouds of type Cirrus, Cirrocumulus, Cirrostratus.
Cirrus (Ci) – Detached clouds in the form of delicate white filaments or white or mostly white patches or narrow bands. These clouds have a fibrous appearance (hairlike), or a silky sheen, or both.
Cirrocumulus (Cc) – Thin white patch, sheet, or layer of cloud without shading, composed of very small elements in the form of grains, ripples, etc., merged or separate, and more or less regularly arranged; most of the elements have an apparent width of less than one degree.
Cirrostratus (Cs) – Transparent, whitish cloud veil of fibrous (hairlike) or smooth appearance, totally or partly covering the sky, and generally producing halo phenomena.
Units:
Method of Measurement: Visual observation.
How to Code: Code in accordance with the table on the following page.
Remarks: If more than one code figure for CH is applicable at the same time, the priority order is CH = 9,7,8,6,5,4,3,1,2,/.
NWSOH No. 1 2-67 July 2004
2004Part2B.qxp 5/25/06 2:19 PM Page 2-68
Ships Synoptic Code and Observing Methods
Code for High Cloud Type, CH
Code Figures
9 Cc alone, or Cc with Ci and/or Cs, but the Cc is predominant. 7 Veil of Cs covering the whole sky. 8 Cs not increasing and not covering the whole sky. 6 Ci (often in converging bands) and Cs, or Cs alone; in either case
spreading over the sky and generally thickening, the continuous veil extends more than 45° above the horizon, but does not cover the whole sky.
5 Same as code 6 above, except that the continuous veil does not reach 45° above the horizon.
4 Ci in the form of hooks and/or filaments, progressively invading the sky; they generally become thicker as a whole.
3 Dense Ci, often anvil-shaped, being the remains of the upper parts of a Cb.
1 Ci in the form of filaments, strands or hooks, not progressively invading the sky.
2 Either: (a) Dense Ci in patches or tangled sheaves, not increasing, which sometimes seem to be the remains of the upper part of a Cb. (b) Ci with sproutings like small turrets or battlements, or Ci having the appearance of cumulus-shaped tufts.
0 No Ci, Cc or Cs clouds present. / Ci, Cc and Cs invisible owing to darkness, or because of a contin
uous layer of lower clouds.
NWSOH No. 1 2-68 July 2004

2004Part2B.qxp 5/25/06 2:19 PM Page 2-69
Ships Synoptic Code and Observing Methods
CH = 1 Cirrus filaments, strands, hooks, not expanding.
CH = 2 Dense cirrus in patches or sheaves, not increasing, or cirrus like cumuliform tufts.
CH = 3 Dense cirrus, often the anvil remaining from cumulonimbus.
NWSOH No. 1 2-69 July 2004
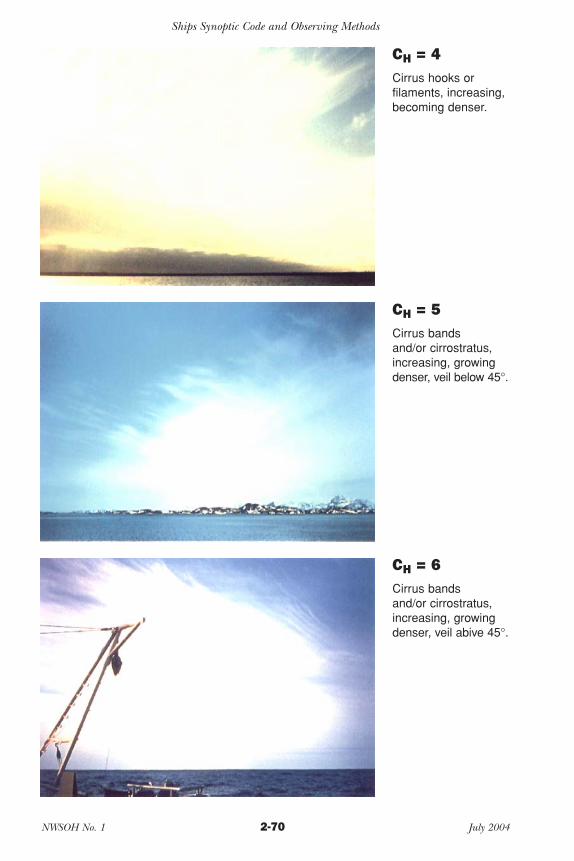
2004Part2B.qxp 5/25/06 2:19 PM Page 2-70
Ships Synoptic Code and Observing Methods
CH = 4 Cirrus hooks or filaments, increasing, becoming denser.
CH = 5 Cirrus bands and/or cirrostratus, increasing, growing denser, veil below 45°.
CH = 6 Cirrus bands and/or cirrostratus, increasing, growing denser, veil abive 45°.
NWSOH No. 1 2-70 July 2004
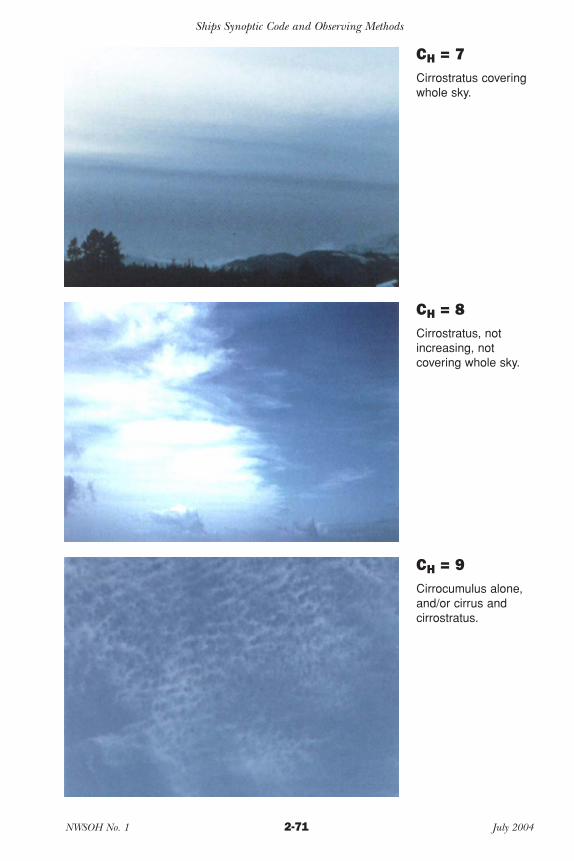
2004Part2B.qxp 5/25/06 2:19 PM Page 2-71
Ships Synoptic Code and Observing Methods
CH = 7 Cirrostratus covering whole sky.
CH = 8 Cirrostratus, not increasing, not covering whole sky.
CH = 9 Cirrocumulus alone, and/or cirrus and cirrostratus.
NWSOH No. 1 2-71 July 2004
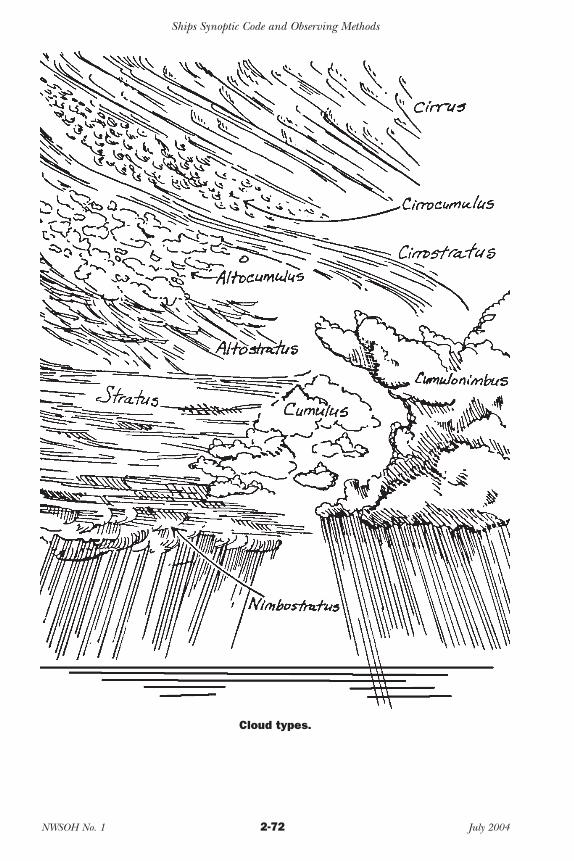
2004Part2B.qxp 5/25/06 2:19 PM Page 2-72
Ships Synoptic Code and Observing Methods
Cloud types.
NWSOH No. 1 2-72 July 2004
2004Part2B.qxp 5/25/06 2:19 PM Page 2-73
Ships Synoptic Code and Observing Methods
Ds, Ship’s True Course 222, Section 2 Indicator
SECTION 0 — IDENTIFICATION DATA BBXX D . . . . D YYGGiw 99LaLaLa QcLoLoLoLo
SECTION 1 — METEOROLOGICAL DATA iRixhVV Nddff 00fff 1snTTT 2snTdTdTd
4PPPP 5appp 7wwW1W2 8NhCLCMCH
SECTION 2 — OCEANOGRAPHIC DATA 222Dsvs 0ssTwTwTw 2PwPwHwHw 3dw1dw1dw2dw2 4Pw1Pw1Hw1Hw1
5Pw2Pw2Hw2Hw2 6IsEsEsRs 8swTbTbTb ICE ciSibiDizi
Definition: Ds is the true ship’s course made good during the three hours preceeding the time of observation.
Units: Compass directions.
Method of Measurement: If the ships course has been constant during the three hours preceeding the time of observation, then Ds is the actual course at the time of observation. However, if the ship has altered course in the previous three hours, Ds will probably differ from the course at the time of observation. See the diagram on the next page.
How to Code:
Code for Ship’s True Course, Ds
Code Figures True Direction
0 Ship hove to 1 NE 2 E 3 SE 4 S 5 SW 6 W 7 NW 8 N 9 Unknown / Not reported
Remarks: From the code table, select the true direction that is closest to ships course made good.
NWSOH No. 1 2-73 July 2004
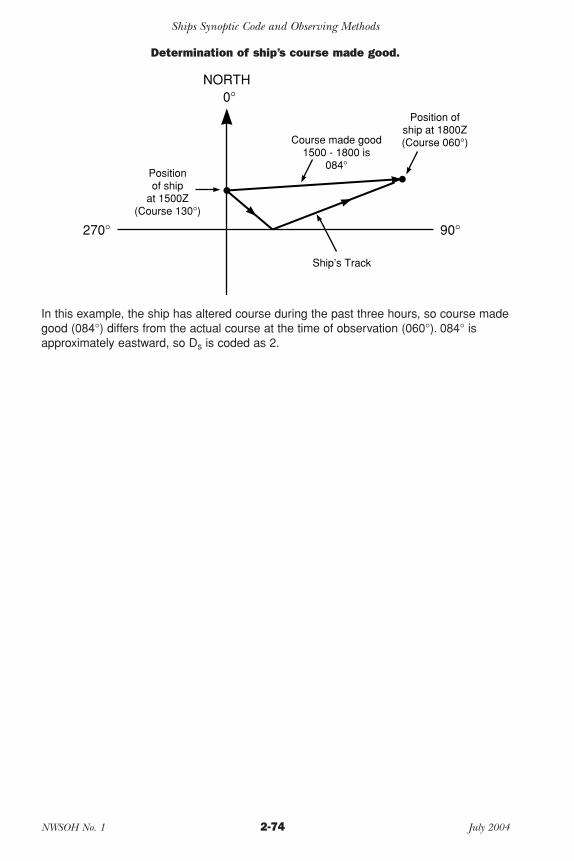
2004Part2B.qxp 5/25/06 2:19 PM Page 2-74
Ships Synoptic Code and Observing Methods
Determination of ship’s course made good.
NORTH0°
270° 90°
Course made good 1500 - 1800 is
084°
Position of ship at 1800Z (Course 060°)
Position of ship
at 1500Z (Course 130°)
Ship’s Track
In this example, the ship has altered course during the past three hours, so course made good (084°) differs from the actual course at the time of observation (060°). 084° is approximately eastward, so Ds is coded as 2.
NWSOH No. 1 2-74 July 2004
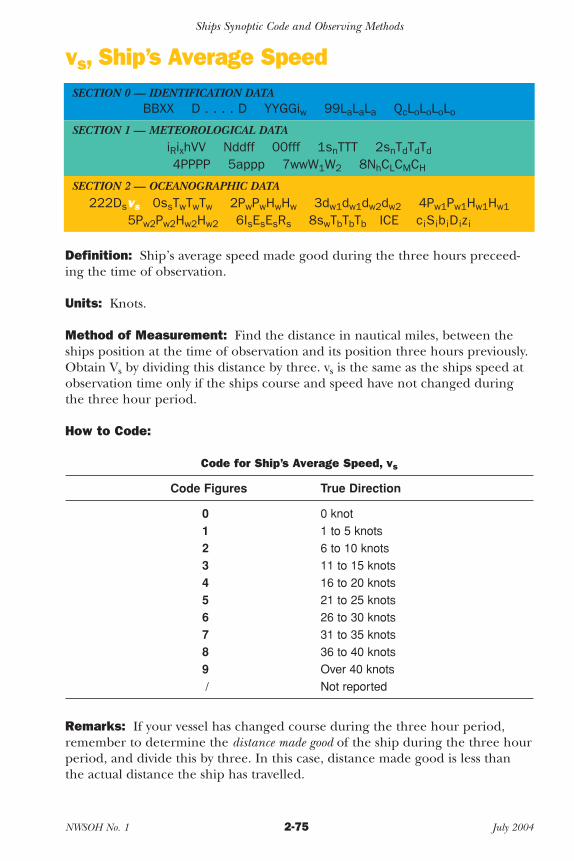
2004Part2B.qxp 5/25/06 2:19 PM Page 2-75
Ships Synoptic Code and Observing Methods
vs, Ship’s Average Speed SECTION 0 — IDENTIFICATION DATA
BBXX D . . . . D YYGGiw 99LaLaLa QcLoLoLoLo
SECTION 1 — METEOROLOGICAL DATA iRixhVV Nddff 00fff 1snTTT 2snTdTdTd
4PPPP 5appp 7wwW1W2 8NhCLCMCH
SECTION 2 — OCEANOGRAPHIC DATA 222Dsvs 0ssTwTwTw 2PwPwHwHw 3dw1dw1dw2dw2 4Pw1Pw1Hw1Hw1
5Pw2Pw2Hw2Hw2 6IsEsEsRs 8swTbTbTb ICE ciSibiDizi
Definition: Ship’s average speed made good during the three hours preceeding the time of observation.
Units: Knots.
Method of Measurement: Find the distance in nautical miles, between the ships position at the time of observation and its position three hours previously. Obtain Vs by dividing this distance by three. vs is the same as the ships speed at observation time only if the ships course and speed have not changed during the three hour period.
How to Code:
Code for Ship’s Average Speed, vs
Code Figures True Direction
0 0 knot 1 1 to 5 knots 2 6 to 10 knots 3 11 to 15 knots 4 16 to 20 knots 5 21 to 25 knots 6 26 to 30 knots 7 31 to 35 knots 8 36 to 40 knots 9 Over 40 knots / Not reported
Remarks: If your vessel has changed course during the three hour period, remember to determine the distance made good of the ship during the three hour period, and divide this by three. In this case, distance made good is less than the actual distance the ship has travelled.
NWSOH No. 1 2-75 July 2004
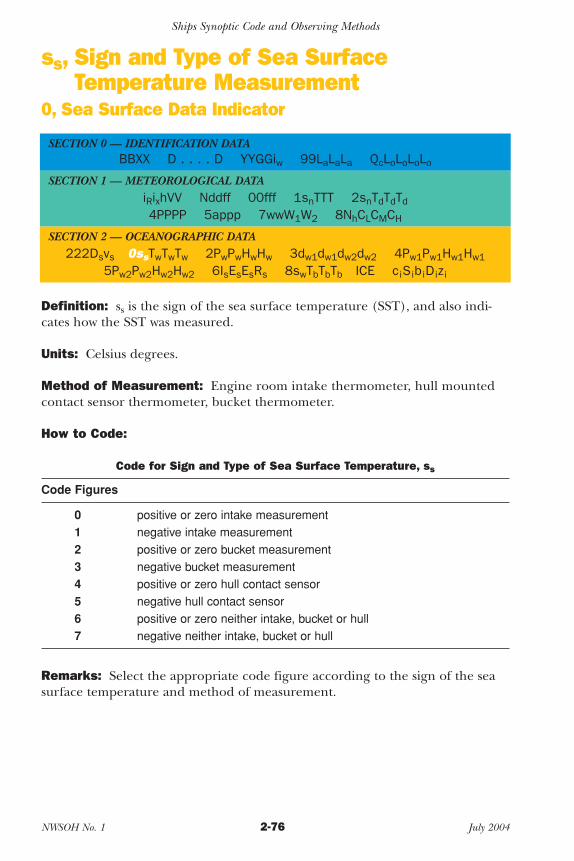
2004Part2B.qxp 5/25/06 2:19 PM Page 2-76
Ships Synoptic Code and Observing Methods
ss, Sign and Type of Sea Surface Temperature Measurement
0, Sea Surface Data Indicator
SECTION 0 — IDENTIFICATION DATA BBXX D . . . . D YYGGiw 99LaLaLa QcLoLoLoLo
SECTION 1 — METEOROLOGICAL DATA iRixhVV Nddff 00fff 1snTTT 2snTdTdTd
4PPPP 5appp 7wwW1W2 8NhCLCMCH
SECTION 2 — OCEANOGRAPHIC DATA 222Dsvs 0ssTwTwTw 2PwPwHwHw 3dw1dw1dw2dw2 4Pw1Pw1Hw1Hw1
5Pw2Pw2Hw2Hw2 6IsEsEsRs 8swTbTbTb ICE ciSibiDizi
Definition: ss is the sign of the sea surface temperature (SST), and also indicates how the SST was measured.
Units: Celsius degrees.
Method of Measurement: Engine room intake thermometer, hull mounted contact sensor thermometer, bucket thermometer.
How to Code:
Code for Sign and Type of Sea Surface Temperature, ss
Code Figures
0 positive or zero intake measurement 1 negative intake measurement 2 positive or zero bucket measurement 3 negative bucket measurement 4 positive or zero hull contact sensor 5 negative hull contact sensor 6 positive or zero neither intake, bucket or hull 7 negative neither intake, bucket or hull
Remarks: Select the appropriate code figure according to the sign of the sea surface temperature and method of measurement.
NWSOH No. 1 2-76 July 2004

2004Part2B.qxp 5/25/06 2:19 PM Page 2-77
Ships Synoptic Code and Observing Methods
TWTWTW, Sea Surface Temperature SECTION 0 — IDENTIFICATION DATA
BBXX D . . . . D YYGGiw 99LaLaLa QcLoLoLoLo
SECTION 1 — METEOROLOGICAL DATA iRixhVV Nddff 00fff 1snTTT 2snTdTdTd
4PPPP 5appp 7wwW1W2 8NhCLCMCH
SECTION 2 — OCEANOGRAPHIC DATA 222Dsvs 0ssTwTwTw 2PwPwHwHw 3dw1dw1dw2dw2 4Pw1Pw1Hw1Hw1
5Pw2Pw2Hw2Hw2 6IsEsEsRs 8swTbTbTb ICE ciSibiDizi
Definition: Sea surface water temperature, in tenths of a degree Celsius, its sign being given by ss. The temperature to be observed is that of the sea surface representative of conditions in the near-surface mixing layer underlying the ocean skin.
Units: Celsius degrees.
Method of Measurement: Engine room intake thermometer, hull mounted contact sensor thermometer, bucket thermometer.
How to Code: In actual degrees Celsius as shown below.
Examples: 8.4°C: TwTwTw = 084 ss = 0 (intake thermometer) 0.4°C: TwTwTw = 004 ss = 0 (intake thermometer)
–0.7°C: TwTwTw = 007 ss = 1 (intake thermometer) –1.5°C: TwTwTw = 015 ss = 1 (intake thermometer)
Remarks: It is important to have your sea water thermometer checked and calibrated regularly. The engine room intake thermometer should be checked every time your vessel goes into the yard for service, and replaced whenever necessary.
NWSOH No. 1 2-77 July 2004
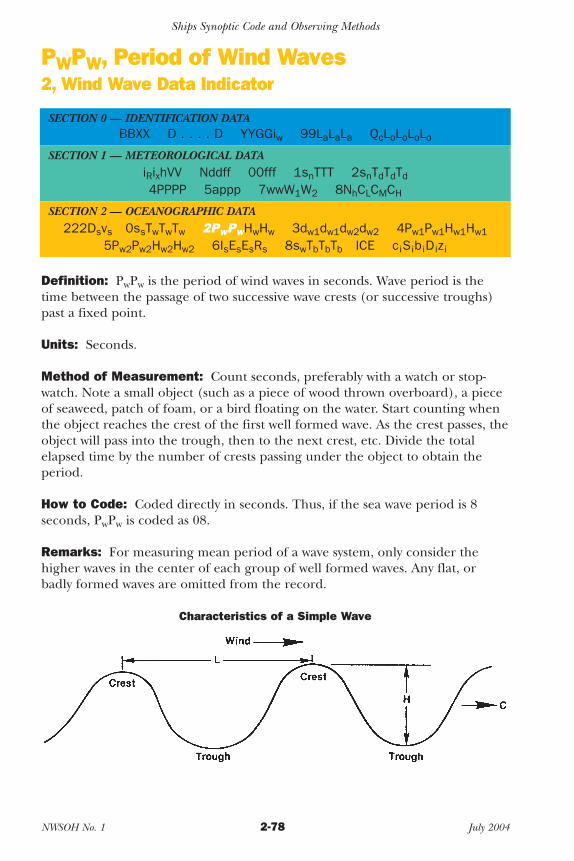
2004Part2B.qxp 5/25/06 2:19 PM Page 2-78
Ships Synoptic Code and Observing Methods
PWPW, Period of Wind Waves 2, Wind Wave Data Indicator
SECTION 0 — IDENTIFICATION DATA BBXX D . . . . D YYGGiw 99LaLaLa QcLoLoLoLo
SECTION 1 — METEOROLOGICAL DATA iRixhVV Nddff 00fff 1snTTT 2snTdTdTd
4PPPP 5appp 7wwW1W2 8NhCLCMCH
SECTION 2 — OCEANOGRAPHIC DATA 222Dsvs 0ssTwTwTw 2PwPwHwHw 3dw1dw1dw2dw2 4Pw1Pw1Hw1Hw1
5Pw2Pw2Hw2Hw2 6IsEsEsRs 8swTbTbTb ICE ciSibiDizi
Definition: PwPw is the period of wind waves in seconds. Wave period is the time between the passage of two successive wave crests (or successive troughs) past a fixed point.
Units: Seconds.
Method of Measurement: Count seconds, preferably with a watch or stopwatch. Note a small object (such as a piece of wood thrown overboard), a piece of seaweed, patch of foam, or a bird floating on the water. Start counting when the object reaches the crest of the first well formed wave. As the crest passes, the object will pass into the trough, then to the next crest, etc. Divide the total elapsed time by the number of crests passing under the object to obtain the period.
How to Code: Coded directly in seconds. Thus, if the sea wave period is 8 seconds, PwPw is coded as 08.
Remarks: For measuring mean period of a wave system, only consider the higher waves in the center of each group of well formed waves. Any flat, or badly formed waves are omitted from the record.
Characteristics of a Simple Wave
NWSOH No. 1 2-78 July 2004
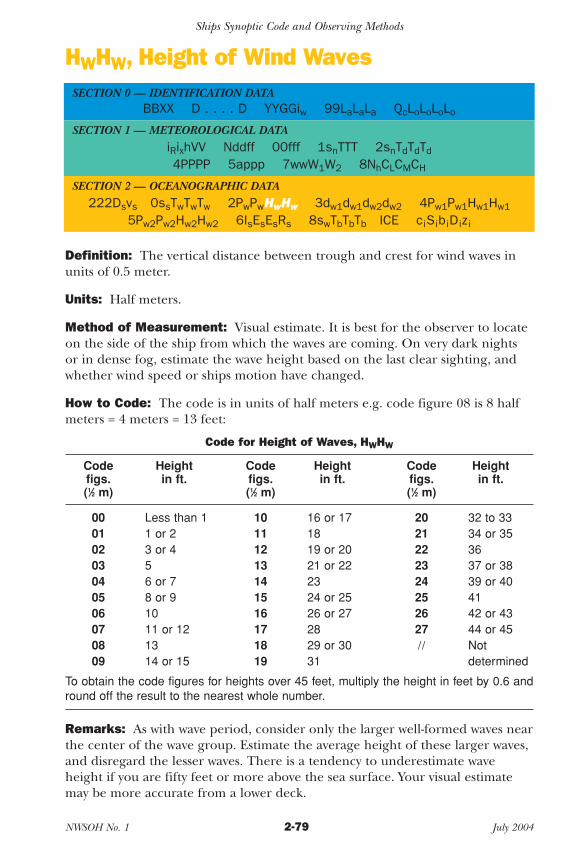
2004Part2B.qxp 5/25/06 2:19 PM Page 2-79
Ships Synoptic Code and Observing Methods
HWHW, Height of Wind Waves SECTION 0 — IDENTIFICATION DATA
BBXX D . . . . D YYGGiw 99LaLaLa QcLoLoLoLo
SECTION 1 — METEOROLOGICAL DATA iRixhVV Nddff 00fff 1snTTT 2snTdTdTd
4PPPP 5appp 7wwW1W2 8NhCLCMCH
SECTION 2 — OCEANOGRAPHIC DATA 222Dsvs 0ssTwTwTw 2PwPwHwHw 3dw1dw1dw2dw2 4Pw1Pw1Hw1Hw1
5Pw2Pw2Hw2Hw2 6IsEsEsRs 8swTbTbTb ICE ciSibiDizi
Definition: The vertical distance between trough and crest for wind waves in units of 0.5 meter.
Units: Half meters.
Method of Measurement: Visual estimate. It is best for the observer to locate on the side of the ship from which the waves are coming. On very dark nights or in dense fog, estimate the wave height based on the last clear sighting, and whether wind speed or ships motion have changed.
How to Code: The code is in units of half meters e.g. code figure 08 is 8 half meters = 4 meters = 13 feet:
Code for Height of Waves, HWHW
Code Height Code figs. in ft. figs. (1⁄2 m) (1⁄2 m)
Height Code Height in ft. figs. in ft.
(1⁄2 m)
00 Less than 1 10 16 or 17 20 32 to 33 01 1 or 2 11 18 21 34 or 35 02 3 or 4 12 19 or 20 22 36 03 5 13 21 or 22 23 37 or 38 04 6 or 7 14 23 24 39 or 40 05 8 or 9 15 24 or 25 25 41 06 10 16 26 or 27 26 42 or 43 07 11 or 12 17 28 27 44 or 45 08 13 18 29 or 30 // Not 09 14 or 15 19 31 determined
To obtain the code figures for heights over 45 feet, multiply the height in feet by 0.6 and round off the result to the nearest whole number.
Remarks: As with wave period, consider only the larger well-formed waves near the center of the wave group. Estimate the average height of these larger waves, and disregard the lesser waves. There is a tendency to underestimate wave height if you are fifty feet or more above the sea surface. Your visual estimate may be more accurate from a lower deck.
NWSOH No. 1 2-79 July 2004
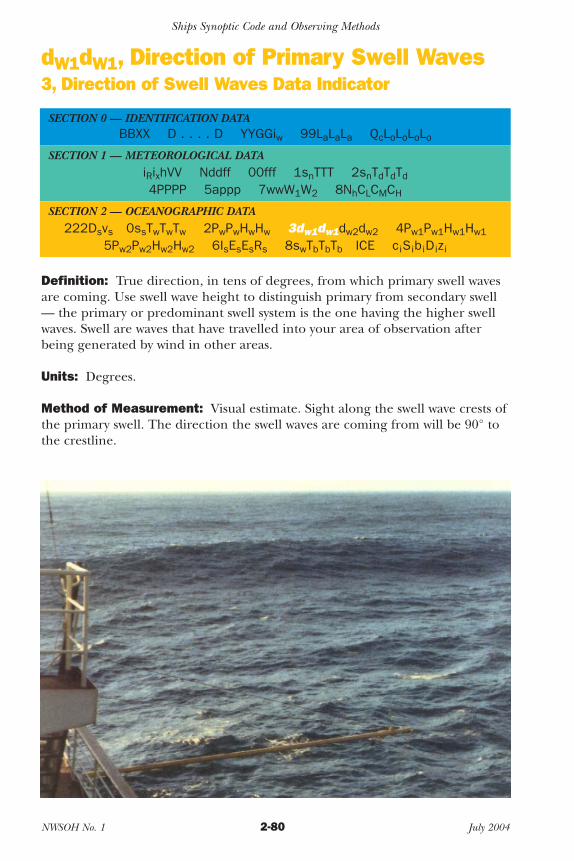
2004Part2B.qxp 5/25/06 2:19 PM Page 2-80
Ships Synoptic Code and Observing Methods
dW1dW1, Direction of Primary Swell Waves 3, Direction of Swell Waves Data Indicator
SECTION 0 — IDENTIFICATION DATA BBXX D . . . . D YYGGiw 99LaLaLa QcLoLoLoLo
SECTION 1 — METEOROLOGICAL DATA iRixhVV Nddff 00fff 1snTTT 2snTdTdTd
4PPPP 5appp 7wwW1W2 8NhCLCMCH
SECTION 2 — OCEANOGRAPHIC DATA 222Dsvs 0ssTwTwTw 2PwPwHwHw 3dw1dw1dw2dw2 4Pw1Pw1Hw1Hw1
5Pw2Pw2Hw2Hw2 6IsEsEsRs 8swTbTbTb ICE ciSibiDizi
Definition: True direction, in tens of degrees, from which primary swell waves are coming. Use swell wave height to distinguish primary from secondary swell — the primary or predominant swell system is the one having the higher swell waves. Swell are waves that have travelled into your area of observation after being generated by wind in other areas.
Units: Degrees.
Method of Measurement: Visual estimate. Sight along the swell wave crests of the primary swell. The direction the swell waves are coming from will be 90° to the crestline.
NWSOH No. 1 2-80 July 2004
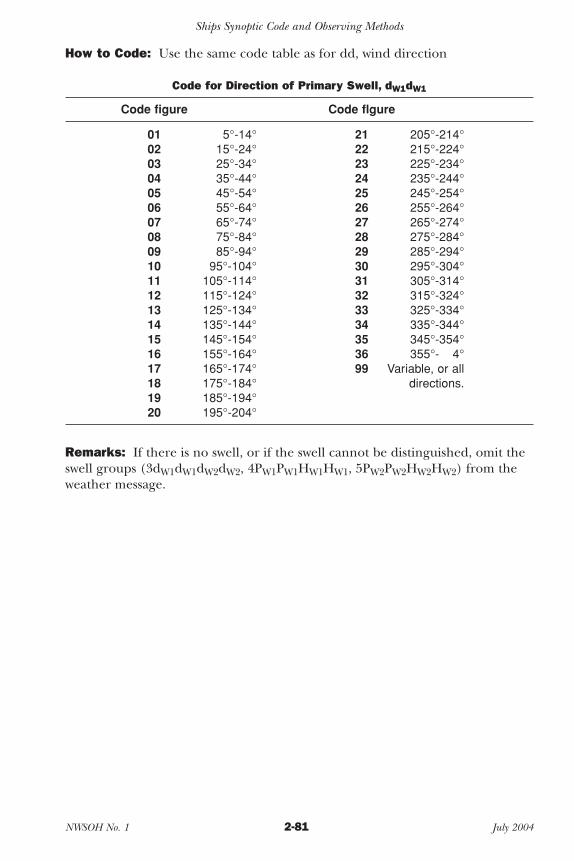
2004Part2B.qxp 5/25/06 2:19 PM Page 2-81
00
Ships Synoptic Code and Observing Methods
How to Code: Use the same code table as for dd, wind direction
Code for Direction of Primary Swell, dW1dW1
Code figure Code flgure
01 5°-14° 21 205°-214° 02 15°-24° 22 215°-224° 03 25°-34° 23 225°-234° 04 35°-44° 24 235°-244° 05 45°-54° 25 245°-254° 06 55°-64° 26 255°-264° 07 65°-74° 27 265°-274° 08 75°-84° 28 275°-284° 09 85°-94° 29 285°-294° 10 95°-104° 30 295°-304° 11 105°-114° 31 305°-314° 12 115°-124° 32 315°-324° 13 125°-134° 33 325°-334° 14 135°-144° 34 335°-344° 15 145°-154° 35 345°-354° 16 155°-164° 36 355°- 4° 17 165°-174° 99 Variable, or all 18 175°-184° directions. 19 185°-194° 20 195°-204°
Remarks: If there is no swell, or if the swell cannot be distinguished, omit the swell groups (3dW1dW1dW2dW2, 4PW1PW1HW1HW1, 5PW2PW2HW2HW2) from the weather message.
NWSOH No. 1 2-81 July 2004
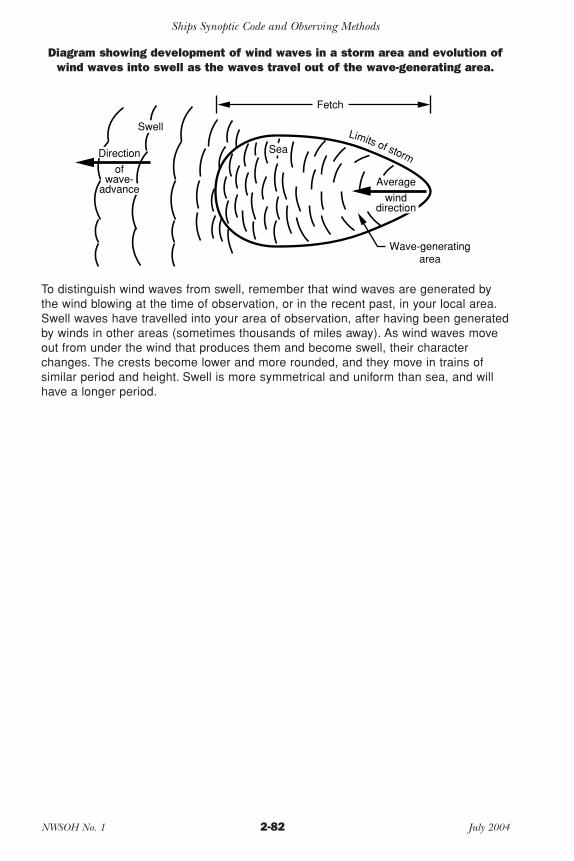
2004Part2B.qxp 5/25/06 2:19 PM Page 2-82
Ships Synoptic Code and Observing Methods
Diagram showing development of wind waves in a storm area and evolution of wind waves into swell as the waves travel out of the wave-generating area.
Limits of storm
Average
wind direction
Fetch
Sea
Swell
Direction
of wave-
advance
Wave-generating area
To distinguish wind waves from swell, remember that wind waves are generated by the wind blowing at the time of observation, or in the recent past, in your local area. Swell waves have travelled into your area of observation, after having been generated by winds in other areas (sometimes thousands of miles away). As wind waves move out from under the wind that produces them and become swell, their character changes. The crests become lower and more rounded, and they move in trains of similar period and height. Swell is more symmetrical and uniform than sea, and will have a longer period.
NWSOH No. 1 2-82 July 2004

2004Part2B.qxp 5/25/06 2:19 PM Page 2-83
00
Ships Synoptic Code and Observing Methods
dW2dW2, Direction of Secondary Swell Waves SECTION 0 — IDENTIFICATION DATA
BBXX D . . . . D YYGGiw 99LaLaLa QcLoLoLoLo
SECTION 1 — METEOROLOGICAL DATA iRixhVV Nddff 00fff 1snTTT 2snTdTdTd
4PPPP 5appp 7wwW1W2 8NhCLCMCH
SECTION 2 — OCEANOGRAPHIC DATA 222Dsvs 0ssTwTwTw 2PwPwHwHw 3dw1dw1dw2dw2 4Pw1Pw1Hw1Hw1
5Pw2Pw2Hw2Hw2 6IsEsEsRs 8swTbTbTb ICE ciSibiDizi
Definition: True direction, in tens of degrees, from which secondary swell waves are coming. The secondary swell system has lower waves than the primary swell and usually comes from a different direction.
Units: Degrees.
Method of Measurement: Visual estimate. Sight along the secondary swell wave crests. The wave direction will be 90° to the crestline.
How to Code: Use the same code table as for dd, wind direction
Code for Direction of Secondary Swell, dW2dW2
Code figure Code flgure
01 5°-14° 21 205°-214° 02 15°-24° 22 215°-224° 03 25°-34° 23 225°-234° 04 35°-44° 24 235°-244° 05 45°-54° 25 245°-254° 06 55°-64° 26 255°-264° 07 65°-74° 27 265°-274° 08 75°-84° 28 275°-284° 09 85°-94° 29 285°-294° 10 95°-104° 30 295°-304° 11 105°-114° 31 305°-314° 12 115°-124° 32 315°-324° 13 125°-134° 33 325°-334° 14 135°-144° 34 335°-344° 15 145°-154° 35 345°-354° 16 155°-164° 36 355°- 4° 17 165°-174° 99 Variable, or all 18 175°-184° directions. 19 185°-194° 20 195°-204°
Remarks: If only one swell system is observed, use slants (//) for the secondary swell.
NWSOH No. 1 2-83 July 2004
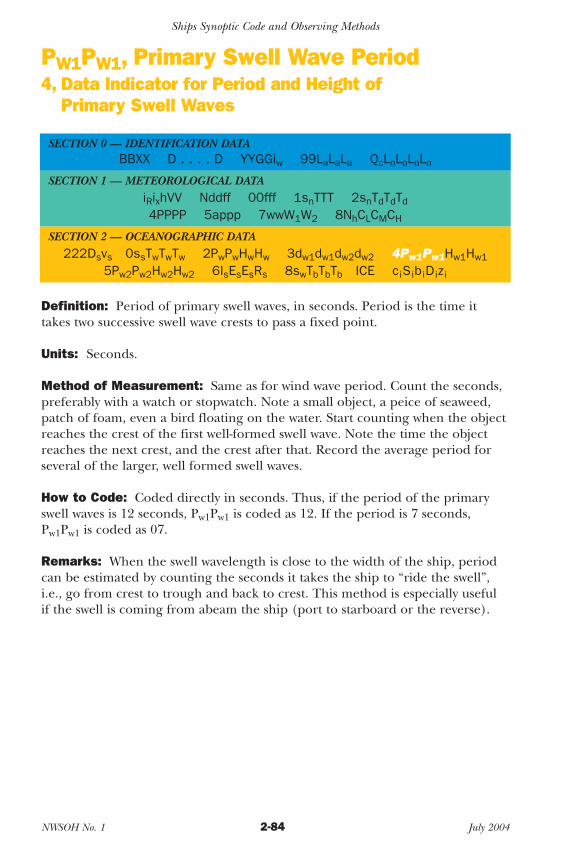
2004Part2B.qxp 5/25/06 2:19 PM Page 2-84
Ships Synoptic Code and Observing Methods
PW1PW1, Primary Swell Wave Period 4, Data Indicator for Period and Height of
Primary Swell Waves
SECTION 0 — IDENTIFICATION DATA BBXX D . . . . D YYGGiw 99LaLaLa QcLoLoLoLo
SECTION 1 — METEOROLOGICAL DATA iRixhVV Nddff 00fff 1snTTT 2snTdTdTd
4PPPP 5appp 7wwW1W2 8NhCLCMCH
SECTION 2 — OCEANOGRAPHIC DATA 222Dsvs 0ssTwTwTw 2PwPwHwHw 3dw1dw1dw2dw2 4Pw1Pw1Hw1Hw1
5Pw2Pw2Hw2Hw2 6IsEsEsRs 8swTbTbTb ICE ciSibiDizi
Definition: Period of primary swell waves, in seconds. Period is the time it takes two successive swell wave crests to pass a fixed point.
Units: Seconds.
Method of Measurement: Same as for wind wave period. Count the seconds, preferably with a watch or stopwatch. Note a small object, a peice of seaweed, patch of foam, even a bird floating on the water. Start counting when the object reaches the crest of the first well-formed swell wave. Note the time the object reaches the next crest, and the crest after that. Record the average period for several of the larger, well formed swell waves.
How to Code: Coded directly in seconds. Thus, if the period of the primary swell waves is 12 seconds, Pw1Pw1 is coded as 12. If the period is 7 seconds, Pw1Pw1 is coded as 07.
Remarks: When the swell wavelength is close to the width of the ship, period can be estimated by counting the seconds it takes the ship to “ride the swell”, i.e., go from crest to trough and back to crest. This method is especially useful if the swell is coming from abeam the ship (port to starboard or the reverse).
NWSOH No. 1 2-84 July 2004
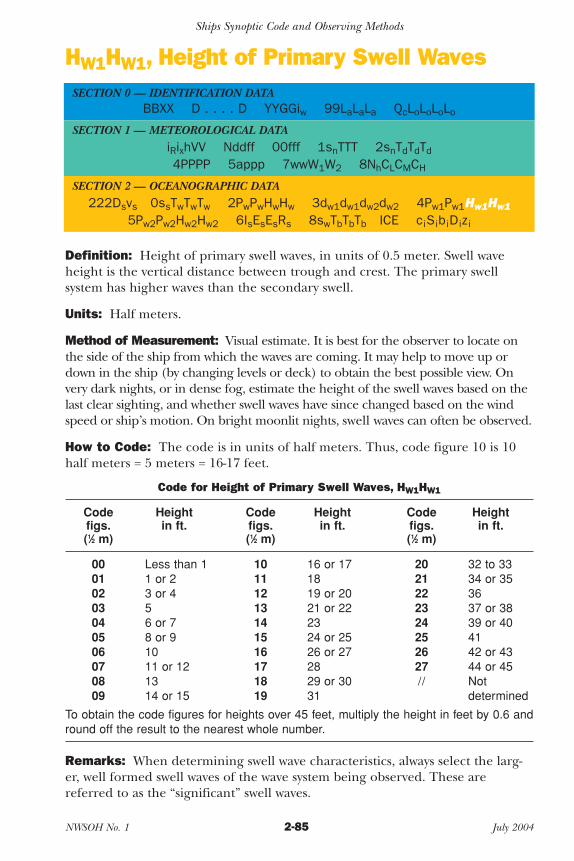
2004Part2B.qxp 5/25/06 2:19 PM Page 2-85
Ships Synoptic Code and Observing Methods
HW1HW1, Height of Primary Swell Waves SECTION 0 — IDENTIFICATION DATA
BBXX D . . . . D YYGGiw 99LaLaLa QcLoLoLoLo
SECTION 1 — METEOROLOGICAL DATA iRixhVV Nddff 00fff 1snTTT 2snTdTdTd
4PPPP 5appp 7wwW1W2 8NhCLCMCH
SECTION 2 — OCEANOGRAPHIC DATA 222Dsvs 0ssTwTwTw 2PwPwHwHw 3dw1dw1dw2dw2 4Pw1Pw1Hw1Hw1
5Pw2Pw2Hw2Hw2 6IsEsEsRs 8swTbTbTb ICE ciSibiDizi
Definition: Height of primary swell waves, in units of 0.5 meter. Swell wave height is the vertical distance between trough and crest. The primary swell system has higher waves than the secondary swell.
Units: Half meters.
Method of Measurement: Visual estimate. It is best for the observer to locate on the side of the ship from which the waves are coming. It may help to move up or down in the ship (by changing levels or deck) to obtain the best possible view. On very dark nights, or in dense fog, estimate the height of the swell waves based on the last clear sighting, and whether swell waves have since changed based on the wind speed or ship’s motion. On bright moonlit nights, swell waves can often be observed.
How to Code: The code is in units of half meters. Thus, code figure 10 is 10 half meters = 5 meters = 16-17 feet.
Code for Height of Primary Swell Waves, HW1HW1
Code Height Code figs. in ft. figs. (1⁄2 m) (1⁄2 m)
Height Code Height in ft. figs. in ft.
(1⁄2 m)
00 Less than 1 10 16 or 17 20 32 to 33 01 1 or 2 11 18 21 34 or 35 02 3 or 4 12 19 or 20 22 36 03 5 13 21 or 22 23 37 or 38 04 6 or 7 14 23 24 39 or 40 05 8 or 9 15 24 or 25 25 41 06 10 16 26 or 27 26 42 or 43 07 11 or 12 17 28 27 44 or 45 08 13 18 29 or 30 // Not 09 14 or 15 19 31 determined
To obtain the code figures for heights over 45 feet, multiply the height in feet by 0.6 and round off the result to the nearest whole number.
Remarks: When determining swell wave characteristics, always select the larger, well formed swell waves of the wave system being observed. These are referred to as the “significant” swell waves.
NWSOH No. 1 2-85 July 2004
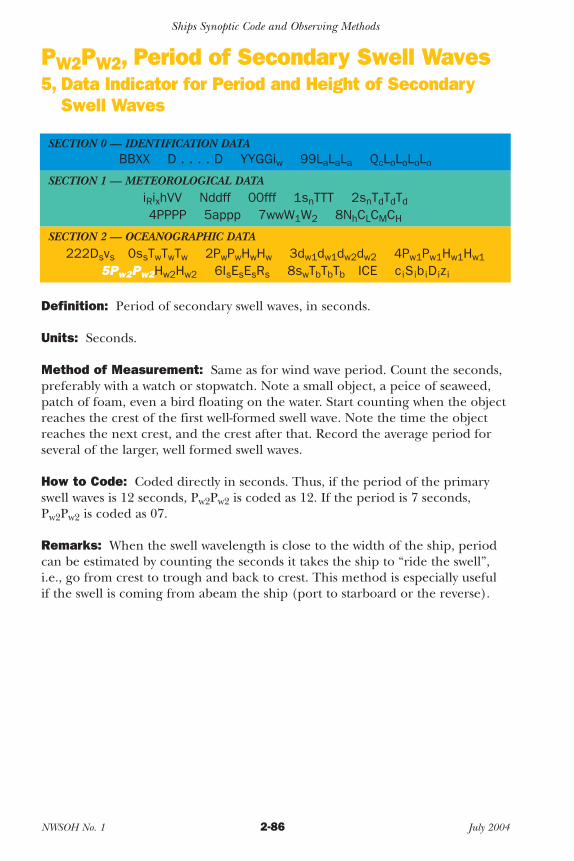
2004Part2B.qxp 5/25/06 2:19 PM Page 2-86
Ships Synoptic Code and Observing Methods
PW2PW2, Period of Secondary Swell Waves 5, Data Indicator for Period and Height of Secondary
Swell Waves
SECTION 0 — IDENTIFICATION DATA BBXX D . . . . D YYGGiw 99LaLaLa QcLoLoLoLo
SECTION 1 — METEOROLOGICAL DATA iRixhVV Nddff 00fff 1snTTT 2snTdTdTd
4PPPP 5appp 7wwW1W2 8NhCLCMCH
SECTION 2 — OCEANOGRAPHIC DATA 222Dsvs 0ssTwTwTw 2PwPwHwHw 3dw1dw1dw2dw2 4Pw1Pw1Hw1Hw1
5Pw2Pw2Hw2Hw2 6IsEsEsRs 8swTbTbTb ICE ciSibiDizi
Definition: Period of secondary swell waves, in seconds.
Units: Seconds.
Method of Measurement: Same as for wind wave period. Count the seconds, preferably with a watch or stopwatch. Note a small object, a peice of seaweed, patch of foam, even a bird floating on the water. Start counting when the object reaches the crest of the first well-formed swell wave. Note the time the object reaches the next crest, and the crest after that. Record the average period for several of the larger, well formed swell waves.
How to Code: Coded directly in seconds. Thus, if the period of the primary swell waves is 12 seconds, Pw2Pw2 is coded as 12. If the period is 7 seconds, Pw2Pw2 is coded as 07.
Remarks: When the swell wavelength is close to the width of the ship, period can be estimated by counting the seconds it takes the ship to “ride the swell”, i.e., go from crest to trough and back to crest. This method is especially useful if the swell is coming from abeam the ship (port to starboard or the reverse).
NWSOH No. 1 2-86 July 2004

2004Part2B.qxp 5/25/06 2:19 PM Page 2-87
Ships Synoptic Code and Observing Methods
HW2HW2, Height of Secondary Swell Waves SECTION 0 — IDENTIFICATION DATA
BBXX D . . . . D YYGGiw 99LaLaLa QcLoLoLoLo
SECTION 1 — METEOROLOGICAL DATA iRixhVV Nddff 00fff 1snTTT 2snTdTdTd
4PPPP 5appp 7wwW1W2 8NhCLCMCH
SECTION 2 — OCEANOGRAPHIC DATA 222Dsvs 0ssTwTwTw 2PwPwHwHw 3dw1dw1dw2dw2 4Pw1Pw1Hw1Hw1
5Pw2Pw2Hw2Hw2 6IsEsEsRs 8swTbTbTb ICE ciSibiDizi
Definition: Height of secondary swell waves, in units of 0.5 meter. The secondary swell system has lower waves than the primary swell.
Units: Half meters.
Method of Measurement: Visual estimate. It is best for the observer to locate on the side of the ship from which the swell waves are coming. It may help to move up or down in the ship (by changing levels or deck) to obtain the best possible view. On very dark nights, or in dense fog, estimate the height of the swell waves based on the last clear sighting, and whether swell waves have since changed based on the wind speed or ship’s motion. On bright moonlit nights, swell waves can often be observed.
How to Code: The code is in units of half meters. Thus, code figure 10 is 10 half meters = 5 meters = 16-17 feet.
Code for Height of Secondary Swell Waves, HW2HW2
Code Height Code figs. in ft. figs. (1⁄2 m) (1⁄2 m)
Height Code Height in ft. figs. in ft.
(1⁄2 m)
00 Less than 1 10 16 or 17 20 32 to 33 01 1 or 2 11 18 21 34 or 35 02 3 or 4 12 19 or 20 22 36 03 5 13 21 or 22 23 37 or 38 04 6 or 7 14 23 24 39 or 40 05 8 or 9 15 24 or 25 25 41 06 10 16 26 or 27 26 42 or 43 07 11 or 12 17 28 27 44 or 45 08 13 18 29 or 30 // Not 09 14 or 15 19 31 determined
To obtain the code figures for heights over 45 feet, multiply the height in feet by 0.6 and round off the result to the nearest whole number.
Remarks: When determining swell wave characteristics, always select the larger, well formed swell waves. These are referred to as the “significant” swell waves.
NWSOH No. 1 2-87 July 2004

2004Part2B.qxp 5/25/06 2:19 PM Page 2-88
Ships Synoptic Code and Observing Methods
Is, Cause of Ice Accretion on Ship 6, Data Indicator for Ice Accretion
SECTION 0 — IDENTIFICATION DATA BBXX D . . . . D YYGGiw 99LaLaLa QcLoLoLoLo
SECTION 1 — METEOROLOGICAL DATA iRixhVV Nddff 00fff 1snTTT 2snTdTdTd
4PPPP 5appp 7wwW1W2 8NhCLCMCH
SECTION 2 — OCEANOGRAPHIC DATA 222Dsvs 0ssTwTwTw 2PwPwHwHw 3dw1dw1dw2dw2 4Pw1Pw1Hw1Hw1
5Pw2Pw2Hw2Hw2 6IsEsEsRs 8swTbTbTb ICE ciSibiDizi
Definition: Is is the cause of ice accretion on ship. Ice accretion refers to a deposition of a coating of ice on the ships superstructure or exposed surfaces, from freezing precipitation, ocean spray, supercooled fog, or cloud droplets.
Units:
Method of Measurement: Visual.
How to Code:
Code for Ice Accretion, Is
Code Figures
1 Icing from ocean spray 2 Icing from fog 3 Icing from spray and fog 4 Icing from rain 5 Icing from spray and rain
Remarks: An accumulation of freezing rain, drizzle, sea spray, or fog (rime ice) can be hazardous, especially to smaller vessels. Ice can cause radio or radar failures, due to the icing of aerials. Ice can also cause difficulty in unloading cargo in port if containers and their lashings are frozen to the deck. By reporting this information, you alert the forecasters to this condition, enabling them to broadcast reliable warnings when a danger is foreseen.
NWSOH No. 1 2-88 July 2004
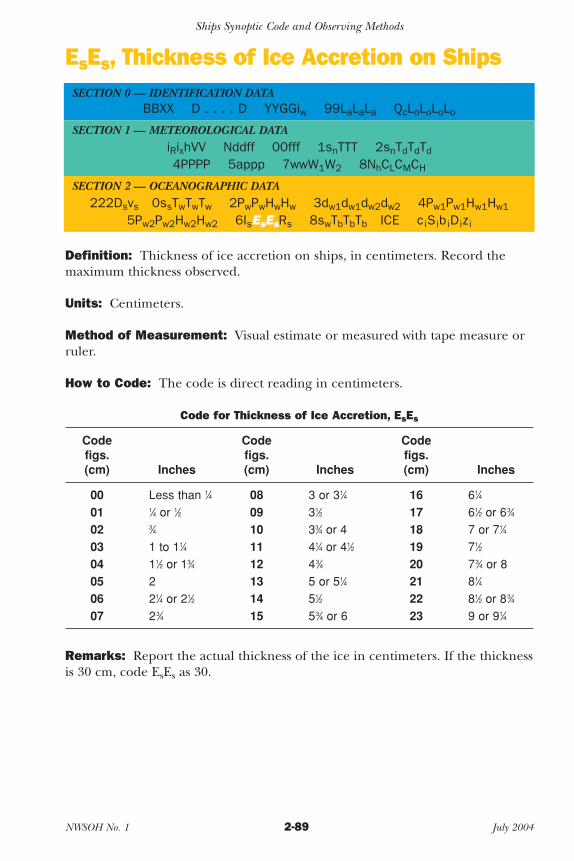
2004Part2B.qxp 5/25/06 2:19 PM Page 2-89
Ships Synoptic Code and Observing Methods
EsEs, Thickness of Ice Accretion on Ships SECTION 0 — IDENTIFICATION DATA
BBXX D . . . . D YYGGiw 99LaLaLa QcLoLoLoLo
SECTION 1 — METEOROLOGICAL DATA iRixhVV Nddff 00fff 1snTTT 2snTdTdTd
4PPPP 5appp 7wwW1W2 8NhCLCMCH
SECTION 2 — OCEANOGRAPHIC DATA 222Dsvs 0ssTwTwTw 2PwPwHwHw 3dw1dw1dw2dw2 4Pw1Pw1Hw1Hw1
5Pw2Pw2Hw2Hw2 6IsEsEsRs 8swTbTbTb ICE ciSibiDizi
Definition: Thickness of ice accretion on ships, in centimeters. Record the maximum thickness observed.
Units: Centimeters.
Method of Measurement: Visual estimate or measured with tape measure orruler.
How to Code: The code is direct reading in centimeters.
Code for Thickness of Ice Accretion, EsEs
Code Code Code figs. figs. figs. (cm) Inches (cm) Inches (cm) Inches
00 Less than 1⁄4 08 3 or 31⁄4 16 61⁄4
01 1⁄4 or 1⁄2 09 31⁄2 17 61⁄2 or 63⁄4
02 3⁄4 10 33⁄4 or 4 18 7 or 71⁄4
03 1 to 11⁄4 11 41⁄4 or 41⁄2 19 71⁄2
04 11⁄2 or 13⁄4 12 43⁄4 20 73⁄4 or 8 05 2 13 5 or 51⁄4 21 81⁄4
06 21⁄4 or 21⁄2 14 51⁄2 22 81⁄2 or 83⁄4
07 23⁄4 15 53⁄4 or 6 23 9 or 91⁄4
Remarks: Report the actual thickness of the ice in centimeters. If the thickness is 30 cm, code EsEs as 30.
NWSOH No. 1 2-89 July 2004
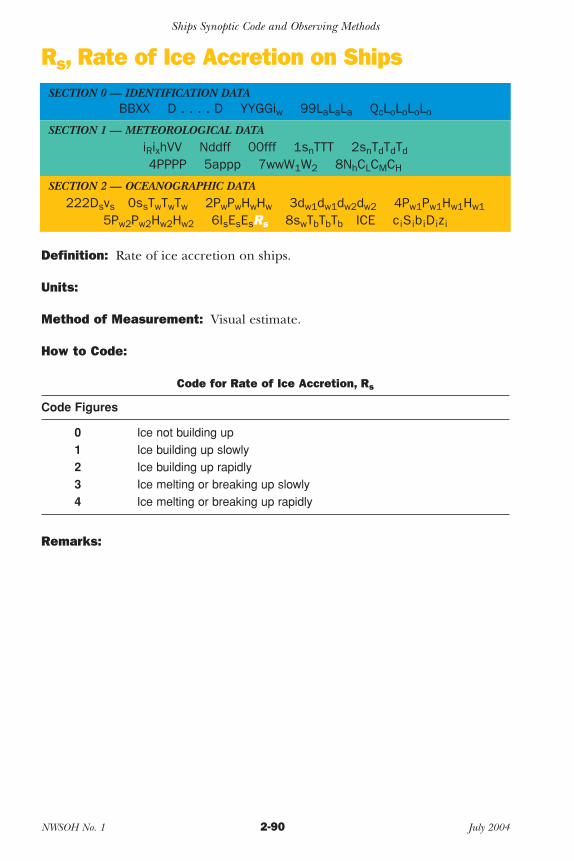
2004Part2B.qxp 5/25/06 2:19 PM Page 2-90
Ships Synoptic Code and Observing Methods
Rs, Rate of Ice Accretion on Ships SECTION 0 — IDENTIFICATION DATA
BBXX D . . . . D YYGGiw 99LaLaLa QcLoLoLoLo
SECTION 1 — METEOROLOGICAL DATA iRixhVV Nddff 00fff 1snTTT 2snTdTdTd
4PPPP 5appp 7wwW1W2 8NhCLCMCH
SECTION 2 — OCEANOGRAPHIC DATA 222Dsvs 0ssTwTwTw 2PwPwHwHw 3dw1dw1dw2dw2 4Pw1Pw1Hw1Hw1
5Pw2Pw2Hw2Hw2 6IsEsEsRs 8swTbTbTb ICE ciSibiDizi
Definition: Rate of ice accretion on ships.
Units:
Method of Measurement: Visual estimate.
How to Code:
Code for Rate of Ice Accretion, Rs
Code Figures
0 Ice not building up 1 Ice building up slowly 2 Ice building up rapidly 3 Ice melting or breaking up slowly 4 Ice melting or breaking up rapidly
Remarks:
NWSOH No. 1 2-90 July 2004
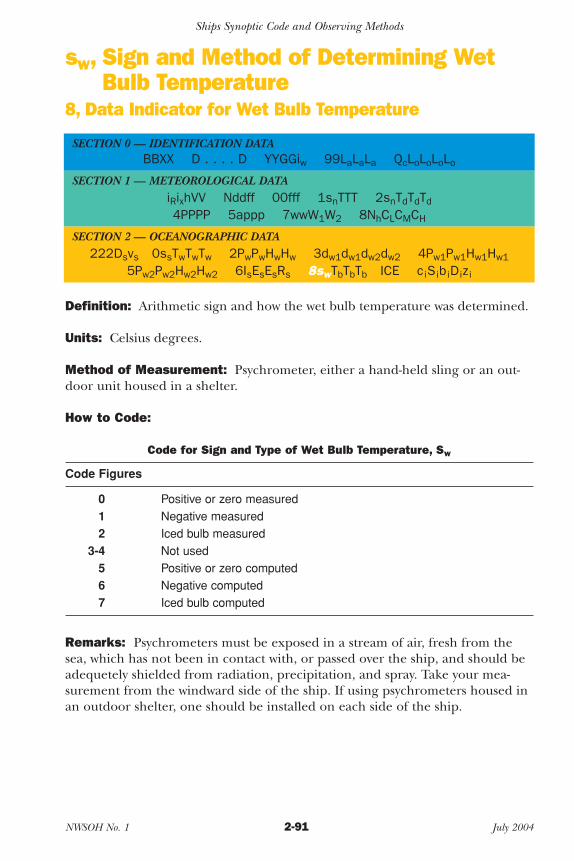
2004Part2B.qxp 5/25/06 2:19 PM Page 2-91
Ships Synoptic Code and Observing Methods
sw, Sign and Method of Determining Wet Bulb Temperature
8, Data Indicator for Wet Bulb Temperature
SECTION 0 — IDENTIFICATION DATA BBXX D . . . . D YYGGiw 99LaLaLa QcLoLoLoLo
SECTION 1 — METEOROLOGICAL DATA iRixhVV Nddff 00fff 1snTTT 2snTdTdTd
4PPPP 5appp 7wwW1W2 8NhCLCMCH
SECTION 2 — OCEANOGRAPHIC DATA 222Dsvs 0ssTwTwTw 2PwPwHwHw 3dw1dw1dw2dw2 4Pw1Pw1Hw1Hw1
5Pw2Pw2Hw2Hw2 6IsEsEsRs 8swTbTbTb ICE ciSibiDizi
Definition: Arithmetic sign and how the wet bulb temperature was determined.
Units: Celsius degrees.
Method of Measurement: Psychrometer, either a hand-held sling or an outdoor unit housed in a shelter.
How to Code:
Code for Sign and Type of Wet Bulb Temperature, Sw
Code Figures
0 Positive or zero measured 1 Negative measured 2 Iced bulb measured
3-4 Not used 5 Positive or zero computed 6 Negative computed 7 Iced bulb computed
Remarks: Psychrometers must be exposed in a stream of air, fresh from the sea, which has not been in contact with, or passed over the ship, and should be adequetely shielded from radiation, precipitation, and spray. Take your measurement from the windward side of the ship. If using psychrometers housed in an outdoor shelter, one should be installed on each side of the ship.
NWSOH No. 1 2-91 July 2004
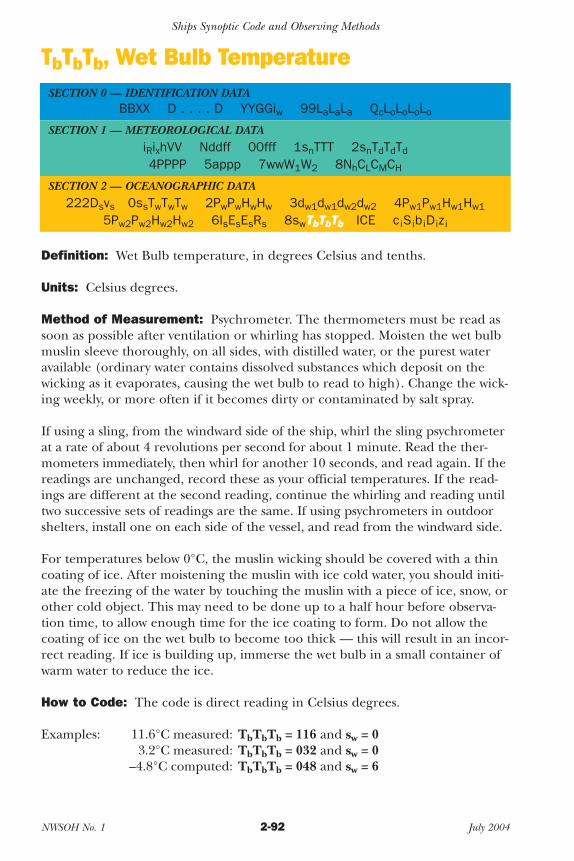
2004Part2B.qxp 5/25/06 2:19 PM Page 2-92
Ships Synoptic Code and Observing Methods
TbTbTb, Wet Bulb Temperature SECTION 0 — IDENTIFICATION DATA
BBXX D . . . . D YYGGiw 99LaLaLa QcLoLoLoLo
SECTION 1 — METEOROLOGICAL DATA iRixhVV Nddff 00fff 1snTTT 2snTdTdTd
4PPPP 5appp 7wwW1W2 8NhCLCMCH
SECTION 2 — OCEANOGRAPHIC DATA 222Dsvs 0ssTwTwTw 2PwPwHwHw 3dw1dw1dw2dw2 4Pw1Pw1Hw1Hw1
5Pw2Pw2Hw2Hw2 6IsEsEsRs 8swTbTbTb ICE ciSibiDizi
Definition: Wet Bulb temperature, in degrees Celsius and tenths.
Units: Celsius degrees.
Method of Measurement: Psychrometer. The thermometers must be read as soon as possible after ventilation or whirling has stopped. Moisten the wet bulb muslin sleeve thoroughly, on all sides, with distilled water, or the purest water available (ordinary water contains dissolved substances which deposit on the wicking as it evaporates, causing the wet bulb to read to high). Change the wicking weekly, or more often if it becomes dirty or contaminated by salt spray.
If using a sling, from the windward side of the ship, whirl the sling psychrometer at a rate of about 4 revolutions per second for about 1 minute. Read the thermometers immediately, then whirl for another 10 seconds, and read again. If the readings are unchanged, record these as your official temperatures. If the readings are different at the second reading, continue the whirling and reading until two successive sets of readings are the same. If using psychrometers in outdoor shelters, install one on each side of the vessel, and read from the windward side.
For temperatures below 0°C, the muslin wicking should be covered with a thin coating of ice. After moistening the muslin with ice cold water, you should initiate the freezing of the water by touching the muslin with a piece of ice, snow, or other cold object. This may need to be done up to a half hour before observation time, to allow enough time for the ice coating to form. Do not allow the coating of ice on the wet bulb to become too thick — this will result in an incorrect reading. If ice is building up, immerse the wet bulb in a small container of warm water to reduce the ice.
How to Code: The code is direct reading in Celsius degrees.
Examples: 11.6°C measured: TbTbTb = 116 and sw = 0 3.2°C measured: TbTbTb = 032 and sw = 0
–4.8°C computed: TbTbTb = 048 and sw = 6
NWSOH No. 1 2-92 July 2004

2004Part2B.qxp 5/25/06 2:19 PM Page 2-93
Ships Synoptic Code and Observing Methods
Remarks: If possible, shield the psychrometer from precipitation and spray, and from the direct rays of the sun by whirling in the shade. When reading a thermometer, make sure your eye is level with the end of the mercury column.
The wet bulb thermometer works on the principle that water evaporating from the muslin wicking absorbs (removes) heat from the thermometer bulb and mercury. Whirling therefore lowers the temperature of the wet bulb thermometer. The difference between the readings of the dry and wet bulb thermometers is called the depression of the wet bulb.
When the air is very dry, containing little moisture, evaporation will be rapid, and the depression of the wet bulb will be quite large. If the air is very moist, evaporation from the muslin will be slight, and the depression of the wet bulb will be small. At sea, the depression is seldom more than 6°C.
MUSLIN WICKING
A sling psychrometer.
NWSOH No. 1 2-93 July 2004

2004Part2B.qxp 5/25/06 2:19 PM Page 2-94
Ships Synoptic Code and Observing Methods
ci, Concentration or Arrangement of Sea Ice ICE, Indicator for Sea Ice Concentration
SECTION 0 — IDENTIFICATION DATA BBXX D . . . . D YYGGiw 99LaLaLa QcLoLoLoLo
SECTION 1 — METEOROLOGICAL DATA iRixhVV Nddff 00fff 1snTTT 2snTdTdTd
4PPPP 5appp 7wwW1W2 8NhCLCMCH
SECTION 2 — OCEANOGRAPHIC DATA 222Dsvs 0ssTwTwTw 2PwPwHwHw 3dw1dw1dw2dw2 4Pw1Pw1Hw1Hw1
5Pw2Pw2Hw2Hw2 6IsEsEsRs 8swTbTbTb ICE ciSibiDizi
Definition: Concentration or arrangement of sea ice
Units:
Method of Measurement: Visual determination.
How to Code: Code in accordance with the table on the following page.
Remarks: Choose the coding which describes the condition which is of the mostnavigational significance.
Lead: Any fracture or pass-way through sea ice which is navigable by surface vessels.
Pack ice: Term used in a wide sense to include any area of sea ice, other than fast ice,no matter what form it takes or how it is disposed.
Sea ice: Any formed ice found at sea which has originated from freezing of sea water.
Pack Ice Coverage
Code Figures
Open Water <1/10 (1/8) Very Open 1/10 - 3/10 (1/8 < 3/8) Open 4/10 - 6/10 (3/8 < 6/8) Close 7/10 - 8/10 (6/8 < 7/8) Very Close 9/10 - 10/10 (7/8 < 8/8) Compact 10/10 (8/8) and no open water visible Consolidated 10/10 (8/8) and floes are frozen together
NWSOH No. 1 2-94 July 2004
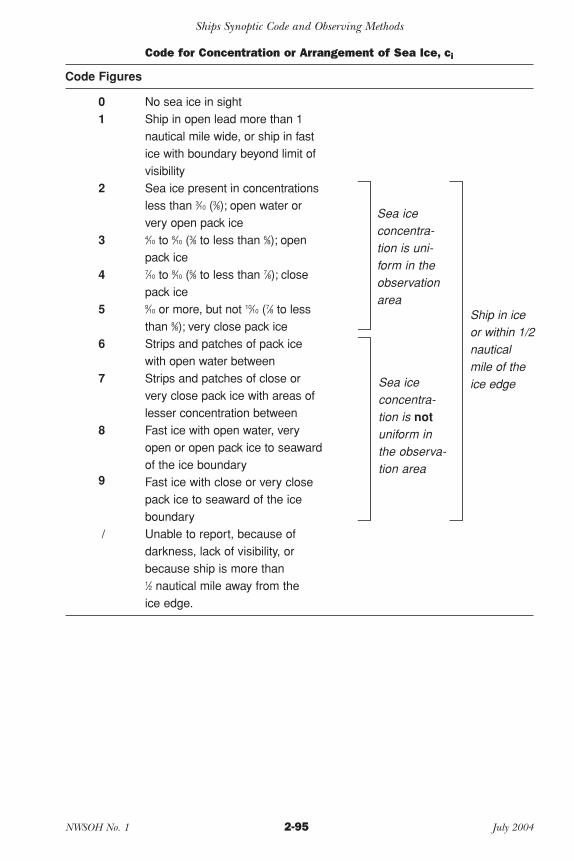
2004Part2B.qxp 5/25/06 2:19 PM Page 2-95
Ships Synoptic Code and Observing Methods
Code for Concentration or Arrangement of Sea Ice, ci
Code Figures
0 No sea ice in sight 1 Ship in open lead more than 1
nautical mile wide, or ship in fastice with boundary beyond limit ofvisibility
2 Sea ice present in concentrationsless than 3⁄10 (3⁄8); open water or
Sea ice -
fation
-
a
orm in theobserv
the observ
very open pack ice concentra
3 4⁄10 to 6⁄10 (3⁄8 to less than 6⁄8); open tion is uni
pack ice 4 7⁄10 to 8⁄10 (6⁄8 to less than 7⁄8); close
pack ice area
5 9⁄10 or more, but not 10⁄10 (7⁄8 to less Ship in ice than 8⁄8); very close pack ice or within 1/2
6 Strips and patches of pack ice nautical with open water between mile of the
7 Strips and patches of close or Sea ice ice edge very close pack ice with areas of concentralesser concentration between tion is not
8 Fast ice with open water, very uniform in open or open pack ice to seawardof the ice boundary tion area
9 Fast ice with close or very close pack ice to seaward of the ice boundary
/ Unable to report, because of darkness, lack of visibility, or because ship is more than 1⁄2 nautical mile away from the ice edge.
NWSOH No. 1 2-95 July 2004

2004Part2B.qxp 5/25/06 2:19 PM Page 2-96
Ships Synoptic Code and Observing Methods
Si, Sea Ice Stage of Development SECTION 0 — IDENTIFICATION DATA
BBXX D . . . . D YYGGiw 99LaLaLa QcLoLoLoLo
SECTION 1 — METEOROLOGICAL DATA iRixhVV Nddff 00fff 1snTTT 2snTdTdTd
4PPPP 5appp 7wwW1W2 8NhCLCMCH
SECTION 2 — OCEANOGRAPHIC DATA 222Dsvs 0ssTwTwTw 2PwPwHwHw 3dw1dw1dw2dw2 4Pw1Pw1Hw1Hw1
5Pw2Pw2Hw2Hw2 6IsEsEsRs 8swTbTbTb ICE ciSibiDizi
Definition: Stage of Development of Sea ice
Units:
Method of Measurement: Visual determination
How to Code:
Code for Stage of Development of Sea Ice, Si
Code Figures
0 New ice only (frazil ice, grease ice, slush ice, shuga) 1 Nilas or ice rind, less than 10 cm thick 2 Young ice (grey ice, grey-white ice), 10-30 cm thick 3 Predominantly new and/or young ice with some first year ice 4 Predominantly thin first-year ice with some new and/or young ice 5 All thin first-year ice (30-70 cm thick) 6 Predominantly medium first-year ice (70-120 cm thick) and thick
first-year ice (more than 120 cm thick) with some thinner (younger) first-year ice
7 All medium and thick first-year ice 8 Predominantly medium and thick first-year ice with some old ice
(usually more than 2 meters thick) 9 Predominantly old ice / Unable to report, because of darkness, lack of visibility, or because
only ice of land origin is visible, or because ship is more than 1⁄2 nautical mile away from ice edge
Remarks: The code figures represent a series of increasing navigational difficulties for any concentration of sea ice.
NWSOH No. 1 2-96 July 2004
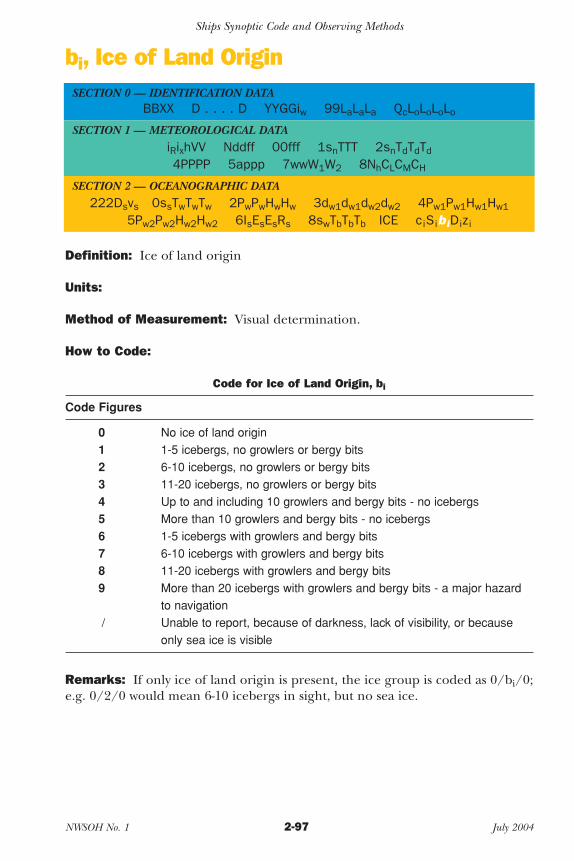
2004Part2B.qxp 5/25/06 2:19 PM Page 2-97
Ships Synoptic Code and Observing Methods
bi, Ice of Land Origin SECTION 0 — IDENTIFICATION DATA
BBXX D . . . . D YYGGiw 99LaLaLa QcLoLoLoLo
SECTION 1 — METEOROLOGICAL DATA iRixhVV Nddff 00fff 1snTTT 2snTdTdTd
4PPPP 5appp 7wwW1W2 8NhCLCMCH
SECTION 2 — OCEANOGRAPHIC DATA 222Dsvs 0ssTwTwTw 2PwPwHwHw 3dw1dw1dw2dw2 4Pw1Pw1Hw1Hw1
5Pw2Pw2Hw2Hw2 6IsEsEsRs 8swTbTbTb ICE ciSibiDizi
Definition: Ice of land origin
Units:
Method of Measurement: Visual determination.
How to Code:
Code for Ice of Land Origin, bi
Code Figures
0 No ice of land origin 1 1-5 icebergs, no growlers or bergy bits 2 6-10 icebergs, no growlers or bergy bits 3 11-20 icebergs, no growlers or bergy bits 4 Up to and including 10 growlers and bergy bits - no icebergs 5 More than 10 growlers and bergy bits - no icebergs 6 1-5 icebergs with growlers and bergy bits 7 6-10 icebergs with growlers and bergy bits 8 11-20 icebergs with growlers and bergy bits 9 More than 20 icebergs with growlers and bergy bits - a major hazard
to navigation / Unable to report, because of darkness, lack of visibility, or because
only sea ice is visible
Remarks: If only ice of land origin is present, the ice group is coded as 0/bi/0; e.g. 0/2/0 would mean 6-10 icebergs in sight, but no sea ice.
NWSOH No. 1 2-97 July 2004
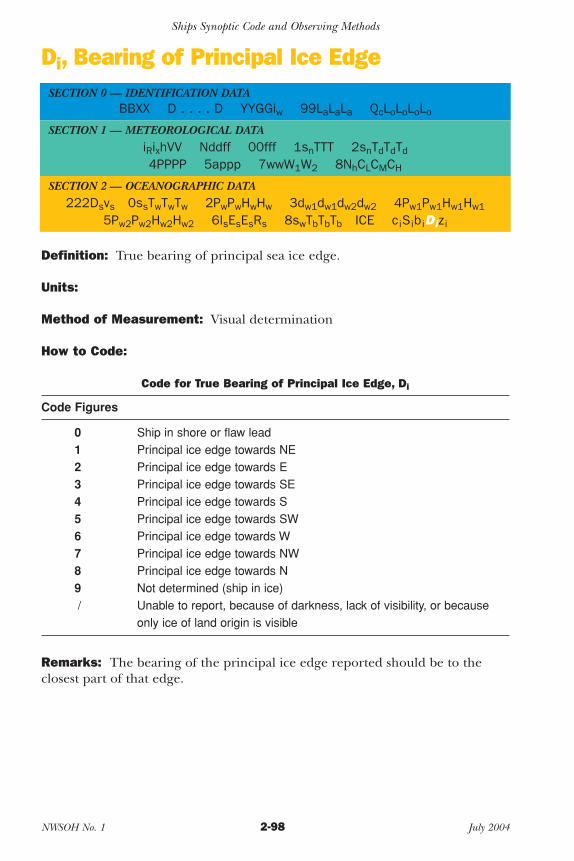
2004Part2B.qxp 5/25/06 2:19 PM Page 2-98
Ships Synoptic Code and Observing Methods
Di, Bearing of Principal Ice Edge SECTION 0 — IDENTIFICATION DATA
BBXX D . . . . D YYGGiw 99LaLaLa QcLoLoLoLo
SECTION 1 — METEOROLOGICAL DATA iRixhVV Nddff 00fff 1snTTT 2snTdTdTd
4PPPP 5appp 7wwW1W2 8NhCLCMCH
SECTION 2 — OCEANOGRAPHIC DATA 222Dsvs 0ssTwTwTw 2PwPwHwHw 3dw1dw1dw2dw2 4Pw1Pw1Hw1Hw1
5Pw2Pw2Hw2Hw2 6IsEsEsRs 8swTbTbTb ICE ciSibiDizi
Definition: True bearing of principal sea ice edge.
Units:
Method of Measurement: Visual determination
How to Code:
Code for True Bearing of Principal Ice Edge, Di
Code Figures
0 Ship in shore or flaw lead 1 Principal ice edge towards NE 2 Principal ice edge towards E 3 Principal ice edge towards SE 4 Principal ice edge towards S 5 Principal ice edge towards SW 6 Principal ice edge towards W 7 Principal ice edge towards NW 8 Principal ice edge towards N 9 Not determined (ship in ice) / Unable to report, because of darkness, lack of visibility, or because
only ice of land origin is visible
Remarks: The bearing of the principal ice edge reported should be to the closest part of that edge.
NWSOH No. 1 2-98 July 2004
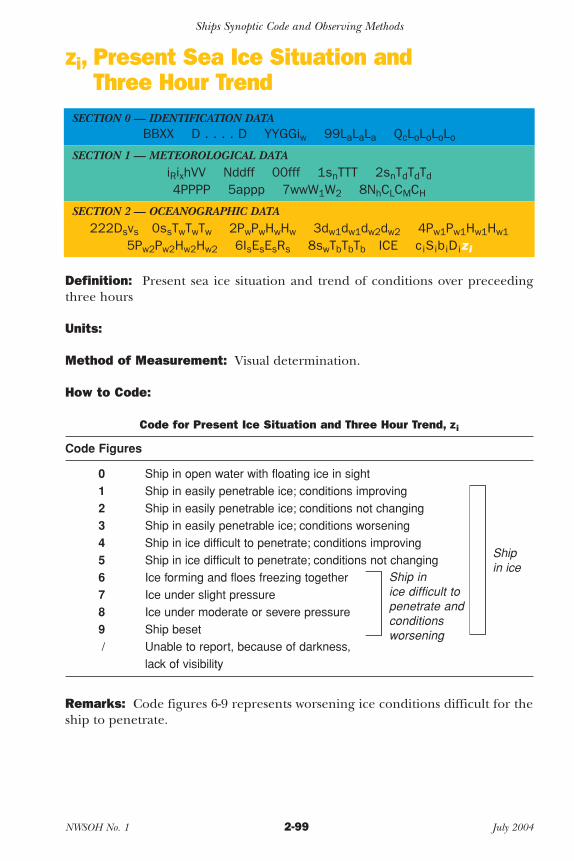
2004Part2B.qxp 5/25/06 2:19 PM Page 2-99
Ships Synoptic Code and Observing Methods
zi, Present Sea Ice Situation and Three Hour Trend
SECTION 0 — IDENTIFICATION DATA BBXX D . . . . D YYGGiw 99LaLaLa QcLoLoLoLo
SECTION 1 — METEOROLOGICAL DATA iRixhVV Nddff 00fff 1snTTT 2snTdTdTd
4PPPP 5appp 7wwW1W2 8NhCLCMCH
SECTION 2 — OCEANOGRAPHIC DATA 222Dsvs 0ssTwTwTw 2PwPwHwHw 3dw1dw1dw2dw2 4Pw1Pw1Hw1Hw1
5Pw2Pw2Hw2Hw2 6IsEsEsRs 8swTbTbTb ICE ciSibiDizi
Definition: Present sea ice situation and trend of conditions over preceeding three hours
Units:
Method of Measurement: Visual determination.
How to Code:
Code for Present Ice Situation and Three Hour Trend, zi
Code Figures
0 Ship in open water with floating ice in sight 1 Ship in easily penetrable ice; conditions improving 2 Ship in easily penetrable ice; conditions not changing 3 Ship in easily penetrable ice; conditions worsening 4 Ship in ice difficult to penetrate; conditions improving 5
Ship in
7 Ice under slight pressure 8 Ice under moderate or severe pressure
6 Ice forming and floes freezing together
conditions9 Ship beset worsening / Unable to report, because of darkness,
lack of visibility
Ship in ice difficult to penetrate; conditions not changing
ice difficult to penetrate and
Ship in ice
Remarks: Code figures 6-9 represents worsening ice conditions difficult for the ship to penetrate.
NWSOH No. 1 2-99 July 2004
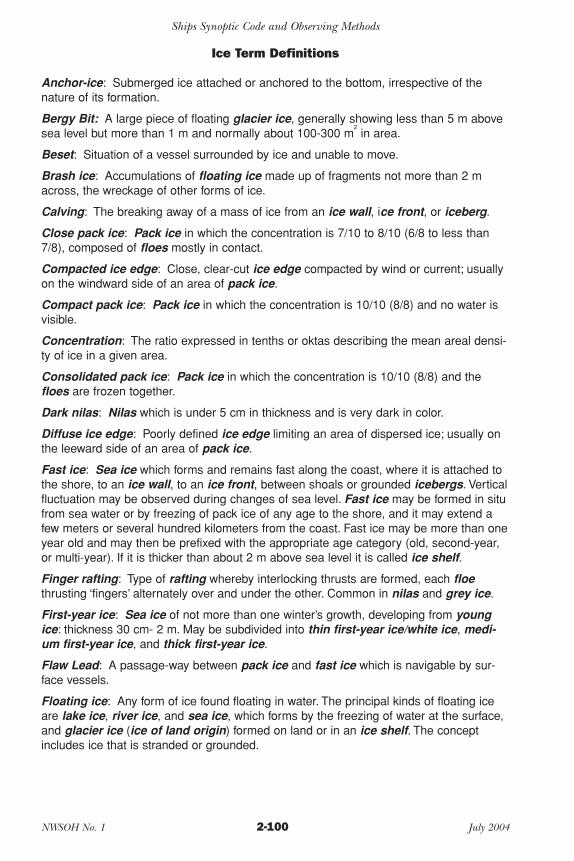
2004Part2B.qxp 5/25/06 2:19 PM Page 2-100
Ships Synoptic Code and Observing Methods
Ice Term Definitions
Anchor-ice: Submerged ice attached or anchored to the bottom, irrespective of the nature of its formation.
Bergy Bit: A large piece of floating glacier ice, generally showing less than 5 m above 2
sea level but more than 1 m and normally about 100-300 m in area.
Beset: Situation of a vessel surrounded by ice and unable to move.
Brash ice: Accumulations of floating ice made up of fragments not more than 2 m across, the wreckage of other forms of ice.
Calving: The breaking away of a mass of ice from an ice wall, ice front, or iceberg.
Close pack ice: Pack ice in which the concentration is 7/10 to 8/10 (6/8 to less than 7/8), composed of floes mostly in contact.
Compacted ice edge: Close, clear-cut ice edge compacted by wind or current; usually on the windward side of an area of pack ice.
Compact pack ice: Pack ice in which the concentration is 10/10 (8/8) and no water is visible.
Concentration: The ratio expressed in tenths or oktas describing the mean areal density of ice in a given area.
Consolidated pack ice: Pack ice in which the concentration is 10/10 (8/8) and the floes are frozen together.
Dark nilas: Nilas which is under 5 cm in thickness and is very dark in color.
Diffuse ice edge: Poorly defined ice edge limiting an area of dispersed ice; usually on the leeward side of an area of pack ice.
Fast ice: Sea ice which forms and remains fast along the coast, where it is attached to the shore, to an ice wall, to an ice front, between shoals or grounded icebergs. Vertical fluctuation may be observed during changes of sea level. Fast ice may be formed in situ from sea water or by freezing of pack ice of any age to the shore, and it may extend a few meters or several hundred kilometers from the coast. Fast ice may be more than one year old and may then be prefixed with the appropriate age category (old, second-year, or multi-year). If it is thicker than about 2 m above sea level it is called ice shelf.
Finger rafting: Type of rafting whereby interlocking thrusts are formed, each floe thrusting ‘fingers’ alternately over and under the other. Common in nilas and grey ice.
First-year ice: Sea ice of not more than one winter’s growth, developing from young ice: thickness 30 cm- 2 m. May be subdivided into thin first-year ice/white ice, medium first-year ice, and thick first-year ice.
Flaw Lead: A passage-way between pack ice and fast ice which is navigable by surface vessels.
Floating ice: Any form of ice found floating in water. The principal kinds of floating ice are lake ice, river ice, and sea ice, which forms by the freezing of water at the surface, and glacier ice (ice of land origin) formed on land or in an ice shelf. The concept includes ice that is stranded or grounded.
NWSOH No. 1 2-100 July 2004
2004Part2B.qxp 5/25/06 2:19 PM Page 2-101
Ships Synoptic Code and Observing Methods
Floe: Any relatively flat piece of sea ice 20 m or more across. Floes are sub-divided according to horizontal extent as follows:
Giant: Over 5.4 n. mile across Vast: 1.1-5.4 n. mile across Big: 500-2000 m across Medium: 100-500 m across Small: 20-100 m across
Floeberg: A massive piece of sea ice composed of a hummock, or a group of hummocks, frozen together and separated from any ice surroundings. It may float up to 5 m above sea level.
Fracture: Any break or rupture through very close pack ice, compact pack ice, consolidated pack ice, fast ice, or a single floe resulting from deformation processes. Fractures may contain brash ice and/or be covered with nilas and/or young ice. Length may vary from a few meters to many nautical miles.
Frazil ice: Fine spicules or plates of ice, suspended in water.
Glacier: A mass of snow and ice continuously moving from higher to lower ground or, if afloat, continuously spreading. The principal forms of glaciers are: inland ice sheets, ice shelves, ice streams, ice caps, ice piedmonts, cirque glaciers and various types of mountain (valley) glaciers.
Glacier berg: An irregularly shaped iceberg.
Glacier ice: Ice in, or originating from, a glacier, whether on land or floating on the sea as icebergs, bergy bits, or growlers.
Grease ice: A later stage of freezing than frazil ice when the crystals have coagulated to form a soupy layer on the surface. Grease ice reflects little light, giving the sea a matt appearance.
Grey ice: Young ice 10-15 cm thick. Less elastic than nilas and breaks on swell. Usually rafts under pressure.
Grey-white ice: Young ice 15-30 cm thick. Under pressure likely to ridge than to raft.
Growler: Smaller piece of ice than a bergy bit or floeberg, often transparent but appearing green or almost black in color, extending less than 1 m above the sea surface and normally occupying an area of about 20m2.
Hummock: A hillock of broken ice which has been forced upwards by pressure. May be fresh or weathered. The submerged volume of broken ice under the hummock, forced downwards, is termed a bummock.
Iceberg: A massive piece of ice greatly varying in shape, more than 5 m above sea level, which has broken away from a glacier, and which may be afloat or aground. Icebergs may be described as tabular, domed-shaped, sloping, pinnacled, weathered or glacier bergs.
Ice boundary: The demarcation at any given time between fast ice and pack ice or between areas of pack ice of different concentrations (cf. ice edge).
Ice edge: The demarcation at any given time between the open sea and sea ice of any kind, whether fast or drifting. It may be termed compacted or diffused (cf. ice boundary).
Ice front: The vertical cliff forming the seaward face of an ice shelf or other floating glacier varying in height from 2 to 50 m or more above sea level (cf. ice wall).
NWSOH No. 1 2-101 July 2004
2004Part2B.qxp 5/25/06 2:20 PM Page 2-102
Ships Synoptic Code and Observing Methods
Ice of land origin: Ice formed on land or in an ice shelf, found floating in water. The concept includes ice that is stranded or grounded.
Ice patch: An area of pack ice less than 5.4 n. mile across.
Ice rind: A brittle shiny crust of ice formed on a quiet surface by direct freezing or from grease ice, usually in water or low salinity. Thickness to about 5 cm. Easily broken by wind or swell, commonly breaking in rectangular pieces.
Ice shelf: A floating ice sheet of considerable thickness showing 2-50 m or more above sea level, attached to the coast. Usually of great horizontal extent and with a level or gently undulating surface. Nourished by annual snow accumulation and often also by the seaward extension of land glaciers. Limited areas may be ground. The seaward edge is termed an ice front.
Ice stream: Part of an inland ice sheet in which the ice flows more rapidly and not necessarily in the same direction as the surrounding ice. The margins are sometimes clearly marked by a change in direction of the surface slope but may be indistinct.
Ice under pressure: Ice in which deformation processes are actively occurring and hence a potential impediment or danger to shipping.
Ice wall: An ice cliff forming the seaward margin of a glacier which is not afloat. An ice wall is aground, the rock basement being at or below sea level (cf. ice front).
Lake ice: Ice formed on a lake, regardless of observed location.
Lead: Any fracture or pass-way through sea ice which is navigable by surface vessels.
Light nilas: Nilas which is more than 5 cm in thickness and rather lighter in color than dark nilas.
Medium first-year ice: First-year ice 70-120 cm thick.
Multi-year ice: Old ice up to 3 m or more thick which has survived at least two sum-mer’s melt. Hummocks even smoother than in second-year ice, and the ice is almost salt-free. Color, where bare, is usually blue. Melt pattern consists of large inter-connect-ing irregular puddles and a well-developed drainage system.
New ice: A general term for recently formed ice which includes frazil ice, grease ice, slush, and shuga. These types of ice are composed of ice crystals which are only weakly frozen together (if at all) and have a definite form only while they are afloat.
Nilas: A thin elastic crust of ice, easily bending on waves and swell and under pressure, thrusting in a pattern of interlocking ‘fingers’ (fingers rafting). Has a matt surface and is up to 10 cm in thickness. May be subdivided into dark nilas and light nilas.
Old ice: Sea ice which has survived at least one summer’s melt. Most topographic features are smoother than first-year ice. May be subdivided into second-year and multiyear ice.
Open pack ice: Pack ice in which the ice concentration is 4/10 to 6/10 (3/8 to less than 6/8), with many leads and polynyas, and the floes are generally not in contact with one another.
Open water: A large area freely navigable water in which sea ice is present in concentrations less than 1/10 (1/8). There may be ice of land origin present, although the total concentration of all ice shall not exceed 1/10 (1/8).
NWSOH No. 1 2-102 July 2004

2004Part2B.qxp 5/25/06 2:20 PM Page 2-103
Ships Synoptic Code and Observing Methods
Pack ice: Term used in a wide sense to include any area of sea ice, other than fast ice, no matter what form it takes or how it is disposed.
Polynya: Any non-linear shaped opening in ice. Polynyas may contain brash ice and/or be covered with new ice, nilas or young ice; submariners refer to these as skylights. Sometimes the polynya is limited on one side by the coast and is called a shore polynya, or by fast ice and is called a flaw polynya. If it recurs in the same position every year, it is called a recurring polynya.
Puddle: An accumulation on ice of melt-water, mainly due to melting snow, but in the more advanced stages also to the melting of ice. Initial stage consists of patches of melted snow.
Rafting: Pressure process whereby one piece of ice overrides another. Most common in new and young ice. (cf. finger rafting).
Ridging: The pressure process in which sea ice is forced into ridges, i.e. a line or wall of broken ice forced up by pressure.
River ice: Ice formed on a river, regardless of observed location.
Sea ice: Any formed ice found at sea which has originated from freezing of sea water.
Second-year ice: Old ice which has survived only one summer’s melt. Because it thicker and less dense than first-year ice, it stands higher out of the water. In contrast to multi-year ice, summer melting produces a regular pattern of numerous small puddles. Bare patches and puddles are usually greenish-blue.
Shuga: An accumulation of spongy white ice lumps, a few centimeters across; they are formed from grease ice or slush and sometimes from anchor-ice rising to the surface.
Slush: Snow which is saturated and mixed with water on land or ice surfaces, or as a viscous floating mass in water after a heavy snowfall.
Strip: Long narrow area of pack ice about 0.5 n. mile or less in width, usually composed of small fragments detached from the main mass of ice, and run together under the influence of wind, swell, or current.
Tabular berg: A flat-topped iceberg. Most tabular bergs form by calving from an ice shelf and snow horizontal banding.
Thick first-year ice: First-year ice over 120 cm thick.
Thin first-year ice/white ice: First-year ice 30-70 cm thick.
Very close pack ice: Pack ice in which the concentration is 9/10 to less than 10/10 (7/8 to less than 8/8).
Very open pack ice: Pack ice in which the concentration is 1/10 to 3/10 (1/8 to less than 3/8) and water preponderates over ice.
Young ice: Ice in the transition stage between nilas and first-year ice, 10-30 cm in thickness. May be subdivided into grey ice and grey-white ice.
NWSOH No. 1 2-103 July 2004

2004Part2B.qxp 5/25/06 2:20 PM Page 2-104
Ships Synoptic Code and Observing Methods
NWSOH No. 1 2-104 July 2004
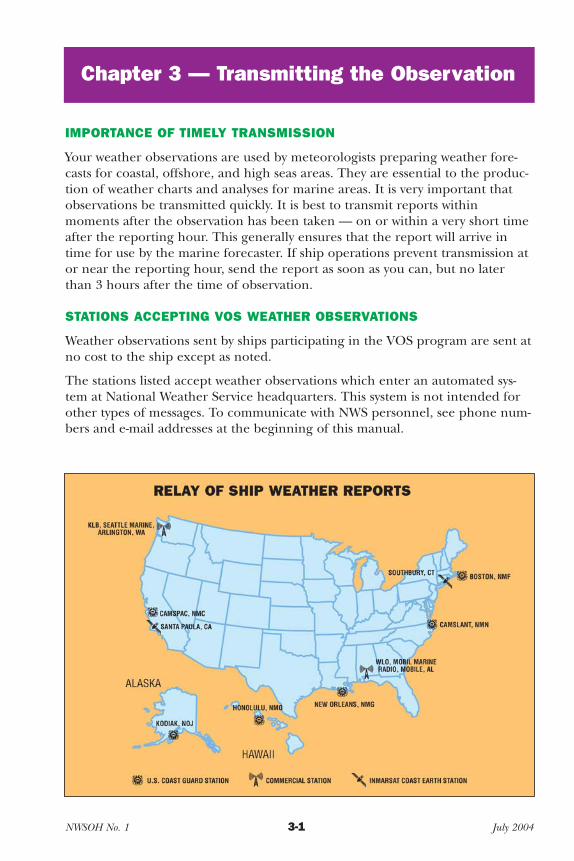
2004Part3.qxp 5/25/06 2:24 PM Page 3-1
Chapter 3 — Transmitting the Observation
IMPORTANCE OF TIMELY TRANSMISSION
Your weather observations are used by meteorologists preparing weather forecasts for coastal, offshore, and high seas areas. They are essential to the production of weather charts and analyses for marine areas. It is very important that observations be transmitted quickly. It is best to transmit reports within moments after the observation has been taken — on or within a very short time after the reporting hour. This generally ensures that the report will arrive in time for use by the marine forecaster. If ship operations prevent transmission at or near the reporting hour, send the report as soon as you can, but no later than 3 hours after the time of observation.
STATIONS ACCEPTING VOS WEATHER OBSERVATIONS
Weather observations sent by ships participating in the VOS program are sent at no cost to the ship except as noted.
The stations listed accept weather observations which enter an automated system at National Weather Service headquarters. This system is not intended for other types of messages. To communicate with NWS personnel, see phone numbers and e-mail addresses at the beginning of this manual.
NWSOH No. 1 3-1 July 2004

2004Part3.qxp 5/25/06 2:24 PM Page 3-2
Transmitting the Observation
INMARSAT
INMARSAT “A” and “B”
Follow the instructions with your INMARSAT terminal for sending a telex message. Use the Special Access Code 41 (except when using the AMVER/SEAS software in compressed binary format with Inmarsat “C” units), and do not request a confirmation when sending. No cost is involved with this transmission.
Below is a typical procedure for using an INMARSAT “A” and “B” terminal.
1. Select appropriate Land Earth Station Identity (LES-ID).See table below.
2. Select routine priority. 3. Select duplex telex channel. 4. Initiate the call. Wait for the GA+ signal. 5. Select the dial code for meteorological reports, 41+. 6. Upon receipt of our answerback, NWS OBS MHTS, transmit the weather
message starting with BBXX and the ship’s call sign. The message must be ended with 5 periods. Do not send any preamble.
GA+41+NWS OBS MHTSBBXX WLXX 29003 99131 70808 41998 60909 10250 2021/ 4011/ 5200371611 85264 22234 00261 20201 31100 40803.....
The 5 periods indicate the end of the message, and must be included after each report. Do not request a confirmation.
INMARSAT “C”
All major Inmarsat “C” terminals have the ability to transmit the encoded weather observation (BBXX) with the Special Access Code 41. No cost is involved with this transmission. Do not request a confirmation when sending. The detailed instructions necessary to setup and address the Code 41 message and transmission instruction according to the different manufactures are listed on our Website at WWW.VOS.NOAA.GOV under VOS Ship Resource Page.
Land-Earth Station Identity (LES-ID) of U.S. Inmarsat Stations Accepting Ships Weather (BBXX) and Oceanographic (JJYY) Reports
Operator Service Station ID
AOR-W AOR-E IOR POR
TELENOR A 01 01 01 01 TELENOR B 01 01 01 01 TELENOR C 001 101 304 201 TELENOR C (AMVER/SEAS) 001 101 304 201 STRATOS/IDB A (octal ID) 13-1 13-1 13-1 13-1 STRATOS/IDB A (decimal ID) 11-1 11-1 11-1 11-1 STRATOS/IDB B 013 013 013 013
NWSOH No. 1 3-2 July 2004
2004Part3.qxp 5/25/06 2:24 PM Page 3-3
Transmitting the Observation
Some common mistakes include (1) failure to end the message with 5 periods when using INMARSAT “A” and “B”, (2) failure to include BBXX in the message preamble, (3) incorrectly coding the Date, Time, Latitude, Longitude, or quadrant of the globe, (4) requesting a confirmation (which increases cost to NWS).
Using The AMVER/SEAS Software
The National Oceanic and Atmospheric Administration (NOAA) and the U. S. Coast Guard (USCG) have created software to assist Volunteer Observing Ships (VOS) in submitting weather reports to worldwide weather networks, and to participate in the Automated Mutual (assistance) Vessel Rescue (AMVER) system. The VOS program allows commercial ships around the world to return marine weather observations to the National Weather Service. The AMVER system allows ships to report their intended track so in the event of an emergency all available resources can be focused on aiding ship(s) in distress.
The U.S. Coast Guard and NOAA pay all transmission costs, provided messages are sent to the Inmarsat C address specified in this user’s guide.
Weather observations should be reported at 0000, 0600, 1200, and 1800 UTC. Ships are also encouraged to submit reports at 0300, 0900, 1500 and 2100 UTC. Each weather observation is also processed as a position report then sent to the Coast Guard AMVER Center.
A typical voyage when using AMVER/SEAS~MET program would require the submission of an AMVER Sail Plan before departure, submission of Weather Observations four times per day and the submission of an Arrival Report. The U. S. Coast Guard updates their database with the position information fromthese reports, which allows them to identify vessels in the vicinity of a ship(s) in distress.
Ships that follow the same routes repeatedly have an additional benefit since Sail Plans can be stored in the computer system, recalled later to change the date and time of departure, rather than creating a new plan each time.
Note: To obtain the AMVER/SEAS~Met software program contact a U.S. PMO or AMVER representative listed at the beginning of this handbook. Visit our Website at WWW.VOS.NOAA.GOV under Amver/Seas software for more information.
Common errors when using the AMVER/SEAS~Met software
• Sending the compressed binary message via the Special Access Code 41. • Sending a plain text message via the Amver/Seas address. • Only TELENOR can accept the Amver/Seas messages in binary format. • Do not attempt to view the file with the Text Editor. (This will added
unwanted characters to the message and corrupt the file) • Do not send form the Text Editor. • Send with the CONFIRMATION request turned OFF.
NWSOH No. 1 3-3 July 2004
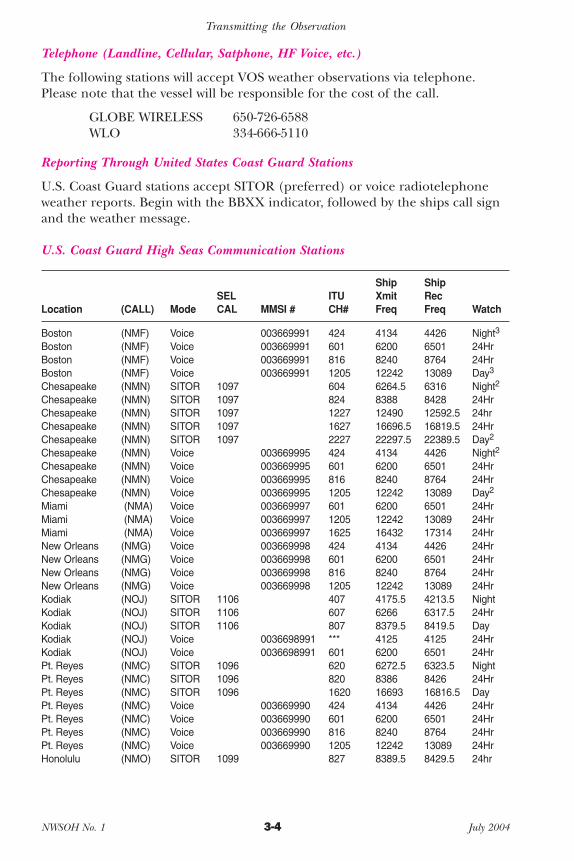
2004Part3.qxp 5/25/06 2:24 PM Page 3-4
Transmitting the Observation
Telephone (Landline, Cellular, Satphone, HF Voice, etc.)
The following stations will accept VOS weather observations via telephone. Please note that the vessel will be responsible for the cost of the call.
GLOBE WIRELESS 650-726-6588WLO 334-666-5110
Reporting Through United States Coast Guard Stations
U.S. Coast Guard stations accept SITOR (preferred) or voice radiotelephoneweather reports. Begin with the BBXX indicator, followed by the ships call sign and the weather message.
U.S. Coast Guard High Seas Communication Stations
Ship Ship SEL ITU Xmit Rec
Location (CALL) Mode CAL MMSI # CH# Freq Freq Watch
Boston (NMF) Voice 003669991 424 4134 4426 Night3
Boston (NMF) Voice 003669991 601 6200 6501 24Hr Boston (NMF) Voice 003669991 816 8240 8764 24Hr Boston (NMF) Voice 003669991 1205 12242 13089 Day3
Chesapeake (NMN) SITOR 1097 604 6264.5 6316 Night2
Chesapeake (NMN) SITOR 1097 824 8388 8428 24Hr Chesapeake (NMN) SITOR 1097 1227 12490 12592.5 24hr Chesapeake (NMN) SITOR 1097 1627 16696.5 16819.5 24Hr Chesapeake (NMN) SITOR 1097 2227 22297.5 22389.5 Day2
Chesapeake (NMN) Voice 003669995 424 4134 4426 Night2
Chesapeake (NMN) Voice 003669995 601 6200 6501 24Hr Chesapeake (NMN) Voice 003669995 816 8240 8764 24Hr Chesapeake (NMN) Voice 003669995 1205 12242 13089 Day2
Miami (NMA) Voice 003669997 601 6200 6501 24Hr Miami (NMA) Voice 003669997 1205 12242 13089 24Hr Miami (NMA) Voice 003669997 1625 16432 17314 24Hr New Orleans (NMG) Voice 003669998 424 4134 4426 24Hr New Orleans (NMG) Voice 003669998 601 6200 6501 24Hr New Orleans (NMG) Voice 003669998 816 8240 8764 24Hr New Orleans (NMG) Voice 003669998 1205 12242 13089 24Hr Kodiak (NOJ) SITOR 1106 407 4175.5 4213.5 Night Kodiak (NOJ) SITOR 1106 607 6266 6317.5 24Hr Kodiak (NOJ) SITOR 1106 807 8379.5 8419.5 Day Kodiak (NOJ) Voice 0036698991 *** 4125 4125 24Hr Kodiak (NOJ) Voice 0036698991 601 6200 6501 24Hr Pt. Reyes (NMC) SITOR 1096 620 6272.5 6323.5 Night Pt. Reyes (NMC) SITOR 1096 820 8386 8426 24Hr Pt. Reyes (NMC) SITOR 1096 1620 16693 16816.5 Day Pt. Reyes (NMC) Voice 003669990 424 4134 4426 24Hr Pt. Reyes (NMC) Voice 003669990 601 6200 6501 24Hr Pt. Reyes (NMC) Voice 003669990 816 8240 8764 24Hr Pt. Reyes (NMC) Voice 003669990 1205 12242 13089 24Hr Honolulu (NMO) SITOR 1099 827 8389.5 8429.5 24hr
NWSOH No. 1 3-4 July 2004
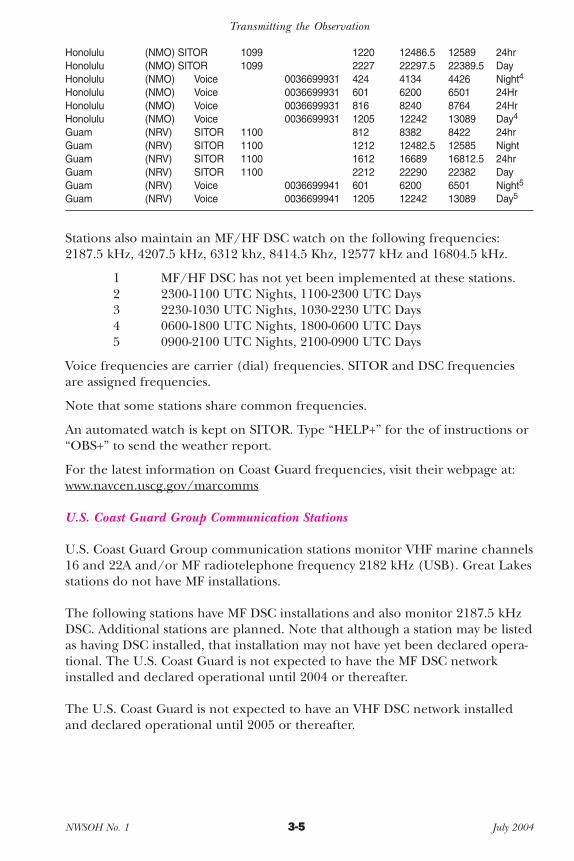
2004Part3.qxp 5/25/06 2:24 PM Page 3-5
Transmitting the Observation
Honolulu (NMO) SITOR 1099 1220 12486.5 12589 24hr Honolulu (NMO) SITOR 1099 2227 22297.5 22389.5 Day Honolulu (NMO) Voice 0036699931 424 4134 4426 Night4
Honolulu (NMO) Voice 0036699931 601 6200 6501 24Hr Honolulu (NMO) Voice 0036699931 816 8240 8764 24Hr Honolulu (NMO) Voice 0036699931 1205 12242 13089 Day4
Guam (NRV) SITOR 1100 812 8382 8422 24hr Guam (NRV) SITOR 1100 1212 12482.5 12585 Night Guam (NRV) SITOR 1100 1612 16689 16812.5 24hr Guam (NRV) SITOR 1100 2212 22290 22382 Day Guam (NRV) Voice 0036699941 601 6200 6501 Night5
Guam (NRV) Voice 0036699941 1205 12242 13089 Day5
Stations also maintain an MF/HF DSC watch on the following frequencies: 2187.5 kHz, 4207.5 kHz, 6312 khz, 8414.5 Khz, 12577 kHz and 16804.5 kHz.
1 MF/HF DSC has not yet been implemented at these stations. 2 2300-1100 UTC Nights, 1100-2300 UTC Days 3 2230-1030 UTC Nights, 1030-2230 UTC Days 4 0600-1800 UTC Nights, 1800-0600 UTC Days 5 0900-2100 UTC Nights, 2100-0900 UTC Days
Voice frequencies are carrier (dial) frequencies. SITOR and DSC frequencies are assigned frequencies.
Note that some stations share common frequencies.
An automated watch is kept on SITOR. Type “HELP+” for the of instructions or “OBS+” to send the weather report.
For the latest information on Coast Guard frequencies, visit their webpage at: www.navcen.uscg.gov/marcomms
U.S. Coast Guard Group Communication Stations
U.S. Coast Guard Group communication stations monitor VHF marine channels16 and 22A and/or MF radiotelephone frequency 2182 kHz (USB). Great Lakes stations do not have MF installations.
The following stations have MF DSC installations and also monitor 2187.5 kHz DSC. Additional stations are planned. Note that although a station may be listed as having DSC installed, that installation may not have yet been declared operational. The U.S. Coast Guard is not expected to have the MF DSC network installed and declared operational until 2004 or thereafter.
The U.S. Coast Guard is not expected to have an VHF DSC network installed and declared operational until 2005 or thereafter.
NWSOH No. 1 3-5 July 2004
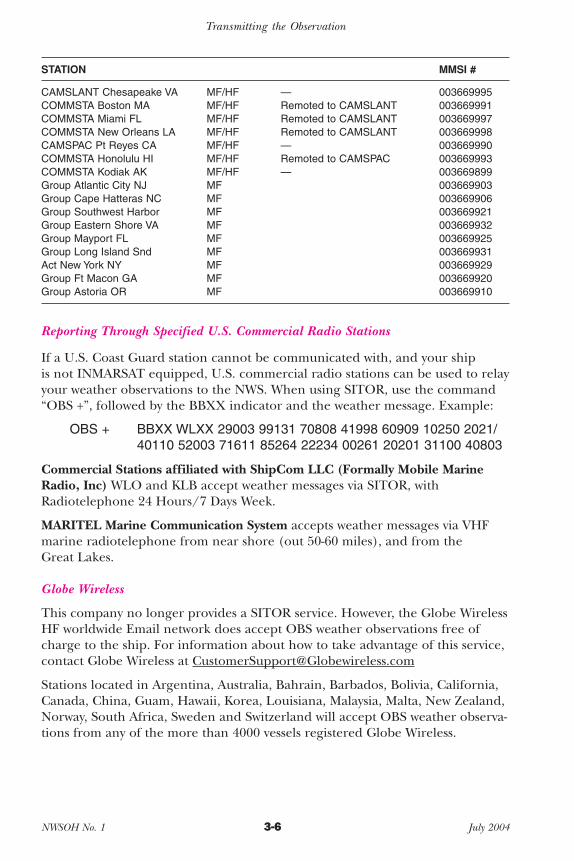
2004Part3.qxp 5/25/06 2:24 PM Page 3-6
Transmitting the Observation
STATION MMSI #
CAMSLANT Chesapeake VA MF/HF — 003669995 COMMSTA Boston MA MF/HF Remoted to CAMSLANT 003669991 COMMSTA Miami FL MF/HF Remoted to CAMSLANT 003669997 COMMSTA New Orleans LA MF/HF Remoted to CAMSLANT 003669998 CAMSPAC Pt Reyes CA MF/HF — 003669990 COMMSTA Honolulu HI MF/HF Remoted to CAMSPAC 003669993 COMMSTA Kodiak AK MF/HF — 003669899 Group Atlantic City NJ MF 003669903 Group Cape Hatteras NC MF 003669906 Group Southwest Harbor MF 003669921 Group Eastern Shore VA MF 003669932 Group Mayport FL MF 003669925 Group Long Island Snd MF 003669931 Act New York NY MF 003669929 Group Ft Macon GA MF 003669920 Group Astoria OR MF 003669910
Reporting Through Specified U.S. Commercial Radio Stations
If a U.S. Coast Guard station cannot be communicated with, and your ship is not INMARSAT equipped, U.S. commercial radio stations can be used to relay your weather observations to the NWS. When using SITOR, use the command “OBS +”, followed by the BBXX indicator and the weather message. Example:
OBS + BBXX WLXX 29003 99131 70808 41998 60909 10250 2021/ 40110 52003 71611 85264 22234 00261 20201 31100 40803
Commercial Stations affiliated with ShipCom LLC (Formally Mobile Marine Radio, Inc) WLO and KLB accept weather messages via SITOR, with Radiotelephone 24 Hours/7 Days Week.
MARITEL Marine Communication System accepts weather messages via VHF marine radiotelephone from near shore (out 50-60 miles), and from the Great Lakes.
Globe Wireless
This company no longer provides a SITOR service. However, the Globe Wireless HF worldwide Email network does accept OBS weather observations free of charge to the ship. For information about how to take advantage of this service, contact Globe Wireless at [email protected]
Stations located in Argentina, Australia, Bahrain, Barbados, Bolivia, California, Canada, China, Guam, Hawaii, Korea, Louisiana, Malaysia, Malta, New Zealand, Norway, South Africa, Sweden and Switzerland will accept OBS weather observations from any of the more than 4000 vessels registered Globe Wireless.
NWSOH No. 1 3-6 July 2004

2004Part3.qxp 5/25/06 2:24 PM Page 3-7
Transmitting the Observation
From the Globe Wireless mail client select “Services”, then “OBS” to send a weather observations. When using the Microsoft Outlook client address the message To: “OBS”. Format the data in the message using the BBXX indicator as described in this Handbook.
ShipCom LLC (Formally Mobile Marine Radio Inc)
Callsign: Mode SelCal MMSI ITU Ch ShipTx ShipRX
WLO SITOR 1090 003660003 406 4175 4213 WLO SITOR 1090 003660003 606 6265.5 6317 WLO SITOR 1090 003660003 806 8379 8419 WLO SITOR 1090 003660003 810 8381 8421 WLO SITOR 1090 003660003 815 8383.5 8423.5 WLO SITOR 1090 003660003 1205 12479 12581.5 WLO SITOR 1090 003660003 1211 12482 12584.5 WLO SITOR 1090 003660003 1605 16685.5 16809 WLO SITOR 1090 003660003 1615 16690.5 16814 WLO SITOR 1090 003660003 1810 18875 19685.5 WLO SITOR 1090 003660003 2215 22291.5 22383.5
WLO VOICE 003660003 MF/calling 2182 2182 WLO VOICE 003660003 405 4077 4369 WLO VOICE 003660003 414 4104 4396 WLO VOICE 003660003 607 6218 6519 WLO VOICE 003660003 824 8264 8788 WLO VOICE 003660003 830 8282 8806 WLO VOICE 003660003 1212 12263 13110 WLO VOICE 003660003 1226 12305 13152 WLO VOICE 003660003 1607 16378 17260 WLO VOICE 003660003 1641 16480 17362 WLO VOICE 003660003 1807 18798 19773 WLO VOICE 003660003 2237 22108 22804 WLO VOICE 25 VHF VHF WLO VOICE 84 VHF VHF WLO VOICE 87 VHF VHF WLO VOICE 28 VHF VHF
WLO DSC 003660003 70 VHF VHF WLO DSC 003660003 HF 4207.5 4207.5 WLO DSC 003660003 HF 8414.5 8414.5 WLO DSC 003660003 HF 12577 12577 WLO DSC 003660003 HF 16804.5 16804.5
KLB VOICE 417 4113 4405 KLB VOICE 805 8207 8731 KLB VOICE 1209 12254 13101 KLB VOICE 1624 16429 17311
KLB SITOR 1113 003660003 408 4176 4214 KLB SITOR 1113 003660003 608 6266.5 6318 KLB SITOR 1113 003660003 818 8385 8425 KLB SITOR 1113 003660003 1223 12488 12590.5 KLB SITOR 1113 003660003 1604 16685 16808.5
HOURS OF OPERATION ARE 24/7 CONTINUOUS FOR ALL MODES
NWSOH No. 1 3-7 July 2004
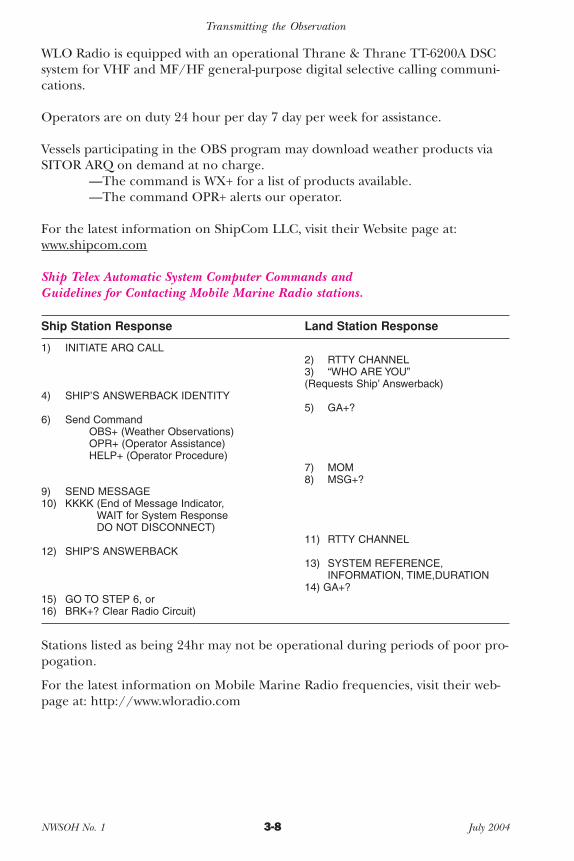
2004Part3.qxp 5/25/06 2:24 PM Page 3-8
Transmitting the Observation
WLO Radio is equipped with an operational Thrane & Thrane TT-6200A DSC system for VHF and MF/HF general-purpose digital selective calling communications.
Operators are on duty 24 hour per day 7 day per week for assistance.
Vessels participating in the OBS program may download weather products via SITOR ARQ on demand at no charge.
—The command is WX+ for a list of products available. —The command OPR+ alerts our operator.
For the latest information on ShipCom LLC, visit their Website page at: www.shipcom.com
Ship Telex Automatic System Computer Commands and Guidelines for Contacting Mobile Marine Radio stations.
Ship Station Response Land Station Response
1) INITIATE ARQ CALL
4) SHIP’S ANSWERBACK IDENTITY
6) Send Command OBS+ (Weather Observations) OPR+ (Operator Assistance) HELP+ (Operator Procedure)
9) SEND MESSAGE 10) KKKK (End of Message Indicator,
WAIT for System Response DO NOT DISCONNECT)
12) SHIP’S ANSWERBACK
15) GO TO STEP 6, or 16) BRK+? Clear Radio Circuit)
2) RTTY CHANNEL 3) “WHO ARE YOU” (Requests Ship’ Answerback)
5) GA+?
7) MOM 8) MSG+?
11) RTTY CHANNEL
13) SYSTEM REFERENCE, INFORMATION, TIME,DURATION
14) GA+?
Stations listed as being 24hr may not be operational during periods of poor propogation.
For the latest information on Mobile Marine Radio frequencies, visit their web-page at: http://www.wloradio.com
NWSOH No. 1 3-8 July 2004

2004Part3.qxp 5/25/06 2:24 PM Page 3-9
Transmitting the Observation
MILITARY COMMUNICATIONS CIRCUITS
Navy, Naval, Army and U.S. Coast Guard ships wishing to participate in the VOS program may do so by sending unclassified weather observations in synoptic code (BBXX format) to the following Plain Language ADdress (PLAD):
SHIP OBS NWS SILVER SPRING MD
As weather observations received by NWS are public data, vessels should check with their local command before participating in the VOS Program.
WHEN TO USE U.S. RELAY STATIONS
Transmit your weather observations using a U.S. relay station (U.S. Coast Guard, INMARSAT, or specified commercial) when you are operating within the NWS forecast and warning areas, shown below:
Pacific Ocean: 160° east eastward to the coast, and north of 25° south
Atlantic Ocean: 35° west westward to the coast, including the Gulf Of Mexico and Carribean Sea, and north of 3° north
Guam Area: Between 5° north and 25° north, and from 135° east to 160° east
When outside these areas, send your observations to the nearest foreign station that appears on this Internet Website.
— www.wmo.ch/web/aom/marprog/Operational-Information/inmarsat-code41-stations.htm
— www.bom.gov.au/jcomm/vos – Go to Links and Resources/Operational Information/LES Accepting
Ship Reports.
Note: When using stations listed on this Website, according to the instructions, your vessel will not have to pay transmission costs. The host governments pick up costs.
NWSOH No. 1 3-9 July 2004
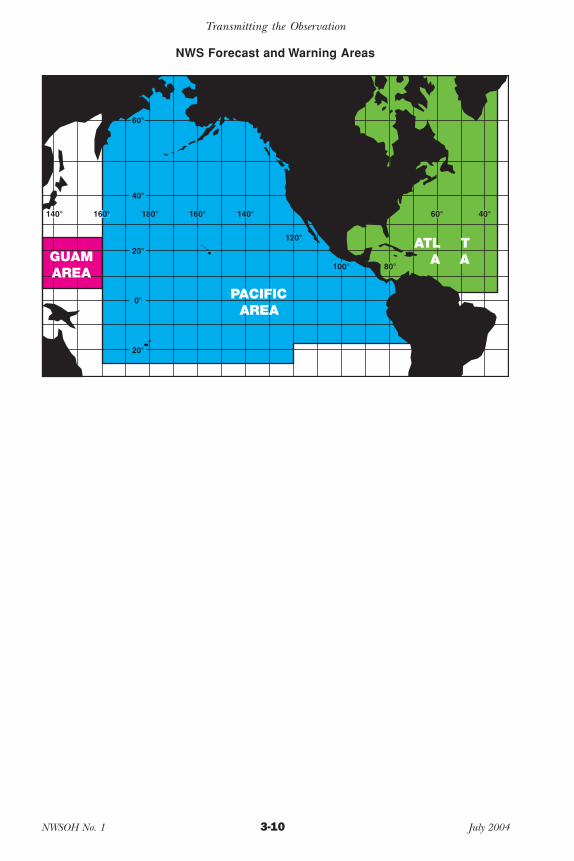
2004Part3.qxp 5/25/06 2:24 PM Page 3-10
Transmitting the Observation
NWS Forecast and Warning Areas
NWSOH No. 1 3-10 July 2004

2004Part4.qxp 5/25/06 2:21 PM Page 4-1
Chapter 4 — The Weatherwise Mariner
A man who is not afraid of the sea will soon be drowned, for he’ll be going out on a day he shouldn’t. But we do be afraid of the sea, and we do only be drowned now and again.
From The Arran Islands by J. M. Synge
Nothing affects the mariner as completely as does the weather. Anticipating changes to both weather and sea conditions can be of critical importance. To forecast what lies ahead you should capitalize on every available lead to future weather. This includes (1) understanding your own observations, and how to interprete them, (2) heeding professionally prepared weather forecasts and storm warnings, (3) studying marine weather and climatological summaries or atlases, and (4) making use of weather charts and analyses available via radiofacsimile.
SHIPBOARD OBSERVATIONS AS A GUIDE TO FUTURE WEATHER CONDITIONS
Your observations are dependable guides in determining future weather conditions. The following factors should be considered when making a forecast:
Pressure and pressure changes Pressure changes, or a lack thereof, are very significant weather indicators. The approach of a low pressure or frontal system, tropical depression, storm, or hurricane is heralded by falling pressure. A steady, persistent drop in pressure normally indicates that foul weather is on the way. Be particularly wary of a rapid or sudden pressure fall of considerable magnitude. A steady and persistent rise in pressure is indicative of a period of settled or stable weather. Steep pressure rises and falls are often accompanied by strong wind. The passage of a front is often marked by a fall and subsequent steadying of pressure, or a fall followed by a rise in pressure. High pressures accompanied by slow pressure changes usually indicate a location within or near the center of a large high pressure area.
Wind Wind shifts are very meaningful, and usually foretell a change in the weather. If, during stormy conditions, the wind shifts from the east, southeast, or northeast, to the west, northwest, or north (in the northern hemisphere), the weather should soon begin to clear. During fair weather, if the wind shifts from the west, southwest, or northwest, to the east, northeast, or southeast, (in northern hemisphere middle latitudes), a deterioration in weather conditions is likely (especially with a falling barometer). In general (but not always), fair weather comes with a wind from the southwest, west, or northwest, and unsettled weather is usually associated with wind from the east, southeast, or northeast (all wind directions are reversed for the southern hemisphere).
NWSOH No. 1 4-1 July 2004
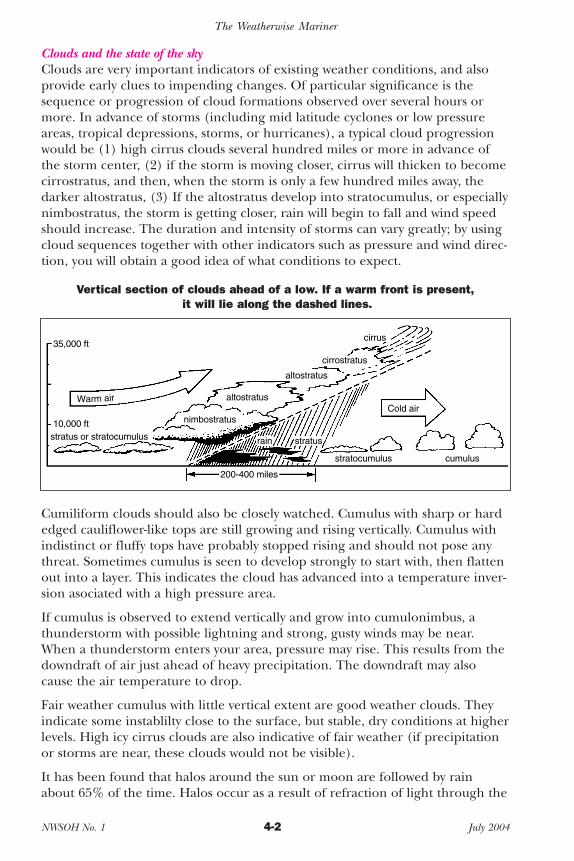
2004Part4.qxp 5/25/06 2:21 PM Page 4-2
The Weatherwise Mariner
Clouds and the state of the sky Clouds are very important indicators of existing weather conditions, and also provide early clues to impending changes. Of particular significance is the sequence or progression of cloud formations observed over several hours or more. In advance of storms (including mid latitude cyclones or low pressure areas, tropical depressions, storms, or hurricanes), a typical cloud progression would be (1) high cirrus clouds several hundred miles or more in advance of the storm center, (2) if the storm is moving closer, cirrus will thicken to become cirrostratus, and then, when the storm is only a few hundred miles away, the darker altostratus, (3) If the altostratus develop into stratocumulus, or especially nimbostratus, the storm is getting closer, rain will begin to fall and wind speed should increase. The duration and intensity of storms can vary greatly; by using cloud sequences together with other indicators such as pressure and wind direction, you will obtain a good idea of what conditions to expect.
Vertical section of clouds ahead of a low. If a warm front is present, it will lie along the dashed lines.
cirrus35,000 ft
cirrostratus
altostratus
altostratus Cold air
10,000 ft nimbostratus
stratus or stratocumulus rain stratus
stratocumulus cumulus
200-400 miles
m airWar
Cumiliform clouds should also be closely watched. Cumulus with sharp or hard edged cauliflower-like tops are still growing and rising vertically. Cumulus with indistinct or fluffy tops have probably stopped rising and should not pose any threat. Sometimes cumulus is seen to develop strongly to start with, then flatten out into a layer. This indicates the cloud has advanced into a temperature inversion asociated with a high pressure area.
If cumulus is observed to extend vertically and grow into cumulonimbus, a thunderstorm with possible lightning and strong, gusty winds may be near. When a thunderstorm enters your area, pressure may rise. This results from the downdraft of air just ahead of heavy precipitation. The downdraft may also cause the air temperature to drop.
Fair weather cumulus with little vertical extent are good weather clouds. They indicate some instablilty close to the surface, but stable, dry conditions at higher levels. High icy cirrus clouds are also indicative of fair weather (if precipitation or storms are near, these clouds would not be visible).
It has been found that halos around the sun or moon are followed by rain about 65% of the time. Halos occur as a result of refraction of light through the
NWSOH No. 1 4-2 July 2004
2004Part4.qxp 5/25/06 2:21 PM Page 4-3
The Weatherwise Mariner
ice crystals of cirrostratus clouds. As already indicated, cirrostratus is often the first sign of an approaching storm or warm front. In the middle latitudes of the northern hemisphere, a halo with northeast, east, or southeast wind, and falling barometer, can be a fairly reliable indicator of inclement weather to follow.
Temperature and humidity There is a good possibility of fog formation whenever the wet bulb depression is slight, or when dew point temperature is close to the wet bulb temperature. The fall in night-time temperature should be watched — if the wet bulb depression narrows, there is a greater likelihood of fog formation.
Also, an increasing dew point temperature or a narrowing of the wet bulb depression may indicate the approach of a front or storm system with inclement weather. On the other hand, a low dew point temperature and large wet bulb depression indicate very dry conditions associated with high pressure areas, good visibility, and generally settled weather conditions.
Sea and swell The arrival or absence of swell provides a clear distinction between the advance of a local thunderstorm and an approaching well developed storm center. A threatening sky with increasing and thickening clouds, but without any swell, cannot be part of a large storm system, so any bad weather will probably be short lived. However, increasing swell from the direction of advance of the storm clouds would suggest an approaching storm with a large area of strong winds. The appearance of a heavy, rolling swell often indicates the approach of a tropical storm. Such swell are the remains of huge, decayed waves generated by the storm, but which travel faster than the storm.
The presence of swell for a long time without any significant change in weather conditions is difficult to interprete. A storm system may be approaching, but very slowly, or it may have already passed by.
WEATHER FORECASTS AND STORM WARNINGS
Always take advantage of professionally prepared weather forecasts and storm warnings, either from the NWS or from privately operated companies. Professional forecasters obtain vast amounts of data from worldwide sources, which allows them to locate and closely follow the movement of weather systems. Forecasters use numerical models which provide detailed forecast guidance out 72 hours or more from run time, and which also provide useful data out 144 hours (6 days) or more.
MARINE CLIMATOLOGICAL SUMMARIES OR ATLASES
Climatological atlases generally provide information based on conditions averaged over long periods of time, and provide an indication of the range in weather and sea conditions to be expected in a particular area. The National Imaging and Mapping Agency (1-800-638-8972) prepares marine climatological atlases for the worlds oceans, which contain much meteorological and oceanographic information. Included is information about prevailing winds, currents, atmospheric pressure, the movement of ice, etc. See http://www.nima.mil/.
NWSOH No. 1 4-3 July 2004
2004Part4.qxp 5/25/06 2:21 PM Page 4-4
The Weatherwise Mariner
USING WEATHER CHARTS AND ANALYSES
The weather charts received via radiofacsimile provide a wealth of information allowing you to do your own forecasting. Perhaps the most useful chart is the surface analysis, which indicates the locations of Highs, lows, fronts, tropical storms, and also contains plotted surface reports, including ship reports. Your PMO can answer questions about using the surface and upper air weather analyses.
WEATHER LORE, JINGLES AND PROVERBS
Weather forecasting and supporting data acquisition programs (such as the VOS program) are a recent human advancement. Until the development of modern meteorology within the last hundred years, people relied on their own observations and experience to make weather predictions. It was known that certain atmospheric conditions were likely to produce certain kinds of weather, and this knowledge was often put into verses or proverbs. Some of the more accurate of the old sayings are shown below. All wind and compass directions are for the northern hemisphere (especially middle latitudes), and would reverse for the southern hemisphere.
Beware the bolts from north or westIn south or east the bolts be best
Fairly reliable in the northern hemisphere middle latitudes, where weather generally moves from west to east. Lightning to the north or west could mean a thunderstorm coming towards you.
Rainbow to windward foul fall the day Rainbow to leeward, rain runs away
A windward rainbow indicates rain upwind, so it may begin raining soon. A rainbow behind the wind or to leeward implies the rain has probably past.
If wooly fleece deck the heavenly way Be sure no rain will mar the day
or
If fleecy white clouds cover the heavenly way no rain should mar your plans that day
Wooly fleece or fleecy white clouds refer to cumulus clouds with little vertical development (fair weather cumulus). This is sound folklore (as long as the clouds remain flat and do not grow vertically later on).
Mountains in the morning Fountains in the evening
The mountains refer to high, billowing cumulus clouds, indicative of instability and possible development of cumulonimbus clouds and a late afternoon or evening thunderstorm.
NWSOH No. 1 4-4 July 2004
2004Part4.qxp 5/25/06 2:21 PM Page 4-5
The Weatherwise Mariner
When a halo rings the moon or sun Rains approaching on the run
As already indicated, a halo around the sun or moon is followed by inclement weather about 65% of the time.
Short notice, soon to pass Long notice, long will last
or
Long foretold—long last Short notice—soon past
The approach of a major storm system with bad weather lasting several hours or more is revealed well in advance — by cloud formations, changing wind direction, falling atmospheric pressure, the arrival of swell, etc. However, a short lived bad weather event, such as a local thunderstorm, might only be revealed a short while ahead of time, such as from cumulus growing into cumulonimbus. This is, therefore, a fairly accurate jingle.
Seagull, seagull, get out on T’sand We’ll never have good weather with thee on the land
During fair weather, gulls scavenge at the waters edge or offshore. During stormy weather, they often fly inland and scavenge at waste dumps. However, they usually don’t do this until after the storm has arrived!
When the glass falls low Look out for a blow
or
When the wind backs, and the weather glass falls, Then be on your guard against gales and squalls
Sound advice, because as already indicated, a steady, persistent fall in atmospheric pressure is often a good indication of foul weather to come. This is particularly true with a windshift from the west to the east, northeast or southeast.
Red sky at night, sailors delight Red sky in the morning, sailors take warning
This is probably the most famous of all weather sayings, and is true more often than not. A red sky at sunset or early evening indicates clouds to the east, with clearing on the western horizon allowing the setting sun to be seen. Unsettled weather or stormyness may have passed or be moving out. A red sky in the morning indicates clouds to the west as the sun is rising, which may advance eastward and bring bad weather with them.
NWSOH No. 1 4-5 July 2004

2004Part4.qxp 5/25/06 2:21 PM Page 4-6
The Weatherwise Mariner
When the wind before the rainLet your topsails draw againWhen the rain before the windTopsail sheets and halyards mind
A small, weak, frontal system will have a narrow band of associated rain, and wind may be more conspicuous than rain. Stronger fronts and intense depressions are surrounded by bad weather for considerable distances, and precipitation should preceed the strongest wind.
Mackeral skys and mares tails Make lofty ships carry low sails
The mackeral sky is composed of cirrus and cirrocumulus clouds (which resemble scale patterns on a mackerals back). The mares tails refer to trails of ice crystals blown in streaks from cirrus clouds. These clouds may appear ahead of an approaching storm or frontal system, and can indicate strong winds aloft. If the cirrus and/or cirrocumulus thicken to cirrostratus, altostratus, and then nimbostratus, stormy conditions may be on the way. Strong winds require less sail for navigation in a rough sea.
Sound traveling far and wide A stormy day will betide
Low, dense, rainy, stratus and nimbostratus clouds trap sounds by preventing them from escaping into the atmosphere above. Voices or noise may appear louder and travel further when these clouds are present.
Frost or dew in the morning light Shows no rain before the night
The formation of frost or dew requires night time cooling which usually occurs only on very clear, calm nights. Such a night is usually followed by fair, sunny daytime weather, so inclement weather would be unlikely. However, a weather system moving very rapidly could arrive during the day, thus interfering with this proverb.
First rise after lowPortends a stronger blow
The strongest, gustiest wind often does not occur until the barometer reaches it’s lowest value and begins to rise. This is especially true in intense, well developed storm systems. Pressure gradients behind the low center can be very strong, giving rise to dangerous, unpredictable gales.
NWSOH No. 1 4-6 July 2004
2004Part5.qxp 5/25/06 2:22 PM Page 5-1
Glossary
3-hour observation Observations taken at 3-hourly intervals, such as 0300, 0600, 0900, UTC, etc.
6-hour observation Observations taken a 6-hourly intervals, such as 0000, 0600, 1200, 1800 UTC. These are also known as the main synoptic times.
Alto- Cloud prefix meaning middle level.
Altocumulus White or gray patch, sheet, or layer of cloud, generally with shading, composed of rounded masses, rolls, etc., sometimes partly fibrous, which may or may not be merged. Mainly composed of water droplets.
Altostratus Grayish or bluish sheet or layer of striated, fibrous, or uniform appearance, having parts thin enough to see the sun, as through ground glass.
Anemometer An instrument for measuring wind speed and direction. Typically, 3 or 4 rotating cups measure speed and a vane indicates direction.
Atmospheric pressure The pressure exerted by the atmosphere at a given point. Ships report pressure at sea level.
Bar Unit of pressure equal to 1,000,000 dynes per square centimeter, or 1000 millibars.
Barogram A record of pressure produced by a barograph.
Barograph A recording barometer.
Barometer An instrument that measures atmospheric pressure. The aneroid barometer is the standard instrument aboard ship.
Barometric pressure The atmospheric pressure value indicated by the barometer.
Barometric tendency See pressure tendency.
Beaufort wind scale A numerical scale of wind force originally designed by Admiral Francis Beaufort in the early 19th century. Today, it consists of ranges of wind speed with appropriate descriptions of sea state.
Bergy bit A piece of ice which has broken away from an iceberg, extending 1-5 meters above the sea surface and 100-300 square meters in area. Can also be the remains of a melting iceberg.
Celsius temperature Same as Centigrade temperature scale where the boiling point is 100 degrees and the freezing point is 0 degrees.
Cirro- Cloud prefix meaning high level.
Cirrocumulus Thin white patch, sheet, or layer of cloud without shading, composed of very small elements in the form of ripples, grains, etc.
Cirrostratus Transparent, whitish cloud veil of fibrous (hairlike) or smooth appearance, often producing a halo.
Cirrus Clouds of ice crystals in the form of delicate white filaments, or white or mostly white patches or narrow bands, with a fibrous appearance or silky sheen.
Cloud A visible aggregate of minute water droplets or ice crystals in the atmosphere.
NWSOH No. 1 5-1 July 2004
2004Part5.qxp 5/25/06 2:22 PM Page 5-2
Cloud height The height of the base of a cloud or cloud layer above the sea surface.
Cloud layer A grouping of clouds whose bases are at approximately the same level.
Cloud type A cloud form which is identified as distinct according to the World Meteorological Organization International Cloud Atlas.
Condensation The physical process by which a vapor becomes a liquid or a solid.
Crest The highest part of a wave.
Cumulonimbus Heavy, dense cloud, with considerable vertical extent, in the form of a mountain or huge tower. Part of upper portion usually, but not always, smooth or fibrous.
Cumulus Detached clouds, generally dense and with sharp outlines, developing vertically in the form of rising mounds, domes, or towers, of which the bulging upper part often resembles a cauliflower. The sunlit parts are brilliant white; bases can be dark and nearly horizontal.
Dew point The temperature to which the air must be cooled in order for saturation to occur.
Drizzle Fairly uniform precipitation composed exclusively of fine drops, very close together. Diameter less than 0.02 inch or 0.5 millimeter.
Evaporation The process of change from liquid water to water vapor.
Fog A suspension of very small water droplets in the air, reducing horizontal visibility.
Fracto- Cloud prefix meaning torn, ragged, or scattered appearance due to strong winds.
Freak Wave A wave of great height and steepness, much higher than other waves in the prevailing sea or swell system.
Freezing Rain Rain that freezes on impact and forms a glaze on the ground and exposed objects.
Growler Similiar to a bergy bit, but smaller, extending less than 1 meter above the sea surface and occupying an area of 20 square meters or less.
Gust Sudden brief wind speed increase followed by lull or slackening.
Hail Precipitation in the form of small balls or irregular pieces of ice.
Haze A suspension of very small, dry (non-liquid) particles in the air, such as dust, sea salt, or soot. Results in diminished visibility. Distinguished from fog by its dryness.
Hectopascal A unit of measure of atmospheric pressure equal to 100 newtons per square meter. It is the numerical equivalant of a millibar.
Horizon The distant line along which the sea surface, or the earth, and the sky appear to meet. It is the actual lower boundary of the observed sky or the upper outline of terrestrial objects.
Hygrometer Instrument to measure humidity. The wet- and dry-bulb sling psychrometer is a type of hygrometer.
Iceberg A piece of a glacier which has broken off and is floating in the sea.
Ice pellets Pellets or small pieces of ice, with a diameter of 5 millimeters or less, which bounce on impact.
NWSOH No. 1 5-2 July 2004
2004Part5.qxp 5/25/06 2:22 PM Page 5-3
Icing Accumulation of ice on the ship’s superstructure, from freezing precipitation, ocean spray, supercooled fog, or cloud droplets.
Intermediate synoptic times The times of 0300, 0900, 1500, and 2100 UTC.
Knot One nautical mile per hour or approximately .5 meters per second.
Land Ice Any ice of land origin, from the freezing of fresh water or the compacting of snow, such as an iceberg.
Lenticular A type of cloud formed in the ascending portion of an airstream, which remains stationary while the air blows through it.
Main synoptic times The times of 0000, 0600, 1200, and 1800 UTC. Also known as the standard synoptic times.
Millibar One one-thousandth of a bar. Numerically the same as a hectopascal. The weight of an average column of air at sea level is 1016 millibars.
Nautical mile 1852 meters, or 6080.2 feet.
Nimbostratus Gray cloud layer, often dark, thick enough to block out the sun, which appears diffuse by falling precipitation.
Obscured sky The condition when the entire sky is hidden by surface-based obscuring phenomena.
Okta Used for the measurement of total cloud cover. One okta of cloud cover is the equivalent of 1/8 of the sky covered with cloud.
Period See wave period.
PMO Port meteorological officer.
Precipitation All types of condensed water vapor, whether liquid, freezing, or frozen, which fall out of the atmosphere to the earth’s surface.
Pressure See atmospheric pressure.
Pressure change The net difference between the pressure at the beginning and ending of a specified interval of time.
Pressure characteristic The indication of how the pressure has been changing during the 3-hour period preceding an observation; i.e. decreasing then increasing, same pressure, or lower than 3-hours ago.
Pressure tendency The character and amount of atmospheric pressure change during the 3hour period preceding an observation.
Psychrometer An instrument for measuring the moisture content of the air by use of a wet- “and” dry- bulb thermometer; a type of hygrometer.
Rain Liquid precipitation that remains in the liquid state upon impact with the ground or other exposed objects.
Remarks Plain language data added after the last group of the weather message to report significant information not provided for in the main body of the report.
Ripple A small wavelet which forms at wind speeds of 1-3 knots.
Saturation The stage where the water content of the atmosphere reaches the maximum possible under the existing environmental conditions.
Sea Locally generated waves produced by the wind, and described by their period and height.
Sea ice Ice formed from the freezing of the sea surface.
NWSOH No. 1 5-3 July 2004

2004Part5.qxp 5/25/06 2:22 PM Page 5-4
Sea-level pressure The atmospheric pressure at mean sea level, either directly measured, or empirically determined from the observed station pressure.
Sleet Raindrops that have passed through a freezing layer of air and frozen or partially frozen. Same as ice pellets.
Sling psychrometer A type of hygrometer with two thermometers, which is whirled to determine air and wet bulb temperatures. The bulb of one is kept moist by a piece of wet muslin.
Snow Precipitation of ice crystals, mostly branched in star shapes.
Snow grains Very small, white, opaque grains of ice, with a diameter of less than 1 millimeter. Frozen drizzle.
Snow pellets White, opaque grains of ice, with a diameter of 2-5 millimeters.
Special observation An unscheduled or special observation taken to report significant changes in one or more of the observed elements since the last recorded observation.
Squall A sudden increase in wind speed of at least 15 knots which is sustained at 20 knots or more for at least 1 minute.
Standard barometer A barometer of very high accuracy used to calibrate other barometers. NWS PMOs use hand- held standard digital barometers to calibrate shipboard barometers.
Standard synoptic times The times of 0000, 0600, 1200, and 1800 UTC. Also known as the main synoptic times.
Station pressure The atmospheric pressure at barometer height, normally on the bridge. Barometers aboard NWS Voluntary Observing Ships are calibrated, when possible, to read sea-level pressure.
Storm Sustained wind of 48-55 knots (defined by the WMO as Beaufort Force 10).
Strato- Cloud prefix referring to cloud sheets or layers.
Stratocumulus Gray or whitish patch, sheet, or layer of cloud, almost always with dark parts, with non- fibrous rounded masses or rolls, which may or may not be merged.
Stratus Generally gray cloud layer with a fairly uniform base, which may produce drizzle or snow grains.
Surface observation Surface weather observations taken in accordance with World Meteorological Organization regulations, containing those weather elements most important for forecasting and later use.
Swell Ocean waves which have travelled beyond the generating area. They have longer periods and are more regular than seas.
Synoptic code Rules and procedures established by the World Meteorological Organization for encoding weather observations.
Temperature A measure of the hotness or coldness of the air as measured by a suitable instrument, using a defined temperature scale.
Trough The lowest part of a wave.
True direction Direction measured in degrees clockwise from true north, where north is 0 degrees.
NWSOH No. 1 5-4 July 2004
2004Part5.qxp 5/25/06 2:22 PM Page 5-5
Variable wind A condition when the wind direction fluctuates by 60 ˚ or more during the period of observation and the wind speed is greater than 10 knots.
Visibility The greatest horizontal distance at which selected objects can be seen and identified.
Visibility reference Selected objects at known distances used to determine visibility.
Voluntary Observing Program of the WMO and NWS to manage weather reporting Ship (VOS) program by ships at sea and on the Great Lakes.
Water vapor The gaseous form of water.
Wave height Distance from trough to crest, averaged for the better formed waves in the center of the wave group.
Wave length Distance from trough to trough or crest to crest for adjacent waves.
Wave period Time, in seconds, for the passage of successive wave crests. Normally computed as an average value for several waves.
Weather The individual and combined atmospheric phenomena used to describe the local atmospheric conditions at the time of observation.
Whitecap The breaking crest of a wave, usually white and frothy.
Wind The horizontal motion of the air past a given point.
Wind character The measure of the variability of the wind speed in terms of gusts and squalls.
Wind direction The true direction from which the wind is blowing at a given location.
Wind shift A change in the average wind direction of 45˚ or more which takes place in less than 15 minutes with wind speeds greater than 10 knots.
Wind speed The rate at which the air is moving horizontally past a given point. Vessels usually estimate wind speed by relating the state of the sea to the Beaufort Scale of wind force.
NWSOH No. 1 5-5 July 2004

2004Part5.qxp 5/25/06 2:22 PM Page 5-6
NWSOH No. 1 5-6 July 2004
2004Part5.qxp 5/25/06 2:22 PM Page A-1
WEATHER MAP BASES
N. Atlantic–U.S. Intercoastal
N. Pacific–U.S. Intercoastal
S. Atlantic–U.S. Intercoastal
S. Pacific–Indian Ocean
WALL CHARTS
Sea State Poster
Cloud Poster
Explanation of the Daily Weather Map
BROCHURE
PMO/VOS ProgramGuide to Sea State, Wind and Clouds
Appendix A
Observing Forms and Supplies
BOOKLETS AND MANUALS
NWS Observing Handbook No. 1
World Wide Marine Radiofacsimile Broadcast Schedules Guide to Sea State, Wind and Clouds
OBSERVING FORMS
Ship’s Weather Observations
Barogram
Pre-Addressed Envelopes
Pre-Addressed Diskette Mailers & Archive Diskettes
NWSOH No. 1 A-1 July 2004
2004Part5.qxp 5/25/06 2:22 PM Page A-2
NWSOH No. 1 A-2 July 2004

2004Part5.qxp 5/25/06 2:22 PM Page B-1
Appendix B
Conversion Factors and Equivalents
LENGTH
1 foot = .3048 meters 1 centimeter = 10 millimeters = .394 inches = .01 meters 1 meter = 100 centimeters = 3.2808 feet = 39.37 inches = 1.09 yards = .547 fathoms 1 kilometer = 1000 meters = 3280.8 feet = .54 nautical miles = .621 statute miles 1 degree latitude = 111.1 kilometers 1 statute mile = 1.6093 kilometers
SPEED
1 knot (nautical mile/hour) = 1.15 statute miles/hour = .51 meters/sec 1 meter/sec = 2.24 statute miles/hour = 1.94 knots 1 centimeter/second = 1.97 feet per minute
TEMPERATURE
Degrees Celsius = Degrees Centigrade Celsius = 5/9(Fahrenheit - 32) or Celsius = (Fahrenheit - 32)/1.8
Fahrenheit = 1.8(Celsius) + 32 or Fahrenheit = 1.8(Celsius + 40) - 40
PRESSURE
1 millimeter mercury = .03937 inches = 1.3332 millibars 1 inch mercury = 25.4 millimeters = 33.8640 millibars 1 millibar = .02953 inches = .75006 millimeters millibars = inches x 33.865 inches = millibars/33.864 Standard Atmosphere: vertical pressure change is .037 millibars/foot (.1214 millibars/meter)
AREA
1 square centimeter = .155 square inches 1 square meter = 10.8 square feet 1 square kilometer = .386 square statute miles = .292 square nautical miles
NWSOH No. 1 B-1 July 2004
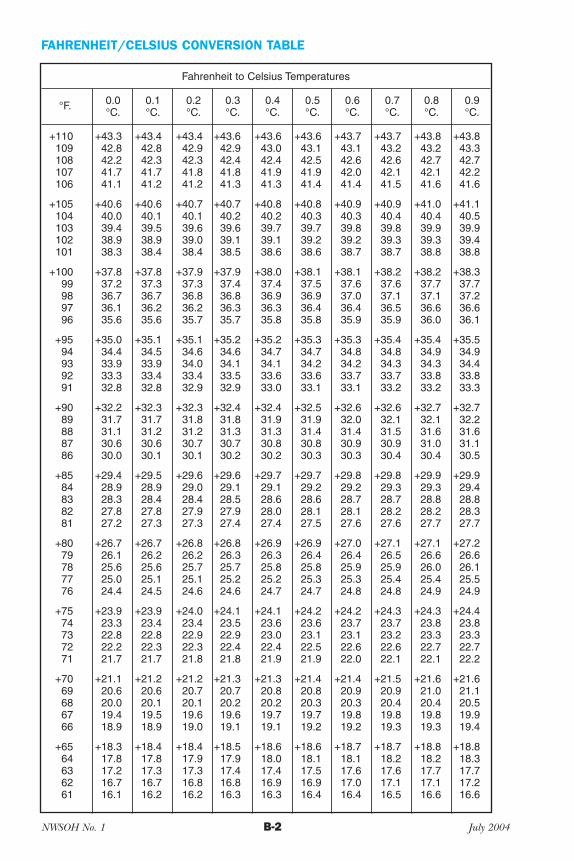
2004Part5.qxp 5/25/06 2:22 PM Page B-2
FAHRENHEIT/CELSIUS CONVERSION TABLE
Fahrenheit to Celsius Temperatures
°F. 0.0 °C.
0.1 °C.
0.2 °C.
0.3 °C.
0.4 °C.
0.5 °C.
0.6 °C.
0.7 °C.
0.8 °C.
0.9 °C.
+110 +43.3 +43.4 +43.4 +43.6 +43.6 +43.6 +43.7 +43.7 +43.8 +43.8 109 42.8 42.8 42.9 42.9 43.0 43.1 43.1 43.2 43.2 43.3 108 42.2 42.3 42.3 42.4 42.4 42.5 42.6 42.6 42.7 42.7 107 41.7 41.7 41.8 41.8 41.9 41.9 42.0 42.1 42.1 42.2 106 41.1 41.2 41.2 41.3 41.3 41.4 41.4 41.5 41.6 41.6
+105 +40.6 +40.6 +40.7 +40.7 +40.8 +40.8 +40.9 +40.9 +41.0 +41.1 104 40.0 40.1 40.1 40.2 40.2 40.3 40.3 40.4 40.4 40.5 103 39.4 39.5 39.6 39.6 39.7 39.7 39.8 39.8 39.9 39.9 102 38.9 38.9 39.0 39.1 39.1 39.2 39.2 39.3 39.3 39.4 101 38.3 38.4 38.4 38.5 38.6 38.6 38.7 38.7 38.8 38.8
+100 +37.8 +37.8 +37.9 +37.9 +38.0 +38.1 +38.1 +38.2 +38.2 +38.3 99 37.2 37.3 37.3 37.4 37.4 37.5 37.6 37.6 37.7 37.7 98 36.7 36.7 36.8 36.8 36.9 36.9 37.0 37.1 37.1 37.2 97 36.1 36.2 36.2 36.3 36.3 36.4 36.4 36.5 36.6 36.6 96 35.6 35.6 35.7 35.7 35.8 35.8 35.9 35.9 36.0 36.1
+95 +35.0 +35.1 +35.1 +35.2 +35.2 +35.3 +35.3 +35.4 +35.4 +35.5 94 34.4 34.5 34.6 34.6 34.7 34.7 34.8 34.8 34.9 34.9 93 33.9 33.9 34.0 34.1 34.1 34.2 34.2 34.3 34.3 34.4 92 33.3 33.4 33.4 33.5 33.6 33.6 33.7 33.7 33.8 33.8 91 32.8 32.8 32.9 32.9 33.0 33.1 33.1 33.2 33.2 33.3
+90 +32.2 +32.3 +32.3 +32.4 +32.4 +32.5 +32.6 +32.6 +32.7 +32.7 89 31.7 31.7 31.8 31.8 31.9 31.9 32.0 32.1 32.1 32.2 88 31.1 31.2 31.2 31.3 31.3 31.4 31.4 31.5 31.6 31.6 87 30.6 30.6 30.7 30.7 30.8 30.8 30.9 30.9 31.0 31.1 86 30.0 30.1 30.1 30.2 30.2 30.3 30.3 30.4 30.4 30.5
+85 +29.4 +29.5 +29.6 +29.6 +29.7 +29.7 +29.8 +29.8 +29.9 +29.9 84 28.9 28.9 29.0 29.1 29.1 29.2 29.2 29.3 29.3 29.4 83 28.3 28.4 28.4 28.5 28.6 28.6 28.7 28.7 28.8 28.8 82 27.8 27.8 27.9 27.9 28.0 28.1 28.1 28.2 28.2 28.3 81 27.2 27.3 27.3 27.4 27.4 27.5 27.6 27.6 27.7 27.7
+80 +26.7 +26.7 +26.8 +26.8 +26.9 +26.9 +27.0 +27.1 +27.1 +27.2 79 26.1 26.2 26.2 26.3 26.3 26.4 26.4 26.5 26.6 26.6 78 25.6 25.6 25.7 25.7 25.8 25.8 25.9 25.9 26.0 26.1 77 25.0 25.1 25.1 25.2 25.2 25.3 25.3 25.4 25.4 25.5 76 24.4 24.5 24.6 24.6 24.7 24.7 24.8 24.8 24.9 24.9
+75 +23.9 +23.9 +24.0 +24.1 +24.1 +24.2 +24.2 +24.3 +24.3 +24.4 74 23.3 23.4 23.4 23.5 23.6 23.6 23.7 23.7 23.8 23.8 73 22.8 22.8 22.9 22.9 23.0 23.1 23.1 23.2 23.3 23.3 72 22.2 22.3 22.3 22.4 22.4 22.5 22.6 22.6 22.7 22.7 71 21.7 21.7 21.8 21.8 21.9 21.9 22.0 22.1 22.1 22.2
+70 +21.1 +21.2 +21.2 +21.3 +21.3 +21.4 +21.4 +21.5 +21.6 +21.6 69 20.6 20.6 20.7 20.7 20.8 20.8 20.9 20.9 21.0 21.1 68 20.0 20.1 20.1 20.2 20.2 20.3 20.3 20.4 20.4 20.5 67 19.4 19.5 19.6 19.6 19.7 19.7 19.8 19.8 19.8 19.9 66 18.9 18.9 19.0 19.1 19.1 19.2 19.2 19.3 19.3 19.4
+65 +18.3 +18.4 +18.4 +18.5 +18.6 +18.6 +18.7 +18.7 +18.8 +18.8 64 17.8 17.8 17.9 17.9 18.0 18.1 18.1 18.2 18.2 18.3 63 17.2 17.3 17.3 17.4 17.4 17.5 17.6 17.6 17.7 17.7 62 16.7 16.7 16.8 16.8 16.9 16.9 17.0 17.1 17.1 17.2 61 16.1 16.2 16.2 16.3 16.3 16.4 16.4 16.5 16.6 16.6
NWSOH No. 1 B-2 July 2004

2004Part5.qxp 5/25/06 2:22 PM Page B-3
FAHRENHEIT/CELSIUS CONVERSION TABLE (CONTINUED)
Fahrenheit to Celsius Temperatures
°F. 0.0 °C.
0.1 °C.
0.2 °C.
0.3 °C.
0.4 °C.
0.5 °C.
0.6 °C.
0.7 °C.
0.8 °C.
0.9 °C.
+60 +15.6 +15.6 +15.7 +15.7 +15.8 +15.8 +15.8 +15.9 +16.0 +16.1 59 15.0 15.1 15.1 15.2 15.2 15.3 15.3 15.4 15.4 15.5 58 14.4 14.5 14.6 14.6 14.7 14.7 14.8 14.8 14.9 14.9 57 13.9 13.9 14.0 14.1 14.1 14.2 14.2 14.3 14.3 14.4 56 13.3 13.4 13.4 13.5 13.6 13.6 13.7 13.7 13.8 13.8
+55 +12.8 +12.8 +12.9 +12.9 +13.0 +13.1 +13.1 +13.2 +13.2 +13.3 54 12.2 12.3 12.3 12.4 12.4 12.5 12.6 12.6 12.7 12.7 53 11.7 11.7 11.8 11.8 11.9 11.9 12.0 12.1 12.1 12.2 52 11.1 11.2 11.2 11.3 11.3 11.4 11.4 11.5 11.6 11.6 51 10.6 10.6 10.7 10.7 10.8 10.8 10.9 10.9 11.0 11.1
+50 +10.0 +10.1 +10.1 +10.2 +10.2 +10.3 +10.3 +10.4 +10.4 +10.5 49 9.4 9.5 9.6 9.6 9.7 9.7 9.8 9.8 9.9 9.9 48 8.9 8.9 9.0 9.1 9.1 9.2 9.2 9.3 9.3 9.4 47 8.3 8.4 8.4 8.5 8.6 8.6 8.7 8.7 8.8 8.8 46 7.8 7.8 7.9 7.9 8.0 8.1 8.1 8.2 8.2 8.3
+45 +7.2 +7.3 +7.3 +7.4 +7.4 +7.5 +7.6 +7.6 +7.7 +7.7 44 6.7 6.7 6.8 6.8 6.9 6.9 7.0 7.1 7.1 7.2 43 6.1 6.2 6.2 6.3 6.3 6.4 6.4 6.5 6.6 6.6 42 5.6 5.6 5.7 5.7 5.8 5.8 5.9 5.9 6.0 6.1 41 5.0 5.1 5.1 5.2 5.2 5.3 5.3 5.4 5.4 5.5
+40 +4.4 +4.5 +4.6 +4.6 +4.7 +4.7 +4.8 +4.8 +4.9 +4.9 39 3.9 3.9 4.0 4.1 4.1 4.2 4.2 4.3 4.3 4.4 38 3.3 3.4 3.4 3.5 3.6 3.6 3.7 3.7 3.8 3.8 37 2.8 2.8 2.9 2.9 3.0 3.1 3.1 3.2 3.2 3.3 36. 2.2 2.3 2.3 2.4 2.4 2.5 2.6 21.6 2.7 2.7
+35 +1.7 +1.7 +1.8 +1.8 +1.9 +1.9 +2.0 +2.1 +2.1 +2.2 34 +1.1 +1.2 +1.2 +1.3 +1.3 +1.4 +1.4 +1.5 +1.6 +1.6 33 +0.6 +0.6 +0.7 +0.7 +0.8 +0.8 +0.9 +0.9 +1.0 +1.1 32 0.0 +0.1 +0.1 +0.2 +0.2 +0.3 +0.3 +0.4 +0.4 +0.5 31 -0.6 -0.5 -0.4 -0.4 -0.3 -0.3 -0.2 -0.2 -0.1 -0.1
+30 -1.1 -1.1 -1.0 -0.9 -0.9 -0.8 -0.8 -0.7 -0.7 -0.6 29 -1.7 -1.6 -1.6 -1.5 -1.4 -1.4 -1.3 -1.3 -1.2 -1.2 28 -2.2 -2.2 -2.1 -2.1 -2.0 -1.9 -1.9 -1.8 -1.8 -1.7 27 -2.8 -2.7 -2.7 -2.6 -2.6 -2.5 -2.4 -2.4 -2.3 -2.3 26 -3.3 -3.3 -3.2 -3.2 -3.1 -3.1 -3.0 -2.9 -2.9 -2.8
+25 -3.9 -3.8 -3.8 -3.7 -3.7 -3.6 -3.6 -3.5 -3.4 -3.4 24 -4.4 -4.4 -4.3 -4.3 -4.2 -4.2 -4.1 -4.1 -4.0 -3.9 23 -5.0 -4.9 -4.9 -4.8 -4.8 -4.7 -4.7 -4.6 -4.6 -4.5 22 -5.6 -5.5 -5.4 -5.4 -5.3 -5.3 -5.2 -5.2 -5.1 -5.1 21 -6.1 -6.1 -6.0 -5.9 -5.9 -5.8 -5.8 -5.7 -5.7 -5.6
+20 -6.7 -6.6 -6.6 -6.5 -6.4 -6.4 -6.3 -6.3 -6.2 -6.2 19 -7.2 -7.2 -7.1 -7.1 -7.0 -6.9 6.9 -6.8 -6.8 -6.7 18 -7.8 -7.7 -7.7 -7.6 -7.6 -7.5 -7.4 -7.4 -7.3 -7.3 17 -8.3 -8.3 -8.2 -8.2 -8.1 -8.1 -8.0 -7.9 -7.9 -7.8 16 -8.9 -8.8 -8.8 -8.7 -8.7 -8.6 -8.6 -8.5 -8.4 -8.4
+15 -9.4 -9.4 -9.3 -9.3 -9.2 -9.2 -9.1 -9.1 -9.0 -9.0 14 -10.0 -9.9 -9.9 -9.8 -9.8 -9.7 -9.7 -9.6 -9.6 -9.5 13 -10.6 -10.5 -10.4 -10.4 -10.3 -10.3 -10.2 -10.2 -10.1 -10.1 12 -11.1 -11.1 -11.0 -10.9 -10.9 -10.8 -10.8 -10.7 -10.7 -10.6 11 -11.7 -11.6 -11.6 -11.5 -11.4 -11.4 -11.3 -11.3 -11.2 -11.2
NWSOH No. 1 B-3 July 2004

2004Part5.qxp 5/25/06 2:22 PM Page B-4

2004Part5.qxp 5/25/06 2:22 PM Page C-1
Appendix C
Interpretation of Weather Map Symbols CODE FIGURES AND SYMBOLS Present Weather ww, Cloud Types CLCMCH, Past Weather W1W2, Sky Cover N, Pressure Characteristic a.
SYMBOLS FOR FRONTS, ISOBARS, ETC.
SAMPLE WIND PLOT
NWSOH No. 1 C-1 July 2004
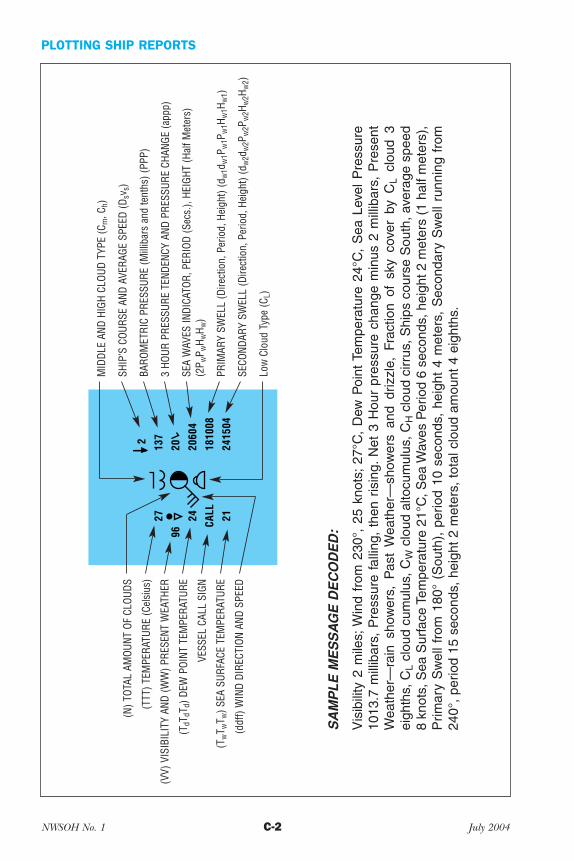
2004Part5.qxp 5/25/06 2:22 PM Page C-2
PLOTTING SHIP REPORTS
27
96 24 CA
LL 21
2060
4
1810
08
2415
04
201372
MID
DLE
AND
HIGH
CLO
UD T
YPE
(Cm
, Ch)
SHIP
’S C
OURS
E AN
D AV
ERAG
E SP
EED
(Dsv
s)(N
) TOT
AL A
MOU
NT O
F CL
OUDS
(TTT
) TEM
PERA
TURE
(Cel
sius
)BA
ROM
ETRI
C PR
ESSU
RE (M
illib
ars
and
tent
hs) (
PPP)
(VV)
VIS
IBIL
ITY
AND
(WW
) PRE
SENT
WEA
THER
3
HOUR
PRE
SSUR
E TE
NDEN
CY A
ND P
RESS
URE
CHAN
GE (a
ppp)
(TdT
dTd)
DEW
POI
NT T
EMPE
RATU
RESE
A W
AVES
INDI
CATO
R, P
ERIO
D (S
ecs.
), HE
IGHT
(Hal
f Met
ers)
VESS
EL C
ALL
SIGN
(2P w
P wH w
H w)
(TwT w
T w) S
EA S
URFA
CE T
EMPE
RATU
REPR
IMAR
Y SW
ELL
(Dire
ctio
n, P
erio
d, H
eigh
t) (d
w1d
w1P
w1P
w1H
w1H
w1)
(ddf
f) W
IND
DIRE
CTIO
N AN
D SP
EED
SECO
NDAR
Y SW
ELL
(Dire
ctio
n, P
erio
d, H
eigh
t) (d
w2d
w2P
w2P
w2H
w2H
w2)
Low
Clo
ud T
ype
(CL)
SA
MP
LE
ME
SS
AG
E D
EC
OD
ED
:
Vis
ibili
ty 2
mile
s; W
ind
from
230
°, 2
5 kn
ots;
27°
C,
Dew
Poi
nt T
empe
ratu
re 2
4°C
, S
ea L
evel
Pre
ssur
e10
13.7
mill
ibar
s, P
ress
ure
falli
ng,
then
ris
ing.
Net
3 H
our
pres
sure
cha
nge
min
us 2
mill
ibar
s, P
rese
nt
Wea
ther
—ra
in s
how
ers,
Pas
t W
eath
er—
show
ers
and
driz
zle,
Fra
ctio
n of
sky
cov
er b
y C
L cl
oud
3 ei
ghth
s, C
L cl
oud
cum
ulus
, CW
clo
ud a
ltocu
mul
us, C
H c
loud
cirr
us, S
hips
cou
rse
Sou
th, a
vera
ge s
peed
8
knot
s, S
ea S
urfa
ce T
empe
ratu
re 2
1°C
, Sea
Wav
es P
erio
d 6
seco
nds,
hei
ght 2
met
ers
(1 h
alf m
eter
s),
Prim
ary
Sw
ell f
rom
180
° (S
outh
), p
erio
d 10
sec
onds
, he
ight
4 m
eter
s, S
econ
dary
Sw
ell r
unni
ng f
rom
240°
, pe
riod
15 s
econ
ds,
heig
ht 2
met
ers,
tot
al c
loud
am
ount
4 e
ight
hs.
NWSOH No. 1 C-2 July 2004

2004Part5.qxp 5/25/06 2:22 PM Page D-1
Appendix D
High Seas Responsibility
MPC MPC
TPC
HNL
TPC
MPC
TPC HNL
— National Meteorological Center, Camp Springs, MD
— National Hurricane Center, Miami, FL — Weather Service Forecast Office,
Honolulu, HI 20°
0°
20°
40°
60°
180° 160° 140°
120°
60° 40°
100° 80°
NWSOH No. 1 D-1 July 2004
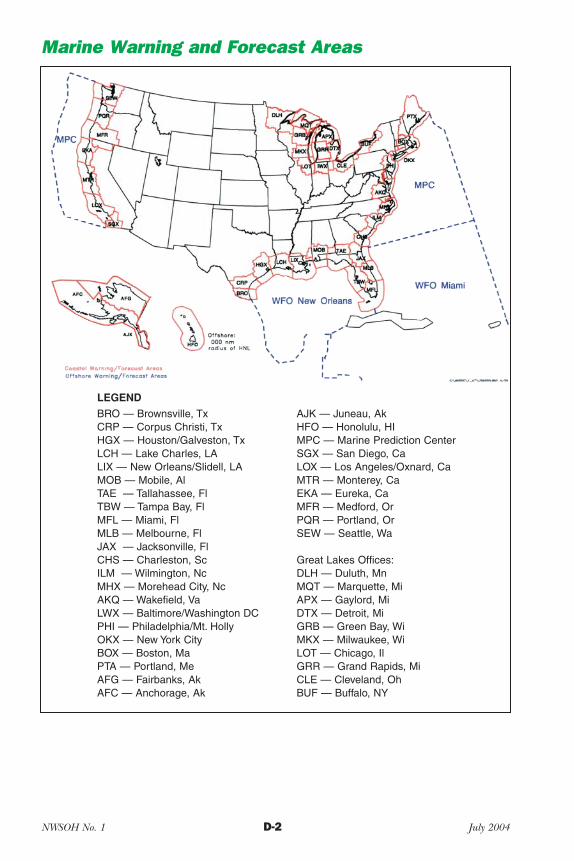
2004Part5.qxp 5/25/06 2:22 PM Page D-2
Marine Warning and Forecast Areas
LEGEND
MFL — Miami, Fl
ILM
HFO — Honolulu, HI
EKA — Eureka, Ca
DLH — Duluth, Mn
DTX — Detroit, Mi
BRO — Brownsville, Tx CRP — Corpus Christi, Tx HGX — Houston/Galveston, Tx LCH — Lake Charles, LA LIX — New Orleans/Slidell, LA MOB — Mobile, Al TAE — Tallahassee, Fl TBW — Tampa Bay, Fl
MLB — Melbourne, Fl JAX — Jacksonville, Fl CHS — Charleston, Sc
— Wilmington, Nc MHX — Morehead City, Nc AKQ — Wakefield, Va LWX — Baltimore/Washington DC PHI — Philadelphia/Mt. Holly OKX — New York City BOX — Boston, Ma PTA — Portland, Me AFG — Fairbanks, Ak AFC — Anchorage, Ak
AJK — Juneau, Ak
MPC — Marine Prediction Center SGX — San Diego, Ca LOX — Los Angeles/Oxnard, Ca MTR — Monterey, Ca
MFR — Medford, Or PQR — Portland, Or SEW — Seattle, Wa
Great Lakes Offices:
MQT — Marquette, Mi APX — Gaylord, Mi
GRB — Green Bay, Wi MKX — Milwaukee, Wi LOT — Chicago, Il GRR — Grand Rapids, Mi CLE — Cleveland, Oh BUF — Buffalo, NY
NWSOH No. 1 D-2 July 2004

2004Part6.qxp 5/25/06 2:23 PM Page 4-1
_______________________________________________________________________
_______________________________________________________________________
_______________________________________________________________________
_______________________________________________________________________
_______________________________________________________________________
_______________________________________________________________________
_______________________________________________________________________
_______________________________________________________________________
_______________________________________________________________________
_______________________________________________________________________
_______________________________________________________________________
_______________________________________________________________________
_______________________________________________________________________
_______________________________________________________________________
_______________________________________________________________________
_______________________________________________________________________
_______________________________________________________________________
_______________________________________________________________________
_______________________________________________________________________
_______________________________________________________________________
_______________________________________________________________________
_______________________________________________________________________
_______________________________________________________________________
NOTES

2004Part6.qxp 5/25/06 2:23 PM Page 4-2
_______________________________________________________________________
_______________________________________________________________________
_______________________________________________________________________
_______________________________________________________________________
_______________________________________________________________________
_______________________________________________________________________
_______________________________________________________________________
_______________________________________________________________________
_______________________________________________________________________
_______________________________________________________________________
_______________________________________________________________________
_______________________________________________________________________
_______________________________________________________________________
_______________________________________________________________________
_______________________________________________________________________
_______________________________________________________________________
_______________________________________________________________________
_______________________________________________________________________
_______________________________________________________________________
_______________________________________________________________________
_______________________________________________________________________
_______________________________________________________________________
_______________________________________________________________________
NOTES

2004Part6.qxp 5/25/06 2:23 PM Page 4-3
_______________________________________________________________________
_______________________________________________________________________
_______________________________________________________________________
_______________________________________________________________________
_______________________________________________________________________
_______________________________________________________________________
_______________________________________________________________________
_______________________________________________________________________
_______________________________________________________________________
_______________________________________________________________________
_______________________________________________________________________
_______________________________________________________________________
_______________________________________________________________________
_______________________________________________________________________
_______________________________________________________________________
_______________________________________________________________________
_______________________________________________________________________
_______________________________________________________________________
_______________________________________________________________________
_______________________________________________________________________
_______________________________________________________________________
_______________________________________________________________________
_______________________________________________________________________
NOTES

2004Part6.qxp 5/25/06 2:23 PM Page 4-4
_______________________________________________________________________
_______________________________________________________________________
_______________________________________________________________________
_______________________________________________________________________
_______________________________________________________________________
_______________________________________________________________________
_______________________________________________________________________
_______________________________________________________________________
_______________________________________________________________________
_______________________________________________________________________
_______________________________________________________________________
_______________________________________________________________________
_______________________________________________________________________
_______________________________________________________________________
_______________________________________________________________________
_______________________________________________________________________
_______________________________________________________________________
_______________________________________________________________________
_______________________________________________________________________
_______________________________________________________________________
_______________________________________________________________________
_______________________________________________________________________
_______________________________________________________________________
NOTES

2004Part6.qxp 5/25/06 2:23 PM Page 4-5
_______________________________________________________________________
_______________________________________________________________________
_______________________________________________________________________
_______________________________________________________________________
_______________________________________________________________________
_______________________________________________________________________
_______________________________________________________________________
_______________________________________________________________________
_______________________________________________________________________
_______________________________________________________________________
_______________________________________________________________________
_______________________________________________________________________
_______________________________________________________________________
_______________________________________________________________________
_______________________________________________________________________
_______________________________________________________________________
_______________________________________________________________________
_______________________________________________________________________
_______________________________________________________________________
_______________________________________________________________________
_______________________________________________________________________
_______________________________________________________________________
_______________________________________________________________________
NOTES

2004Part6.qxp 5/25/06 2:23 PM Page 4-6
_______________________________________________________________________
_______________________________________________________________________
_______________________________________________________________________
_______________________________________________________________________
_______________________________________________________________________
_______________________________________________________________________
_______________________________________________________________________
_______________________________________________________________________
_______________________________________________________________________
_______________________________________________________________________
_______________________________________________________________________
_______________________________________________________________________
_______________________________________________________________________
_______________________________________________________________________
_______________________________________________________________________
_______________________________________________________________________
_______________________________________________________________________
_______________________________________________________________________
_______________________________________________________________________
_______________________________________________________________________
_______________________________________________________________________
_______________________________________________________________________
_______________________________________________________________________
NOTES
2004Part5.qxp 5/25/06 2:22 PM Page D-4
This completely redesigned handbook has been
possible.
Ship Program.
U.S. DEPARTME N T OF COMM
ERCE
NAT
IO N
AL
OCE
ANICAND AT M OSPHERIC ADM
INISTR
A TIO
N
Weather observations from ships at sea are treasured by meteorologists as invaluable in the preparation of marine weather forecasts and storm warnings. They are also of critical importance in identifying and tracking weather systems in their worldwide movement.
prepared to help you observe, code, and report weather — as easily, quickly, and accurately as
The National Weather Service thanks ships officers for their enormous effort and dedication as weather observers in the Voluntary Observing
Only YOU know the weather at your position. Please report it at 00, 06, 12, and 18 UTC to the National Weather Service.


