PT Bank Danamon Indonesia Tbk terdaftar dan diawasi oleh OJK
P T B a n k D a n a m o n I n d o n e s i a T b k
A n a l y s t B r i e f i n g 1 s t H a l f 2 0 1 8
Jakarta, 25 July 2018
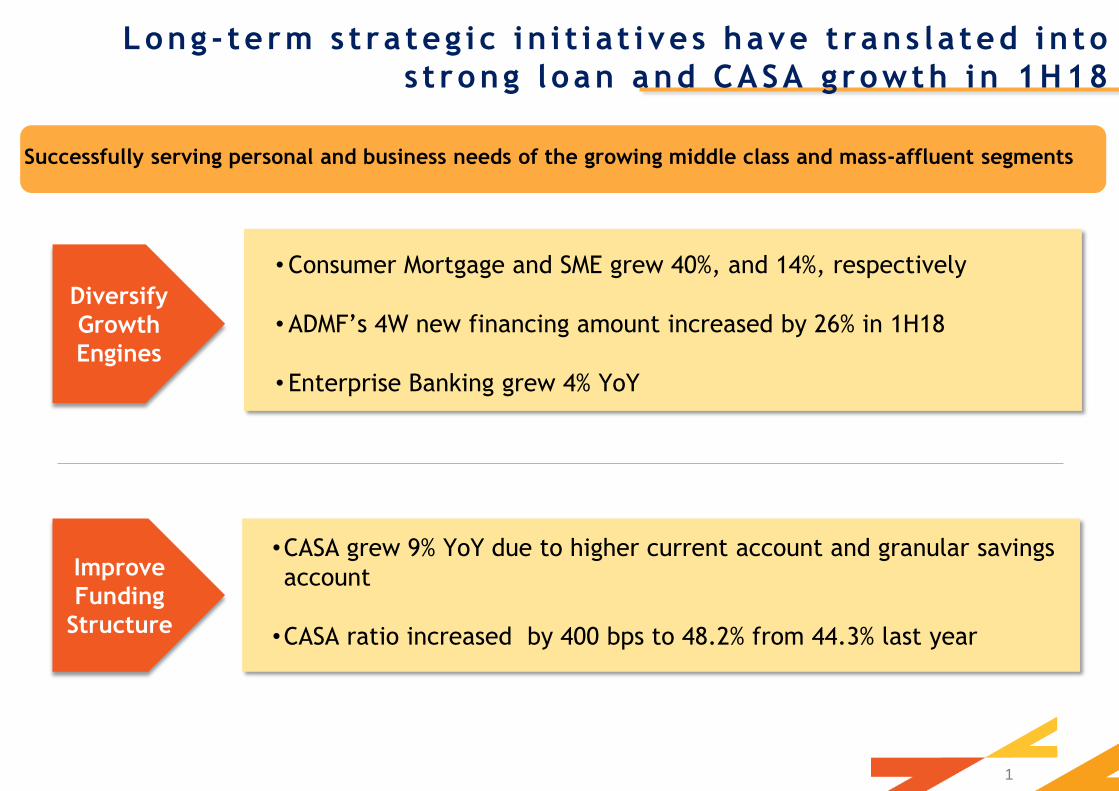
•CASA grew 9% YoY due to higher current account and granular savings
account
•CASA ratio increased by 400 bps to 48.2% from 44.3% last year
•Consumer Mortgage and SME grew 40%, and 14%, respectively
•ADMF’s 4W new financing amount increased by 26% in 1H18
• Enterprise Banking grew 4% YoY
1
Long - term s t ra teg i c i n i t i a t i ves have t rans l a ted in to
s t rong l oan and CASA g rowth in 1H18
Diversify
Growth
Engines
Improve
Funding
Structure
Successfully serving personal and business needs of the growing middle class and mass-affluent segments
2
1H 2018 Ba lance Sheet H i gh l i ght s
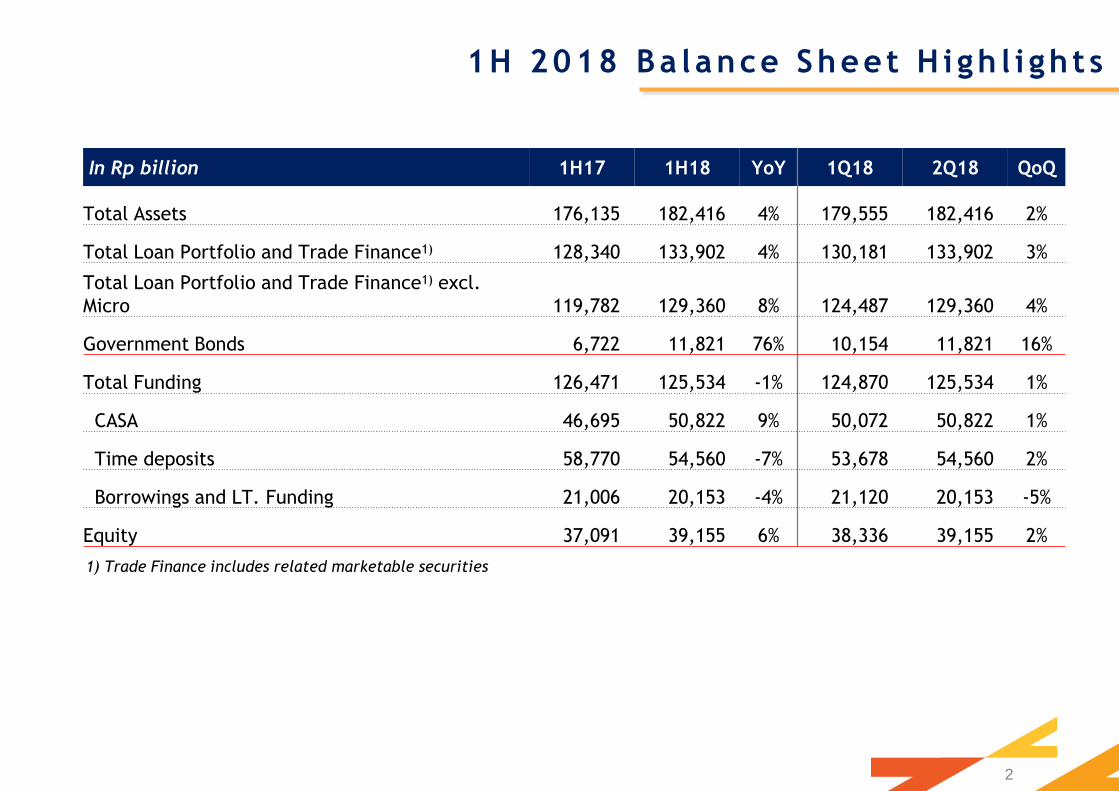
1) Trade Finance includes related marketable securities
In Rp billion 1H17 1H18 YoY 1Q18 2Q18 QoQ
Total Assets 176,135 182,416 4% 179,555 182,416 2%
Total Loan Portfolio and Trade Finance1) 128,340 133,902 4% 130,181 133,902 3%
Total Loan Portfolio and Trade Finance1) excl.
Micro 119,782 129,360 8% 124,487 129,360 4%
Government Bonds 6,722 11,821 76% 10,154 11,821 16%
Total Funding 126,471 125,534 -1% 124,870 125,534 1%
CASA 46,695 50,822 9% 50,072 50,822 1%
Time deposits 58,770 54,560 -7% 53,678 54,560 2%
Borrowings and LT. Funding 21,006 20,153 -4% 21,120 20,153 -5%
Equity 37,091 39,155 6% 38,336 39,155 2%
3
1H 2018 Income S ta tement
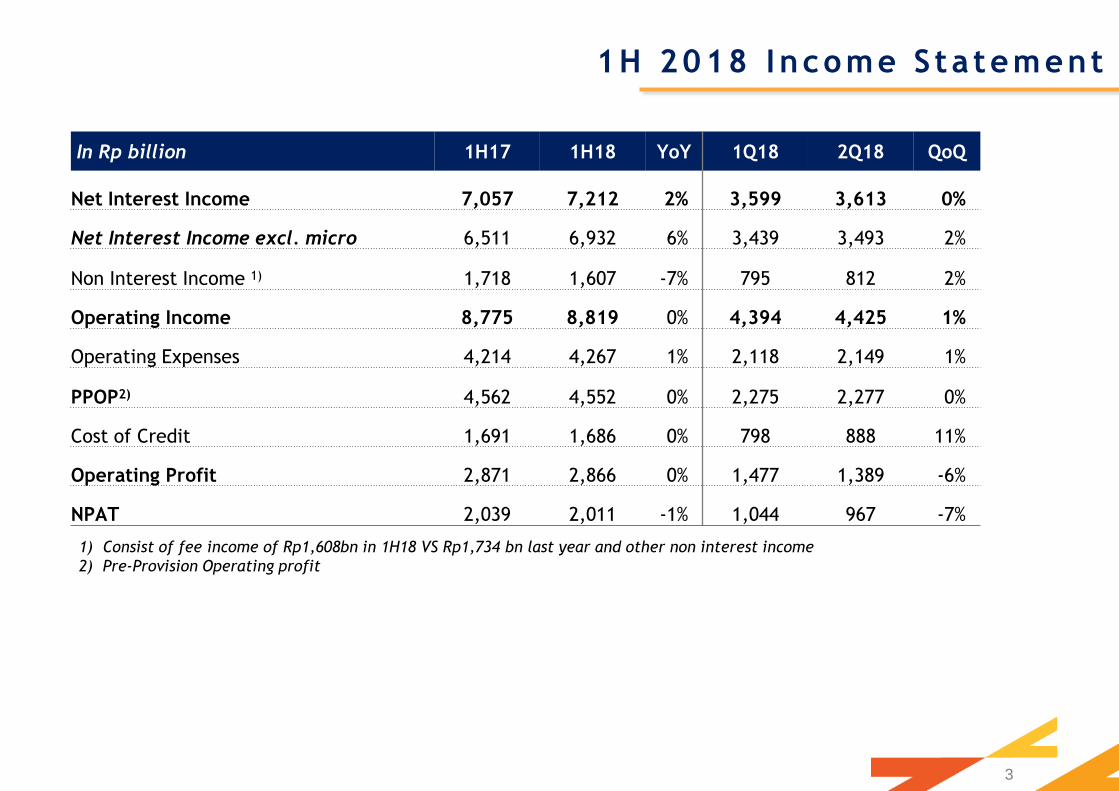
1) Consist of fee income of Rp1,608bn in 1H18 VS Rp1,734 bn last year and other non interest income
2) Pre-Provision Operating profit
In Rp billion 1H17 1H18 YoY 1Q18 2Q18 QoQ
Net Interest Income 7,057 7,212 2% 3,599 3,613 0%
Net Interest Income excl. micro 6,511 6,932 6% 3,439 3,493 2%
Non Interest Income 1) 1,718 1,607 -7% 795 812 2%
Operating Income 8,775 8,819 0% 4,394 4,425 1%
Operating Expenses 4,214 4,267 1% 2,118 2,149 1%
PPOP2) 4,562 4,552 0% 2,275 2,277 0%
Cost of Credit 1,691 1,686 0% 798 888 11%
Operating Profit 2,871 2,866 0% 1,477 1,389 -6%
NPAT 2,039 2,011 -1% 1,044 967 -7%
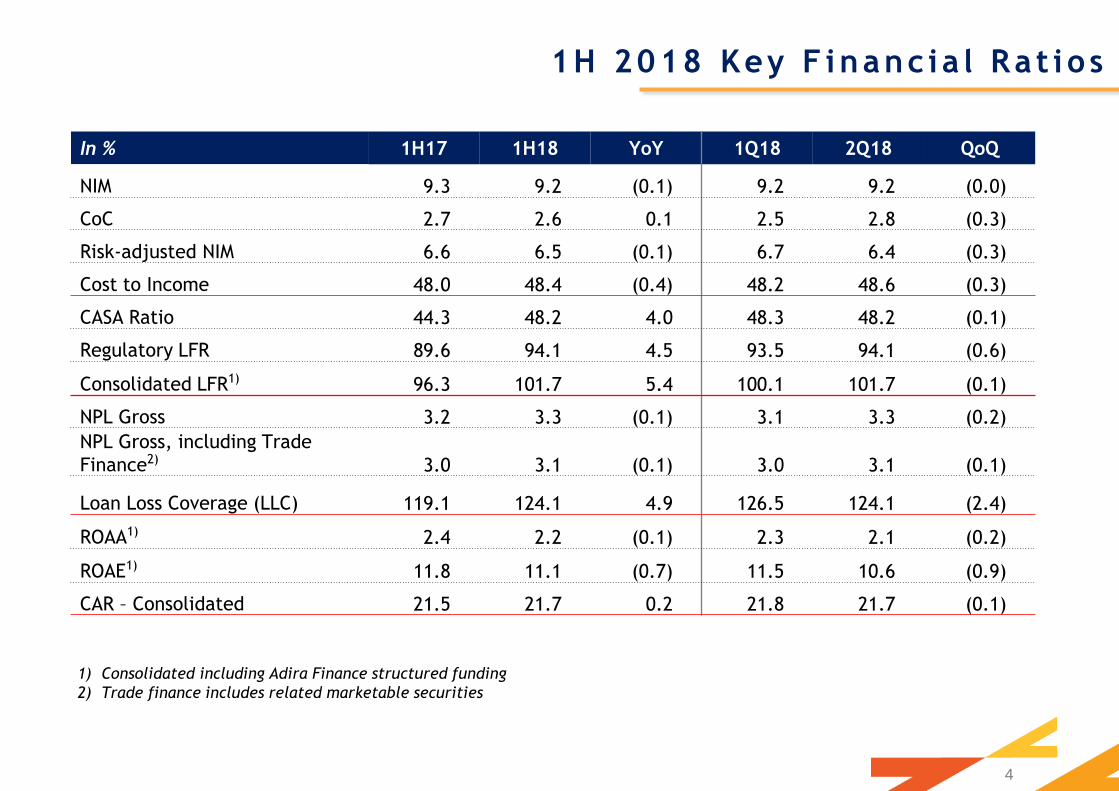
In % 1H17 1H18 YoY 1Q18 2Q18 QoQ
NIM 9.3 9.2 (0.1) 9.2 9.2 (0.0)
CoC 2.7 2.6 0.1 2.5 2.8 (0.3)
Risk-adjusted NIM 6.6 6.5 (0.1) 6.7 6.4 (0.3)
Cost to Income 48.0 48.4 (0.4) 48.2 48.6 (0.3)
CASA Ratio 44.3 48.2 4.0 48.3 48.2 (0.1)
Regulatory LFR 89.6 94.1 4.5 93.5 94.1 (0.6)
Consolidated LFR1) 96.3 101.7 5.4 100.1 101.7 (0.1)
NPL Gross 3.2 3.3 (0.1) 3.1 3.3 (0.2)
NPL Gross, including Trade
Finance2) 3.0 3.1 (0.1) 3.0 3.1 (0.1)
Loan Loss Coverage (LLC) 119.1 124.1 4.9 126.5 124.1 (2.4)
ROAA1) 2.4 2.2 (0.1) 2.3 2.1 (0.2)
ROAE1) 11.8 11.1 (0.7) 11.5 10.6 (0.9)
CAR – Consolidated 21.5 21.7 0.2 21.8 21.7 (0.1)
4
1H 2018 Key F inanc ia l Ra t io s
1) Consolidated including Adira Finance structured funding
2) Trade finance includes related marketable securities
Consolidated Financials – Consolidated Financials –
with SEMM If without SEMM*
1H17 1H18 YoY 1H17 1H18 YoY
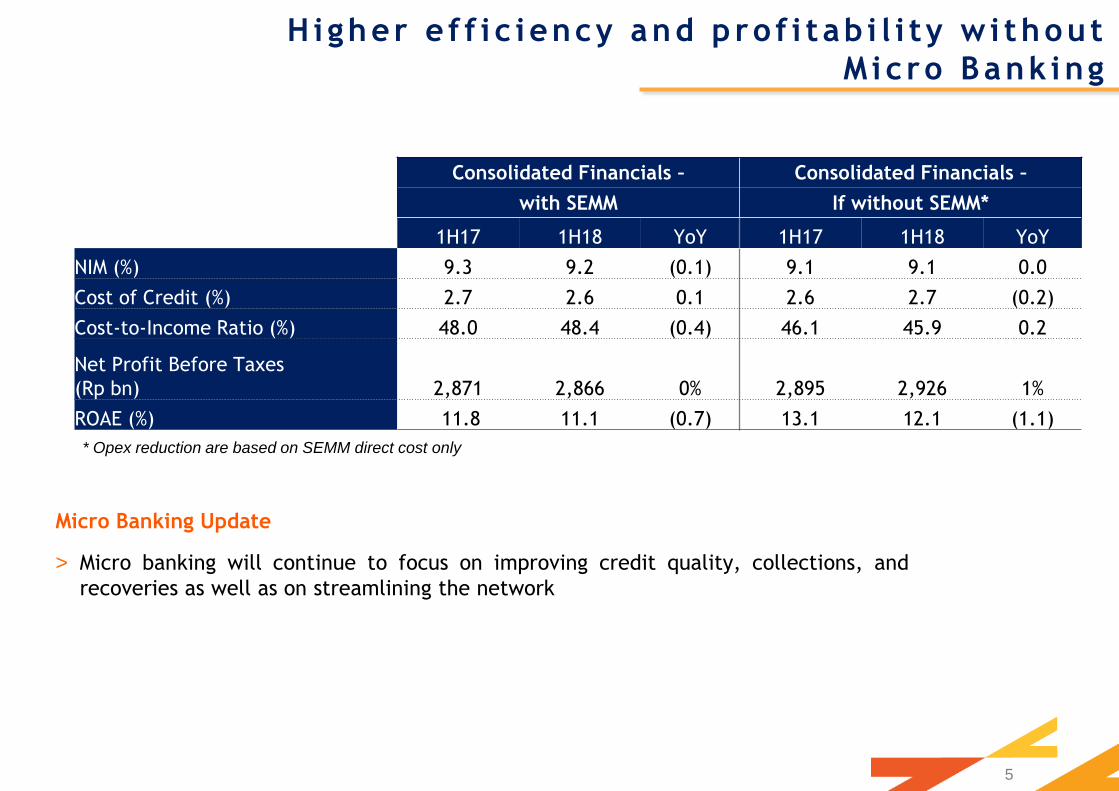
NIM (%) 9.3 9.2 (0.1) 9.1 9.1 0.0
Cost of Credit (%) 2.7 2.6 0.1 2.6 2.7 (0.2)
Cost-to-Income Ratio (%) 48.0 48.4 (0.4) 46.1 45.9 0.2
Net Profit Before Taxes
(Rp bn) 2,871 2,866 0% 2,895 2,926 1%
ROAE (%) 11.8 11.1 (0.7) 13.1 12.1 (1.1)
5
Higher e f f i c i ency and p ro f i t ab i l i ty w i thout
M i c ro Bank ing
Micro Banking Update
> Micro banking will continue to focus on improving credit quality, collections, and
recoveries as well as on streamlining the network
* Opex reduction are based on SEMM direct cost only
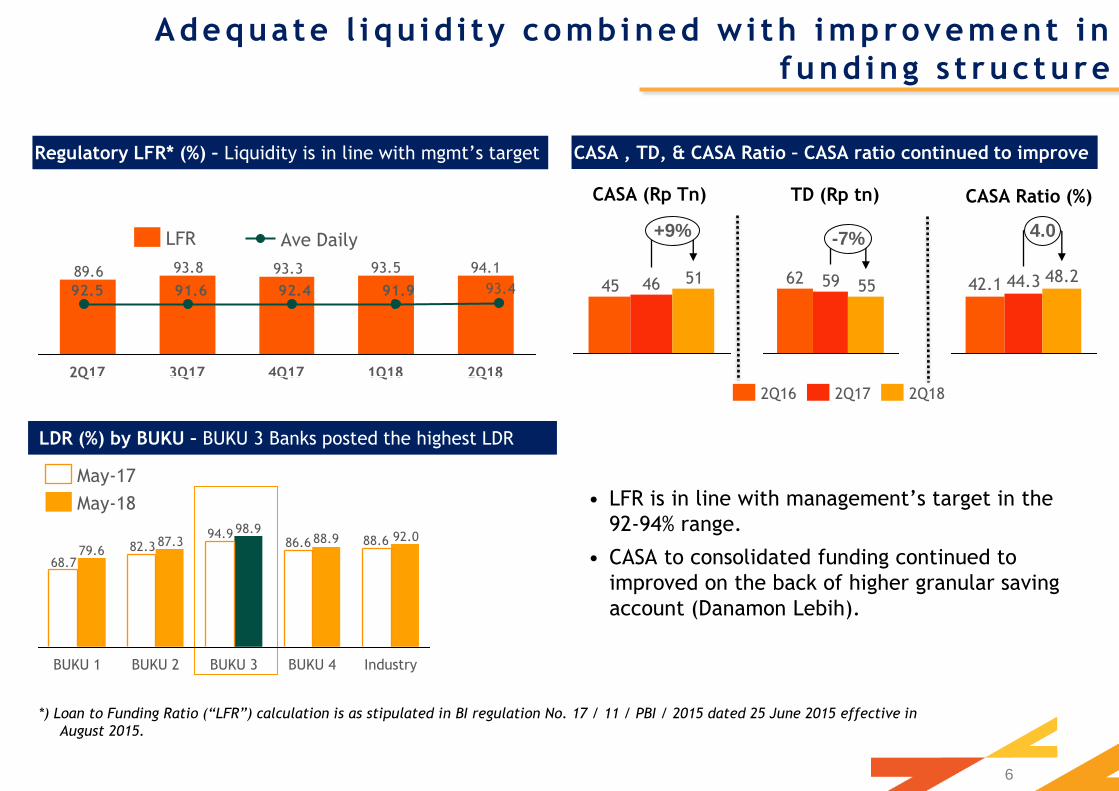
Regulatory LFR* (%) – Liquidity is in line with mgmt’s target
LDR (%) by BUKU – BUKU 3 Banks posted the highest LDR
• LFR is in line with management’s target in the
92-94% range.
• CASA to consolidated funding continued to
improved on the back of higher granular saving
account (Danamon Lebih).
*) Loan to Funding Ratio (“LFR”) calculation is as stipulated in BI regulation No. 17 / 11 / PBI / 2015 dated 25 June 2015 effective in
August 2015.
Adequate l i qu id i ty combined w i th improvement in
fund ing s t ruc ture
CASA , TD, & CASA Ratio – CASA ratio continued to improve
94.193.593.393.889.6
2Q18 1Q18 4Q17 3Q17 2Q17
LFR
91.992.491.692.5 93.4
Ave Daily
88.686.694.9
82.3
68.7
92.088.998.9
87.379.6
BUKU 2 BUKU 1 BUKU 3 BUKU 4 Industry
6
May-17
May-18
45 46 51
+9%
2Q17 2Q16 2Q18
62 59 55
-7%
CASA (Rp Tn) TD (Rp tn) CASA Ratio (%)
44.3 48.2 42.1
4.0
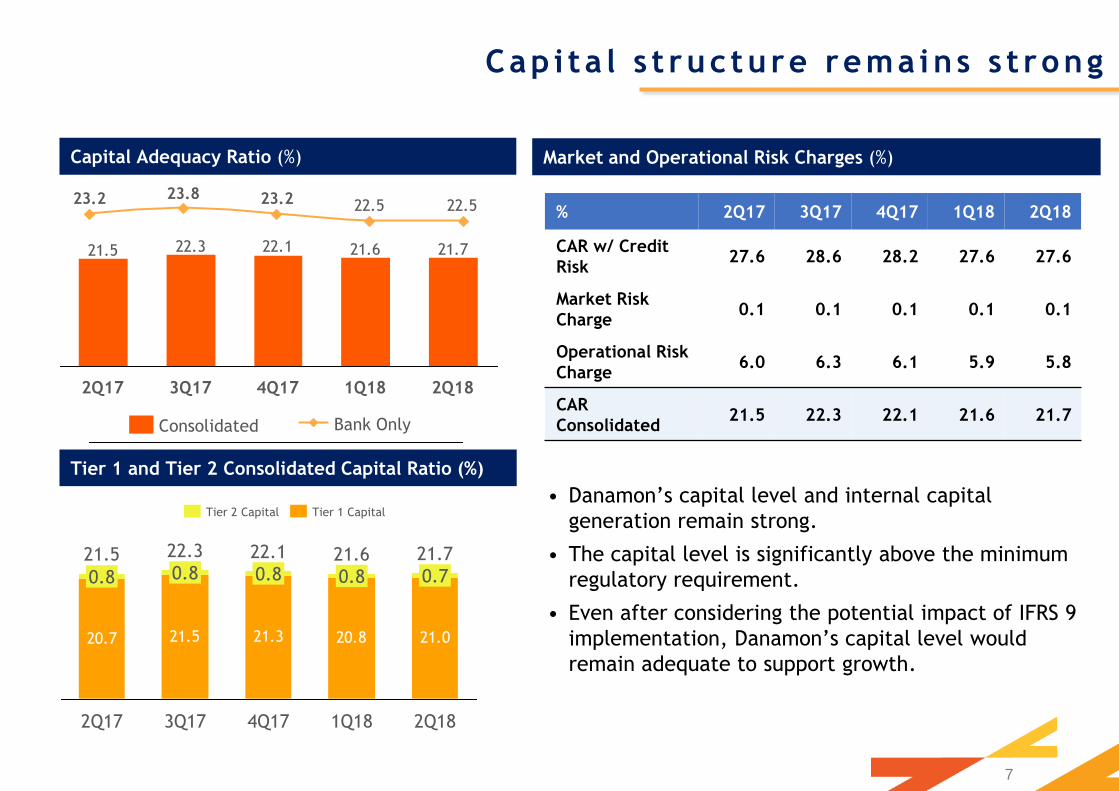
23.223.823.2 22.522.5
Capital Adequacy Ratio (%)
% 2Q17 3Q17 4Q17 1Q18 2Q18
CAR w/ Credit
Risk 27.6 28.6 28.2 27.6 27.6
Market Risk
Charge 0.1 0.1 0.1 0.1 0.1
Operational Risk
Charge 6.0 6.3 6.1 5.9 5.8
CAR
Consolidated 21.5 22.3 22.1 21.6 21.7
Tier 1 and Tier 2 Consolidated Capital Ratio (%)
Cap i ta l s t ruc ture rema ins s t rong
Market and Operational Risk Charges (%)
• Danamon’s capital level and internal capital
generation remain strong.
• The capital level is significantly above the minimum
regulatory requirement.
• Even after considering the potential impact of IFRS 9
implementation, Danamon’s capital level would
remain adequate to support growth.
21.721.622.122.321.5
1Q18 4Q17 3Q17 2Q17 2Q18
Bank Only Consolidated
20.7 21.5 21.3 20.8 21.0
4Q17
22.1
0.8
3Q17
22.3
0.8
2Q17
21.5
0.8
2Q18
21.7
0.7
1Q18
21.6
0.8
Tier 2 Capital Tier 1 Capital
7
8
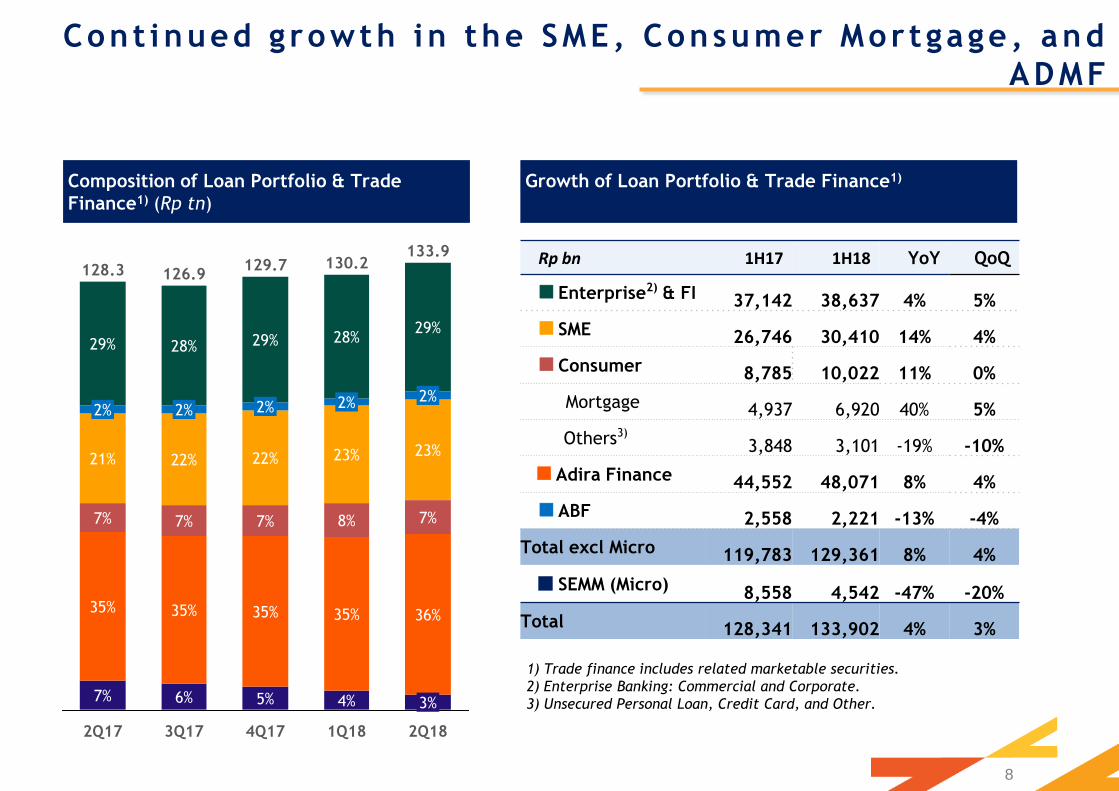
Cont inued g rowth in the SME, Consumer Mor tgage , and
ADMF
Composition of Loan Portfolio & Trade
Finance1) (Rp tn)
Growth of Loan Portfolio & Trade Finance1)
1Q18
130.2
28%
2%
23%
8%
35%
4%
4Q17
129.7
29%
2%
22%
7%
35%
5%
3Q17
126.9
28%
2%
22%
7%
35%
6%
2Q17
128.3
29%
2%
21%
7%
35%
7%
2Q18
3%
133.9
36%
7%
23%
2%
29%
1) Trade finance includes related marketable securities.
2) Enterprise Banking: Commercial and Corporate.
3) Unsecured Personal Loan, Credit Card, and Other.
Rp bn 1H17 1H18 YoY QoQ
Enterprise2) & FI 37,142 38,637 4% 5%
SME 26,746 30,410 14% 4%
Consumer 8,785 10,022 11% 0%
Mortgage 4,937 6,920 40% 5%
Others3) 3,848 3,101 -19% -10%
Adira Finance 44,552 48,071 8% 4%
ABF 2,558 2,221 -13% -4%
Total excl Micro 119,783 129,361 8% 4%
SEMM (Micro) 8,558 4,542 -47% -20%
Total 128,341 133,902 4% 3%
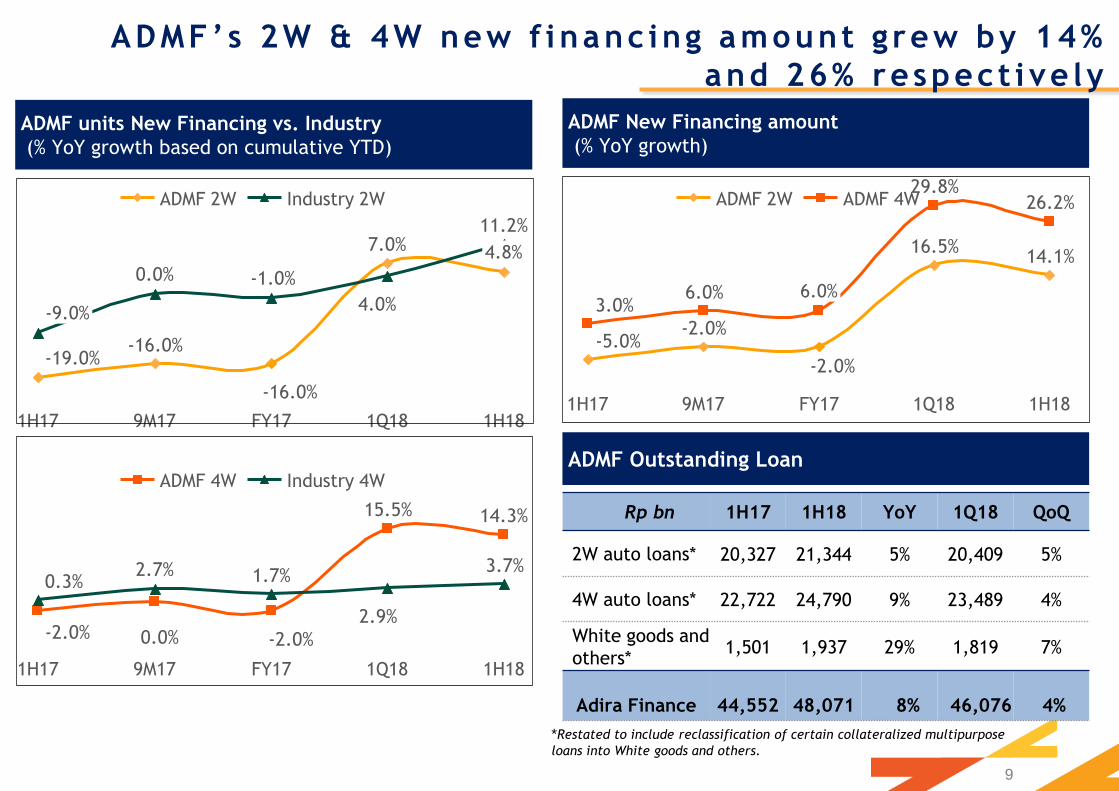
Rp bn 1H17 1H18 YoY 1Q18 QoQ
2W auto loans* 20,327 21,344 5% 20,409 5%
4W auto loans* 22,722 24,790 9% 23,489 4%
White goods and
others* 1,501 1,937 29% 1,819 7%
Adira Finance
44,552 48,071 8% 46,076 4%
ADMF units New Financing vs. Industry
(% YoY growth based on cumulative YTD)
ADMF Outstanding Loan
9
ADMF’s 2W & 4W new f inanc ing amount g rew by 14%
and 26% respect i ve ly
ADMF New Financing amount
(% YoY growth)
14.1%16.5%
-2.0%
-2.0%-5.0%
26.2%29.8%
6.0%3.0%
1Q18 FY17
6.0%
9M17 1H17 1H18
ADMF 4W ADMF 2W
7.0%
-16.0%
-16.0%-19.0%
11.2%
4.0%
-1.0%0.0%
1H18 1Q18 FY17 9M17 1H17
-9.0%
4.8%
Industry 2W ADMF 2W
14.3%15.5%
-2.0%0.0%-2.0%
3.7%
2.9%
1.7%2.7%0.3%
1H18 1Q18 FY17 9M17 1H17
ADMF 4W Industry 4W
*Restated to include reclassification of certain collateralized multipurpose
loans into White goods and others.
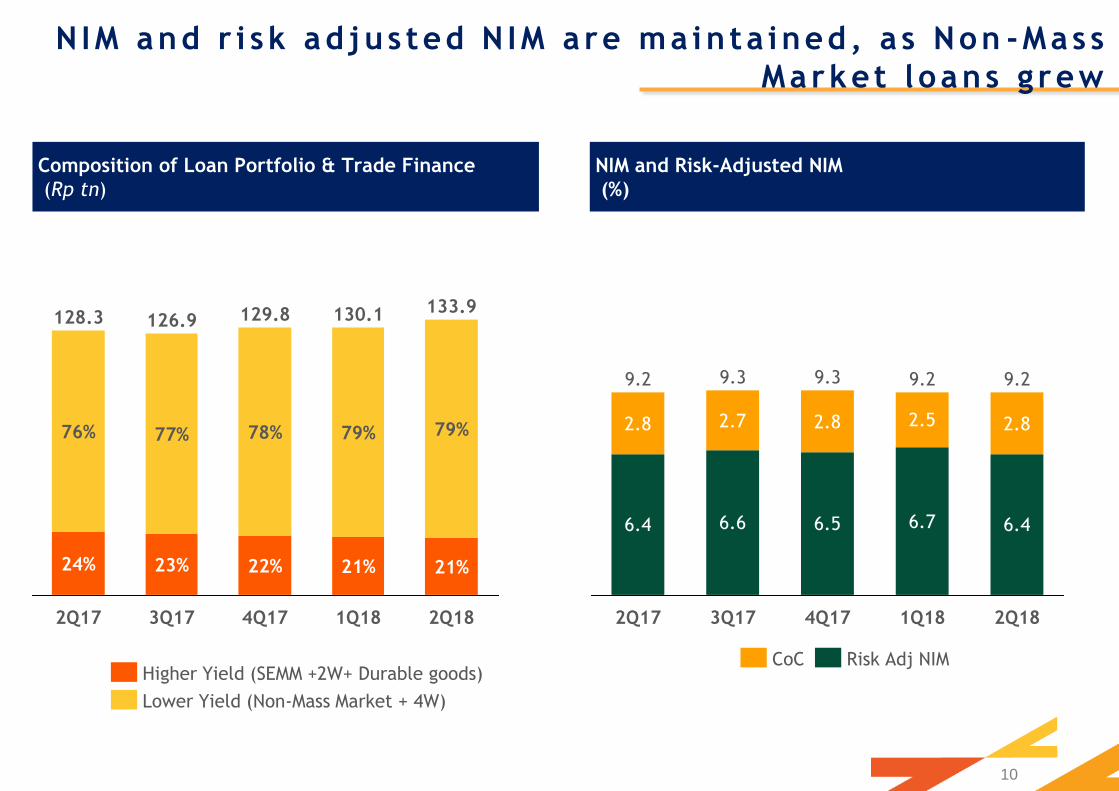
NIM and Risk-Adjusted NIM
(%)
NIM and r i sk ad jus ted N IM a re ma in ta ined, a s Non -Mass
Market l oans g rew
Composition of Loan Portfolio & Trade Finance
(Rp tn)
2Q18
133.9
79%
21%
1Q18
130.1
79%
21%
4Q17
129.8
78%
22%
3Q17
126.9
77%
23%
2Q17
128.3
76%
24%
Lower Yield (Non-Mass Market + 4W)
Higher Yield (SEMM +2W+ Durable goods)
6.4 6.6 6.5 6.7 6.4
2.8 2.7 2.8 2.5 2.8
2Q18
9.2
1Q18
9.2
4Q17
9.3
3Q17
9.3
2Q17
9.2
10
Risk Adj NIM CoC
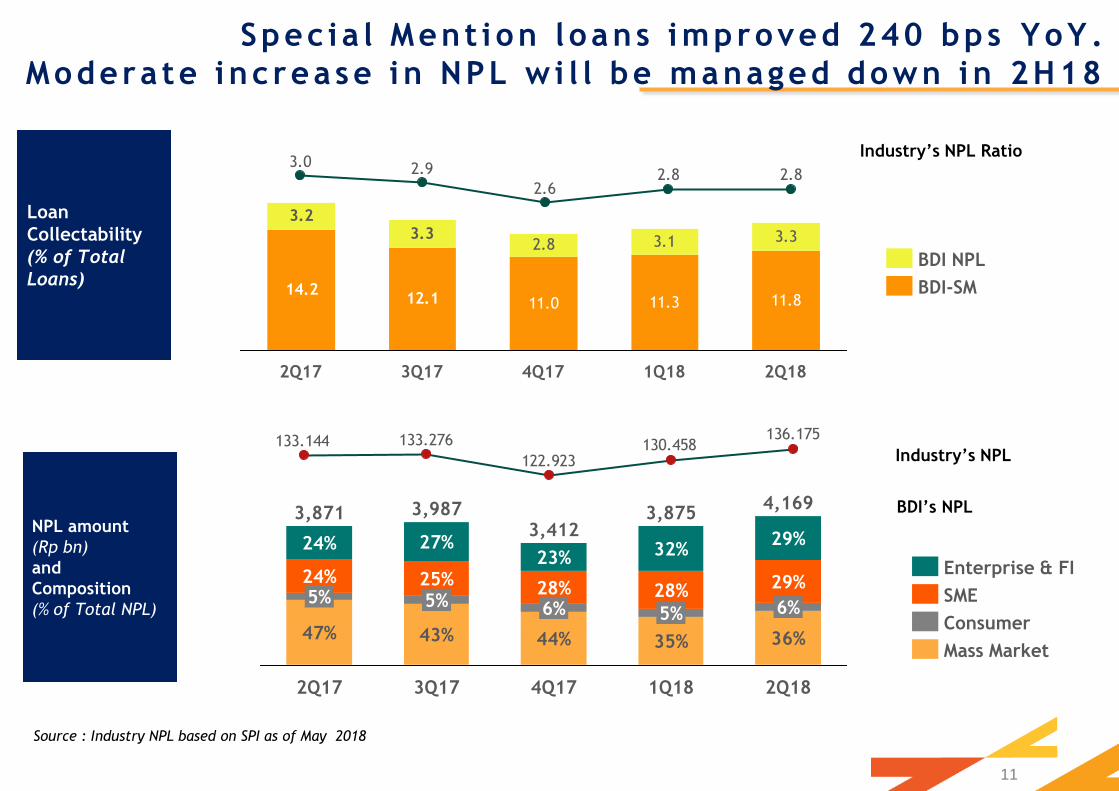
136.175
122.923
133.276133.144 130.458
2.82.82.6
2.93.0
Spec ia l Ment ion l oans improved 240 bps YoY .
Modera te increase in NPL w i l l be managed down in 2H18
Source : Industry NPL based on SPI as of May 2018
11.0 11.3
2.8 3.1
11.812.114.2
3.33.33.2
2Q18 1Q18 4Q17 3Q17 2Q17
BDI-SM
BDI NPL
BDI’s NPL NPL amount
(Rp bn)
and
Composition
(% of Total NPL)
Industry’s NPL
Loan
Collectability
(% of Total
Loans)
Industry’s NPL Ratio
44%
6% 28%
23%
3Q17
3,987
43%
5% 25%
27%
2Q17
3,871
47%
5% 24%
24%
2Q18
4,169
36%
6%
29%
29%
1Q18
3,875
35%
5%
28%
32%
4Q17
3,412
Mass Market
Consumer
SME
Enterprise & FI
11
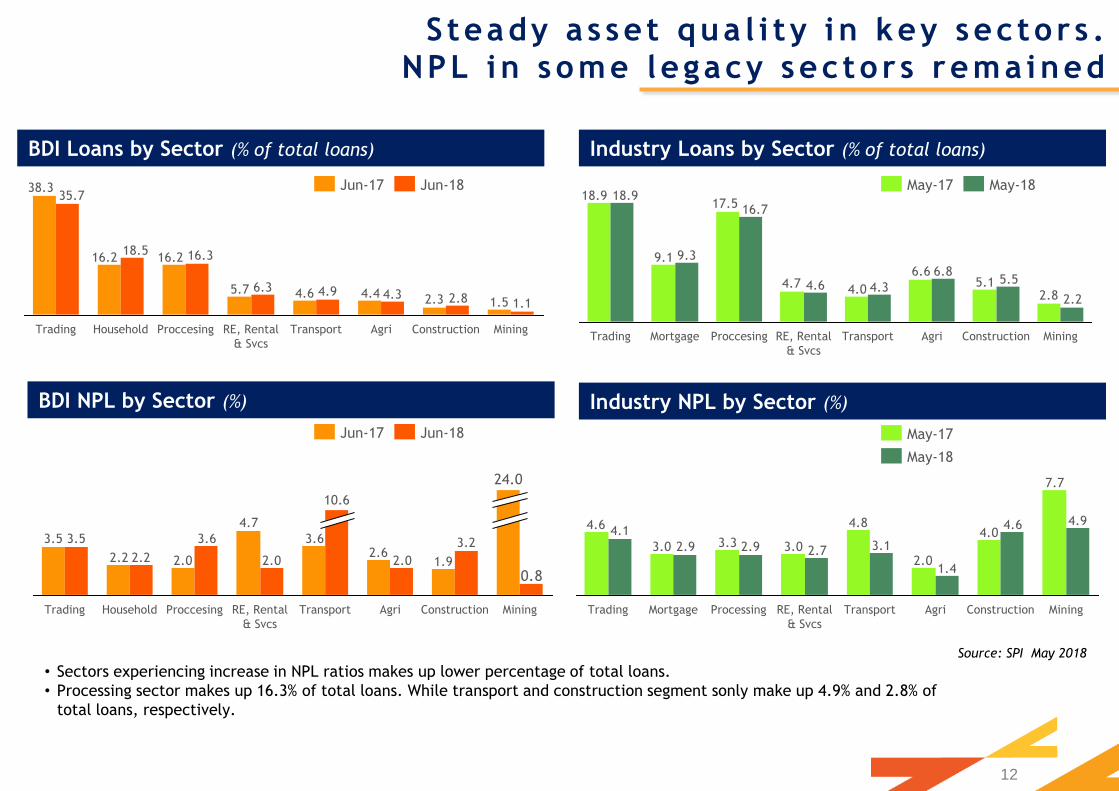
BDI Loans by Sector (% of total loans)
BDI NPL by Sector (%)
Industry Loans by Sector (% of total loans)
Industry NPL by Sector (%)
Source: SPI May 2018
S teady a s se t qua l i t y i n key sec tor s . NPL in some legacy sec tor s rema ined
2.85.1
6.6
4.04.7
17.5
9.1
18.9
2.2
5.56.8
4.34.6
16.7
9.3
18.9
Mining Construction Agri Transport RE, Rental
& Svcs
Proccesing Mortgage Trading
May-18 May-17
7.7
4.0
2.0
4.8
3.03.33.0
4.6 4.94.6
1.4
3.12.72.92.9
4.1
Mining Construction Agri Transport RE, Rental
& Svcs
Processing Mortgage Trading
May-18
May-17
1.52.34.44.65.7
16.216.2
38.3
1.12.84.34.96.3
16.318.5
35.7
Mining Construction Agri Transport RE, Rental
& Svcs
Proccesing Household Trading
Jun-18 Jun-17
1.92.6
3.6
4.7
2.02.2
3.5 3.2
2.02.0
3.6
2.2
3.5
0.8
Mining
24.0
Construction Agri Transport
10.6
RE, Rental
& Svcs
Proccesing Household Trading
Jun-18 Jun-17
12
• Sectors experiencing increase in NPL ratios makes up lower percentage of total loans.
• Processing sector makes up 16.3% of total loans. While transport and construction segment sonly make up 4.9% and 2.8% of
total loans, respectively.
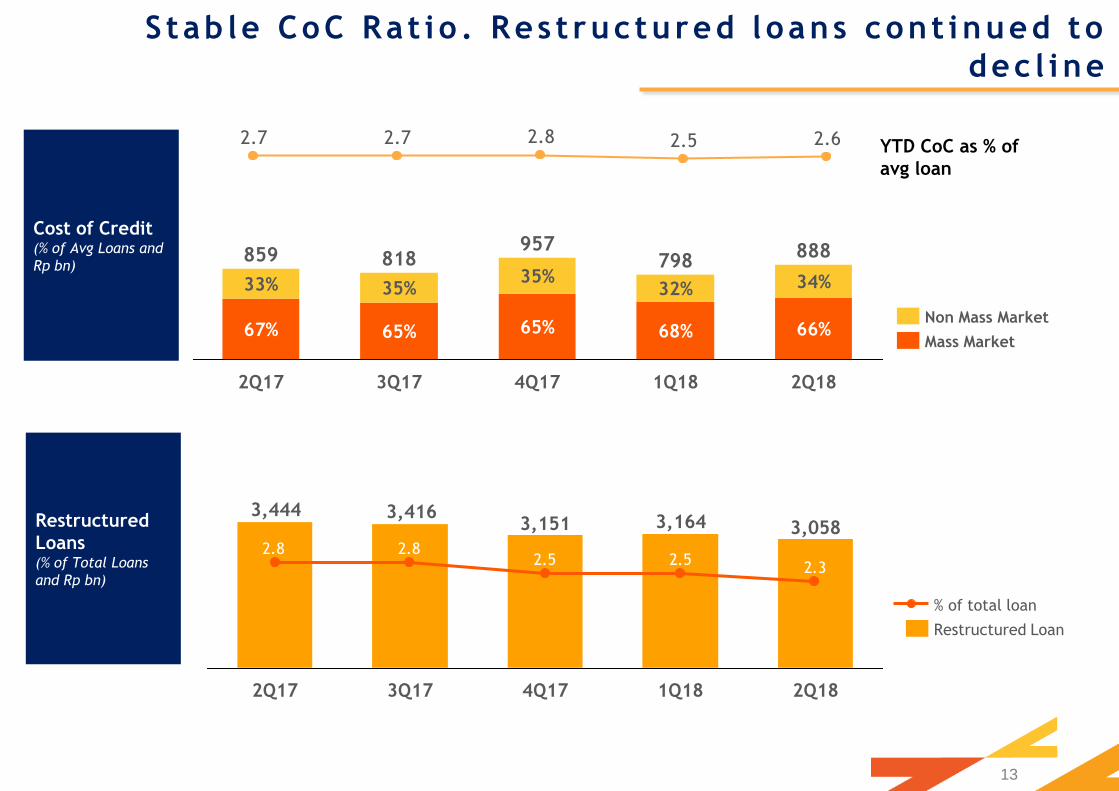
2Q18 1Q18
798
68%
32%
4Q17
957
65%
35%
3Q17
818
65%
35%
2Q17
859
67%
33%
888
66%
34%
Restructured
Loans (% of Total Loans
and Rp bn)
YTD CoC as % of
avg loan
Cost of Credit (% of Avg Loans and
Rp bn)
3,0583,1643,1513,4163,444
2.32.52.5
2.82.8
1Q18 4Q17 3Q17 2Q17 2Q18
Restructured Loan
% of total loan
2.62.52.82.72.7
13
Non Mass Market
Mass Market
S tab le CoC Ra t io . Res t ruc tured loans cont inued to
dec l ine
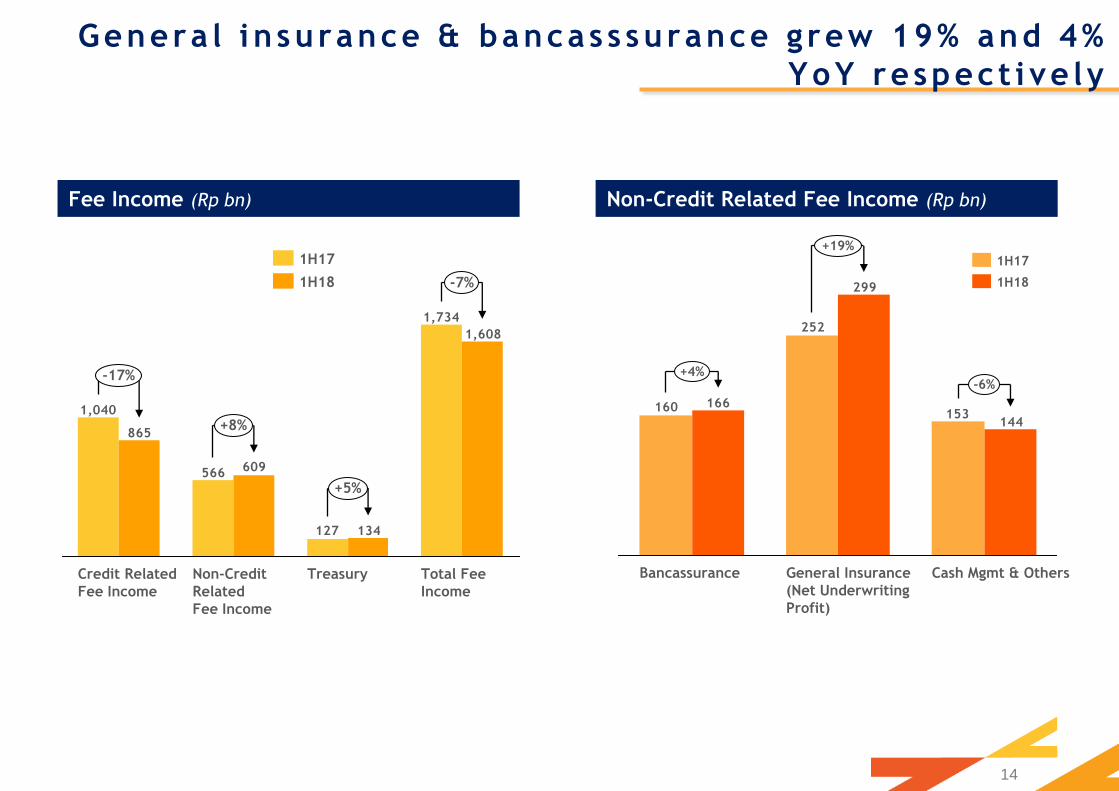
Non-Credit Related Fee Income (Rp bn)
Genera l i n surance & bancas s surance g rew 19% and 4%
YoY respect i ve ly
153
252
160144
299
166
Cash Mgmt & Others General Insurance
(Net Underwriting
Profit)
Bancassurance
+19%
-6% +4%
Fee Income (Rp bn)
1,734
127
566
1,040
1,608
134
609
865
-17%
+8%
+5%
-7%
Total Fee
Income
Treasury Non-Credit
Related
Fee Income
Credit Related
Fee Income
1H17
1H18
14
1H17
1H18

Investor Relations
PT Bank Danamon Indonesia, Tbk Menara Bank Danamon, 16th Floor
Jl. H.R. Rasuna Said Kav. C-10
Setiabudi - Kuningan, Jakarta Selatan 12940
Phone: +62 21 8064 5000
Email: [email protected]
THANK YOU


