
Sage Group plc resultsfor the six months ended
31 March 2017
The following presentation is being made only to, and is only directed at, persons to whom such presentation may lawfully be communicated (“relevant persons”). Any person who is not a relevant person should not act or rely on this presentation or any of its contents. Information in the following presentation relating to the price at which relevant investments have been bought or sold in the past or the yield on such investments cannot be relied upon as a guide to the future performance of such investments. • This presentation does not constitute an offering of securities or otherwise constitute an
invitation or inducement to any person to underwrite, subscribe for or otherwise acquire securities in The Sage Group plc (the “Company”) or any company which is a subsidiary of the Company. Information in the following presentation relating to the price at which relevant investments have been bought or sold in the past or the yield on such investments cannot be relied upon as a guide to the future performance of such investments.
• The release, publication, distribution or this presentation in certain jurisdictions may be restricted by law, and therefore persons in such jurisdictions into which this presentation is released, published or distributed should inform themselves about, and observe, such restrictions.
• Certain statements contained in this presentation constitute forward-looking statements. All statements other than statements of historical facts included in this presentation, including, without limitation, those regarding the Company’s financial condition, business strategy, plans and objectives, are forward-looking statements. These forward-looking statements can be identified by the use of forward-looking terminology, including the terms “believes”, “estimates”, “anticipates”, “expects”, “intends”, “may”, “will”, or “should” or, in each case, their negative or other variations or comparable terminology. Such forward-looking statements involve known and unknown risks, uncertainties and other factors, which may cause the actual results, performance or achievements of the Company, or industry results, to be materially different from any future results, performance or achievements expressed or implied by such forward-looking statements. Such forward-looking statements are based on numerous assumptions regarding the Company’s present and future
business strategies and the environment in which the Company will operate in the future. Such risks, uncertainties and other factors include, among others: Inherent difficulty in predicting customer behaviour; customers may not respond as we expected to our sales and marketing activities; the competitive environment; our ability to adapt to technological change; business interruption or failure of our systems architecture and communication systems; problems with implementing upgrades to our applications and supporting information technology infrastructure; any failure to properly use and protect personal customer information and data; our ability to manage and maintain third party business partnerships; increased regulation of our businesses; any failure to process transactions effectively; any failure to adequately protect against potential fraudulent activities; any significant quality problems or delays; the global macro-economic environment; our inability to attract, retain and develop talented people; our ability to repurchase shares; our inability to adequately protect our intellectual property rights; disruptions, expenses and risks associated with any acquisitions and divestitures; amortisation of acquired intangible assets and impairment charges; our use of debt to finance acquisitions or other activities; and the cost of, and potential adverse results in, litigation involving intellectual property, competition authority, shareholder and other matters. These forward-looking statements speak only as at the date of this presentation. Except as required by the Financial Conduct Authority, or by law, the Company expressly excludes any obligation to update or revise publicly any forward-looking statement, whether as a result of new information, future events, or otherwise. Nothing in the foregoing is intended to or shall exclude any liability for, or remedy in respect of, fraudulent misrepresentation.
• RoundingAs a result of rounding throughout this document, it is possible that tables may not cast and change percentages may not calculate precisely.
• MaterialityOnly figures over £1m are considered to be material for the purposes of this presentation.
02
Safe harbour
Sage Group plc interim results 2017 #SageResults
Stephen KellyChief Executive Officer
@SKellyCEO
Agenda:• Summary
• CFO review
• Progress
• Outlook
• Q&A
03 Sage Group plc interim results 2017 #SageResults

H1 17 Summary
04
The strategy is working
Strong foundations and road map
for acceleratinggrowth
Q2 momentum continuing into H2
Sage Group plc interim results 2017 #SageResults

Steve HareChief Financial Officer
@SteveHareCFO
05 Sage Group plc interim results 2017 #SageResults

Organic and underlying revenue
Operating Profit Margin %H1 17
%H1 16
%Change
Organic 25.2% 25.6% -40bps
Underlying 25.1% 25.5% -40bps
06
RevenueH1 17
£mH1 16
£mGrowth
Organic* £838m £787m +6.4%
Inorganic adjustments £74m £76m
Underlying* £912m £863m +5.7%
*See appendix for definitions
Sage Group plc interim results 2017 #SageResults
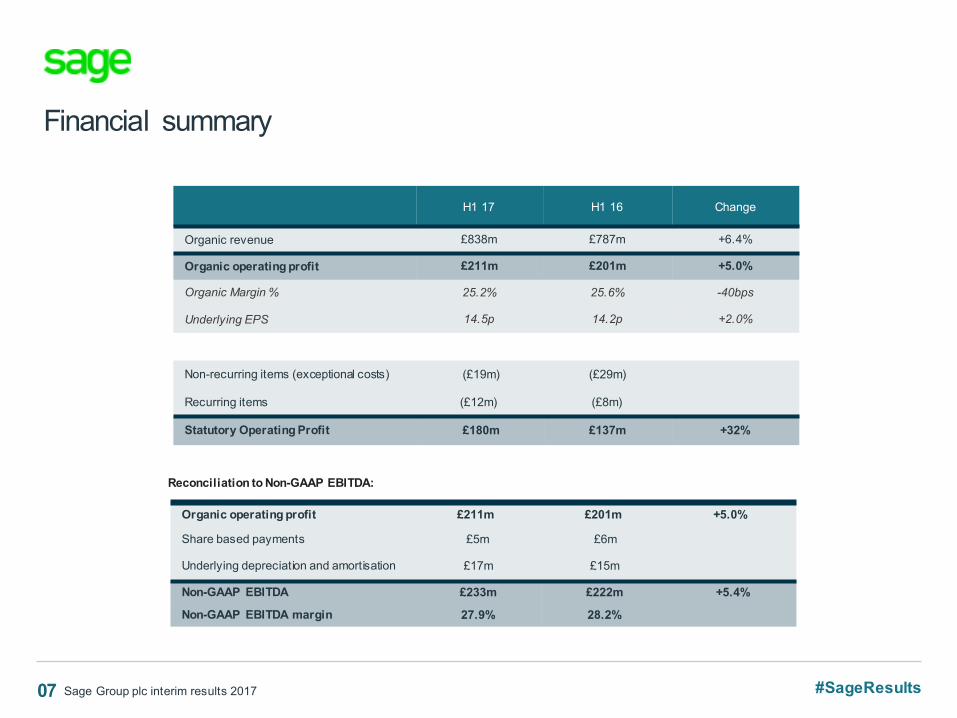
Financial summary
H1 17 H1 16 Change
Organic revenue £838m £787m +6.4%
Organic operating profit £211m £201m +5.0%
Organic Margin % 25.2% 25.6% -40bps
Underlying EPS 14.5p 14.2p +2.0%
Organic operating profit £211m £201m +5.0%
Share based payments £5m £6m
Underlying depreciation and amortisation £17m £15m
Non-GAAP EBITDA £233m £222m +5.4%
Non-GAAP EBITDA margin 27.9% 28.2%
Reconciliation to Non-GAAP EBITDA:
Non-recurring items (exceptional costs) (£19m) (£29m)
Recurring items (£12m) (£8m)
Statutory Operating Profit £180m £137m +32%
07 Sage Group plc interim results 2017 #SageResults

Free cash flow £166m
M&A (£87m)
Ordinarydividends (£101m)
Exchange movement on debt (£15m)
Interest (£10m)
Tax paid (£39m)
Exceptional costs (£23m)
Depreciation/amortisation £17m
Share-basedpayments £5m
Change in working capitaland deferred income £2m
Net CAPEX (£15m)
Underlyingoperating profit
£229m Underlying cash flow from operating activities
£238m
Free cash flow £166mUnderlying cash flow from
operating activities£238m
Opening net debt (£397m)
Closing net debt (£434m)
Strong capital metrics
08
Free cash flow as% of revenue
18%Cash conversion 104% Net leverage 0.9x
Key Metrics:
Sage Group plc interim results 2017 #SageResults
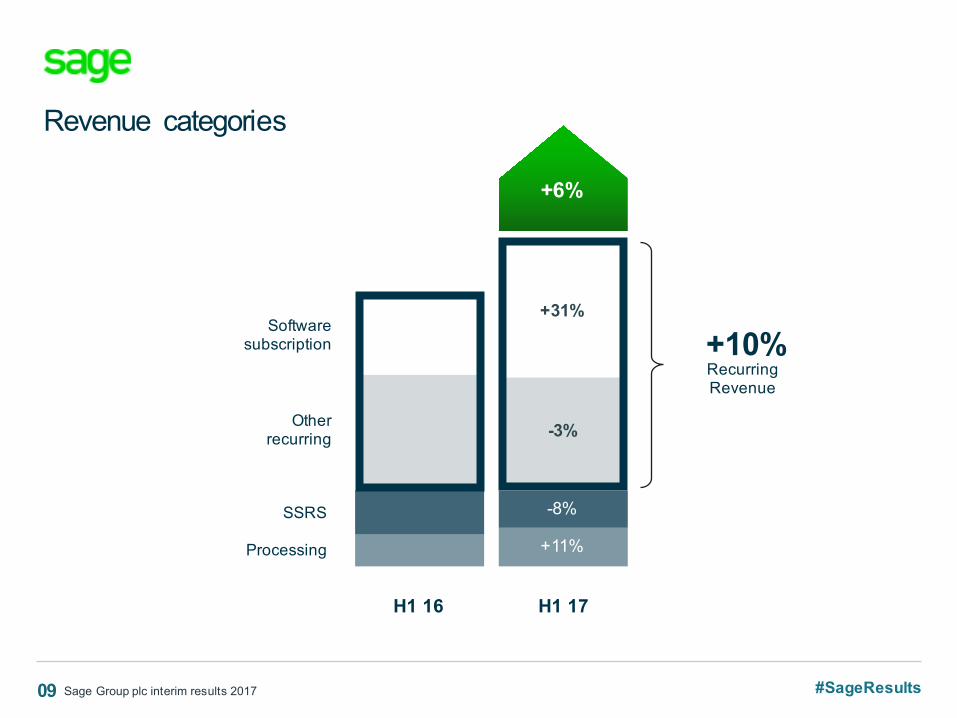
+10%
H1 17H1 16
RecurringRevenue
+31%
-3%
-8%
+6%
Other recurring
SSRS
Processing
Softwaresubscription
Revenue categories
09
+11%
Sage Group plc interim results 2017 #SageResults

Software subscriber growth
Software subscriber growthGrowth in ASB of £82m to £618m over last 6 months
10
£m 15%
536
618 13
34
22
2 11
450
470
490
510
530
550
570
590
610
630
Sep-16 Sage One Sage 50 Sage 200 Sage X3 Other Mar-17
Sage Group plc interim results 2017 #SageResults

Regional overview
11
NorthernEurope
NorthAmerica
Central & Southern
Europe
International
Sage Group plc interim results 2017 #SageResults

What went well• Every major European country excl. France
growing above the group revenue growth rate
• Northern Europe revenue growth of 8%, driven by:
• Strong performance from Sage 50 Accounts, achieving 30% recurring revenue growth
• X3 - 34% growth
• Central Europe: 8% revenue growth
• Iberia: 8% revenue growth
Areas for improvement• France
• Monetising new products
• Phase out first year premium
Europe
12
Recurring Mix
78%H1 16: 75%
RevenueH1 17
£mH1 16
£mGrowth
Recurring £361m £329m +10%
Processing £20m £18m +11%
SSRS £81m £90m -10%
Total £462m £437m +6%
35%H1 16: 31%
Subscription penetration
Sage Group plc interim results 2017 #SageResults

What went well• USA: X3 grew by 25%
• USA: triple digit software subscription growth in Sage 50c & 200c
• Canada: 9% growth, driven by Sage 50c and 200c
Areas for improvement • USA subscription growth
• USA focus on top 30 partners
North America
13
Recurring Mix
78%H1 16: 76%
RevenueH1 17
£mH1 16
£mGrowth
Recurring £187m £174m +7%
Processing £17m £16m +4%
SSRS £37m £40m -7%
Total £241m £230m +5%
22%H1 16: 12%
Subscription penetration
Sage Group plc interim results 2017 #SageResults

What went well• Brazil: 23% revenue growth, double digit recurring
revenue growth
• Africa: 14% X3 growth, 64% growth in Sage One revenue
• Middle East: growing by 23%, with strong Sage X3 growth
• Australia: 8% growth, with strong recurring revenue growth
Areas for improvement • South East Asia: focus on C4L
International
14
Recurring Mix
73%H1 16: 72%
RevenueH1 17
£mH1 16
£mGrowth
Recurring £99m £86m +16%
Processing £7m £5m +36%
SSRS £29m £29m -%
Total £135m £120m +13%
55%H1 16: 51%
Subscription penetration
Sage Group plc interim results 2017 #SageResults
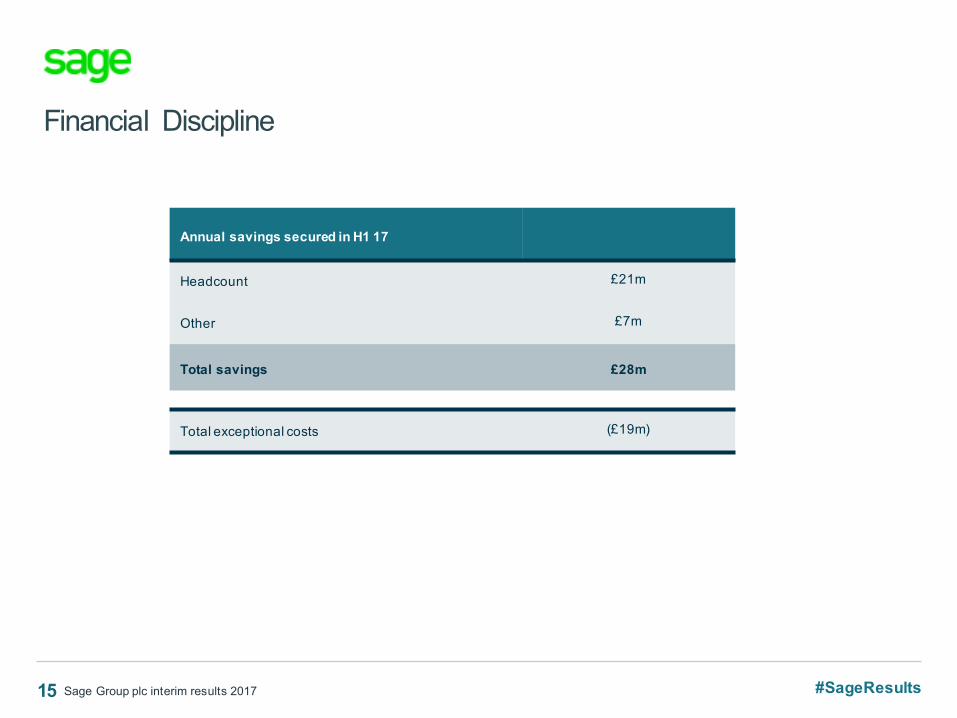
Financial Discipline
Annual savings secured in H1 17
Headcount £21m
Other £7m
Total savings £28m
15
Total exceptional costs (£19m)
Sage Group plc interim results 2017 #SageResults
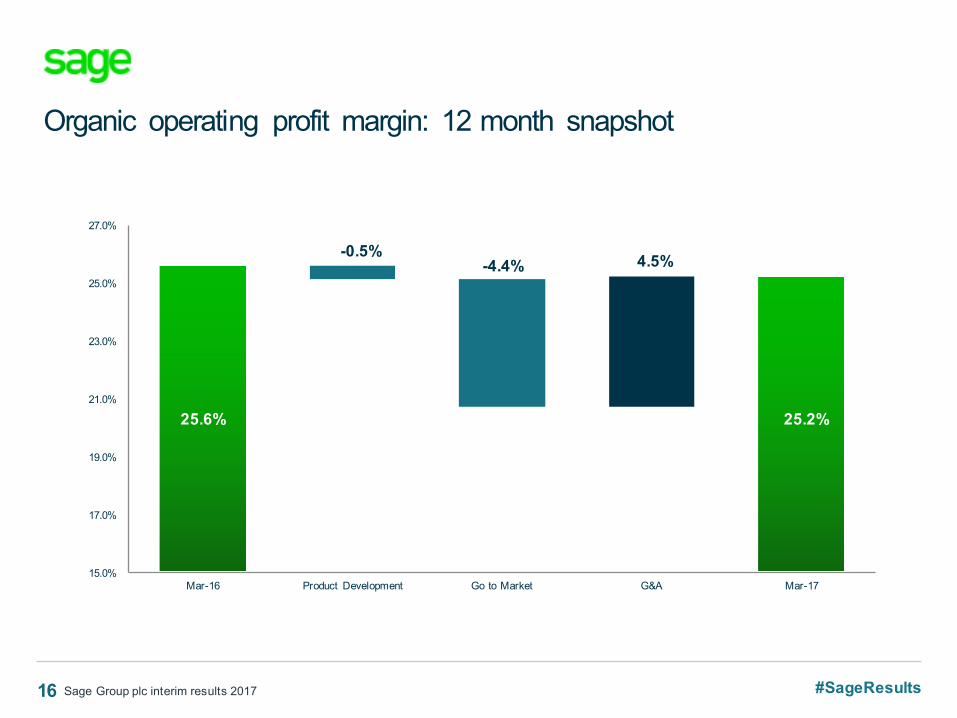
Organic operating profit margin: 12 month snapshot
16
15.0%
17.0%
19.0%
21.0%
23.0%
25.0%
27.0%
Mar-16 Product Development Go to Market G&A Mar-17
25.6%
-0.5%-4.4% 4.5%
25.2%
Sage Group plc interim results 2017 #SageResults

Focus on financial discipline
Strong foundations and road map
for acceleratinggrowth
Q2 momentum continuing into H2
H1 17 Summary
17 Sage Group plc interim results 2017 #SageResults
Stephen KellyChief Executive Officer
@SKellyCEO
18 Sage Group plc interim results 2017 #SageResults
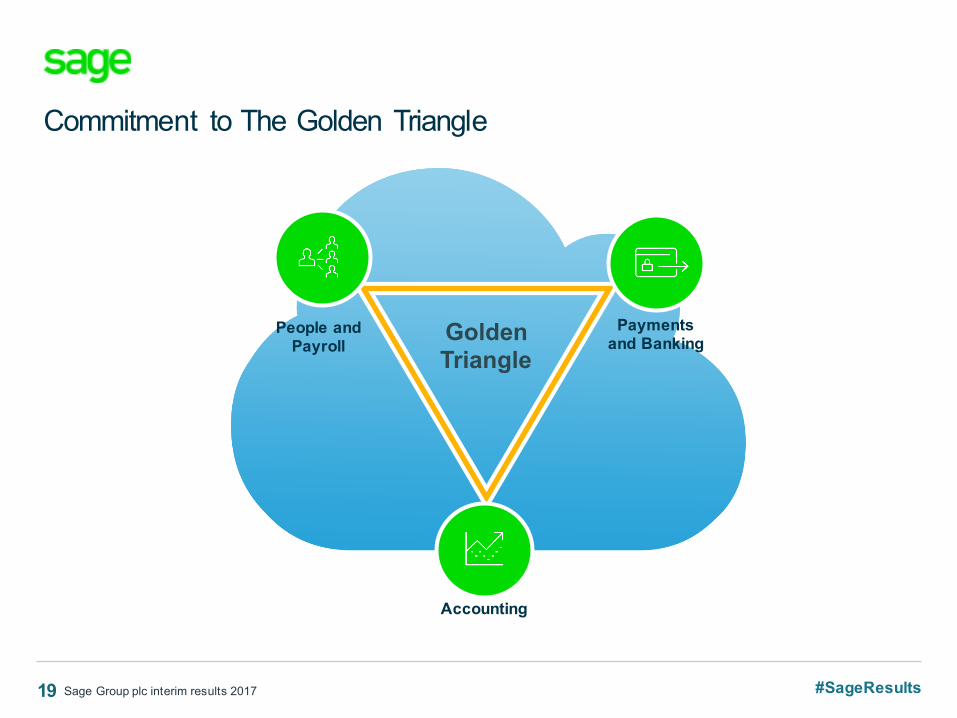
Commitment to The Golden Triangle
19
GoldenTriangle
Payments and Banking
People and Payroll
Accounting
Sage Group plc interim results 2017 #SageResults

One Sage
Customersfor Life
Winning in the Market
Capacity forGrowth
RevolutioniseBusiness
20 Sage Group plc interim results 2017 #SageResults
Strategic Pillars
21
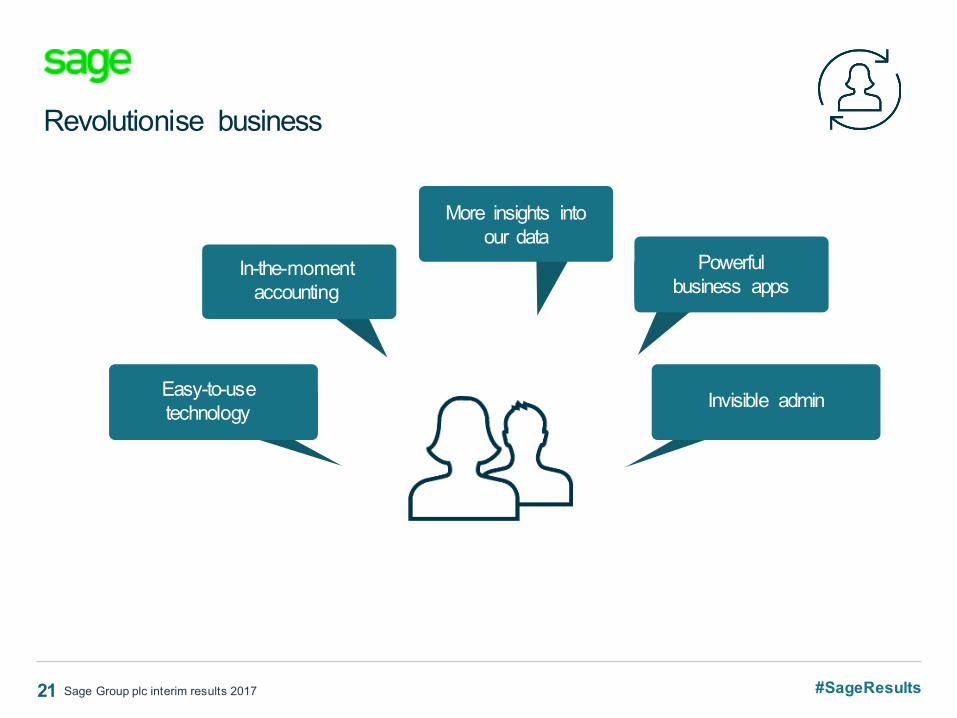
Revolutionise business
In-the-moment accounting
Powerfulbusiness apps
Easy-to-usetechnology Invisible admin
More insights into our data
Sage Group plc interim results 2017 #SageResults
22
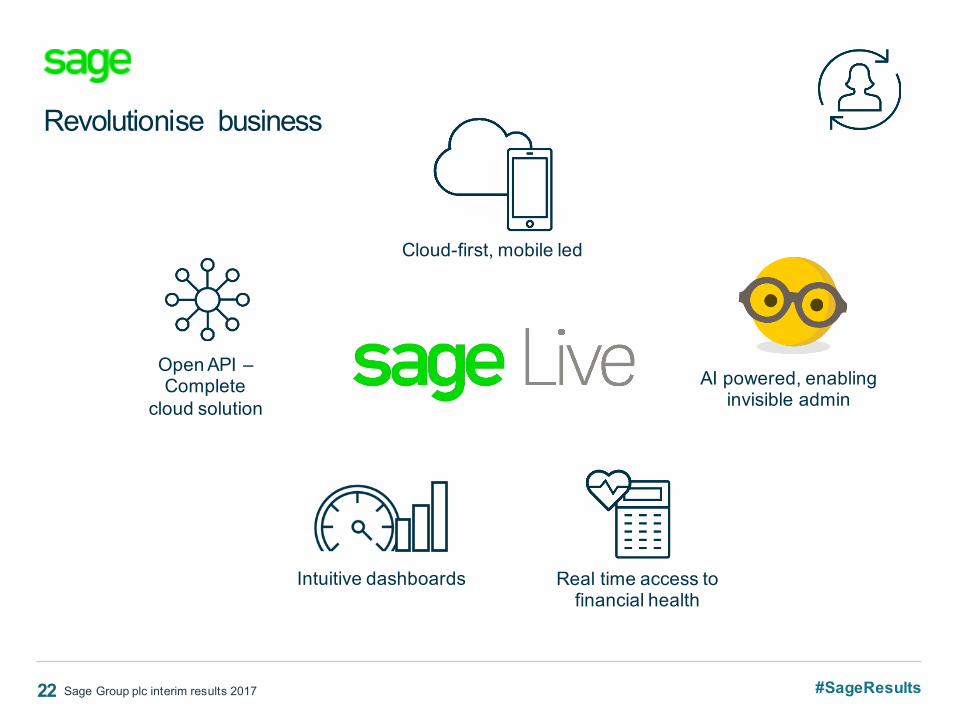
Revolutionise business
Cloud-first, mobile led
AI powered, enabling invisible admin
Real time access to financial health
Intuitive dashboards
Open API –Complete
cloud solution
Sage Group plc interim results 2017 #SageResults
23
Revolutionise business
Strategic alliances
Sage Group plc interim results 2017 #SageResults
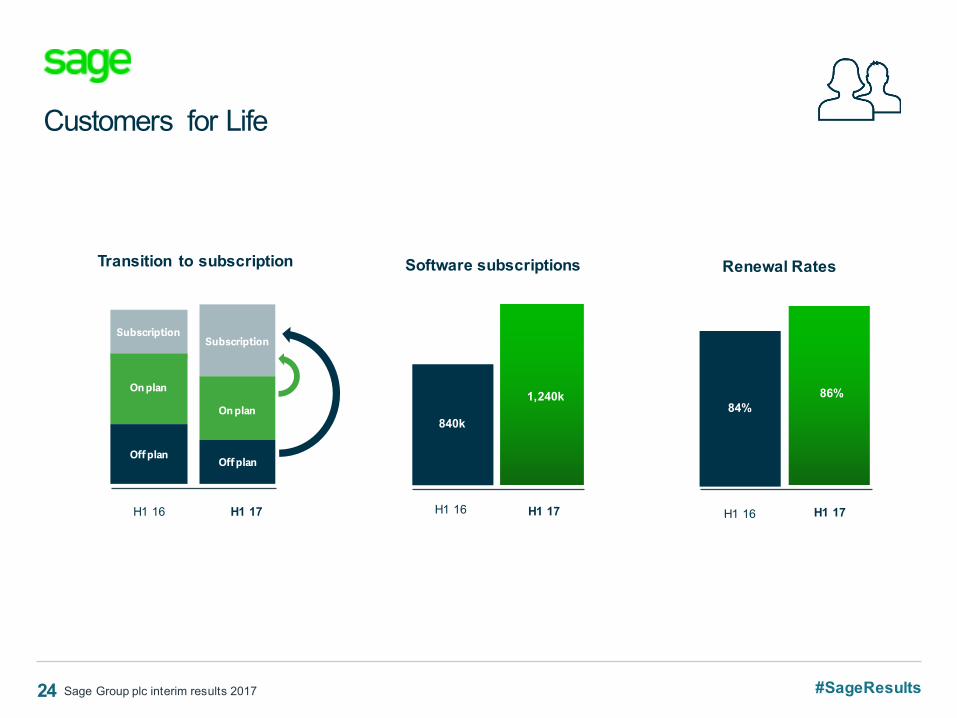
Customers for Life
840k
1,240k
H1 16 H1 17
Software subscriptions
84%86%
H1 16 H1 17
Renewal Rates
24
Subscription
On plan
Off plan
H1 16 H1 17
Subscription
On plan
Off plan
Transition to subscription
Sage Group plc interim results 2017 #SageResults

25
Customers for Life – Sage 50c
Sage 50crevenue growth+25%
Cloud enabled contracts
>110k
H1 17
Sage Group plc interim results 2017 #SageResults

Winning in the Market
26
Start Up
Scale Up
Enterprise
Sage Group plc interim results 2017 #SageResults

Product USA UK & Ireland France Spain Germany Canada Brazil RSA Australia
Winning in the Market
27
H1 16
Sage Group plc interim results 2017 #SageResults
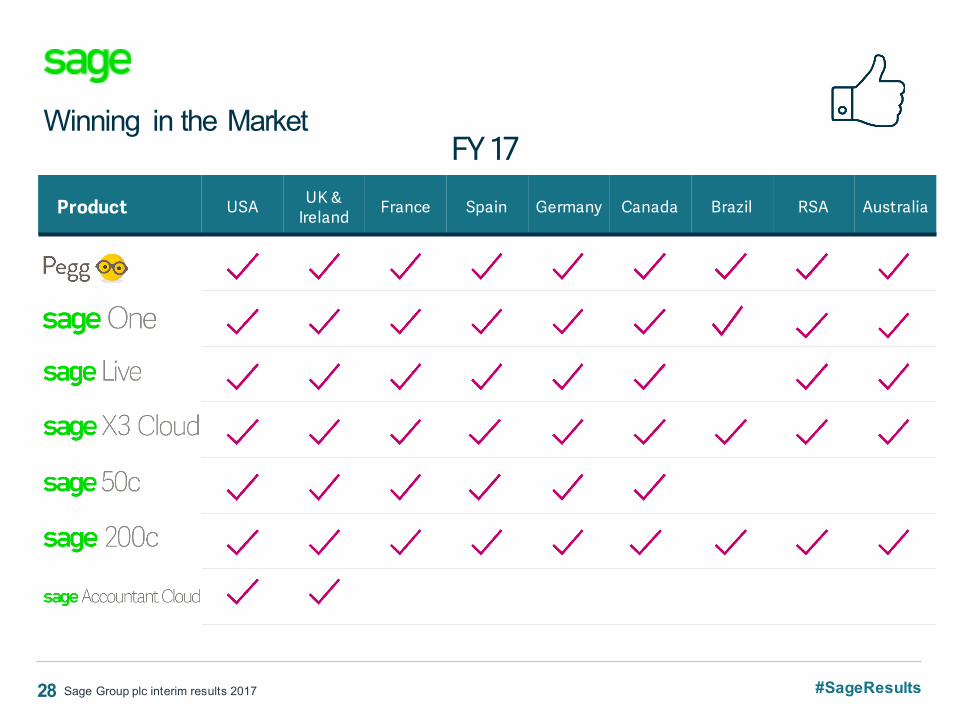
Winning in the Market
28
Product USA UK & Ireland France Spain Germany Canada Brazil RSA Australia
FY 17
Sage Group plc interim results 2017 #SageResults
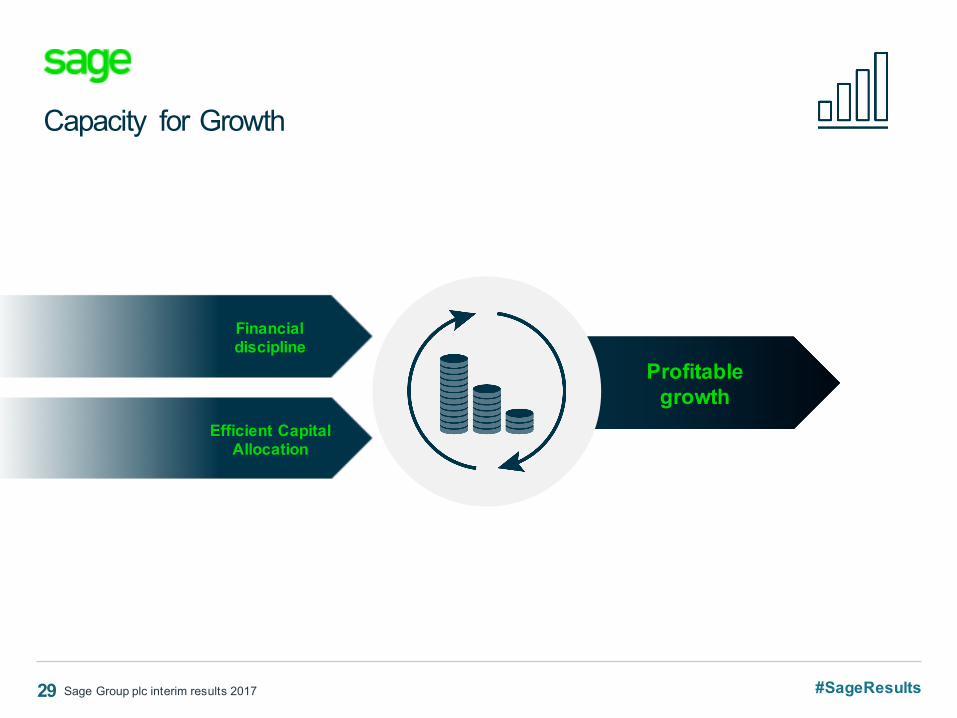
Capacity for Growth
29
Efficient Capital Allocation
Financialdiscipline
Profitablegrowth
Sage Group plc interim results 2017 #SageResults

One Sage
30
Communication of strategy and values Sage Foundation Colleague
engagement
Sage Group plc interim results 2017 #SageResults
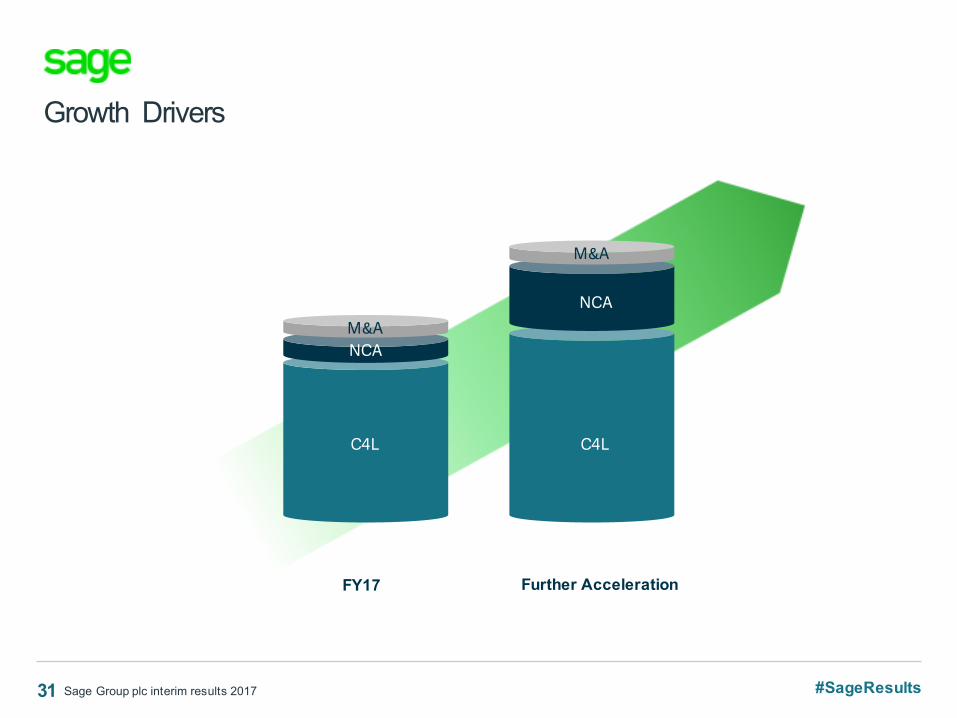
Further Acceleration
Growth Drivers
FY17
31
C4L C4L
NCANCAM&A
NCAM&A
M&A
Sage Group plc interim results 2017 #SageResults
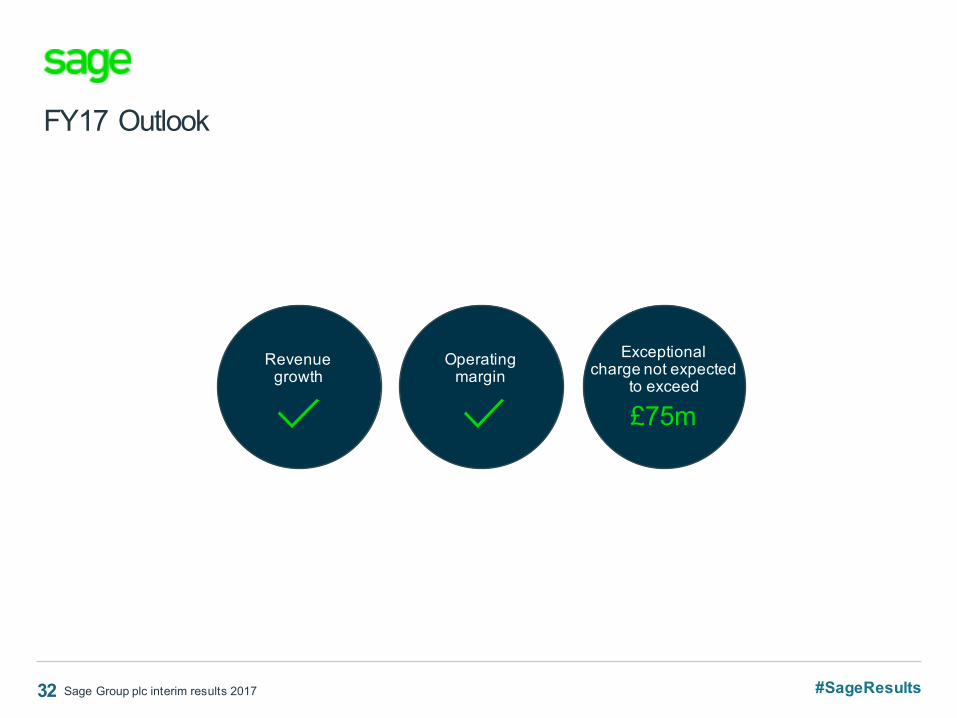
FY17 Outlook
32
Revenuegrowth
Operatingmargin
Exceptionalcharge not expected
to exceed
Sage Group plc interim results 2017 #SageResults
£75m

H1 17 Summary
33
The strategy is working
Strong foundations and road map
for acceleratinggrowth
Q2 momentum continuing into H2
Sage Group plc interim results 2017 #SageResults
Q&A
#
#SageResults
34 Sage Group plc interim results 2017 #SageResults
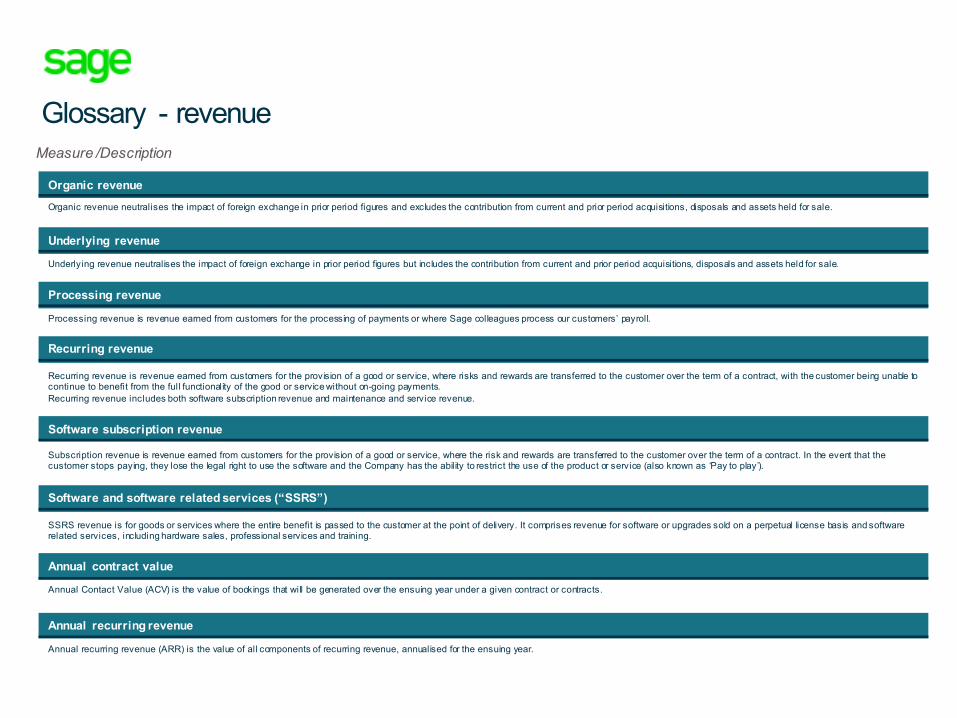
Processing revenue is revenue earned from customers for the processing of payments or where Sage colleagues process our customers’ payroll.
Recurring revenue is revenue earned from customers for the provision of a good or service, where risks and rewards are transferred to the customer over the term of a contract, with the customer being unable to continue to benefit from the full functionality of the good or service without on-going payments. Recurring revenue includes both software subscription revenue and maintenance and service revenue.
Subscription revenue is revenue earned from customers for the provision of a good or service, where the risk and rewards are transferred to the customer over the term of a contract. In the event that the customer stops paying, they lose the legal right to use the software and the Company has the ability to restrict the use of the product or service (also known as ‘Pay to play’).
SSRS revenue is for goods or services where the entire benefit is passed to the customer at the point of delivery. It comprises revenue for software or upgrades sold on a perpetual license basis and software related services, including hardware sales, professional services and training.
Processing revenue
Recurring revenue
Software subscription revenue
Software and software related services (“SSRS”)
Measure /Description
Glossary - revenue
Organic revenue neutralises the impact of foreign exchange in prior period figures and excludes the contribution from current and prior period acquisitions, disposals and assets held for sale.
Organic revenue
Underlying revenue neutralises the impact of foreign exchange in prior period figures but includes the contribution from current and prior period acquisitions, disposals and assets held for sale.
Underlying revenue
Annual recurring revenue (ARR) is the value of all components of recurring revenue, annualised for the ensuing year.
Annual recurring revenue
Annual Contact Value (ACV) is the value of bookings that will be generated over the ensuing year under a given contract or contracts.
Annual contract value
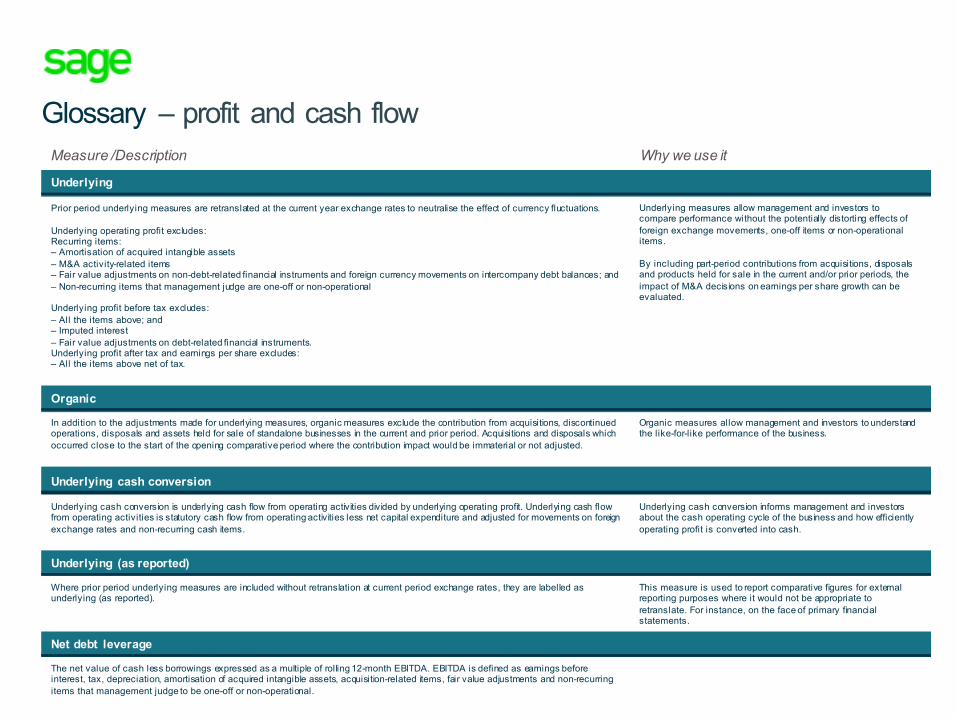
Prior period underlying measures are retranslated at the current year exchange rates to neutralise the effect of currency fluctuations.
Underlying operating profit excludes: Recurring items: – Amortisation of acquired intangible assets– M&A activity-related items– Fair value adjustments on non-debt-related financial instruments and foreign currency movements on intercompany debt balances; and– Non-recurring items that management judge are one-off or non-operational
Underlying profit before tax excludes:– All the items above; and– Imputed interest– Fair value adjustments on debt-related financial instruments.Underlying profit after tax and earnings per share excludes:– All the items above net of tax.
In addition to the adjustments made for underlying measures, organic measures exclude the contribution from acquisitions, discontinued operations, disposals and assets held for sale of standalone businesses in the current and prior period. Acquisitions and disposals which occurred close to the start of the opening comparative period where the contribution impact would be immaterial or not adjusted.
Underlying cash conversion is underlying cash flow from operating activities divided by underlying operating profit. Underlying cash flow from operating activities is statutory cash flow from operating activities less net capital expenditure and adjusted for movements on foreign exchange rates and non-recurring cash items.
Where prior period underlying measures are included without retranslation at current period exchange rates, they are labelled asunderlying (as reported).
Underlying measures allow management and investors to compare performance without the potentially distorting effects of foreign exchange movements, one-off items or non-operational items.
By including part-period contributions from acquisitions, disposals and products held for sale in the current and/or prior periods, the impact of M&A decisions on earnings per share growth can be evaluated.
Organic measures allow management and investors to understand the like-for-like performance of the business.
Underlying cash conversion informs management and investors about the cash operating cycle of the business and how efficiently operating profit is converted into cash.
This measure is used to report comparative figures for external reporting purposes where it would not be appropriate to retranslate. For instance, on the face of primary financial statements.
Underlying
Organic
Underlying cash conversion
Underlying (as reported)
Measure /Description Why we use it
Glossary – profit and cash flow
The net value of cash less borrowings expressed as a multiple of rolling 12-month EBITDA. EBITDA is defined as earnings before interest, tax, depreciation, amortisation of acquired intangible assets, acquisition-related items, fair value adjustments and non-recurring items that management judge to be one-off or non-operational.
Net debt leverage


