Hugo Pettingell ACSM FIQ
September 2012
Manufactured Sand What it is, what it isn’t, and why, plus some processing methods
SenX Limited,
3 Welmar Mews,
London SW4 7DD
Define manufactured sand

MANUFACTURED SAND “The aggregate industry typically has branded any crushed product that is less than 4 mesh (4.75 mm) as “manufactured sand”. This of course is not the case. Manufactured sand should be a product that you have intentionally produced, not merely the waste fraction of a process that is targeting larger aggregate sizes.”
BARRY HUDSON
1999
What Manufactured Sand is – and what it is not!

Manufactured sand

“The equidimensionality and angularity of coarse and fine aggregate
particles, the degree and shape of the texture on their surfaces, the
amount of surface area caused by the particle shape and degree of
relief, and the chemical and physical nature of coatings, if present,
are all characteristics that significantly affect the properties of both
fresh and hardened concrete.”¹
What affects the performance of aggregates in concrete?
“The impact of the physical characteristics of fine aggregate on
the concrete mix properties, in both the plastic and hardened
states, is significantly greater than that of the coarse aggregate
fraction.”²

Just for comparison.... Particle Size (mm)
(spherical) Particle Volume (mm³) Number of particles
in 8200 mm3 Surface area in 8200 mm3 (m2)
25 8200 1 0.002
4 33.5 244 0.012
0.075 2x10ˉ4 4x10⁷ 0.7
0.002 2x 10ˉ9 2x10¹² 24
Due to the much smaller particle size, and hence the greatly
increased surface area to volume ratio, any detrimental or
undesirable particle shape or texture of the fine aggregates will
be greatly amplified…” ³
This is why we need to consider particle shape even more critically as particle size decreases.
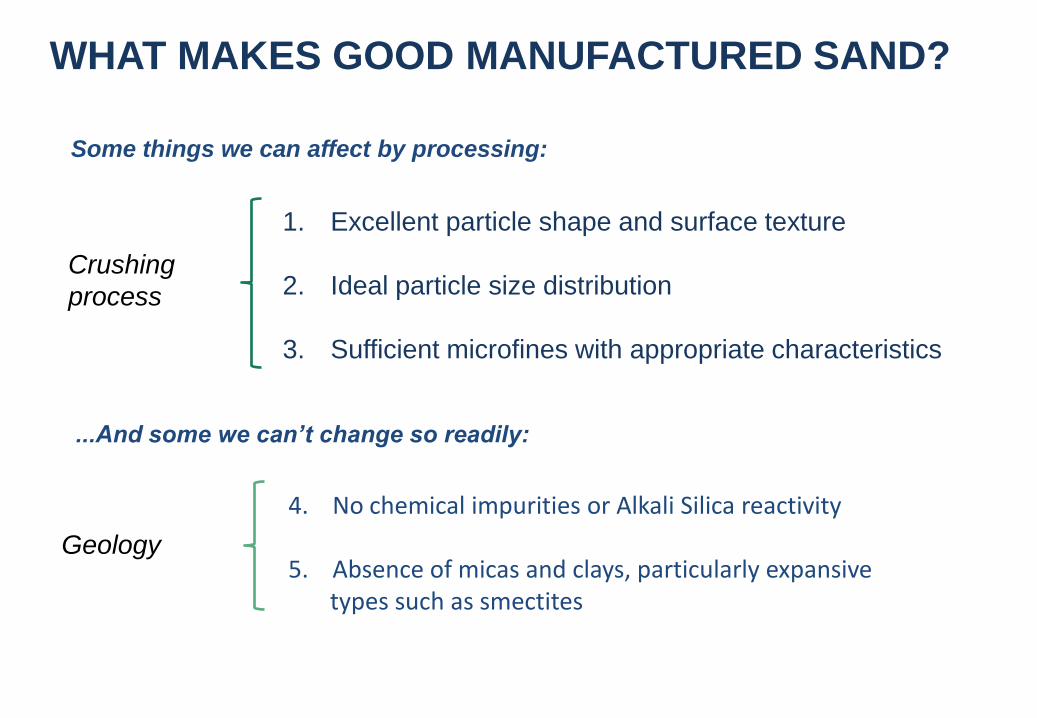
WHAT MAKES GOOD MANUFACTURED SAND?
4. No chemical impurities or Alkali Silica reactivity
5. Absence of micas and clays, particularly expansive types such as smectites
1. Excellent particle shape and surface texture
2. Ideal particle size distribution
3. Sufficient microfines with appropriate characteristics
Geology
Crushing
process
Some things we can affect by processing:
...And some we can’t change so readily:

Source rock

Caution!
Be very careful in selecting the source rock:
Geology has a huge effect on the suitability of material for manufactured sand
Alteration and weathering can vary within a quarry, and may preclude the use of
some areas for sand for concrete. There may even be more than one rock type.
Proper evaluation of characteristics is essential BEFORE installing equipment –
the results will have a bearing on the selection of an appropriate process.

Particle Shape

Why particle shape?
What difference does it make in practice?
Specific surface area – total surface area of a material per unit of mass (usually m²/kg): Smaller surface area means less “glue” (cement paste) needed to coat it
Packing density, or Voids Ratio: Voids ratio may vary up to 10% between
extremes of shape and texture, but a normal range is more like 4-5%.
Lower voids ratio reduces cement paste volume . Particle shape affects workability of concrete in the liquid phase
Lower internal friction leads to better workability and lower water requirement

PARTICLE SHAPE – Some comparative images
0.3-0.15mm
2.5-1.2mm
0.6-0.3mm
Cone BARMAC 65m/s Kemco US7 55m/s
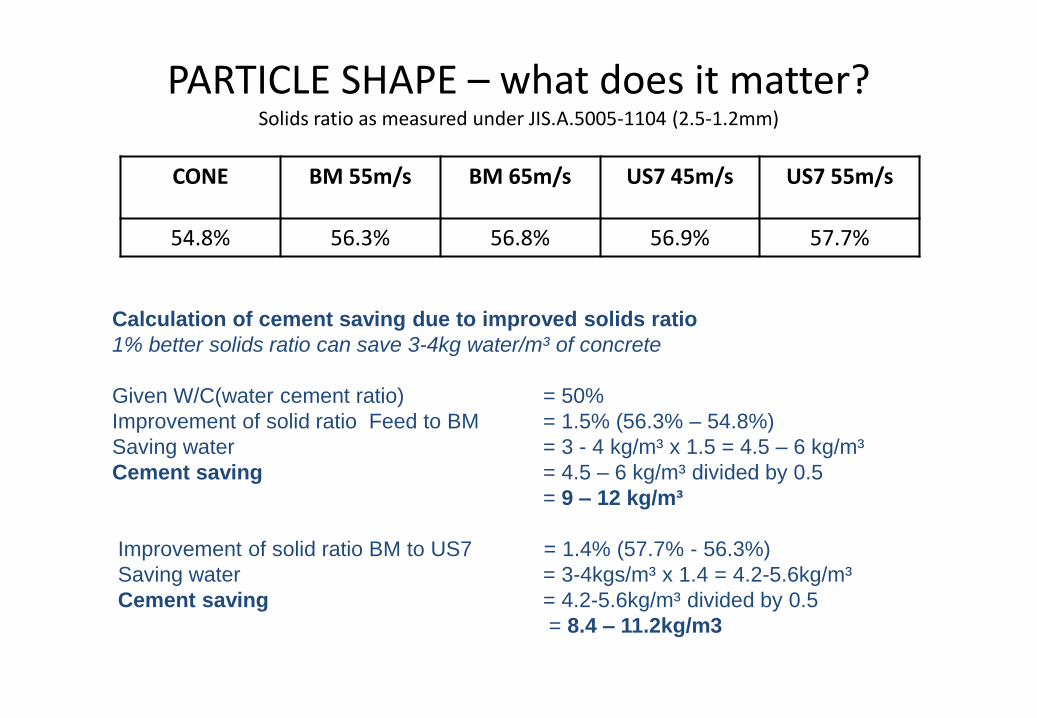
PARTICLE SHAPE – what does it matter? Solids ratio as measured under JIS.A.5005-1104 (2.5-1.2mm)
Calculation of cement saving due to improved solids ratio
1% better solids ratio can save 3-4kg water/m³ of concrete
Given W/C(water cement ratio) = 50%
Improvement of solid ratio Feed to BM = 1.5% (56.3% – 54.8%)
Saving water = 3 - 4 kg/m³ x 1.5 = 4.5 – 6 kg/m³
Cement saving = 4.5 – 6 kg/m³ divided by 0.5
= 9 – 12 kg/m³
Improvement of solid ratio BM to US7 = 1.4% (57.7% - 56.3%)
Saving water = 3-4kgs/m³ x 1.4 = 4.2-5.6kg/m³
Cement saving = 4.2-5.6kg/m³ divided by 0.5
= 8.4 – 11.2kg/m3
CONE BM 55m/s BM 65m/s US7 45m/s US7 55m/s
54.8% 56.3% 56.8% 56.9% 57.7%
“To assist with cement paste / aggregate particle bond, it is desirable to have a ‘roughened’ particle surface. It is important that this surface is not too rough or honeycombed, as this will greatly influence the amount of water required to make the concrete workable in its plastic state. Spherical particles in many cases are ‘polished’ and offer little for the cement paste to bond with, and can produce concrete with reduced strengths, particularly flexural strength.” ² Perhaps crushed rock sand can be better than some very smooth natural materials in respect to surface texture, if properly processed?
Surface texture
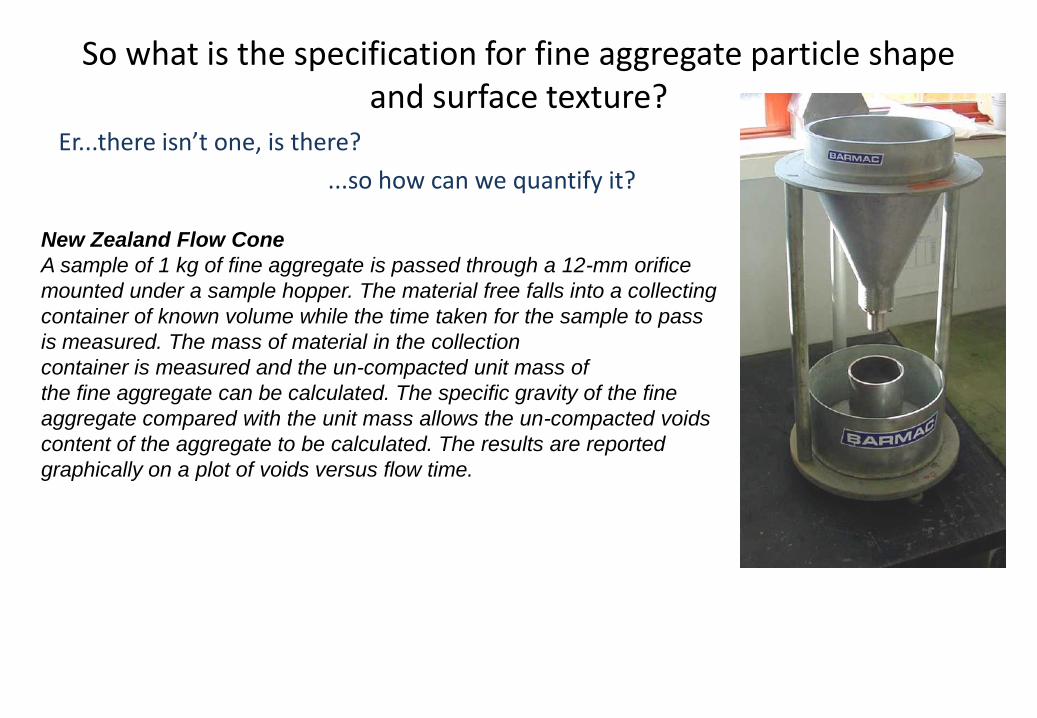
Er...there isn’t one, is there?
...so how can we quantify it?
So what is the specification for fine aggregate particle shape and surface texture?
New Zealand Flow Cone
A sample of 1 kg of fine aggregate is passed through a 12-mm orifice
mounted under a sample hopper. The material free falls into a collecting
container of known volume while the time taken for the sample to pass
is measured. The mass of material in the collection
container is measured and the un-compacted unit mass of
the fine aggregate can be calculated. The specific gravity of the fine
aggregate compared with the unit mass allows the un-compacted voids
content of the aggregate to be calculated. The results are reported
graphically on a plot of voids versus flow time.

But….”Research demonstrates that there are difficulties with the use of the Flow Cone apparatus in testing manufactured sands, and unless these issues were resolved, it would not be practical to use the method for specification. No other suitable procedure was found for specifying the shape and surface texture of manufactured sand that did not require specialised equipment and highly trained staff.”4
Flow cone Cement Concrete & Aggregates Australia
Research Report
Manufactured Sand
National test methods and specification values
January 2007
It seems to work well with a standard
grading reconstructed from the test
material, eliminating the variation due
to particle size distribution

Particle Size Distribution

0
10
20
30
40
50
60
70
80
90
100
0.01 0.1 1 10
CU
MU
LA
TIV
E %
PA
SS
ING
PARTICLE SIZE (mm)
Ryall Clearwell Clearwell Clearwell ASTM C33 ASTM C33
Remains the sole criterion for sand specification in most places, apart from deleterious material exclusions.
Useful for defining consistency
Has less relevance in defining performance, because compliant PSD is no guarantee of suitability for concrete
Particle size distribution
BEST
WORST
Some real gradings and their
performance in concrete

“Members agreed that product grading should not be a specification test. Instead, the product supplier should provide a submitted grading to which the deviation limits current in AS 2758.1 would apply. How these deviation limits might be applied to the broad range of possible product gradings will require careful consideration. Gradings would obviously become a quality control tool with results of interest to individual suppliers and their customers. However, it was considered necessary for the purposes of definition to specify that 'manufactured sands' for use in concrete would have: • between 90% and 100% passing 4.75-mm sieve; • between 15% and 80% passing 0.6-mm sieve; • between 0% and 20% passing 75 micron sieve.”4
THE KEY HERE IS NOT AN ABSOLUTE GRADATION, BUT CONSISTENCY!
Particle size distribution
Cement Concrete & Aggregates Australia
Research Report
Manufactured Sand
National test methods and specification values
January 2007

CCAA Proposal:
Particle size distribution – Is there an ideal grading?
0
10
20
30
40
50
60
70
80
90
100
0.01 0.1 1 10
CU
MU
LA
TIV
E %
PA
SS
ING
PARTICLE SIZE (mm)
Ryall Clearwell Clearwell Clearwell CCAA CCAA
AS SIEVE MAX DEVIATION
6.7 -
4.75 ±5
2.36 ±10
1.18 ±15
0.6 ±15
0.3 ±10
0.15 ±5
0.075 ±3
An ideal grading is one that makes good concrete and does not vary However, there is usually a preference for abundant particles in in the range 250-1000µm

Microfines
For twenty years or more, researchers have been busy proving that
microfines are a valuable constituent in concrete, while end users have
not been prepared to deviate far from specification-based sand
gradings designed for natural sands.
ICAR102-1F:
“Compared to concrete made with lower-fines content natural sand, high-fines manufactured sand
concrete generally had higher flexural strength, improved abrasion resistance, higher unit weight, and
lower permeability due to filling of the pores with microfines. (Lower permeability is important for
reducing corrosion).
Compressive strength varied but was acceptable, and shrinkage, although slightly higher, was within
generally acceptable ranges.
Good-quality concrete could be made from nearly all of the aggregates (with microfines contents
ranging from 7 to 18%) used in the test program without the use of admixtures.”5
Microfines (<63µm)

…and, according to Kaya, Nagahara & Yamamoto:6
• Microfines with all of the <20µm fraction eliminated can be used as part of the fine aggregate without detrimental effect on the properties of fresh concrete. • A suitably modified fines gradation is better than the original fines gradation for the properties of fresh concrete, including maintaining favourable slump. • Reduced compressive strength was not evident, regardless of increased blending ratio of original and modified fines gradation • Slump in concrete using the +120µm, 75µm, and 40µm fractions of modified fines gradation was not markedly reduced. Do we need to reconsider the size below which we eliminate crushed rock fines?
Microfines (<63µm)

• What is certain is that there will be limits applied to the microfine content of manufactured sand until we accept that such material is useful, and adjust its specifications and mix designs accordingly. • Narrow grading limits are also of doubtful usefulness in defining performance. • In many places, existing prescriptive specifications are poisonous to progress in adapting to manufactured sand, and need replacing with a performance approach, including measures to ensure consistency. Nominated gradings with tolerances would be more meaningful • The asphalt industry adopted this approach to specification in the late 1970’s in the UK - over 30 years ago!
Grading and Microfines Specification

Other quality issues

Loss of consistency due to :
Wind and weather action
Stratification on conveyors
Careless handling
Transfer to stockpiles
Segregation of dry manufactured sand
Luffing radial stockpiler
Water adding mixer (c. 3%)
Excessively dry sand may absorb water when concrete mixing and cause slump loss.
Sand manufacturing equipment

Assuming we already have a competently designed and operated crushing plant,
we need to consider only the final stage or two of reduction and sizing.
Manufacture of sand is usually, in practice, a matter of turning crushed rock fines
produced using compression crushers or possibly HSI’s into something of
superior quality.
Crushers
0
10
20
30
40
50
60
70
80
90
100
0.01 0.1 1 10
CU
MU
LA
TIV
E %
PA
SS
ING
PARTICLE SIZE (mm)
Clearwell Limestone Cribarth Gritstone Belgard Limestone
Ledinge ASTM C33 ASTM C33
REDUCE THIS
CONTROL THIS
IMPROVE THE SHAPE THROUGHOUT

Autogenous VSI Crushers – the essential ingredient?
In the years between 1979 and 2012 many explanations and theories have been put forward about how the VSI actually works.
Most theories have merit and must be accepted as valid points of view. As nobody can show hard evidence of “seeing the machine work”
we can only rely on what goes in and what comes out:
Our rotors work well in nearly all the applications we use them in, but be warned that we have records of rotors underperforming
dramatically in applications we took for granted!
We now know why they failed and this is one of Oresizer’s strengths. We know what doesn’t work!”
Peter Crymble, Oresizer

Autogenous Vertical Shaft Impactors
REMco, Kemco, Oresizer, Milestone,
etc. autogenous machines
Kemco hybrid machine for sand only
Metso Barmac, Sandvik,
and most Indian and Chinese copies
Autogenous Vertical Shaft Impactors
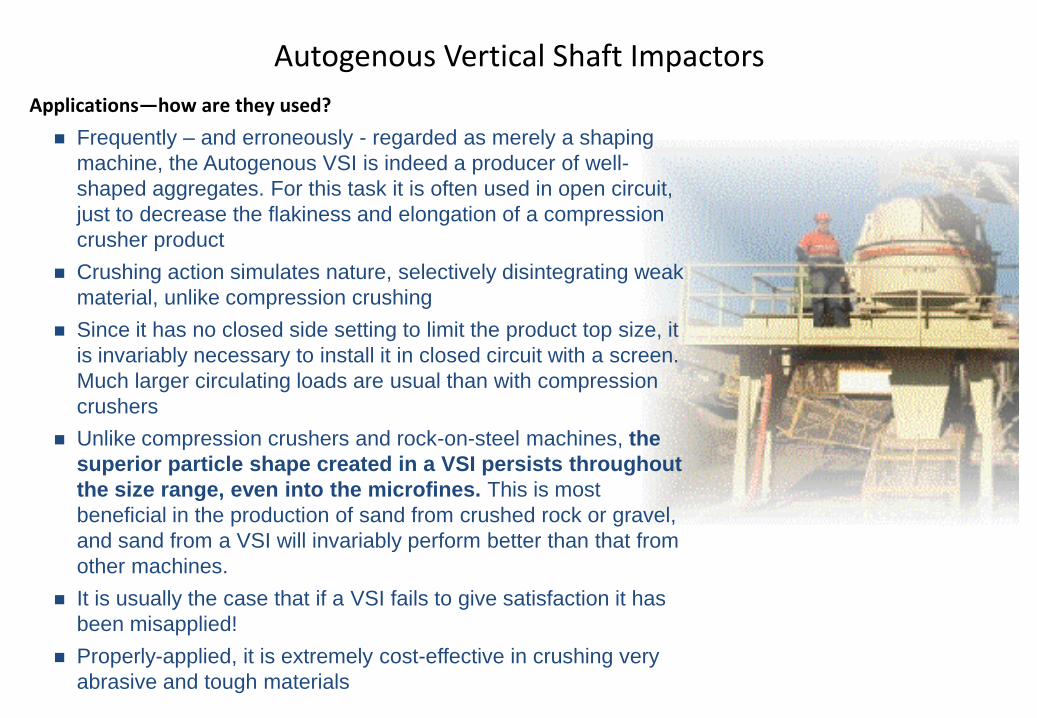
Applications—how are they used?
Frequently – and erroneously - regarded as merely a shaping
machine, the Autogenous VSI is indeed a producer of well-
shaped aggregates. For this task it is often used in open circuit,
just to decrease the flakiness and elongation of a compression
crusher product
Crushing action simulates nature, selectively disintegrating weak
material, unlike compression crushing
Since it has no closed side setting to limit the product top size, it
is invariably necessary to install it in closed circuit with a screen.
Much larger circulating loads are usual than with compression
crushers
Unlike compression crushers and rock-on-steel machines, the
superior particle shape created in a VSI persists throughout
the size range, even into the microfines. This is most
beneficial in the production of sand from crushed rock or gravel,
and sand from a VSI will invariably perform better than that from
other machines.
It is usually the case that if a VSI fails to give satisfaction it has
been misapplied!
Properly-applied, it is extremely cost-effective in crushing very
abrasive and tough materials

“It makes the best sand in the world?” …Why?
PARTICLE SHAPE!
The Autogenous VSI Crusher produces particles of better shape than almost
any other machine... Is that all?
It has a limited feed acceptance – 40/50mm – long fraction It is not as efficient as a size reducer as either a cone or HSI It usually produces more microfines
It does not produce any great abundance of 500-1000μm...BUT...
Weak material is reduced to powder
Its product is consistent throughout the life of its wear parts
Properly applied, it is very cost-effective, especially in abrasive rock

VSI PERFORMANCE CONTROLS - 1
Rotor speed Cascade (Metso) / Bi-Flow (Sandvik)
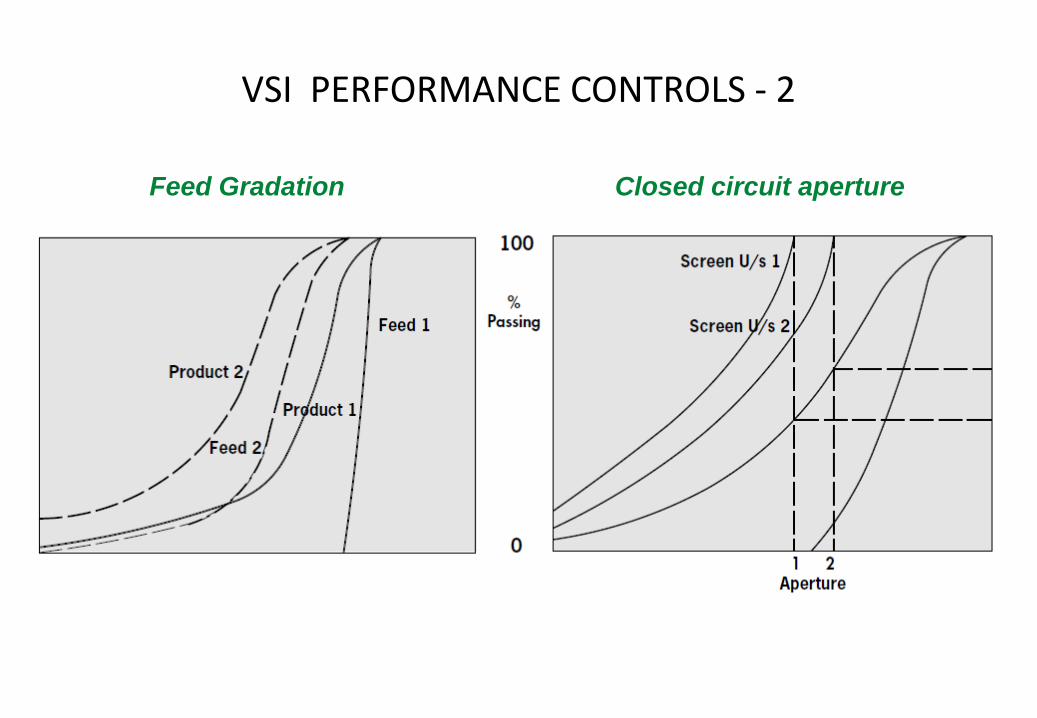
VSI PERFORMANCE CONTROLS - 2
Feed Gradation Closed circuit aperture
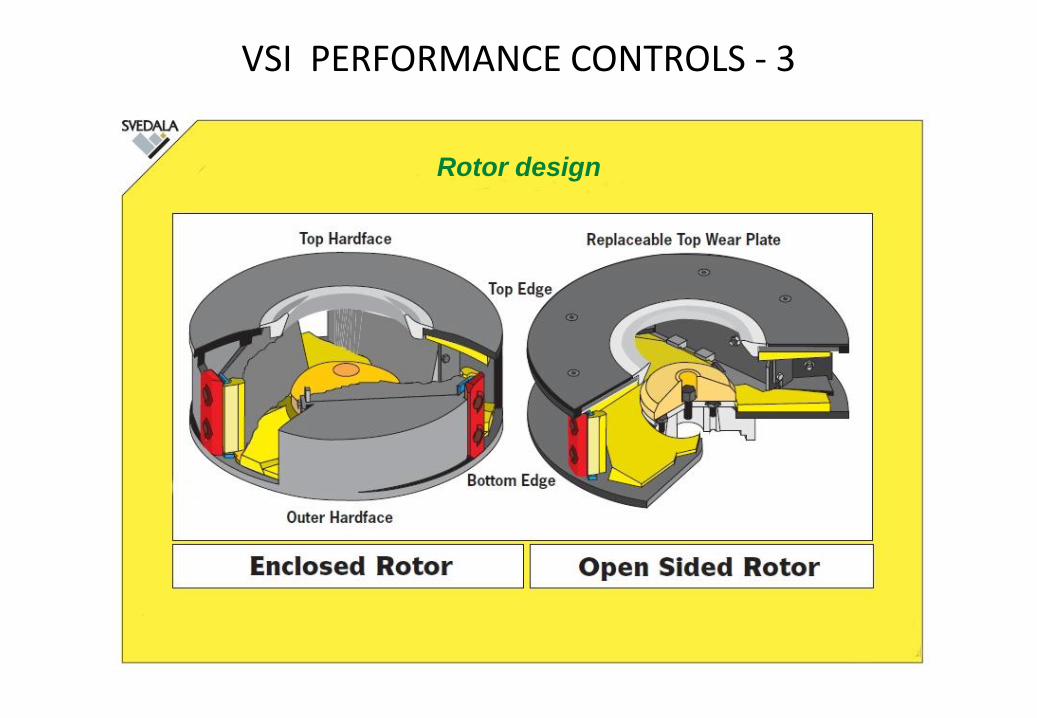
VSI PERFORMANCE CONTROLS - 3
Rotor design

Rotor design
Most manufacturers still mainly offer 3-port designs.
Some manufacturers offer 4-, 5-, and 6-port rotors, and Oresizer has developed 7- and 8-port versions
Additional ports increase the number of ‘rock pulses’ that occur during each revolution, improving the continuity, and thus the
efficiency of the crushing action.
The fewer the ports, the longer the internal grinding path inside the rotor, resulting in more abrasive reduction, and greater
microfines generation. However, it can be suggested that the best particle shape is dependent upon abrasion...
Extra ports also spread the tip wear over a larger number of tips and as a result further lengthen the period between tip changes.
Some rotor designs offer improved serviceability, and some extravagant claims are made in regard to operating cost.
It is easy to persuade most reputable manufacturers to put their rotors into customers’ machines on a trial basis.
Range of sizes
Motor power from 7.5kW to 500kW or more
Throughput capacity from 4 to 500t/h or more

Applications (1)
Granite Quarry in
Malaysia, 1995 Feed from jaw/cone crushers
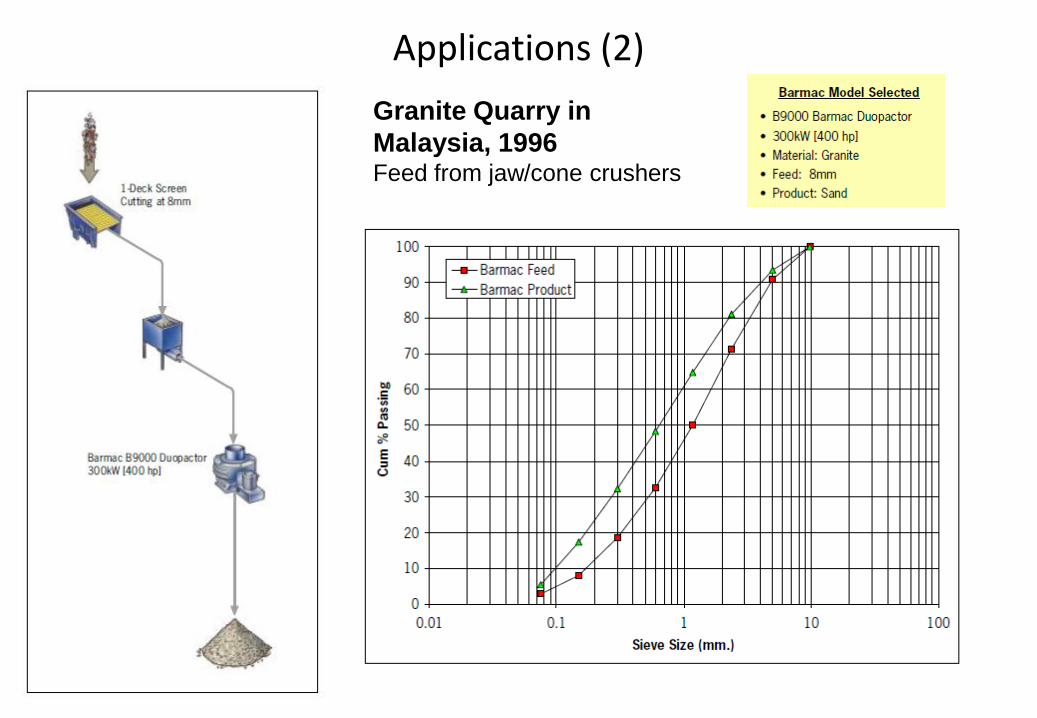
Applications (2)
Granite Quarry in
Malaysia, 1996 Feed from jaw/cone crushers
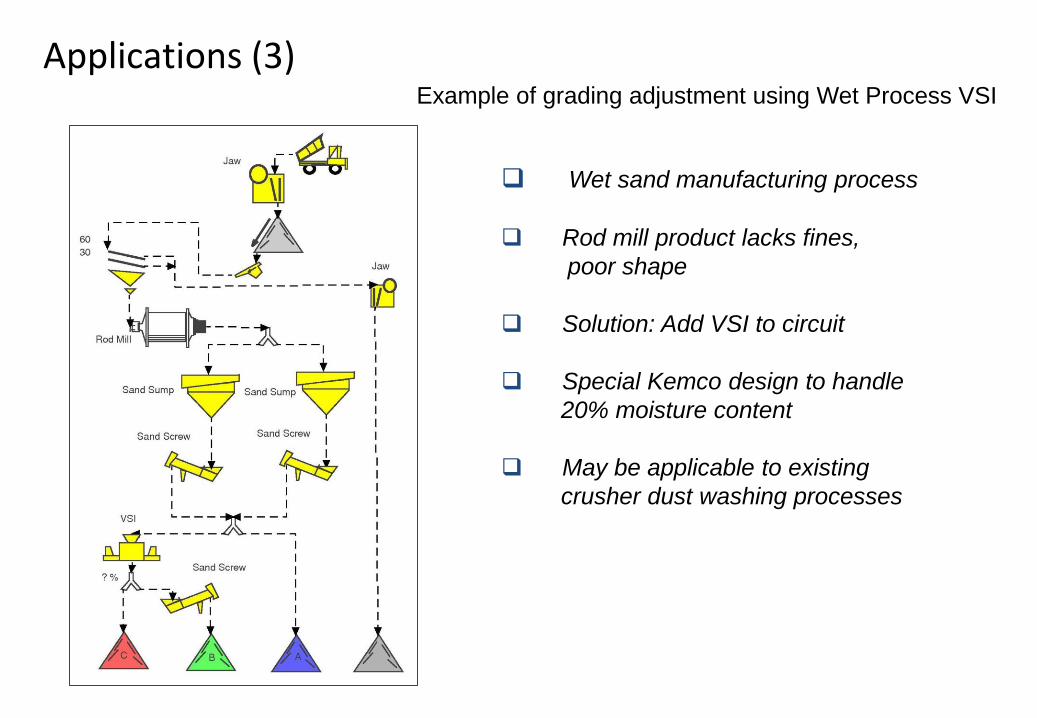
Example of grading adjustment using Wet Process VSI
Wet sand manufacturing process
Rod mill product lacks fines,
poor shape
Solution: Add VSI to circuit
Special Kemco design to handle
20% moisture content
May be applicable to existing
crusher dust washing processes
Applications (3)
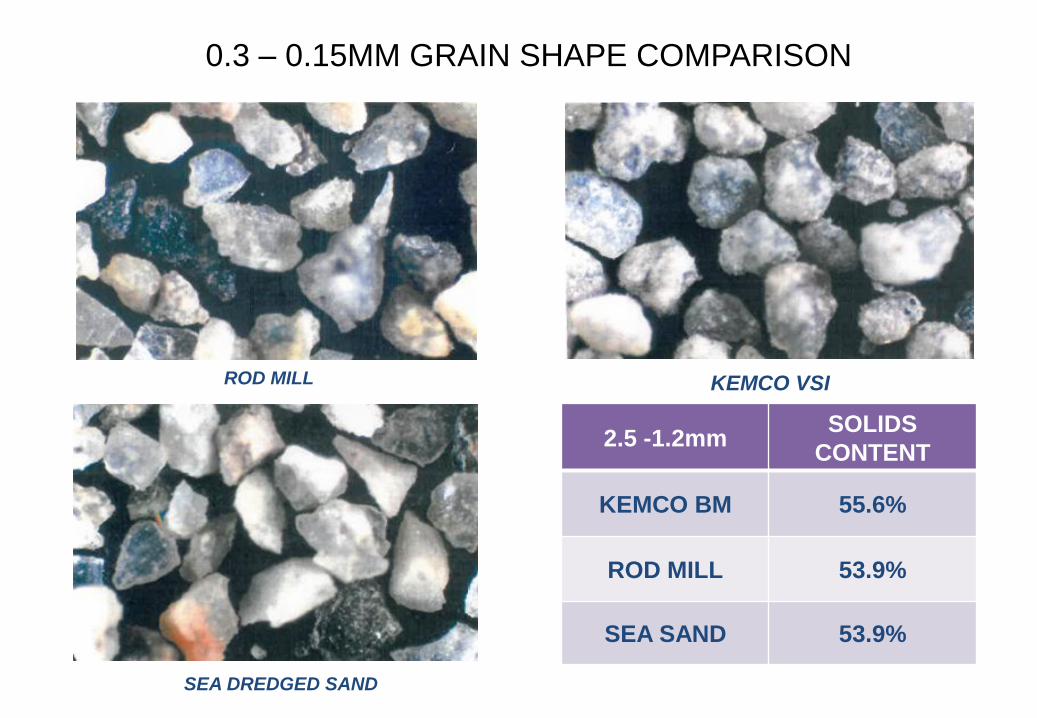
0.3 – 0.15MM GRAIN SHAPE COMPARISON
KEMCO VSI ROD MILL
SEA DREDGED SAND
2.5 -1.2mm SOLIDS
CONTENT
KEMCO BM 55.6%
ROD MILL 53.9%
SEA SAND 53.9%
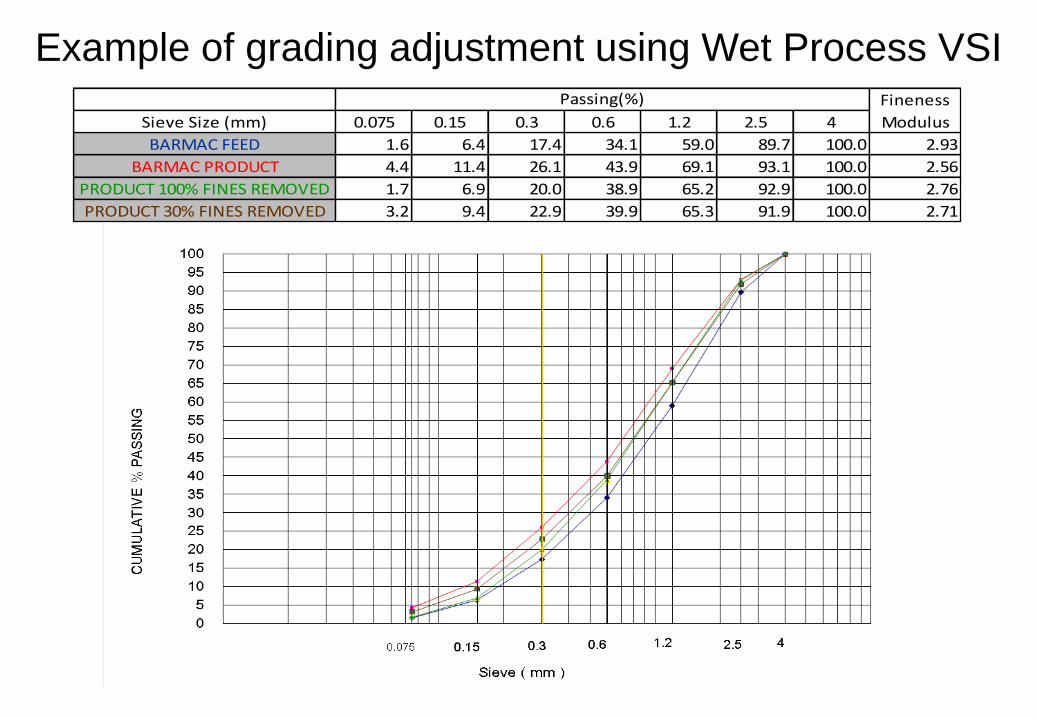
Example of grading adjustment using Wet Process VSI
Sieve Size (mm) 0.075 0.15 0.3 0.6 1.2 2.5 4
BARMAC FEED 1.6 6.4 17.4 34.1 59.0 89.7 100.0 2.93
BARMAC PRODUCT 4.4 11.4 26.1 43.9 69.1 93.1 100.0 2.56
PRODUCT 100% FINES REMOVED 1.7 6.9 20.0 38.9 65.2 92.9 100.0 2.76
PRODUCT 30% FINES REMOVED 3.2 9.4 22.9 39.9 65.3 91.9 100.0 2.71
Passing(%) Fineness
Modulus

Applications (4)
0
10
20
30
40
50
60
70
80
90
100
0.01 0.1 1 10 100
Cum
% P
assin
g
Sieve Size (mm.)
VSI Feed
VSI Prod
Screen prod.
To make an all-in aggregate for specialised concrete:
Very high speed and specialised rotor to generate large amount of microfines
Replace fly ash

Sand manufacturing equipment – beyond the VSI
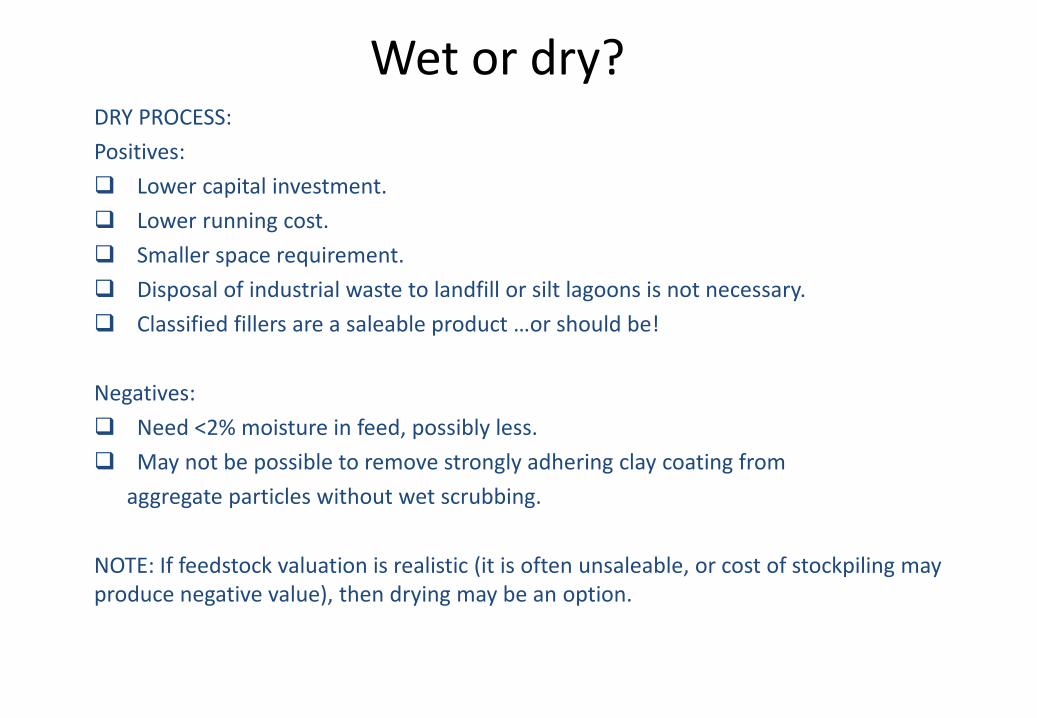
Wet or dry? DRY PROCESS:
Positives:
Lower capital investment.
Lower running cost.
Smaller space requirement.
Disposal of industrial waste to landfill or silt lagoons is not necessary.
Classified fillers are a saleable product …or should be!
Negatives:
Need <2% moisture in feed, possibly less.
May not be possible to remove strongly adhering clay coating from
aggregate particles without wet scrubbing.
NOTE: If feedstock valuation is realistic (it is often unsaleable, or cost of stockpiling may produce negative value), then drying may be an option.
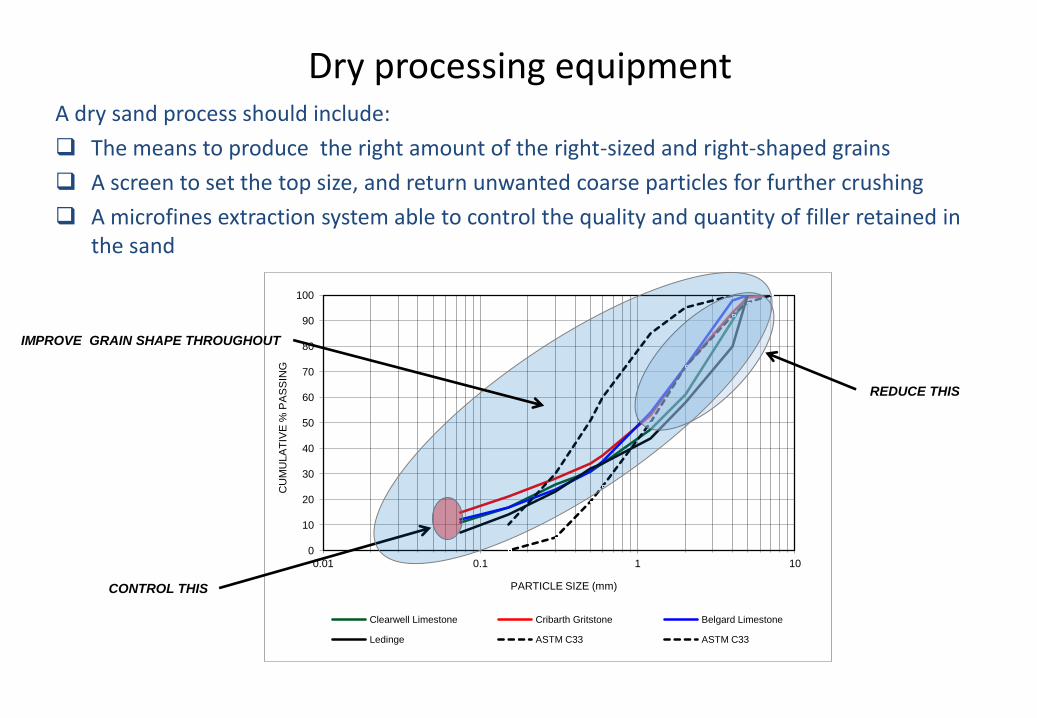
A dry sand process should include:
The means to produce the right amount of the right-sized and right-shaped grains
A screen to set the top size, and return unwanted coarse particles for further crushing
A microfines extraction system able to control the quality and quantity of filler retained in the sand
Dry processing equipment
0
10
20
30
40
50
60
70
80
90
100
0.01 0.1 1 10
CU
MU
LA
TIV
E %
PA
SS
ING
PARTICLE SIZE (mm)
Clearwell Limestone Cribarth Gritstone Belgard Limestone
Ledinge ASTM C33 ASTM C33
REDUCE THIS
CONTROL THIS
IMPROVE GRAIN SHAPE THROUGHOUT

THE DEVELOPMENT OF THE KEMCO V7 DRY SAND MAKING SYSTEM
Dry process
Control of:
• Particle size distribution
• Top size
• Microfines
Improved particle shape
Consistent product
Product adjustable to meet specification
Small footprint
Minimal environmental impact
OBJECTIVE:
TO DESIGN A FULLY INTEGRATED SYSTEM FOR DRY PROCESSING OF
CRUSHER DUST OR GRIT TO MAKE SPECIFICATION SAND.
An integrated dry process

Basic layout
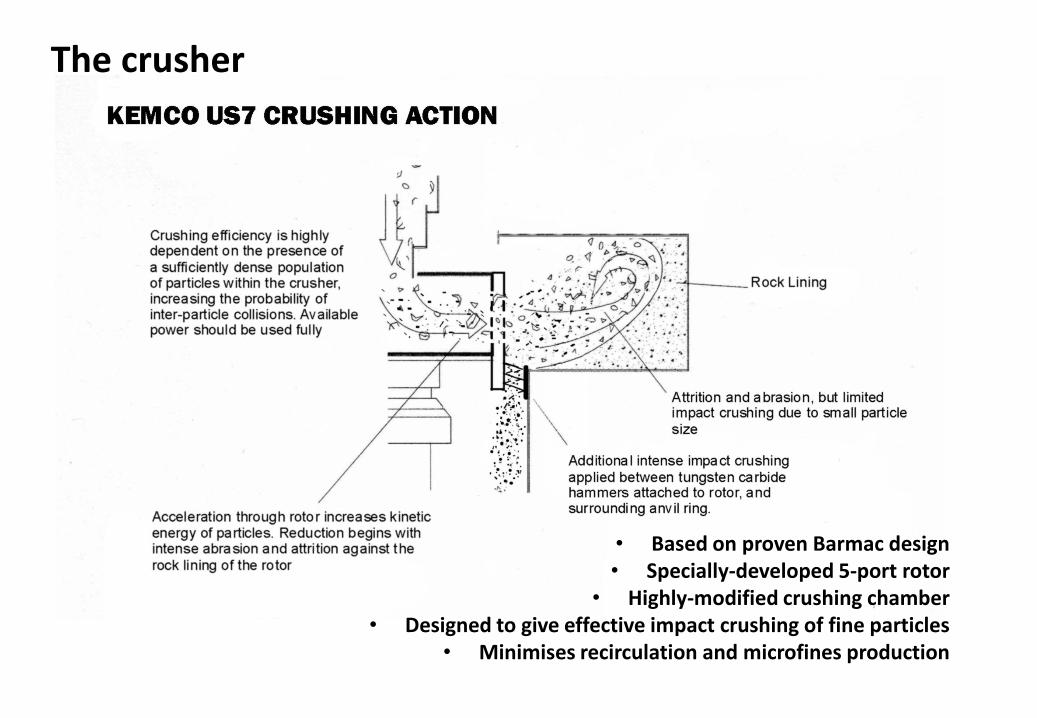
• Based on proven Barmac design • Specially-developed 5-port rotor
• Highly-modified crushing chamber • Designed to give effective impact crushing of fine particles
• Minimises recirculation and microfines production
The crusher

0
10
20
30
40
50
60
70
80
90
100
0.01 0.1 1 10 100
CU
MU
LA
TIV
E %
PA
SS
ING
PARTICLE SIZE (mm)
FEED Barmac US6
ASTM C33 ASTM C33
Advantages
Improved reduction without extra microfines
More abundant 500-1000µm
Improved particle shape
BM 55m/s BM 65m/s US7 45m/s US7 55m/s
56.3% 56.8% 56.9% 57.7%

The air screen
Effective screening down to 1mm
Minimal pegging
Variable recirculation
Variable microfines extraction
Low maintenance

The circuit
Process is:
Dry
Consistent Automatic
Emission free
Low noise
Space efficient
OVERSIZE
PLUS % COARSE UNDERSIZE
NEW FEED
RECIRCULATION
FILLER TO
COLLECTOR
SAND PRODUCT
BLOWER
CRUSHER
AIRSCREEN
WATER 3%
SKIMMER
MIXER
CONTROL
PANEL

What can it do?
Take low value feed (max 5-16mm, 2% H₂O)
Produce sand of excellent particle shape to any reasonable specification
Product can entirely replace natural concrete sand
Make sand to other specifications
Low running cost
High added value

Particle shape
0.3-0.15mm
2.5-1.2mm
0.6-0.3mm
FEED BM 65m/s US7 55m/s

Running costs
Crusher SCREEN
2~5 5~10
45~55 40~55
70~80 100~175
10~20
Type of rock SiO₂ (%)Cost per product tonne (€/100)
Limestone
Diabase, Basalt
Strong Granite
Power cost
Wear cost
Approximately 8-10kWh/tonne
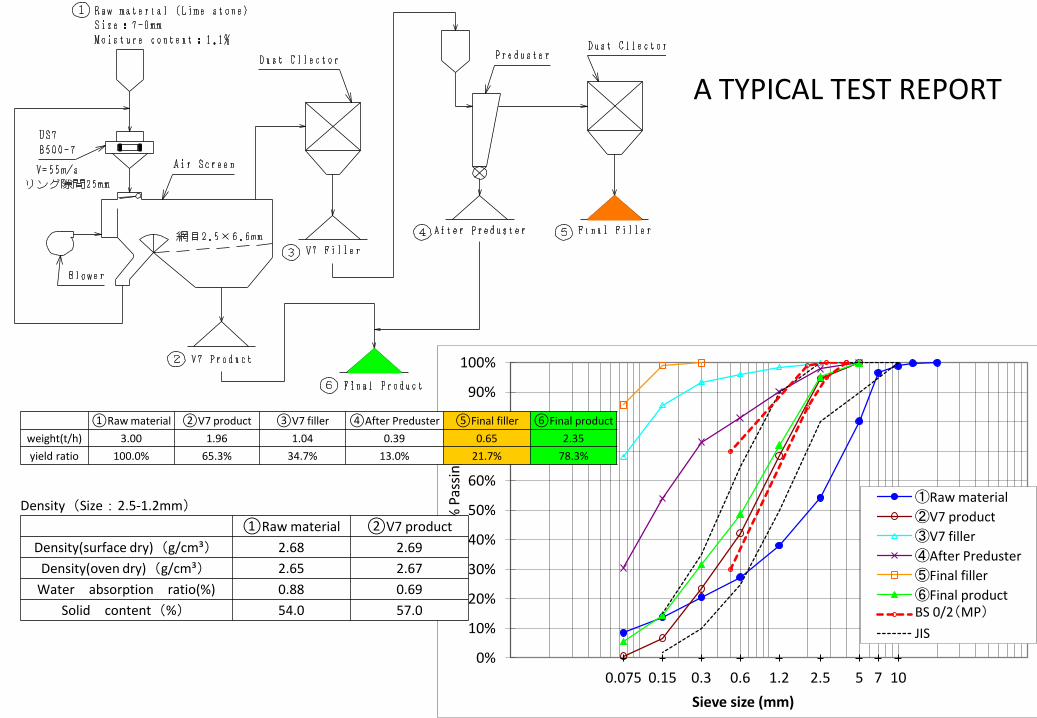
A TYPICAL TEST REPORT
10 7 5 2.5 1.2 0.6 0.3 0.15 0.075 0%
10%
20%
30%
40%
50%
60%
70%
80%
90%
100%
% P
assi
ng
Sieve size (mm)
①Raw material
②V7 product
③V7 filler
④After Preduster
⑤Final filler
⑥Final product BS 0/2(MP)
JIS
①Raw material ②V7 product ③V7 filler ④After Preduster ⑤Final filler ⑥Final product
weight(t/h) 3.00 1.96 1.04 0.39 0.65 2.35
yield ratio 100.0% 65.3% 34.7% 13.0% 21.7% 78.3%
Density(Size:2.5-1.2mm)
①Raw material ②V7 product
Density(surface dry)(g/cm³) 2.68 2.69
Density(oven dry)(g/cm³) 2.65 2.67
Water absorption ratio(%) 0.88 0.69
Solid content(%) 54.0 57.0
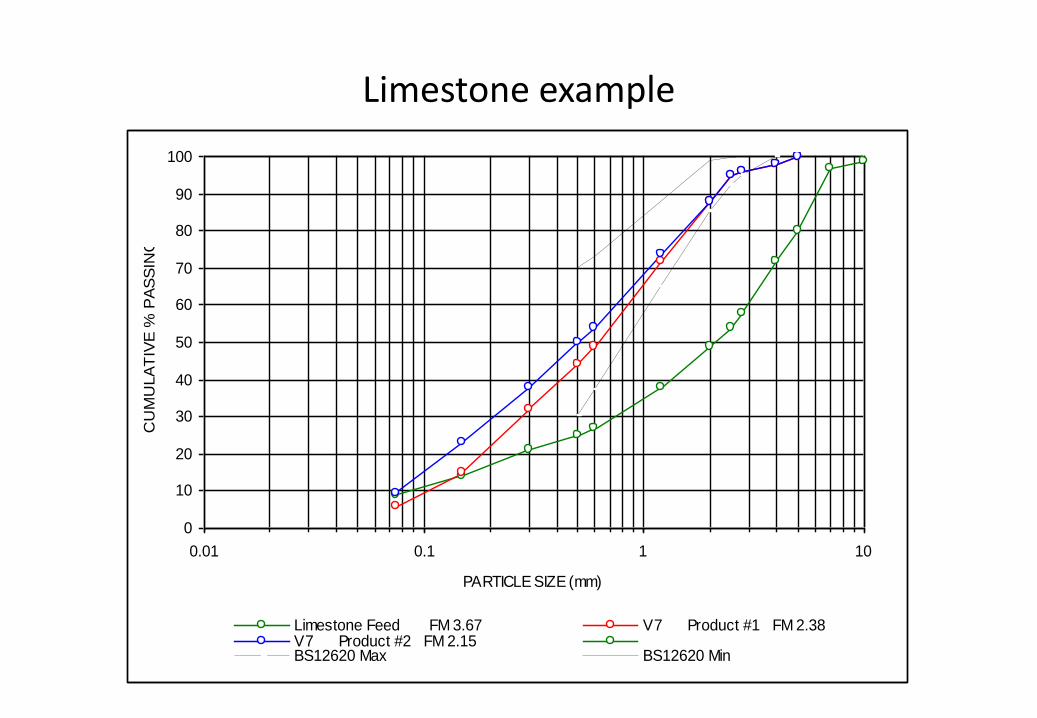
Limestone example
0
10
20
30
40
50
60
70
80
90
100
0.01 0.1 1 10
PARTICLE SIZE (mm)
CU
MU
LA
TIV
E %
PA
SS
ING
Limestone Feed FM 3.67 V7 Product #1 FM 2.38V7 Product #2 FM 2.15BS12620 Max BS12620 Min

Granite Example
0
10
20
30
40
50
60
70
80
90
100
0.01 0.1 1 10
PARTICLE SIZE (mm)
CU
MU
LA
TIV
E %
PA
SS
ING
GRANITE FEED FM 4.58 V7 Product #1 FM 2.45V7 Product #2 FM 2.67 V7 Product #3 FM 2.40BS12620 Max BS12620 Min

Concrete tests - limestone example
Results : - Strengths (N/mm²) Cement
Content
kg/m3
Strength N/mm² @ 28 days
Control Product
A
Product
B
Product
C
250 32.0 32.0 33.5 34.0
350 56.0 57.5 54.5 55.5
450 64.5 66.0 65.5 66.0
Results : - Fresh Wet Properties
Scope
The following trials were carried out to evaluate the performance of three samples of UK Quarry X dust produced
by Kemco, in comparison to natural Trent Valley Sand as currently used within the Midlands Area.
The samples are identified as A, B and C with proportionately higher fines contents from A - C.
Sample A produced concrete coarser in nature and appeared prone to segregation, whilst sample C resulted in
higher water demands and appeared sticky. Sample B produced the better looking concrete and resulted in water
demands almost identical to natural Trent Valley Sand. Likewise strengths were comparable.
Total Free water l/m³
Total Free W/C Ratio Plastic Density
Kg/m³
Cement content kg/m³
Control Prod
A
Prod
B
Prod
C Control
Prod
A
Prod
B
Prod
C Control
Prod
A
Prod
B
Prod
C
250 176 176 171 181 0.704 0.704 0.684 0.724 2389 2349 2402 2402
350 174 174 176 182 0.497 0.497 0.503 0.520 2412 2414 2402 2408
450 182 186 182 193 0.404 0.413 0.404 0.429 2420 2438 2424 2399

V7 dry sand making plant

Other sand manufacturing equipment – Screening and classification

Metso - Buell
Designed for cut points from 300 to 63µm
Designed for cut points from 10 to 63µm.
Will complement AC27 and AC30 for making
speciality products and decrease filler top size

Kemco air screen range
Maximum of four decks - wide screening size range from coarse aggregates down to micro-fines.
High efficiency screening - 2.5 to 3 times better screening efficiency compared with conventional vibrating screen.
Wash effect by air - dust adhering to the surface of particles is blown away by air draught.
Compact size – required screen area is just 1/3 of that of a conventional screen.
Environmentally friendly - dust encapsulated.
Easy maintenance.
Less pegging of fine screen mesh.

Applications
MODEL AS RCAS
DECKS 1+ RELIEVING DECK 4
SIZE 1200/1600/2500 1200/1900/2500
APPLICATIONS SAND-MAKING (V7) RECYCLING AND AGGREGATES
CAPACITY Up to 250t/h depending on application
MAX. FEED SIZE 20mm 40mm

What can it do?
Replace conventional screen after a third or fourth stage crusher
Remove microfines and scrub adhering fines from aggregate (e.G. Dry scalpings)
Allow recirculation of both oversize coarse aggregate and coarse grit sizes for further reduction
Improve sand grading from standard vsi to some degree by selective recirculation
Reduce dust emissions
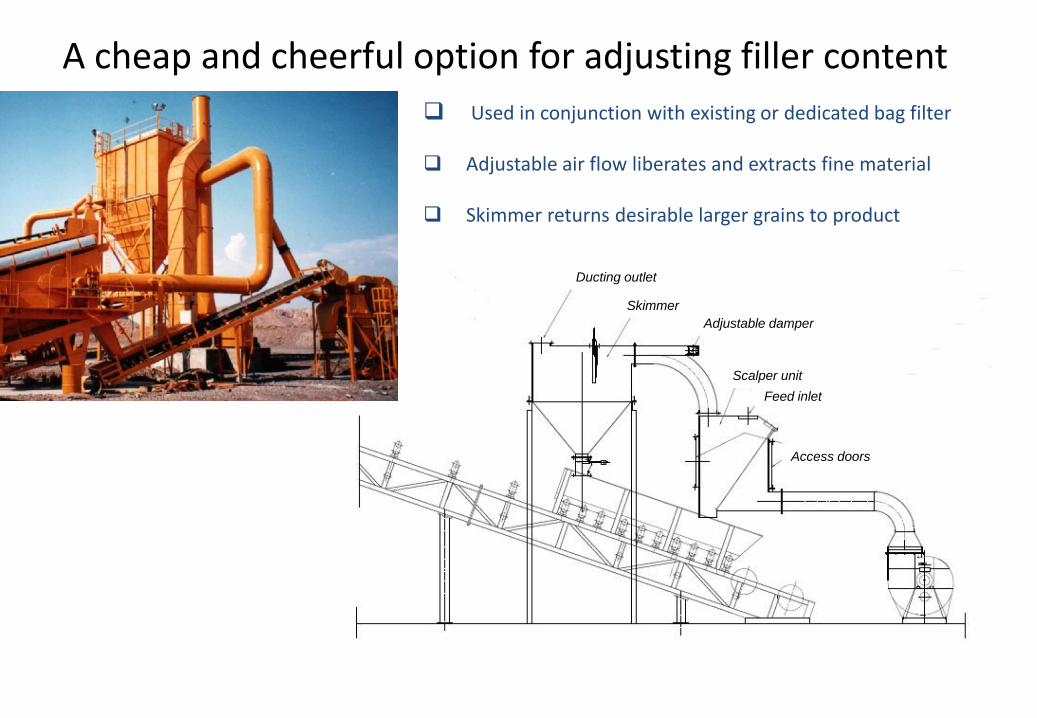
A cheap and cheerful option for adjusting filler content
Ducting outlet
Skimmer
Access doors
Adjustable damper
Scalper unit
Feed inlet
Used in conjunction with existing or dedicated bag filter
Adjustable air flow liberates and extracts fine material
Skimmer returns desirable larger grains to product
Acknowledgements and references
¹ AGGREGATE SHAPE AFFECTS CONCRETE COST - B P Hudson, Quarry Magazine, November 1998 2 IMPACT OF MANUFACTURED SAND IN CONCRETE - B P Hudson, Quarry Magazine, December 1998 3 MINERAL FINES, TODAY’S OPPORTUNITY, TOMORROW’S SUCCESS - R.H. Brown, Vulcan Materials Company. - Paper presented at Center for Aggregate Research March 2-4, 1995. 4 MANUFACTURED SAND - NATIONAL TEST METHODS AND SPECIFICATION VALUES - Cement Concrete & Aggregates Australia Research Report January 2007 5 ICAR Report 102-1F, AN EXPERIMENTAL STUDY ON THE GUIDELINES FOR USING HIGHER CONTENTS OF AGGREGATE MICROFINES IN PORTLAND CEMENT - Namshik Ahn & David W. Fowler, International Centre for
Aggregate Research, The University of Texas, Austin, Texas Dec.2001 6 RESEARCH INTO THE OPTIMUM LEVEL OF ROCK-DERIVED MICRO-FINE PARTICLES IN SAND FOR CONCRETE - T.Kaya, Kotobuki Eng. and Mfg. Co, Ltd., Kure, Hiroshima, Japan; Y.Nagahara, Kotobuki Eng. and Mfg. Co, Ltd., Kure, Hiroshima, Japan; H.Yamamoto, Graduate School for International Development and Cooperation, Hiroshima University, Hiroshima Japan – November 2008
I have used material from Metso (previously Svedala), Sandvik, Oresizer, Remco, Kemco
and some others’ publications in the public domain. Individuals’ work as follows:
SenX Limited,
Quarry Process Consultants,
3 Welmar Mews,
London SW4 7DD


