
Table of
Contents
Key Statistics for September
Sales 2016 Residential Sales Stats Year-to-Year Total Sales by Map Area Median 2016 Median Sales Stats Year-to-Year Median Sales by Map Area Listings 2016 Active Listings by Map Area 2016 Total Active Listings vs. Total Sales Year-to-Year Active Listings by Map Area Inventory 2016 Months of Inventory by Map Area Year-to-Year Months of Inventory
Summary
About Hady Chahine Contact Information

Key Statistics for September
Back to Table of Contents
= trending positive = trending positive
= trending negative = trending negative
Month-to-Month Comparison Aug 2016 Sep 2016 Delta (qty) Delta (%) Increase Decrease
Total Sales 134 108 -26 -19.4%
Median Sales Price 725,000 733,500 8,500 1.2%
Median Days to Sell 34 31 -3 -8.8%
Listings 165 169 4 2.4%
Sales/Listing Ratio 81.2% 63.9% -17.3% -21.3%
Months of Inventory 1.0 2.0 1.0 100.0%
Monthly Comparison Year-to-Year Sep 2015 Sep 2016 Delta Delta Increase Decrease
Total Sales 98 108 10 10.2%
Median Sales Price 672,500 733,500 61,000 9.1%
Median Days to Sell 32 31 -1 -3.1%
Listings 256 169 -87 -34.0%
Months of Inventory 3.0 2.0 -1 -33.3%

Back to Table of Contents
Total Sales Month-to-Month by Map Area Jul Aug Sep
Central Torrance 15 15 12
South East Torrance - West 12 11 13
Hollywood Riviera 11 14 15
South Torrance 7 16 8
Southwood 5 6 7
West Torrance 9 16 8
N Torrance - West 15 17 17
N Torrance - East 7 13 3
Old Torrance 17 15 16
South East Torrance - East 5 11 9
Total Sales 103 134 108
-
20
40
60
80
100
120
140
Jul Aug Sep
2016 Total Sales Month-to-Month by Map Area
Central Torrance
South East Torrance - West
Hollywood Riviera
South Torrance
Southwood
West Torrance
N Torrance - West
N Torrance - East
Old Torrance
South East Torrance - East
Total Sales
Back to Table of Contents
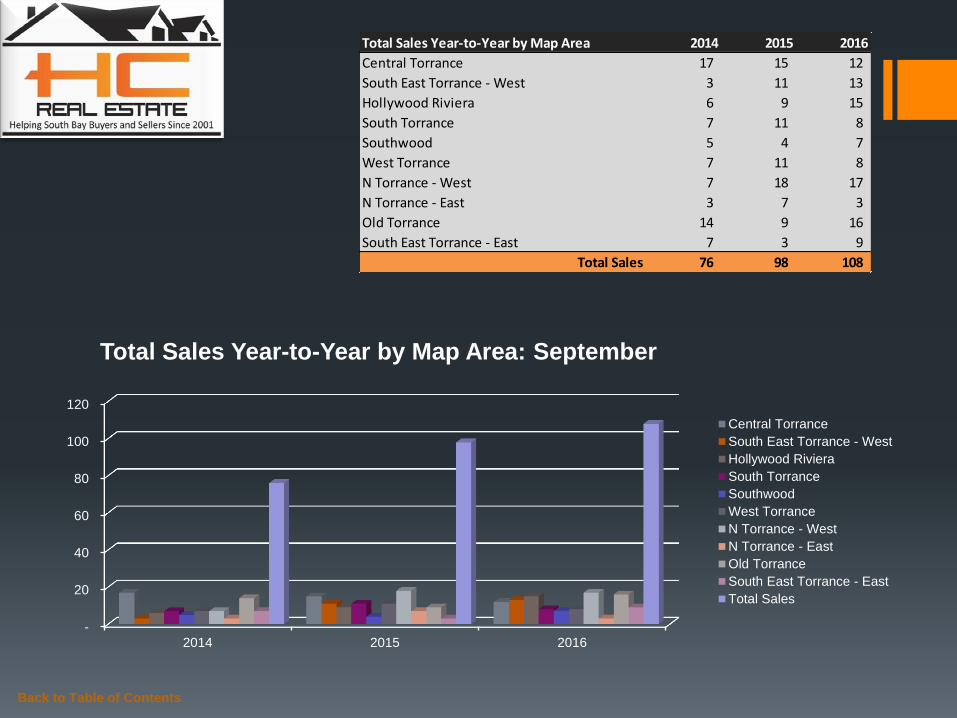
Total Sales Year-to-Year by Map Area 2014 2015 2016
Central Torrance 17 15 12
South East Torrance - West 3 11 13
Hollywood Riviera 6 9 15
South Torrance 7 11 8
Southwood 5 4 7
West Torrance 7 11 8
N Torrance - West 7 18 17
N Torrance - East 3 7 3
Old Torrance 14 9 16
South East Torrance - East 7 3 9
Total Sales 76 98 108
-
20
40
60
80
100
120
2014 2015 2016
Total Sales Year-to-Year by Map Area: September
Central Torrance
South East Torrance - West
Hollywood Riviera
South Torrance
Southwood
West Torrance
N Torrance - West
N Torrance - East
Old Torrance
South East Torrance - East
Total Sales
Back to Table of Contents
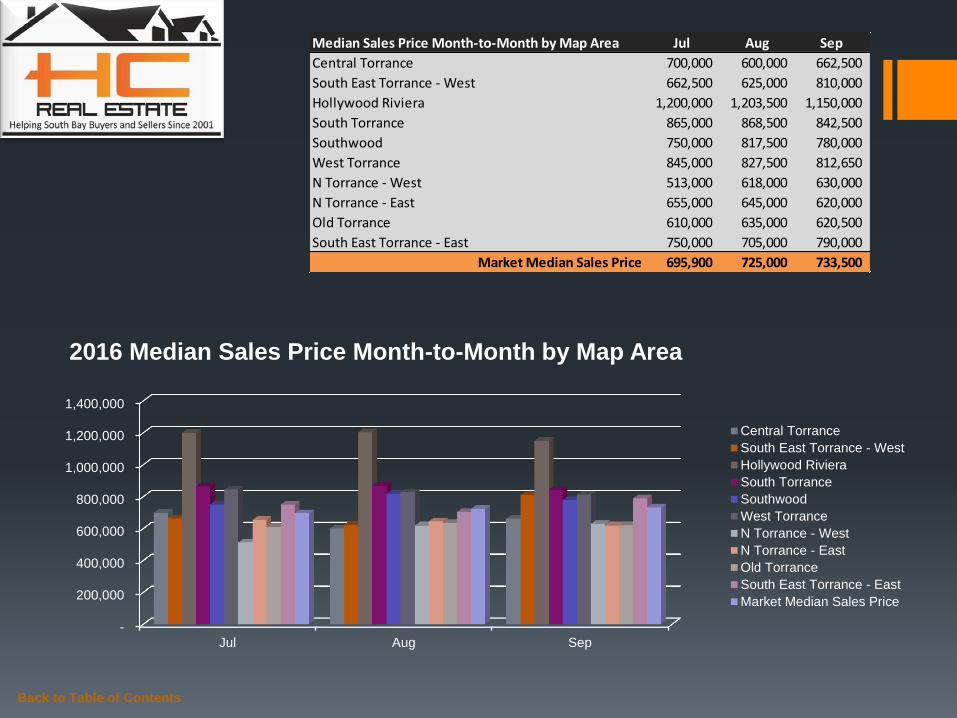
Median Sales Price Month-to-Month by Map Area Jul Aug Sep
Central Torrance 700,000 600,000 662,500
South East Torrance - West 662,500 625,000 810,000
Hollywood Riviera 1,200,000 1,203,500 1,150,000
South Torrance 865,000 868,500 842,500
Southwood 750,000 817,500 780,000
West Torrance 845,000 827,500 812,650
N Torrance - West 513,000 618,000 630,000
N Torrance - East 655,000 645,000 620,000
Old Torrance 610,000 635,000 620,500
South East Torrance - East 750,000 705,000 790,000
Market Median Sales Price 695,900 725,000 733,500
-
200,000
400,000
600,000
800,000
1,000,000
1,200,000
1,400,000
Jul Aug Sep
2016 Median Sales Price Month-to-Month by Map Area
Central Torrance
South East Torrance - West
Hollywood Riviera
South Torrance
Southwood
West Torrance
N Torrance - West
N Torrance - East
Old Torrance
South East Torrance - East
Market Median Sales Price

Back to Table of Contents
Median Sales Price Year-to-Year by Map Area 2014 2015 2016
Central Torrance 525,000 555,000 662,500
South East Torrance - West 379,000 770,000 810,000
Hollywood Riviera 1,120,500 1,095,000 1,150,000
South Torrance 825,000 865,000 842,500
Southwood 750,000 805,000 780,000
West Torrance 819,000 741,000 812,650
N Torrance - West 544,000 595,000 630,000
N Torrance - East 550,000 593,000 620,000
Old Torrance 565,000 569,500 620,500
South East Torrance - East 569,000 715,000 790,000
Market Median Sales Price 625,500 672,500 733,500
-
200,000
400,000
600,000
800,000
1,000,000
1,200,000
2014 2015 2016
Median Sales Price Year-to-Year by Map Area: September
Central Torrance
South East Torrance - West
Hollywood Riviera
South Torrance
Southwood
West Torrance
N Torrance - West
N Torrance - East
Old Torrance
South East Torrance - East
Market Median Sales Price
Back to Table of Contents
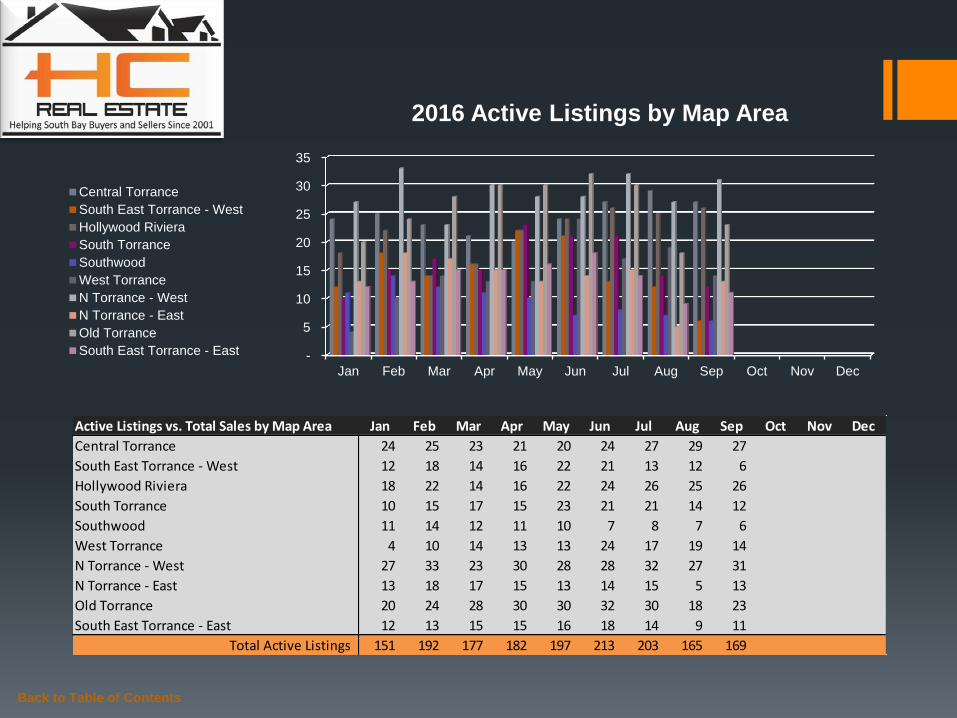
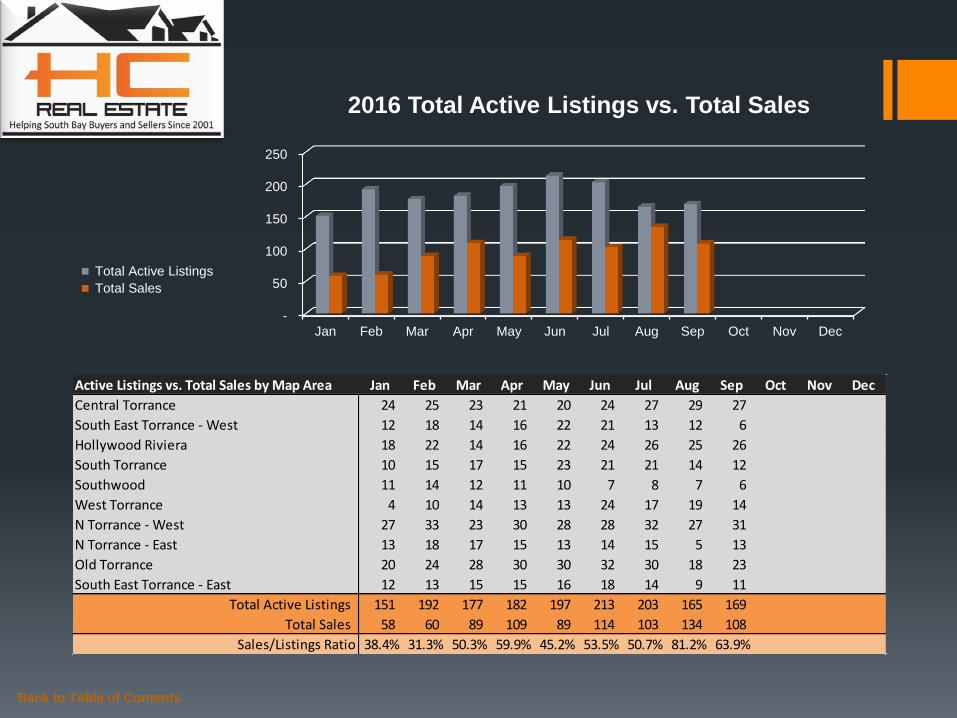
Active Listings vs. Total Sales by Map Area Jan Feb Mar Apr May Jun Jul Aug Sep Oct Nov Dec
Central Torrance 24 25 23 21 20 24 27 29 27
South East Torrance - West 12 18 14 16 22 21 13 12 6
Hollywood Riviera 18 22 14 16 22 24 26 25 26
South Torrance 10 15 17 15 23 21 21 14 12
Southwood 11 14 12 11 10 7 8 7 6
West Torrance 4 10 14 13 13 24 17 19 14
N Torrance - West 27 33 23 30 28 28 32 27 31
N Torrance - East 13 18 17 15 13 14 15 5 13
Old Torrance 20 24 28 30 30 32 30 18 23
South East Torrance - East 12 13 15 15 16 18 14 9 11
Total Active Listings 151 192 177 182 197 213 203 165 169
-
5
10
15
20
25
30
35
Jan Feb Mar Apr May Jun Jul Aug Sep Oct Nov Dec
2016 Active Listings by Map Area
Central Torrance
South East Torrance - West
Hollywood Riviera
South Torrance
Southwood
West Torrance
N Torrance - West
N Torrance - East
Old Torrance
South East Torrance - East
Back to Table of Contents
Active Listings vs. Total Sales by Map Area Jan Feb Mar Apr May Jun Jul Aug Sep Oct Nov Dec
Central Torrance 24 25 23 21 20 24 27 29 27
South East Torrance - West 12 18 14 16 22 21 13 12 6
Hollywood Riviera 18 22 14 16 22 24 26 25 26
South Torrance 10 15 17 15 23 21 21 14 12
Southwood 11 14 12 11 10 7 8 7 6
West Torrance 4 10 14 13 13 24 17 19 14
N Torrance - West 27 33 23 30 28 28 32 27 31
N Torrance - East 13 18 17 15 13 14 15 5 13
Old Torrance 20 24 28 30 30 32 30 18 23
South East Torrance - East 12 13 15 15 16 18 14 9 11
Total Active Listings 151 192 177 182 197 213 203 165 169
Total Sales 58 60 89 109 89 114 103 134 108
Sales/Listings Ratio 38.4% 31.3% 50.3% 59.9% 45.2% 53.5% 50.7% 81.2% 63.9%
-
50
100
150
200
250
Jan Feb Mar Apr May Jun Jul Aug Sep Oct Nov Dec
2016 Total Active Listings vs. Total Sales
Total Active Listings
Total Sales

Back to Table of Contents
Active Listings Year-to-Year by Map Area 2014 2015 2016
Central Torrance 39 40 27
South East Torrance - West 19 19 6
Hollywood Riviera 29 39 26
South Torrance 17 21 12
Southwood 2 7 6
West Torrance 20 21 14
N Torrance - West 38 45 31
N Torrance - East 16 14 13
Old Torrance 43 28 23
South East Torrance - East 25 22 11
Total Active Listings 248 256 169
-
50
100
150
200
250
300
2014 2015 2016
Active Listings Year-to-Year by Map Area: September
Central Torrance
South East Torrance - West
Hollywood Riviera
South Torrance
Southwood
West Torrance
N Torrance - West
N Torrance - East
Old Torrance
South East Torrance - East
Total Active Listings

Back to Table of Contents
Months of Inventory by Map Area Jan Feb Mar Apr May Jun Jul Aug Sep Oct Nov Dec
Central Torrance 4.0 2.0 1.0 2.0 2.0 1.0 2.0 2.0 2.0
South East Torrance - West 4.0 9.0 7.0 2.0 4.0 4.0 1.0 1.0 -
Hollywood Riviera 5.0 3.0 2.0 2.0 2.0 2.0 2.0 2.0 2.0
South Torrance 1.0 4.0 2.0 1.0 2.0 2.0 3.0 1.0 2.0
Southwood 2.0 5.0 1.0 1.0 1.0 1.0 2.0 1.0 1.0
West Torrance - 3.0 5.0 1.0 3.0 2.0 2.0 1.0 2.0
N Torrance - West 3.0 4.0 2.0 2.0 4.0 2.0 2.0 2.0 2.0
N Torrance - East 3.0 2.0 4.0 2.0 1.0 2.0 2.0 - 4.0
Old Torrance 3.0 4.0 2.0 2.0 6.0 2.0 2.0 1.0 1.0
South East Torrance - East 3.0 3.0 2.0 3.0 2.0 2.0 3.0 1.0 1.0
-
1.0
2.0
3.0
4.0
5.0
6.0
7.0
8.0
9.0
Jan Feb Mar Apr May Jun Jul Aug Sep Oct Nov Dec
2016 Months of Inventory by Map Area
Central Torrance
South East Torrance - West
Hollywood Riviera
South Torrance
Southwood
West Torrance
N Torrance - West
N Torrance - East
Old Torrance
South East Torrance - East
Back to Table of Contents
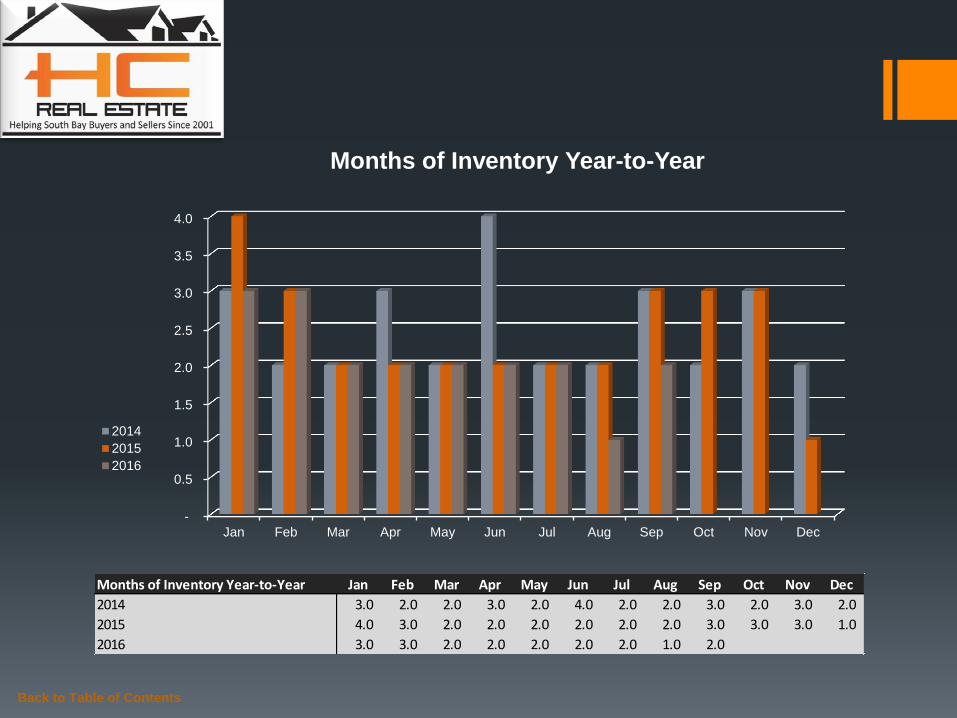
Months of Inventory Year-to-Year Jan Feb Mar Apr May Jun Jul Aug Sep Oct Nov Dec
2014 3.0 2.0 2.0 3.0 2.0 4.0 2.0 2.0 3.0 2.0 3.0 2.0
2015 4.0 3.0 2.0 2.0 2.0 2.0 2.0 2.0 3.0 3.0 3.0 1.0
2016 3.0 3.0 2.0 2.0 2.0 2.0 2.0 1.0 2.0
-
0.5
1.0
1.5
2.0
2.5
3.0
3.5
4.0
Jan Feb Mar Apr May Jun Jul Aug Sep Oct Nov Dec
Months of Inventory Year-to-Year
2014
2015
2016
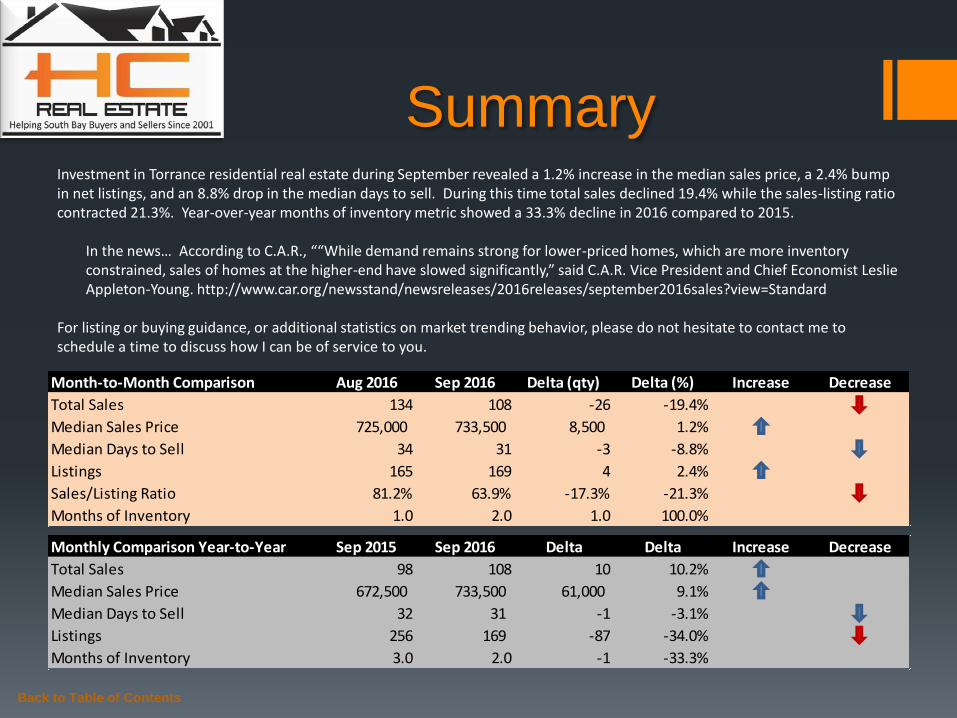
Summary Investment in Torrance residential real estate during September revealed a 1.2% increase in the median sales price, a 2.4% bump in net listings, and an 8.8% drop in the median days to sell. During this time total sales declined 19.4% while the sales-listing ratio contracted 21.3%. Year-over-year months of inventory metric showed a 33.3% decline in 2016 compared to 2015.
In the news… According to C.A.R., ““While demand remains strong for lower-priced homes, which are more inventory constrained, sales of homes at the higher-end have slowed significantly,” said C.A.R. Vice President and Chief Economist Leslie Appleton-Young. http://www.car.org/newsstand/newsreleases/2016releases/september2016sales?view=Standard
For listing or buying guidance, or additional statistics on market trending behavior, please do not hesitate to contact me to schedule a time to discuss how I can be of service to you.
Back to Table of Contents
Monthly Comparison Year-to-Year Sep 2015 Sep 2016 Delta Delta Increase Decrease
Total Sales 98 108 10 10.2%
Median Sales Price 672,500 733,500 61,000 9.1%
Median Days to Sell 32 31 -1 -3.1%
Listings 256 169 -87 -34.0%
Months of Inventory 3.0 2.0 -1 -33.3%
Month-to-Month Comparison Aug 2016 Sep 2016 Delta (qty) Delta (%) Increase Decrease
Total Sales 134 108 -26 -19.4%
Median Sales Price 725,000 733,500 8,500 1.2%
Median Days to Sell 34 31 -3 -8.8%
Listings 165 169 4 2.4%
Sales/Listing Ratio 81.2% 63.9% -17.3% -21.3%
Months of Inventory 1.0 2.0 1.0 100.0%

Back to Table of Contents
Serving South Bay Home Buyers and Sellers Since 2001
RE/MAX Top 4 Team in California – 2012
RE/MAX 100% Club - 2011
Shorewood Realtors Top 5% in Overall Sales 2001-2006, 2008-2010

The information being provided by CARETS (CLAW, CRISNet MLS, DAMLS, CRMLS, i-Tech MLS, and/or VCRDS) is for the visitor’s personal, non-commercial use and may not be used for
any purpose other than to identify prospective properties visitor may be interested in purchasing. Any information relating to a property referenced on this web site comes from the Internet
Data Exchange (IDX) program of CARETS. This web site may reference real estate listing(s) held by a brokerage firm other than the broker and/or agent who owns this web site. The accuracy
of all information, regardless of source, including but not limited to square footages and lot sizes, is deemed reliable but not guaranteed and should be personally verified through personal
inspection by and/or with the appropriate professionals.
Back to Table of Contents
Listings MLS BLOG Website
Hady Chahine
• 310-404-5361


