1
Single particle tracking: principles and applications
Valeria LeviLaboratorio de Dinámica IntracelularFacultad de Ciencias Exactas y NaturalesUniversidad de Buenos [email protected]
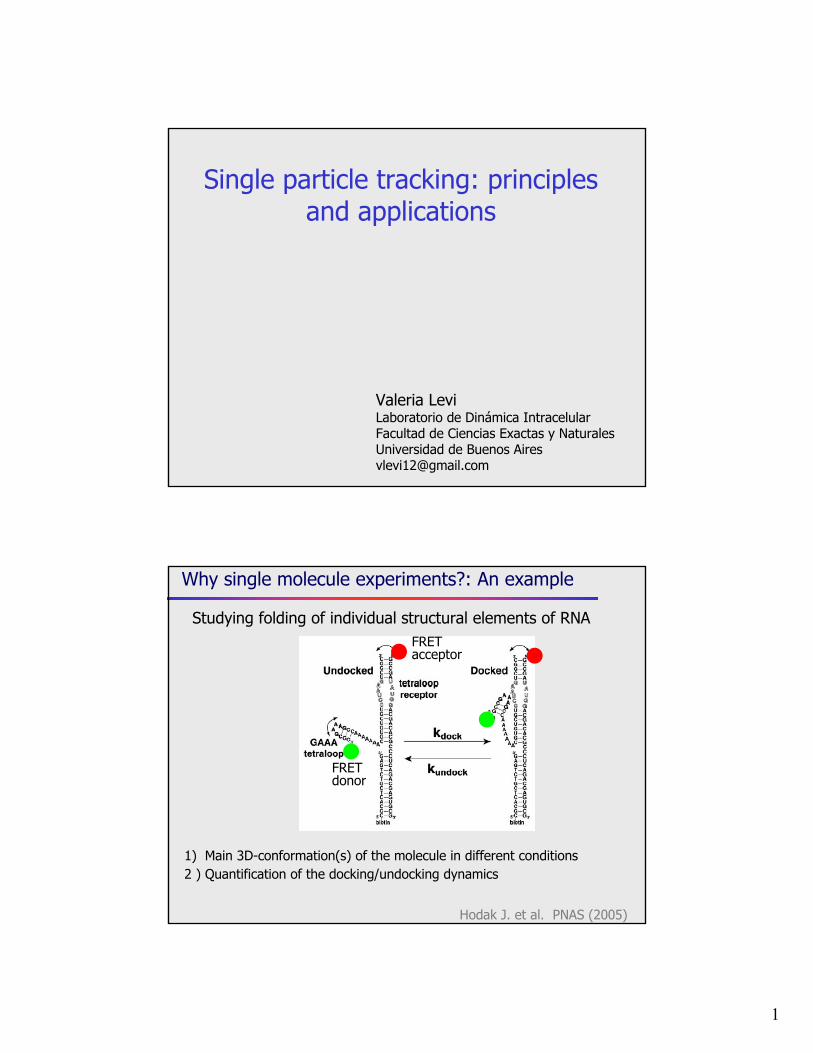
1) Main 3D-conformation(s) of the molecule in different conditions2 ) Quantification of the docking/undocking dynamics
Why single molecule experiments?: An example
Hodak J. et al. PNAS (2005)
Studying folding of individual structural elements of RNA
FRET donor
FRET acceptor
2
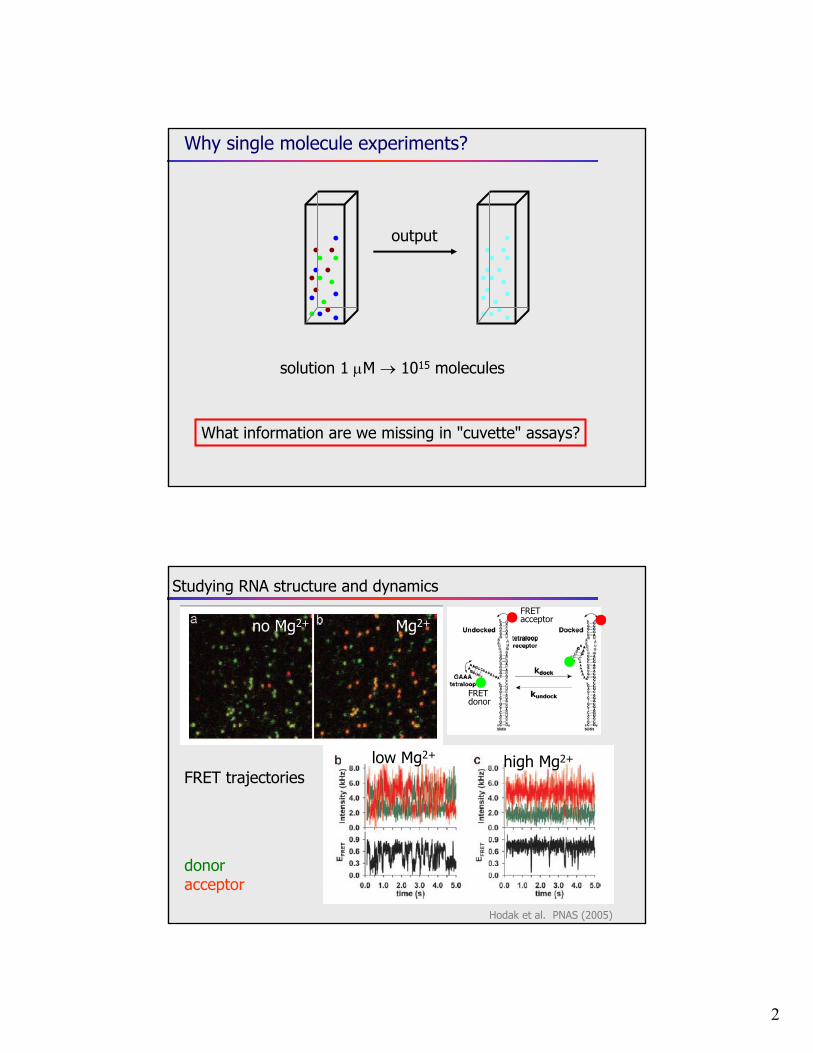
Why single molecule experiments?
What information are we missing in "cuvette" assays?
output
solution 1 M 1015 molecules
Hodak et al. PNAS (2005)
Mg2+
FRET trajectorieslow Mg2+ high Mg2+
donoracceptor
Studying RNA structure and dynamics
FRET donor
FRET acceptor
FRET donor
FRET acceptorno Mg2+

3
molecules are not synchronizedaverage properties
Bulk vs. single molecule measurements
Limitations of bulk measurements
Temporal evolution of each molecule/particleNo need to synchronize processes Detection of different populations
DisadvantagesMore expensive equipmentsStatistics!
Single molecule/particle assays
Dynamics of intracellular processes: Tracking
-0.02
0.00
0.02
G
0.00
0.01
0.02
0.03
G
0.01 0.1 1 10
-0.02
0.00
0.02
G
(s)
pixel
time
A
B + intensity -
1010 25 50 75 1001000.1
1
10
PS
D (
norm
aliz
ed)
frequency (Hz)
pixel
time
A
B + intensity -
1010 25 50 75 1001000.1
1
10
PS
D (
norm
aliz
ed)
frequency (Hz)
0.5 1.0 1.5 2.0 2.50
5
10
15
freq
uenc
y (%
)
B
0.5 1.0 1.5 2.0 2.50
5
10
15
freq
uenc
y (%
)
B
Protein function in the cellular context
4
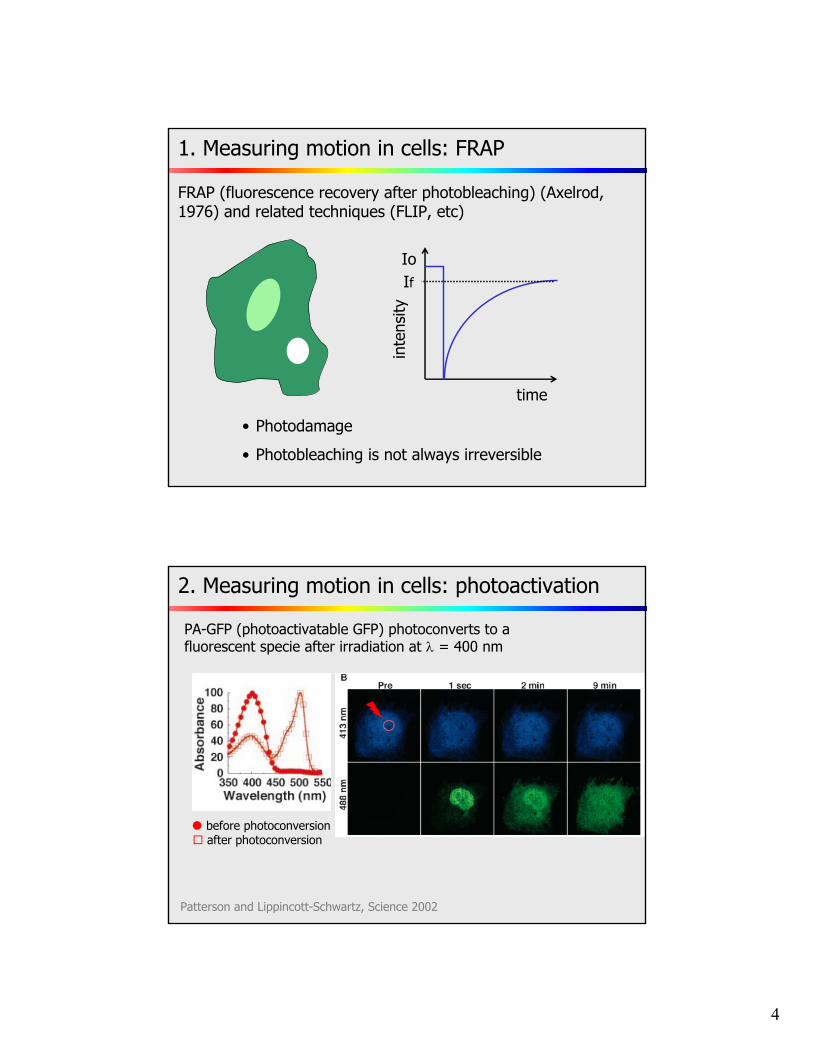
1. Measuring motion in cells: FRAP
FRAP (fluorescence recovery after photobleaching) (Axelrod, 1976) and related techniques (FLIP, etc)
• Photodamage
• Photobleaching is not always irreversible
timein
tens
ity
IoIf
2. Measuring motion in cells: photoactivation
Patterson and Lippincott-Schwartz, Science 2002
PA-GFP (photoactivatable GFP) photoconverts to a fluorescent specie after irradiation at = 400 nm
before photoconversion after photoconversion
5
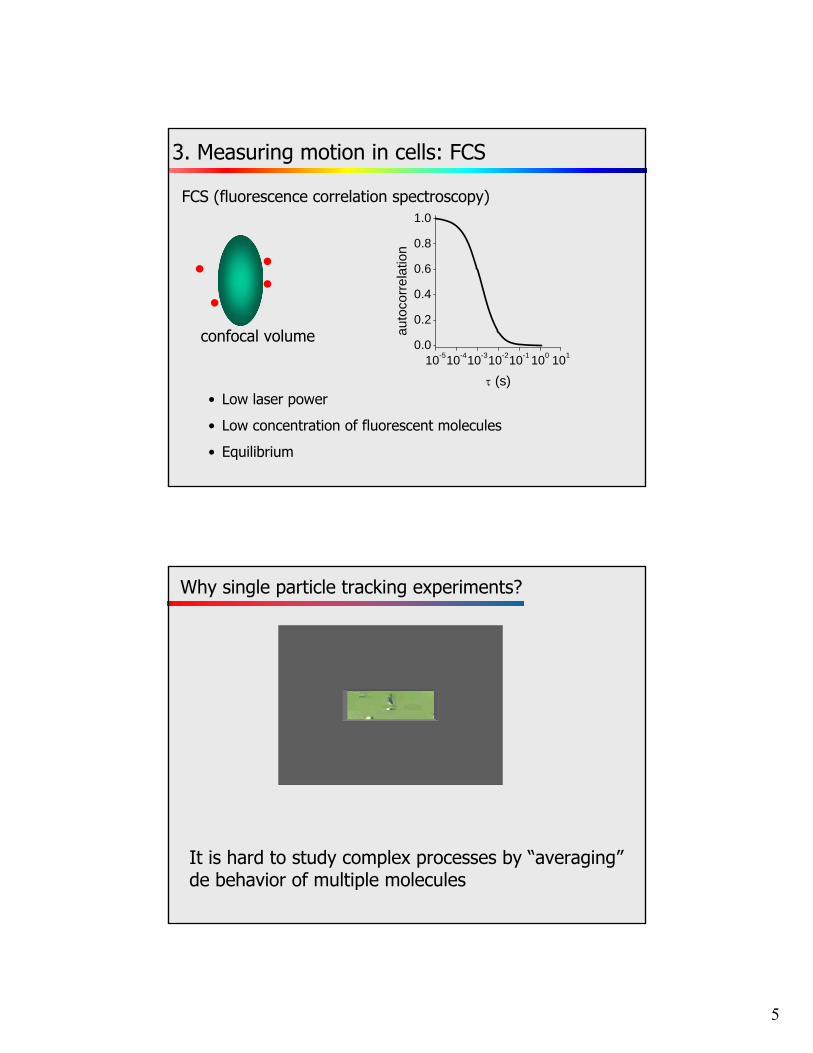
FCS (fluorescence correlation spectroscopy)
3. Measuring motion in cells: FCS
• Low laser power
• Low concentration of fluorescent molecules
• Equilibrium
confocal volume10-510-410-310-210-1 100 101
0.0
0.2
0.4
0.6
0.8
1.0
auto
corr
ela
tion
(s)
It is hard to study complex processes by “averaging”de behavior of multiple molecules
Why single particle tracking experiments?
6
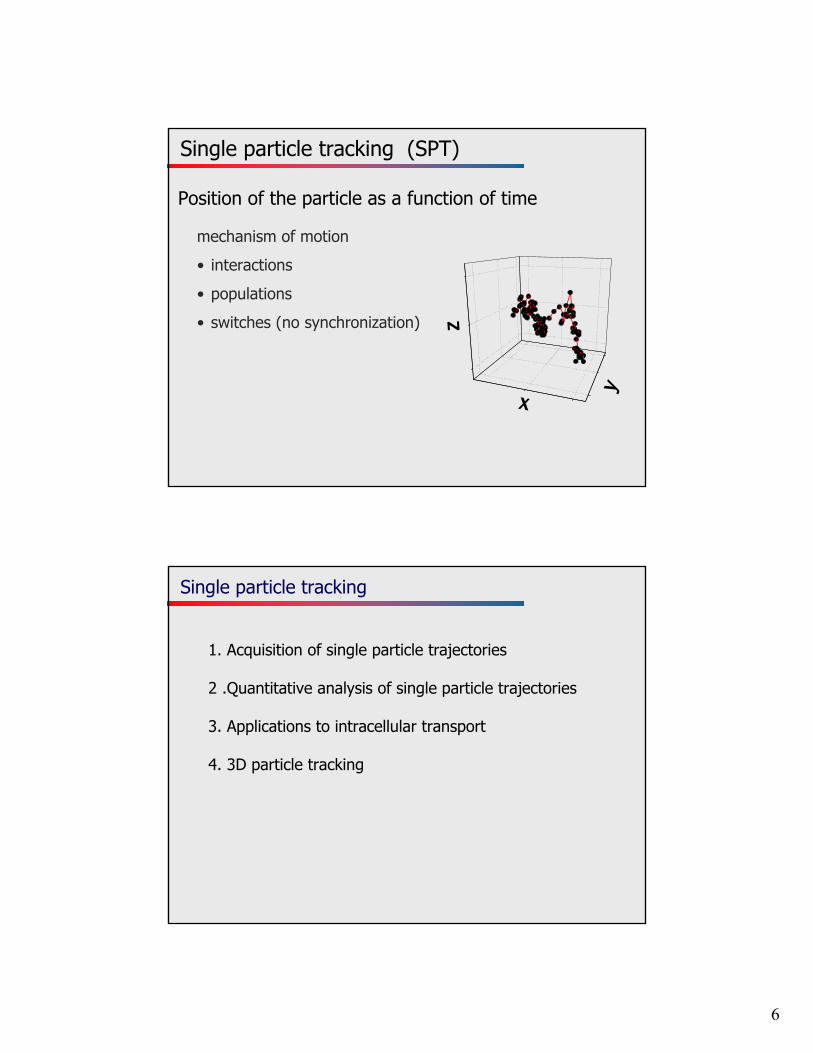
Single particle tracking (SPT)
Position of the particle as a function of time
mechanism of motion
• interactions
• populations
• switches (no synchronization) z
y
x
Single particle tracking
1. Acquisition of single particle trajectories
2 .Quantitative analysis of single particle trajectories
3. Applications to intracellular transport
4. 3D particle tracking
7
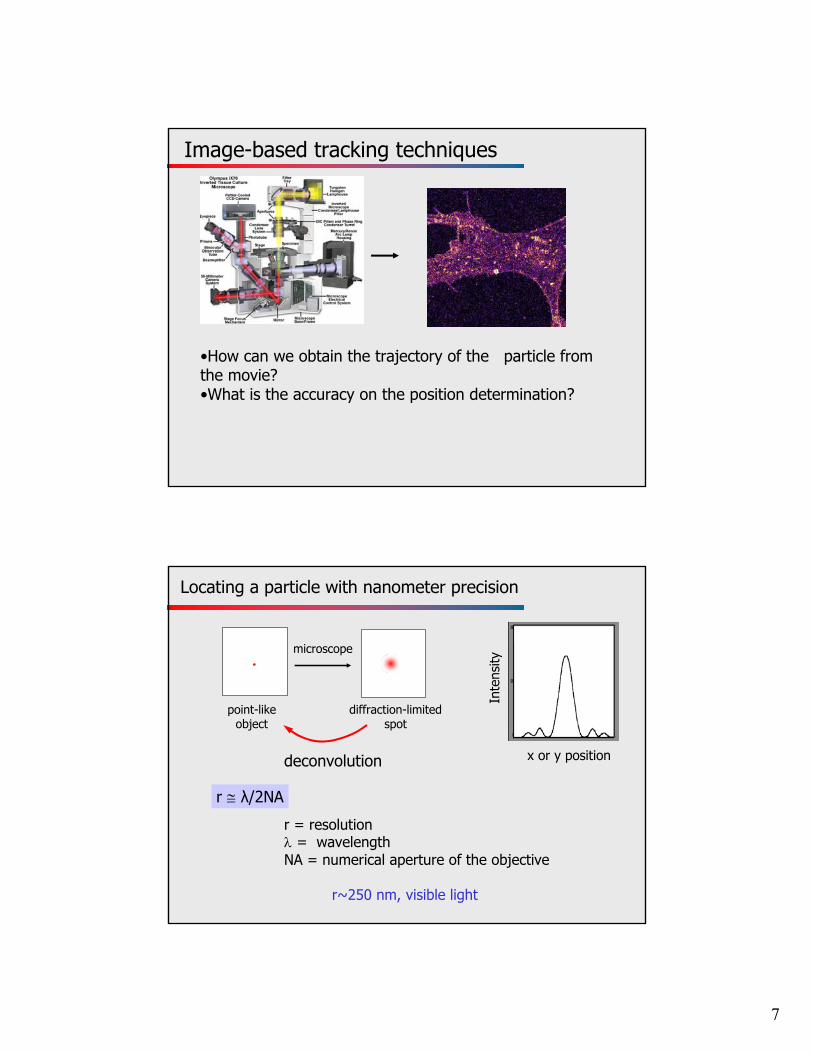
Image-based tracking techniques
•How can we obtain the trajectory of the particle from the movie? •What is the accuracy on the position determination?
Locating a particle with nanometer precision
point-like object
microscope
diffraction-limited spot
deconvolution
r = resolution = wavelengthNA = numerical aperture of the objective
r~250 nm, visible light
r λ/2NA
x or y position
Inte
nsity

8
An example of a simple SPT method: FIONA (fluorescence imaging with nanometer accuracy)
Imaging single fluorophore
from http://physics.berkeley.edu/research/yildiz/technology.html
the center of this distribution can be found with 1.5 nm
precision!
We have to be sure that there is a single molecule/particle !!
The trajectory of the particle is then recovered after locating the particle in every frame of the movie
Pattern-recognition tracking method
j)w(i,B)j)(i,Ij)(i,(Iδji,
2patternimage
B = background differencew(i,j) = weight factor= 2)),(( borderpattern IjiI
Levi et al. Biophys J (2006)
9
Tracking performance
0.0 0.3 0.6 0.9 1.20
25
50
75
100
disp
lace
men
t (n
m)
time (s)0 10 20 30 40 50
0
10
20
30
40
50
reco
vere
d st
ep (
nm)
piezo step (nm)Levi et al. Biophys J (2006)
500 nm fluorescent bead
piezo stageair
nm steps
Improving SPT: Error in the particle position
Thompson et al. Biophys J (2002)
22
24222 812
Na
BsN/a
Ns
)x(
x = error in the particle positions = standard deviation of the PSFN= number of photons detecteda = pixel sizeB = background noise
photon noise background noise
B increasespixelization noise
a increases
10
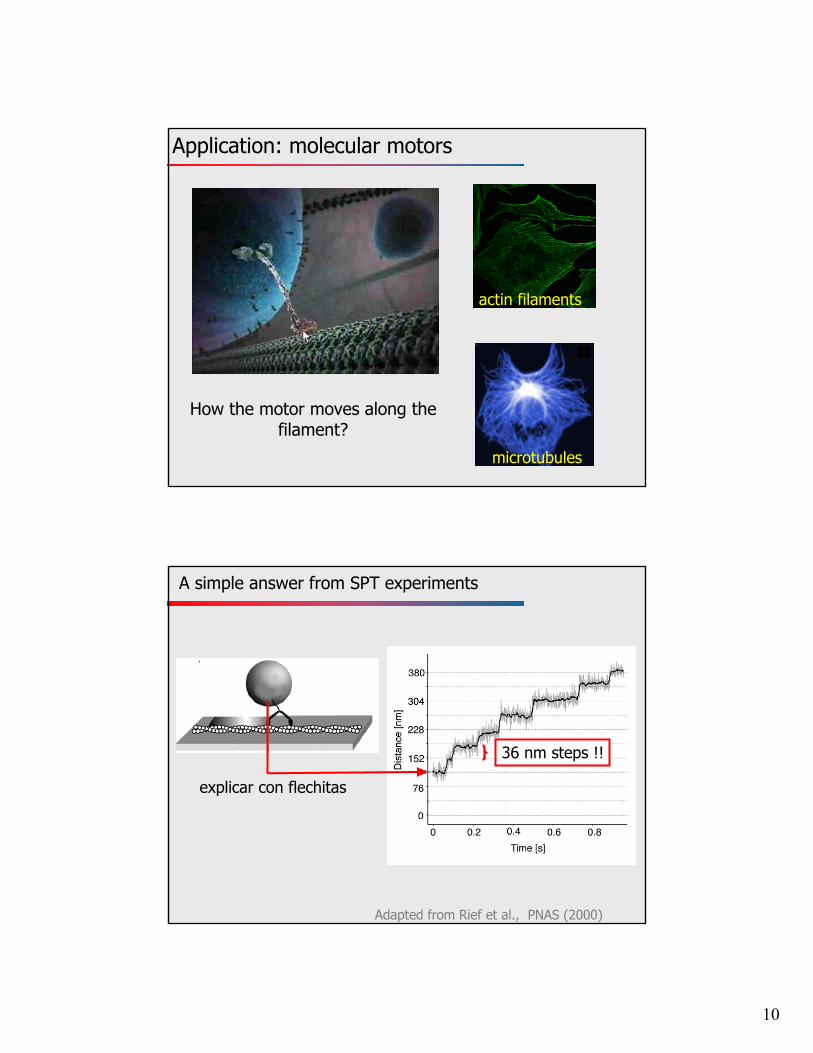
Application: molecular motors
microtubules
actin filaments
How the motor moves along the filament?
A simple answer from SPT experiments
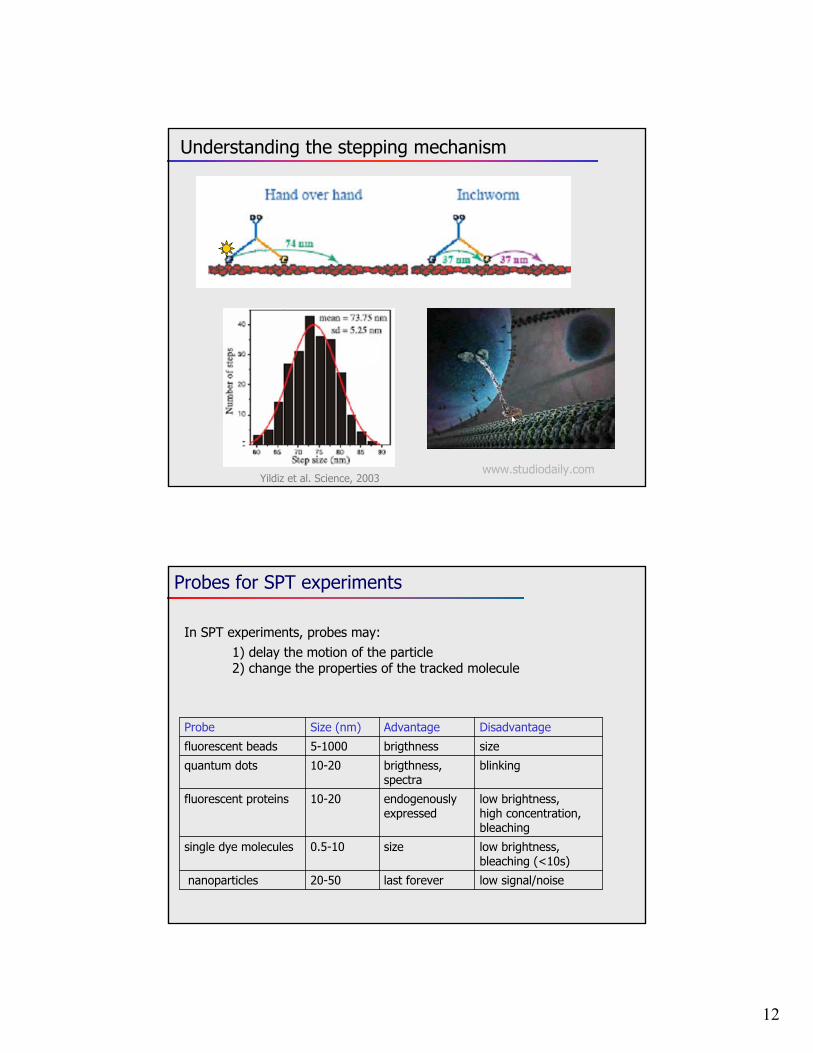
Adapted from Rief et al., PNAS (2000)
36 nm steps !!
explicar con flechitas
11
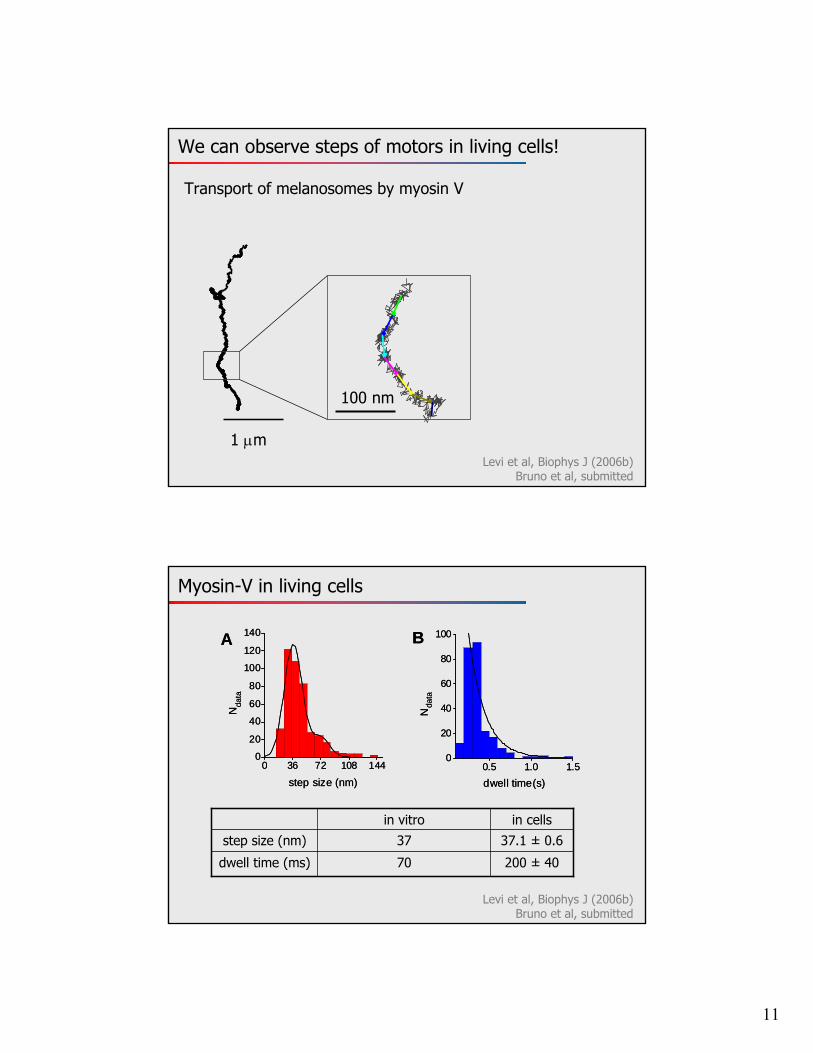
We can observe steps of motors in living cells!
Levi et al, Biophys J (2006b)Bruno et al, submitted
1 m
100 nm
Transport of melanosomes by myosin V
Myosin-V in living cells
37.1 ± 0.6 37step size (nm)
200 ± 4070dwell time (ms)
in cellsin vitro
0 36 72 108 1440
20
40
60
80
100
120
140
Nda
ta
step size (nm)
A
0 36 72 108 1440
20
40
60
80
100
120
140
Nda
ta
step size (nm)
A
0.5 1.0 1.50
20
40
60
80
100
Nda
ta
dwell time(s)
B
0.5 1.0 1.50
20
40
60
80
100
Nda
ta
dwell time(s)
B
Levi et al, Biophys J (2006b)Bruno et al, submitted
12
Understanding the stepping mechanism
Yildiz et al. Science, 2003www.studiodaily.com
low signal/noiselast forever20-50nanoparticles
low brightness,bleaching (<10s)
size0.5-10single dye molecules
low brightness,high concentration, bleaching
endogenously expressed
10-20fluorescent proteins
blinkingbrigthness, spectra
10-20quantum dots
sizebrigthness5-1000fluorescent beads
DisadvantageAdvantage Size (nm)Probe
Probes for SPT experiments
In SPT experiments, probes may:1) delay the motion of the particle2) change the properties of the tracked molecule
13
Single particle tracking
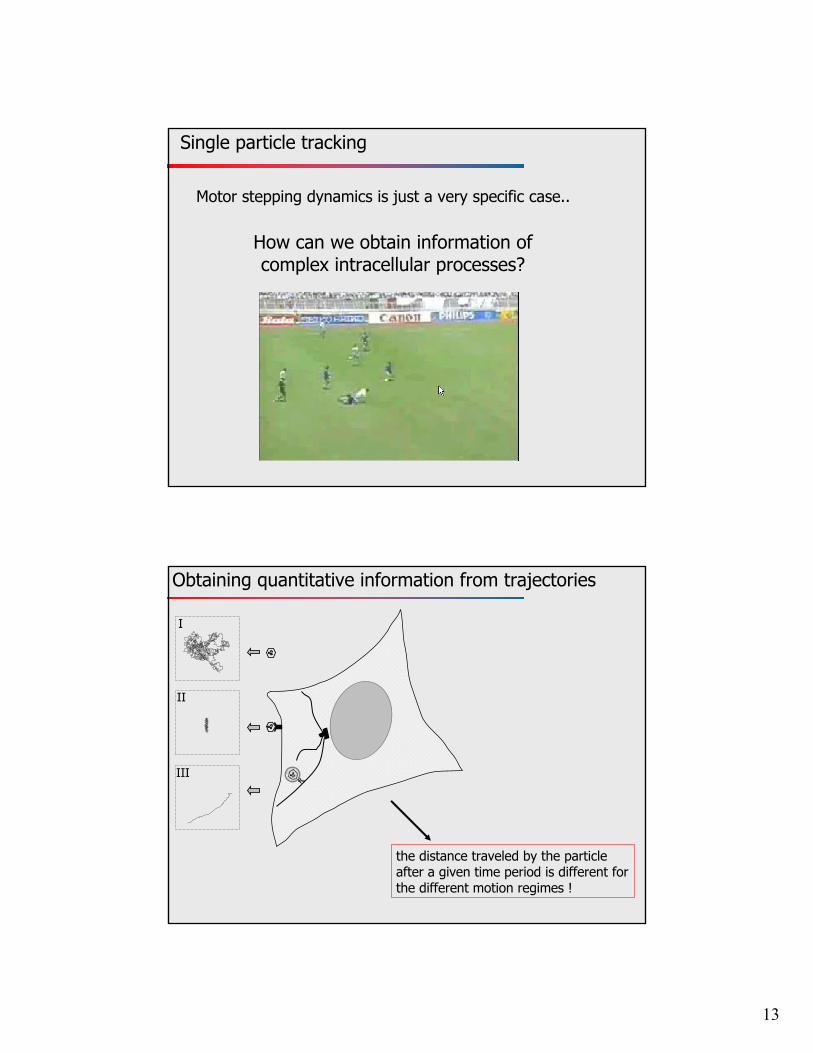
Motor stepping dynamics is just a very specific case..
How can we obtain information of complex intracellular processes?
Obtaining quantitative information from trajectories
-25
025
50
-25
025
50
yx
III
II
I
the distance traveled by the particle after a given time period is different for the different motion regimes !
14
x
y
1
2
4
3
6
5
MSD
/tsampling
1 2 3 4
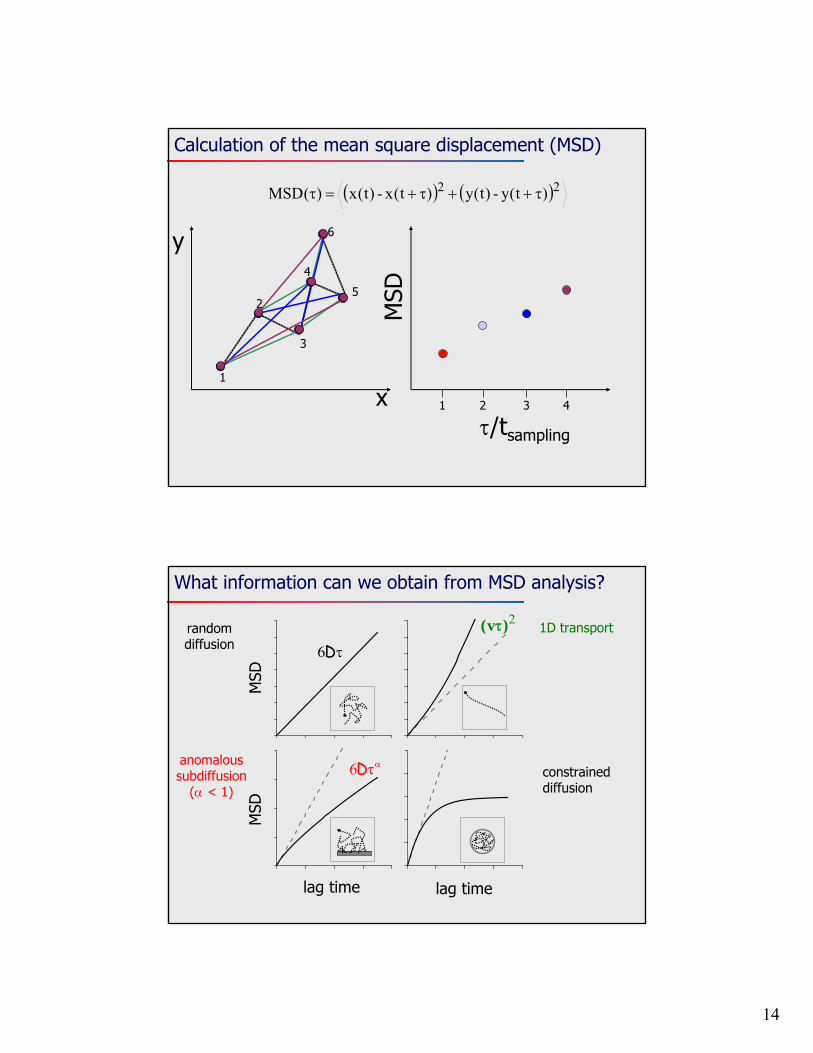
Calculation of the mean square displacement (MSD)
22 )t(y-)t(y)t(x-)t(x)(MSD
What information can we obtain from MSD analysis?
lag time lag time
MSD
MSD
D6
random diffusion
2)v( 1D transport
D6anomalous subdiffusion
( < 1)constrained diffusion
15
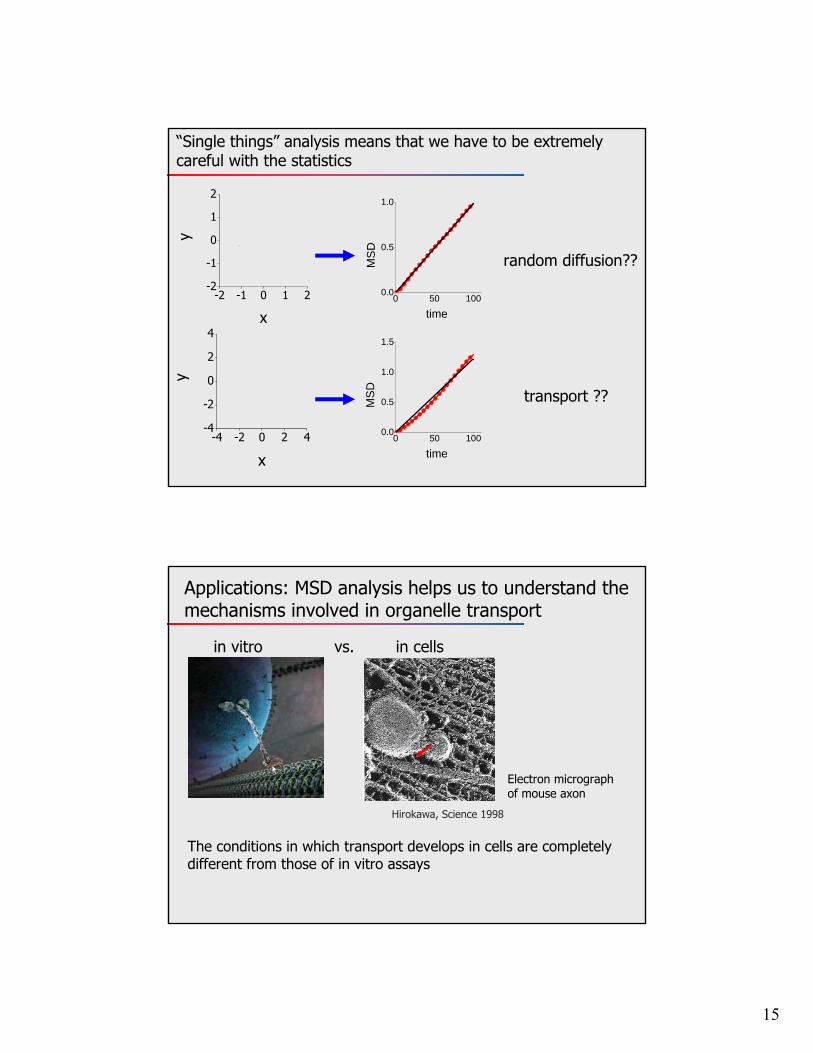
“Single things” analysis means that we have to be extremely careful with the statistics
-2 -1 0 1 2-2
-1
0
1
2y
x
-4 -2 0 2 4-4
-2
0
2
4
y
x
random diffusion??
transport ??
0 50 1000.0
0.5
1.0
1.5
MS
D
time
0 50 1000.0
0.5
1.0
MS
D
time
Hirokawa, Science 1998
in cellsin vitro
Applications: MSD analysis helps us to understand the mechanisms involved in organelle transport
Electron micrograph of mouse axon
The conditions in which transport develops in cells are completely different from those of in vitro assays
vs.
16
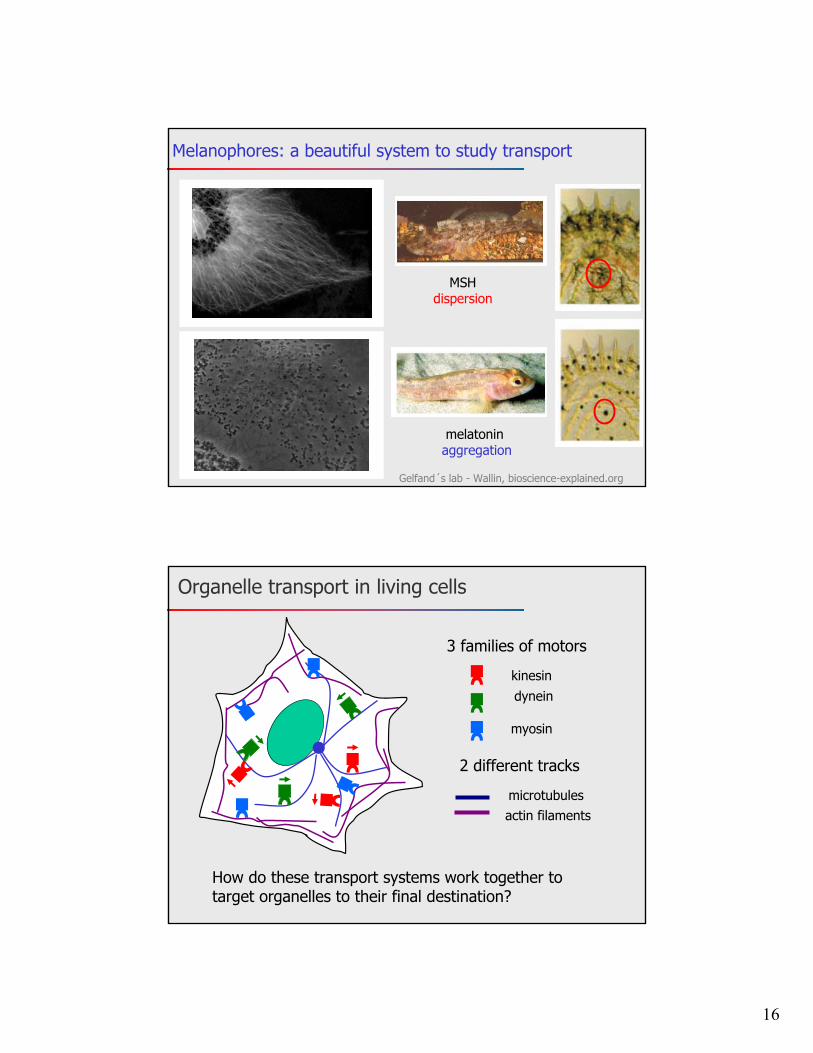
MSHdispersion
melatonin aggregation
Gelfand´s lab - Wallin, bioscience-explained.org
Melanophores: a beautiful system to study transport
kinesindynein
myosin
microtubulesactin filaments
How do these transport systems work together to target organelles to their final destination?
3 families of motors
2 different tracks
Organelle transport in living cells
17
-40 -20 0 20 40-20
0
20
40
60
y (n
m)
x (nm)
-2 -1 0 1 2-2
-1
0
1
2y
(m
)
x (m)
v =500 nm/s v=80 nm/s
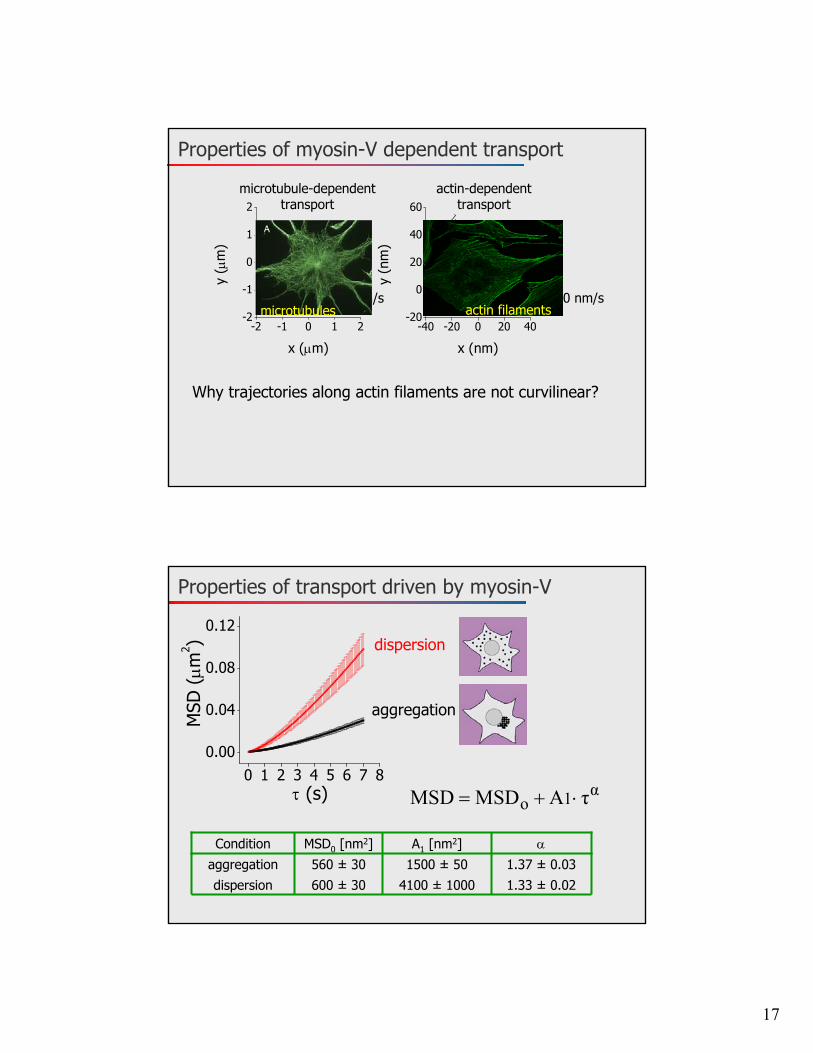
Properties of myosin-V dependent transport
microtubule-dependenttransport
actin-dependenttransport
Why trajectories along actin filaments are not curvilinear?
microtubules actin filaments
Properties of transport driven by myosin-V
0 1 2 3 4 5 6 7 80.00
0.04
0.08
0.12
MSD
(m
2 )
(s)
dispersion
aggregation
α1o τAMSDMSD
1.33 ± 0.024100 ± 1000600 ± 30dispersion1.37 ± 0.031500 ± 50560 ± 30aggregation
A1 [nm2]MSD0 [nm2]Condition
18
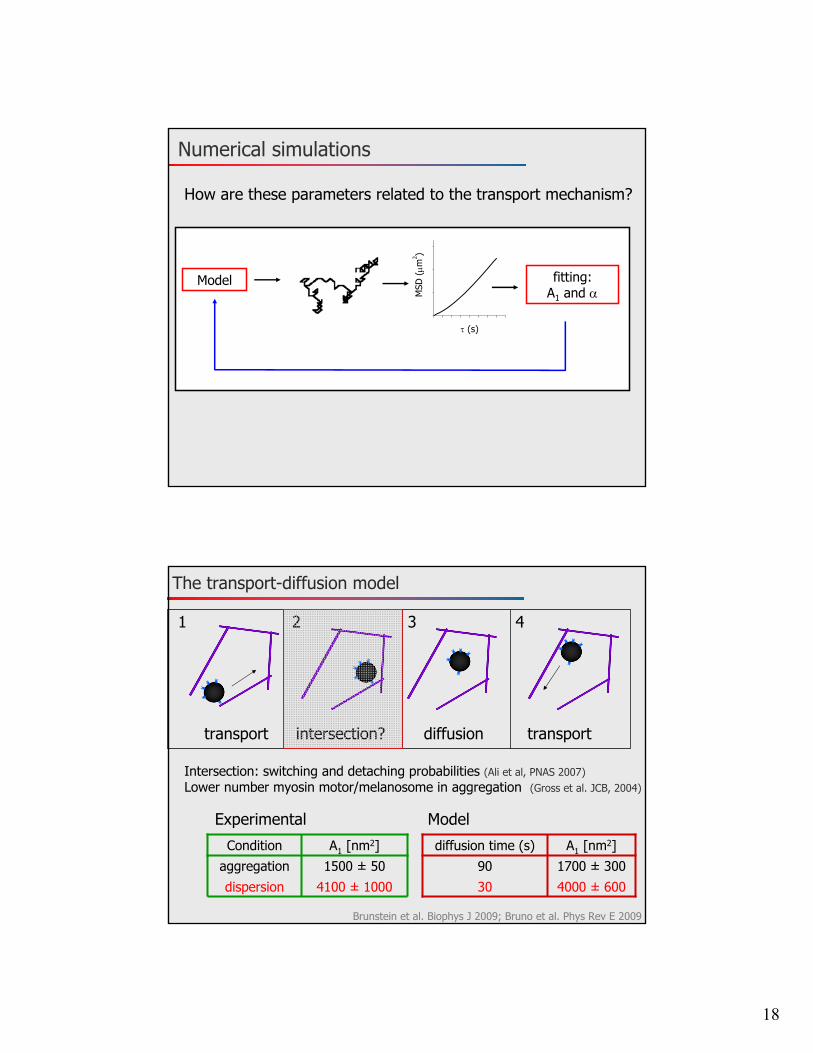
Numerical simulations
MSD
(m
2 )
(s)
fitting:A1 and
Model
How are these parameters related to the transport mechanism?
The transport-diffusion model
4100 ± 1000dispersion1500 ± 50aggregationA1 [nm2]Condition
4000 ± 600301700 ± 30090
A1 [nm2]diffusion time (s)
Experimental Model
Brunstein et al. Biophys J 2009; Bruno et al. Phys Rev E 2009
Intersection: switching and detaching probabilities (Ali et al, PNAS 2007)Lower number myosin motor/melanosome in aggregation (Gross et al. JCB, 2004)
transport intersection? diffusion transport
1 432
19
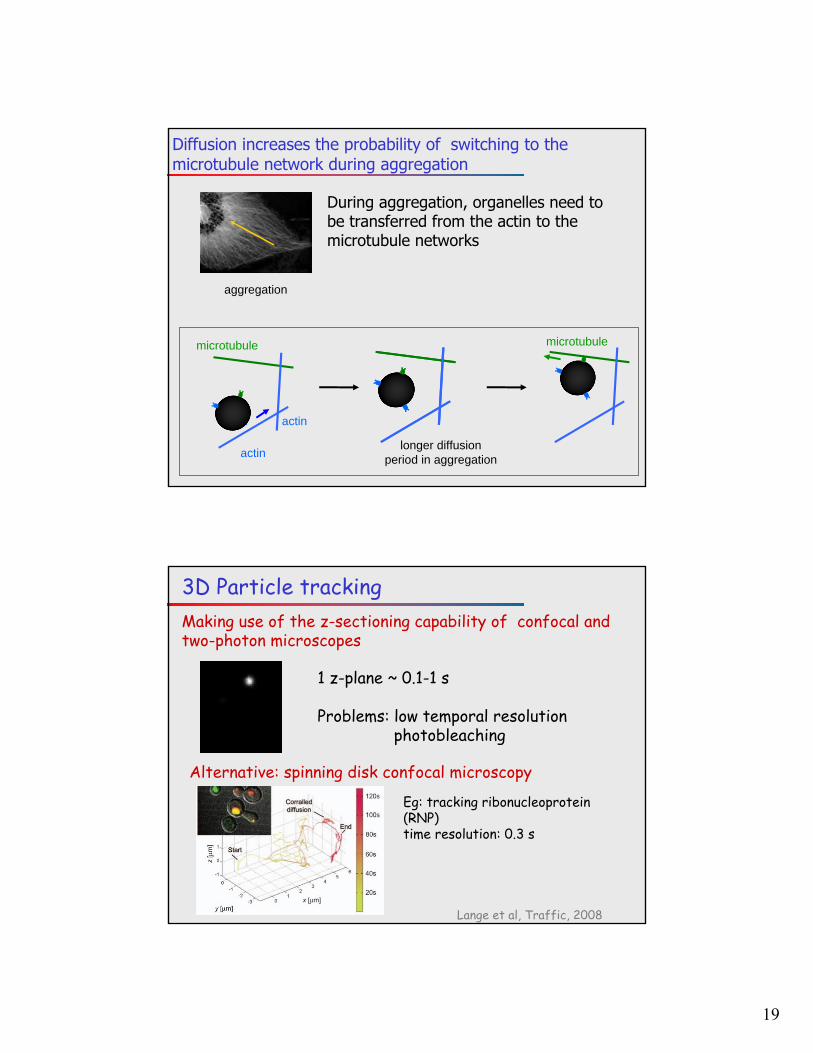
Diffusion increases the probability of switching to the microtubule network during aggregation
aggregation
actin
microtubule
actin
microtubule
longer diffusion period in aggregation
During aggregation, organelles need to be transferred from the actin to the microtubule networks
3D Particle tracking
1 z-plane ~ 0.1-1 s
Problems: low temporal resolution photobleaching
Making use of the z-sectioning capability of confocal and two-photon microscopes
Alternative: spinning disk confocal microscopy
Lange et al, Traffic, 2008
Eg: tracking ribonucleoprotein(RNP)time resolution: 0.3 s
20
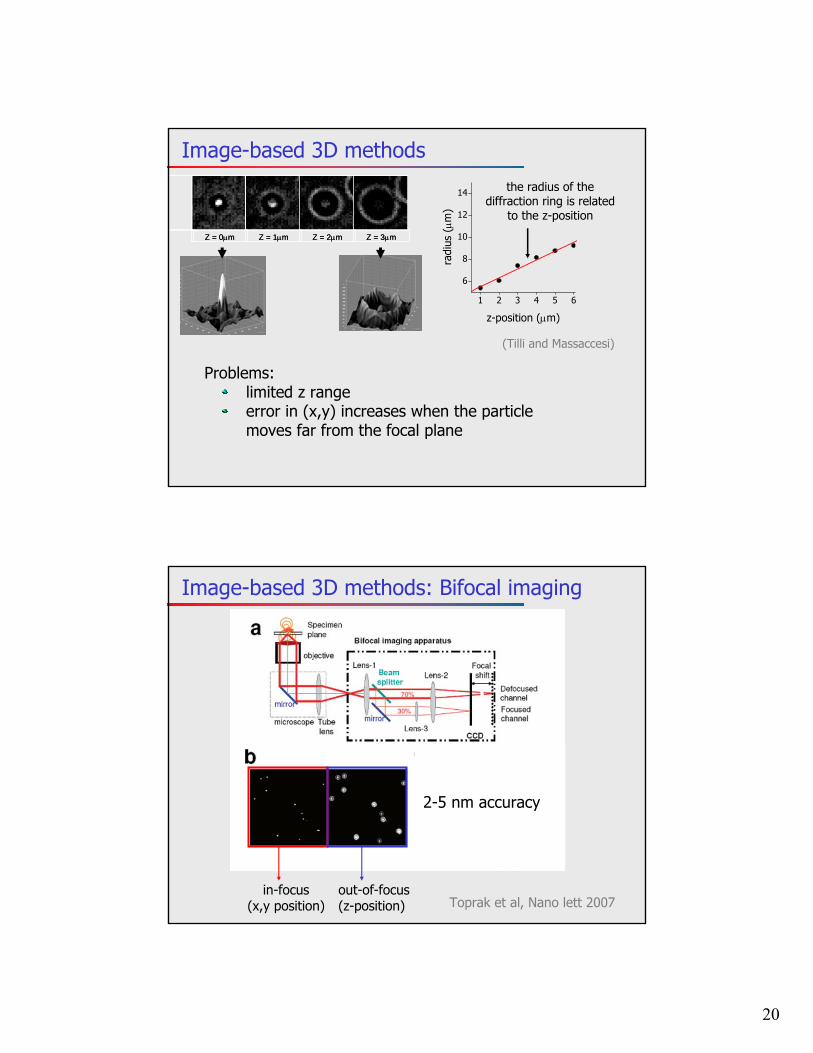
Image-based 3D methods
Z = 0m Z = 1m Z = 2m Z = 3mZ = 0m Z = 1m Z = 2m Z = 3m
Problems: limited z rangeerror in (x,y) increases when the particle moves far from the focal plane
1 2 3 4 5 6
6
8
10
12
14
radi
us (m
)
z-position (m)
the radius of the diffraction ring is related
to the z-position
(Tilli and Massaccesi)
Image-based 3D methods: Bifocal imaging
Toprak et al, Nano lett 2007in-focus
(x,y position)out-of-focus(z-position)
2-5 nm accuracy
21
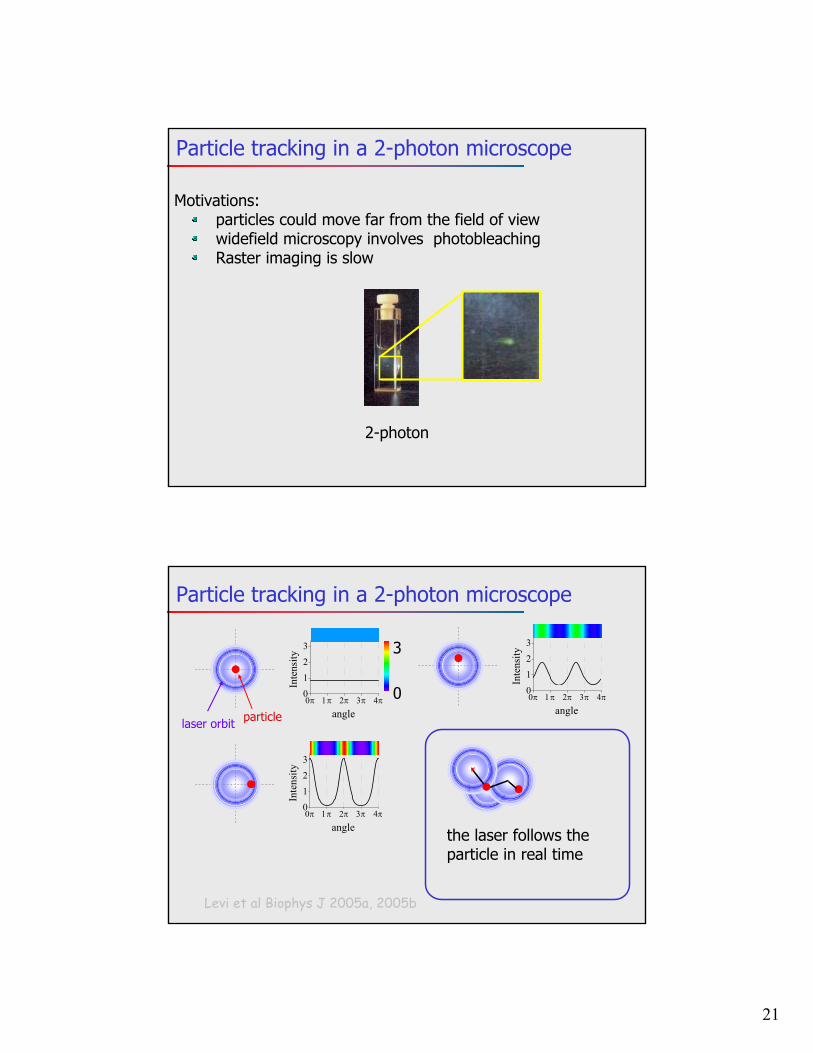
Particle tracking in a 2-photon microscope
Motivations: particles could move far from the field of viewwidefield microscopy involves photobleachingRaster imaging is slow
2-photon
0
1
2
3
Inte
nsit
y
angle
0
1
2
3
Inte
nsit
y
angle
particle
0
1
2
3
Inte
nsit
y
angle
0
3
laser orbit
Particle tracking in a 2-photon microscope
the laser follows the particle in real time
Levi et al Biophys J 2005a, 2005b
22
8 12 16 200
4
8
12
16
20
24
N d
ata
step size (nm)
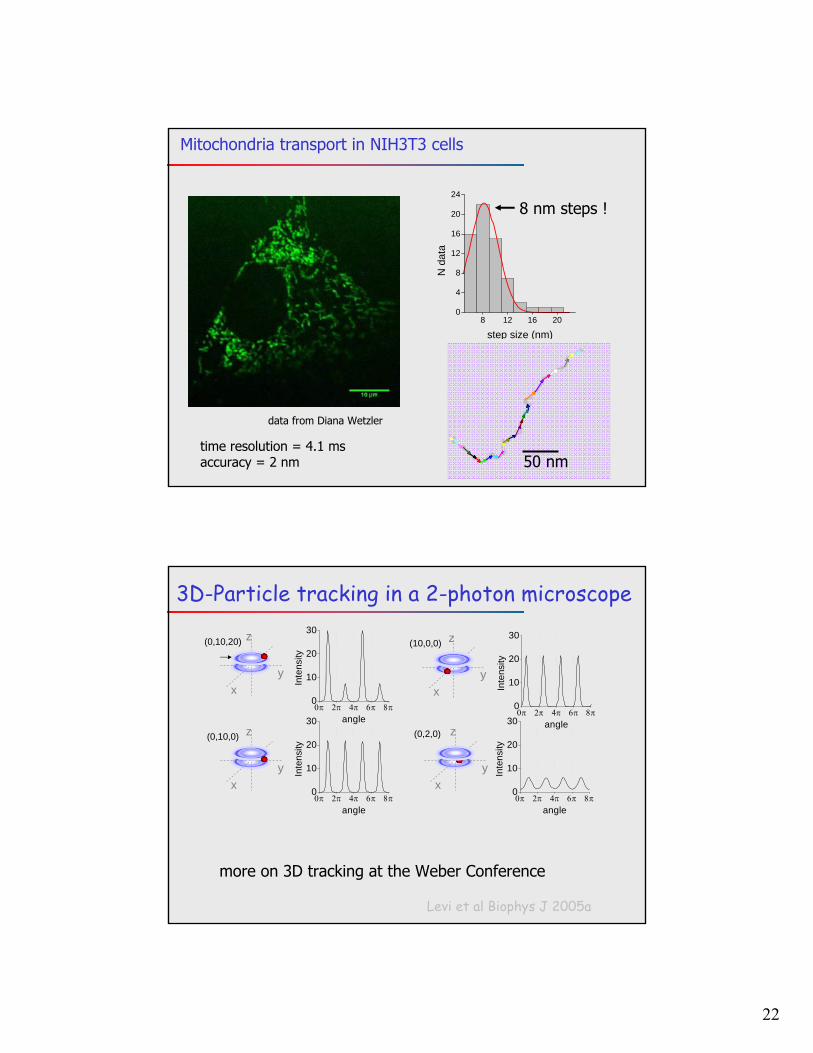
data from Diana Wetzler
50 nm
8 nm steps !
time resolution = 4.1 msaccuracy = 2 nm
Mitochondria transport in NIH3T3 cells
3D-Particle tracking in a 2-photon microscope
x
z
y
x
z
y
z
x
y
x
z
y
(0,10,20)
(0,10,0)
(10,0,0)
(0,2,0)
0
10
20
30
Inte
nsity
angle
0
10
20
30
Inte
nsity
angle
0
10
20
30
Inte
nsity
angle
0
10
20
30
Inte
nsity
angle
Levi et al Biophys J 2005a
more on 3D tracking at the Weber Conference

23
More SPT talks in the Gregorio Weber Conference
Thursday, December 15
S2-3) ANDRE GOMES (Universidade Federal do Rio de Janeiro, Rio de Janeiro, Brazil)
12:40-13:00
S2-2) ENRICO GRATTON (LFD, University of California Irvine, USA)
12:20-12:40
S2-1) LUCIANA BRUNO (Universidad de Buenos Aires, Argentina)
12:00-12:20


