
Some Design Issues in Microbicide Trials
August 20, 2003
Thomas R. Fleming, Ph.D.Professor and Chair of Biostatistics
University of Washington
FDA Antiviral Drugs Advisory Committee
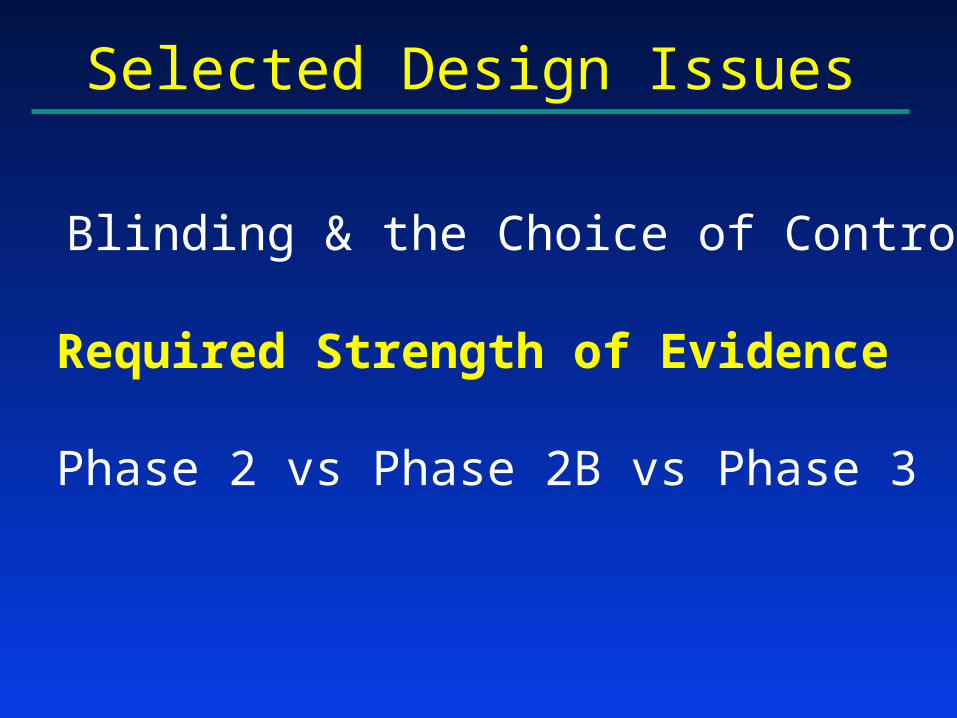
Selected Design Issues
• Blinding & the Choice of Controls
• Required Strength of Evidence
• Phase 2 vs Phase 2B vs Phase 3
Selected Design Issues
• Blinding & the Choice of Controls
• Required Strength of Evidence
• Phase 2 vs Phase 2B vs Phase 3
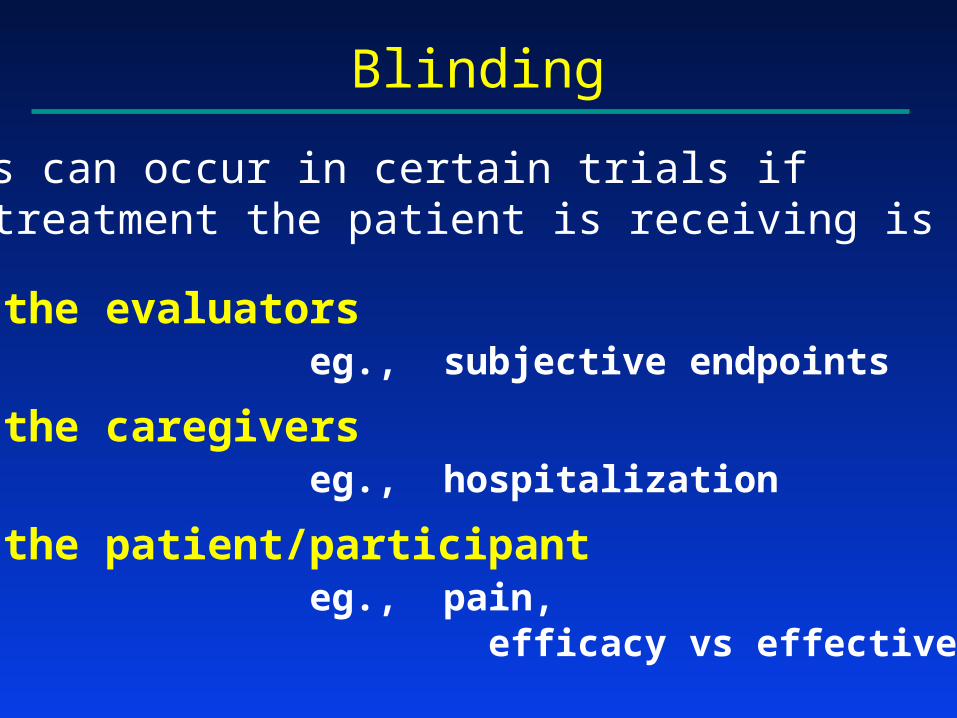
Blinding
~ Bias can occur in certain trials if the treatment the patient is receiving is known to:
- the evaluatorseg., subjective endpoints
- the caregiverseg., hospitalization
- the patient/participanteg., pain, efficacy vs effectiveness

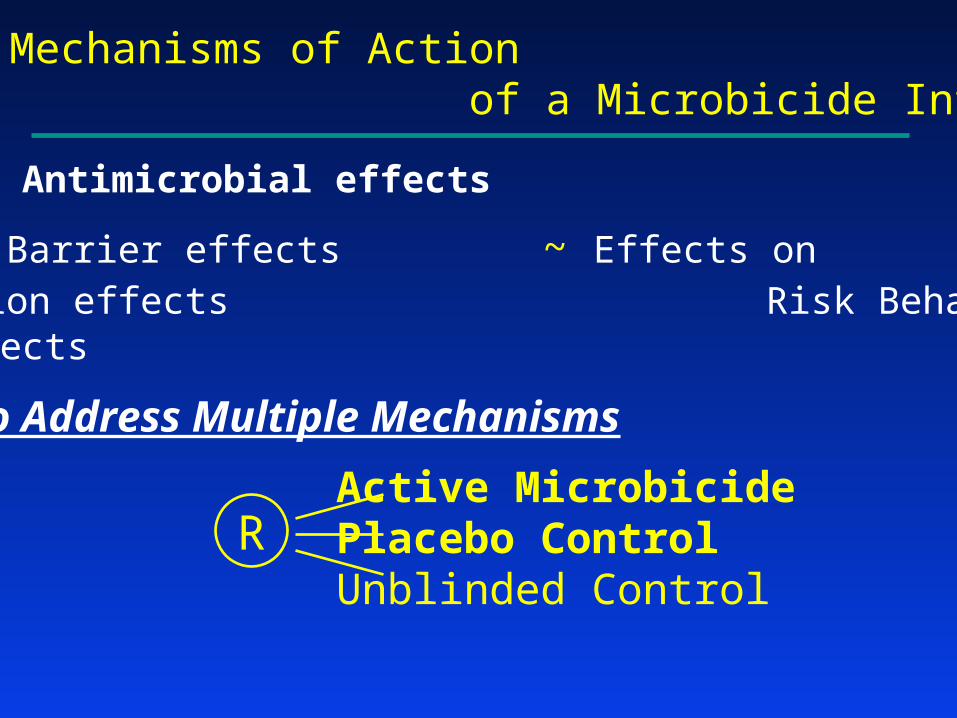
Potential Mechanisms of Action of a Microbicide Intervention
~ Antimicrobial effects
~ Physical Barrier effects ~ Effects on ~ Lubrication effects Risk Behavior~ Other effects
Design to Address Multiple Mechanisms
Active MicrobicidePlacebo ControlUnblinded Control
R
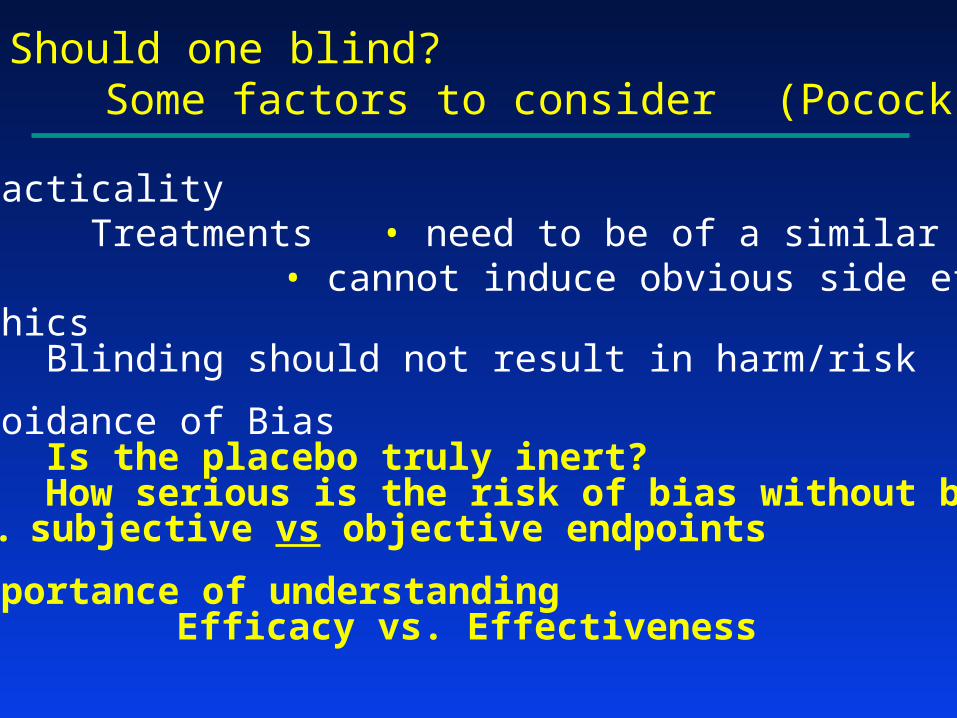
Should one blind?Some factors to consider (Pocock)
• Practicality Treatments • need to be of a similar nature
• cannot induce obvious side effects• Ethics Blinding should not result in harm/risk
• Avoidance of Bias • Is the placebo truly inert? • How serious is the risk of bias without blinding?
… subjective vs objective endpoints
• Importance of understanding Efficacy vs. Effectiveness
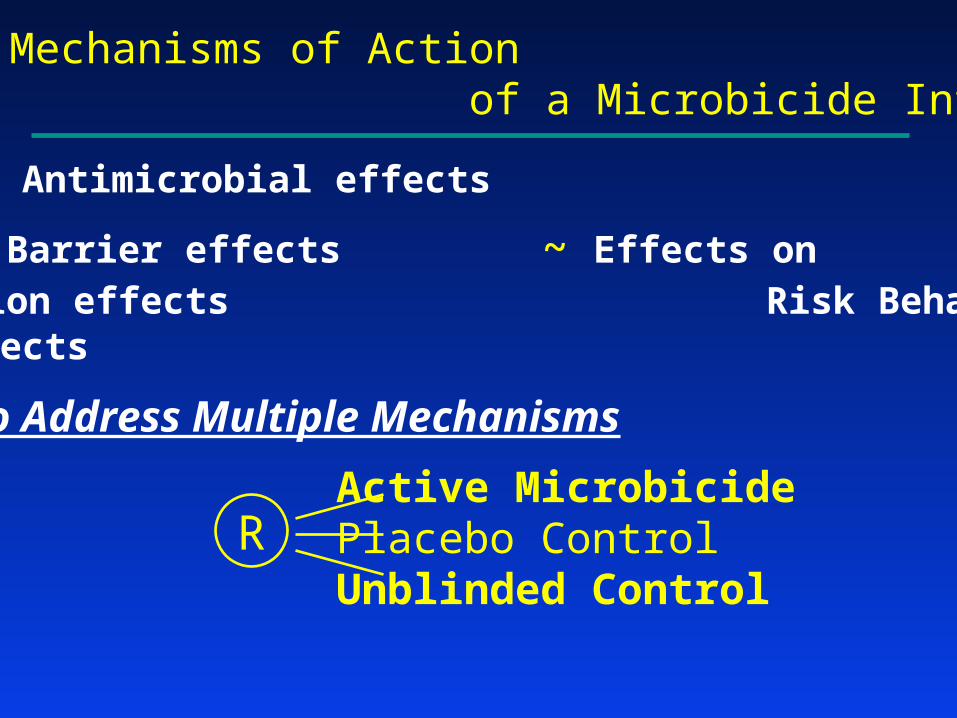
Potential Mechanisms of Action of a Microbicide Intervention
~ Antimicrobial effects
~ Physical Barrier effects ~ Effects on ~ Lubrication effects Risk Behavior~ Other effects
Design to Address Multiple Mechanisms
Active MicrobicidePlacebo ControlUnblinded Control
R
Potential Mechanisms of Action of a Microbicide Intervention
~ Antimicrobial effects
~ Physical Barrier effects ~ Effects on ~ Lubrication effects Risk Behavior~ Other effects
Design to Address Multiple Mechanisms
Active MicrobicidePlacebo ControlUnblinded Control
R

Antimicrobial effects vs. Physical Barrier, Lubrication, & Other effects
Annual Risk in: Active / Placebo / Unbl Control
2% / 2% / 3% 3% / 4.5% / 3%
PLA carries full effect Effectiveness << Efficacy~Use PLA in clinical practice ~Avoidable by advocacy
for adherence to condoms
2% / 2.5% / 3% 2.4% / 3.6% / 3%
PLA carries some effect MIC very effective~Use MIC in clinical practice ~Use MIC in clinical practice
(yet Effectiveness < Efficacy)
3% / 3% / 3% 2% / 3% / 3%
No effect MIC very effective
Selected Design Issues
• Blinding & the Choice of Controls
• Required Strength of Evidence
• Phase 2 vs Phase 2B vs Phase 3
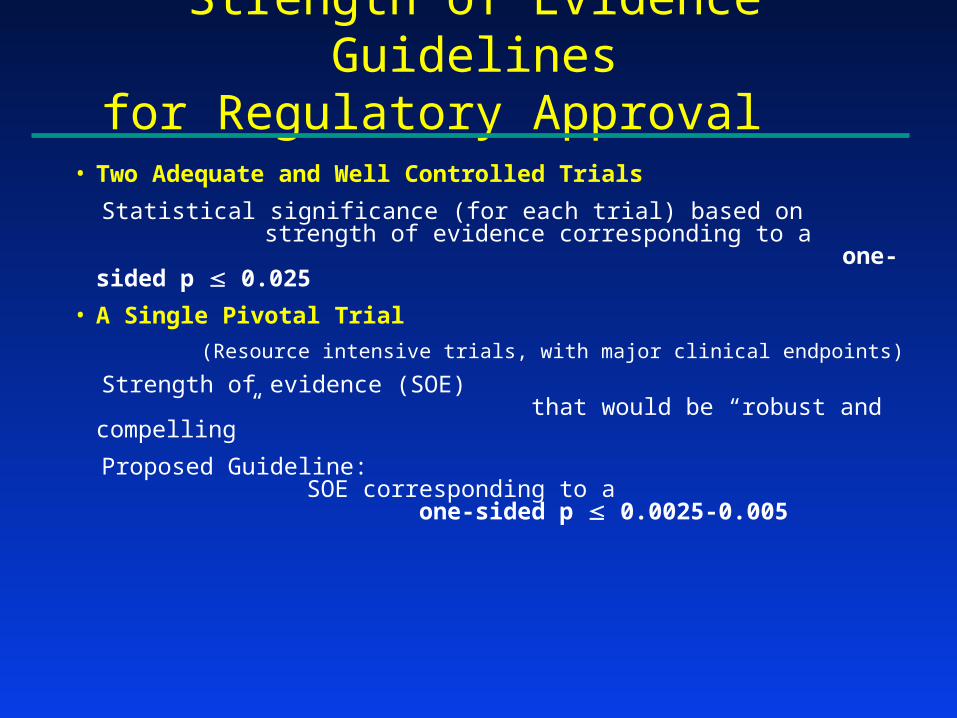
Strength of Evidence Guidelinesfor Regulatory Approval
• Two Adequate and Well Controlled Trials
Statistical significance (for each trial) based on strength of evidence corresponding to a one-sided p 0.025
• A Single Pivotal Trial
(Resource intensive trials, with major clinical endpoints)
Strength of evidence (SOE) that would be “robust and compelling”
Proposed Guideline: SOE corresponding to a one-sided p 0.0025-0.005

Illustration: HPTN 035 Design
• Four arms:
– BufferGel
– PRO 2000/5 Gel (P)
– Placebo control
– Unblinded (condom only) control
• 33% effectiveness
• 24 months follow-up

Sample Size (for pairwise comparisons)
• Scenario #1: Statistical significance based on strength of evidence corresponding to a one-sided p 0.025
256 endpoints (4025 participants) required for 90% power to detect 33% effectiveness
• Scenario #2: Statistical significance based on strength of evidence corresponding to a one-sided p 0.0025
405 endpoints (6125 participants) required for 90% power to detect 33% effectiveness

Illustration:HPTN 035 Trial
Illustration: Percent Reduction in HIV Risk
Scenario #1: One-sided 0.025; 256 endpoints
.025 .0025 .0005
0% 17.5% 21.5% 24% 27% 29.5% 33%
.025 .0025 .0005
Scenario #2: One-sided 0.0025; 405 endpoints
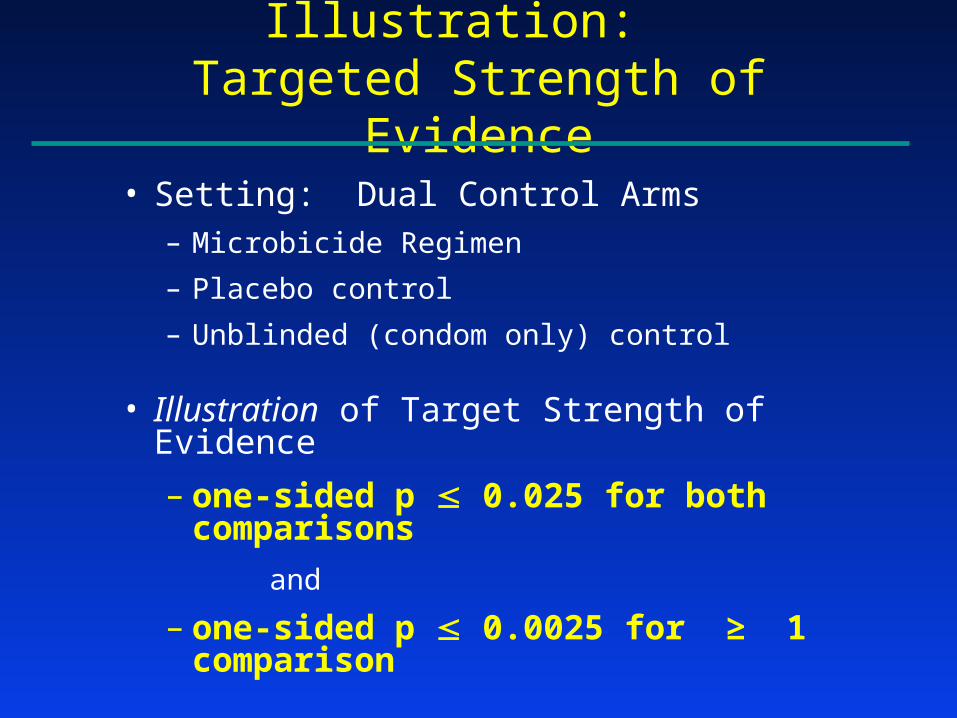
Illustration: Targeted Strength of Evidence
• Setting: Dual Control Arms
– Microbicide Regimen
– Placebo control
– Unblinded (condom only) control
• Illustration of Target Strength of Evidence
– one-sided p 0.025 for both comparisons
and
– one-sided p 0.0025 for ≥ 1 comparison
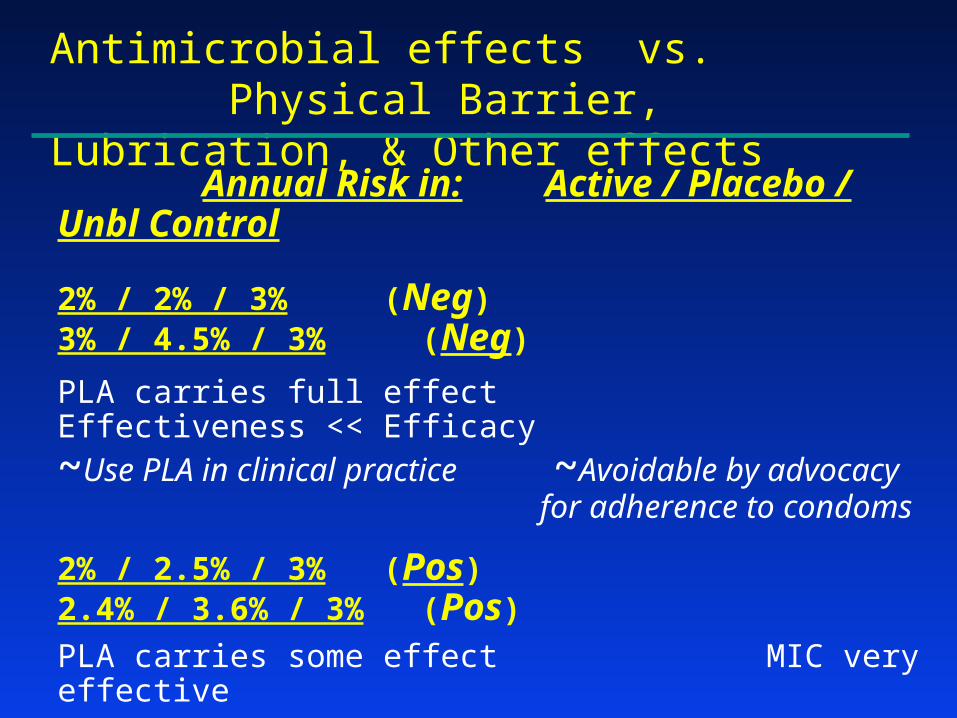
Antimicrobial effects vs. Physical Barrier, Lubrication, & Other effects
Annual Risk in: Active / Placebo / Unbl Control
2% / 2% / 3% (Neg) 3% / 4.5% / 3% (Neg)
PLA carries full effect Effectiveness << Efficacy~Use PLA in clinical practice ~Avoidable by advocacy
for adherence to condoms
2% / 2.5% / 3% (Pos) 2.4% / 3.6% / 3% (Pos)
PLA carries some effect MIC very effective~Use MIC in clinical practice ~Use MIC in clinical practice
(yet Effectiveness < Efficacy)
3% / 3% / 3% (Neg) 2% / 3% / 3% (Pos)
No effect MIC very effective
Selected Design Issues
• Blinding & the Choice of Controls
• Required Strength of Evidence
• Phase 2 vs Phase 2B vs Phase 3

Development Strategies
After Phase 1: What should be the next step?
~ Phase 2
~ Phase 2B (Intermediate Trial)
~ Phase 3

Why Conduct a Phase 2 Trial?
Obtain improved insights:• Safety and biological activity
• Refinements in dose/schedule
• Improving adherence to interventions
• Improving quality of trial conduct- Timely accrual
- High quality study implementation
- High quality data, including retention
Development Strategies
After Phase 1: What should be the next step?
~ Phase 2
~ Phase 2B (Intermediate Trial)
~ Phase 3
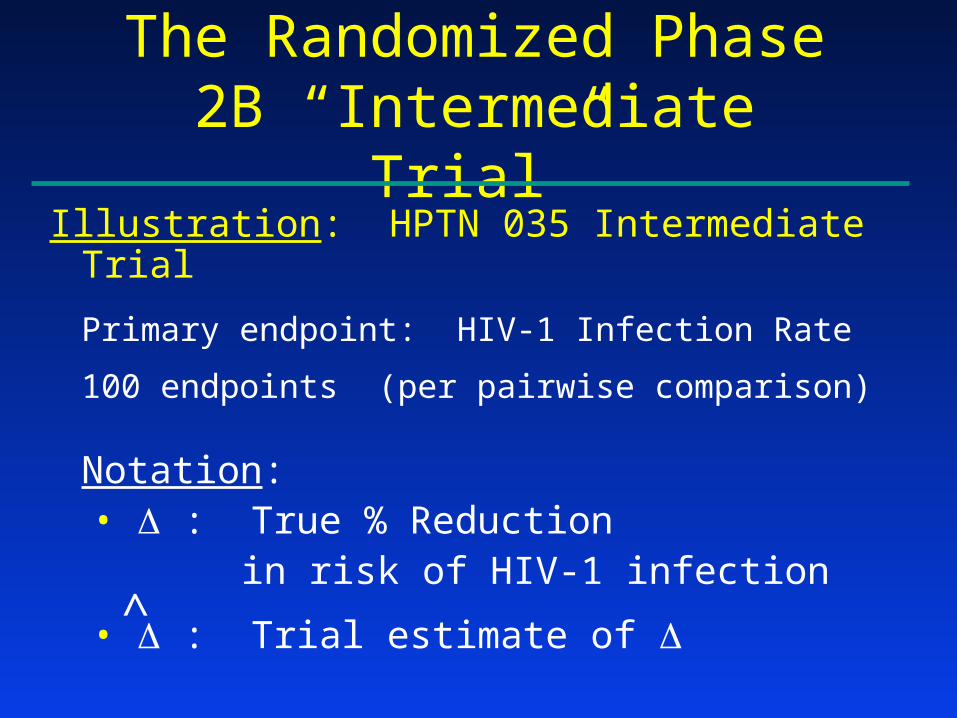
The Randomized Phase 2B “Intermediate Trial”
Illustration: HPTN 035 Intermediate Trial
Primary endpoint: HIV-1 Infection Rate
100 endpoints (per pairwise comparison)
Notation:• : True % Reduction
in risk of HIV-1 infection
• : Trial estimate of
^

Intermediate Trial Design
Phase 3 Trial Design
-33% 0% 33% 44% 67%
FurtherStudies Positive
-17% 0% 17% 33% 50%Positive
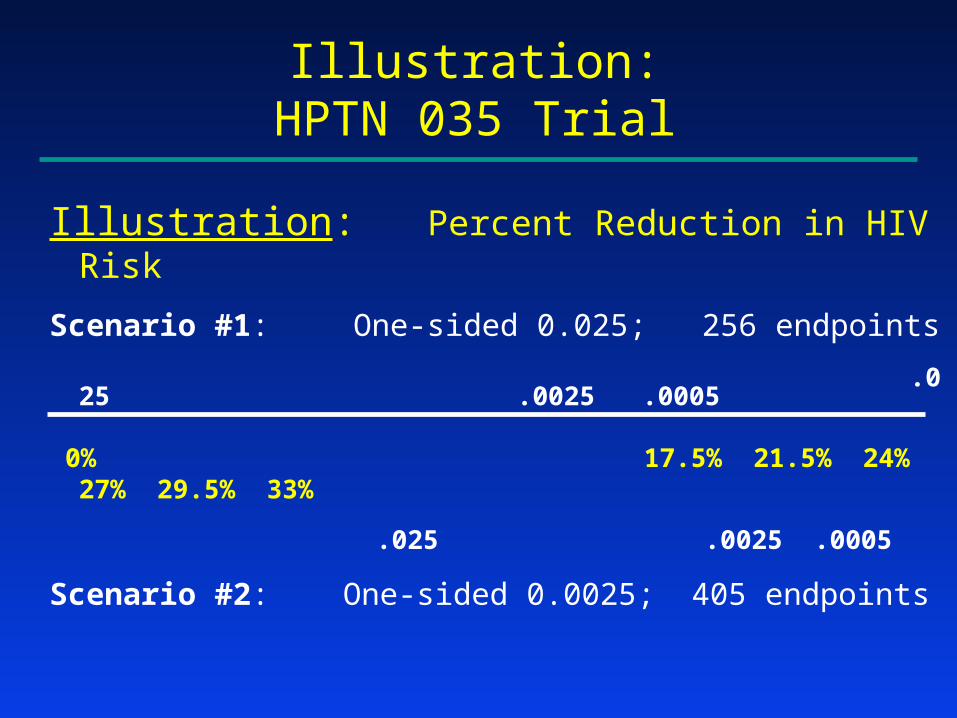
Illustration:HPTN 035 Trial
Illustration: Percent Reduction in HIV Risk
Scenario #1: One-sided 0.025; 256 endpoints
.025 .0025 .0005
0% 17.5% 21.5% 24% 27% 29.5% 33%
.025 .0025 .0005
Scenario #2: One-sided 0.0025; 405 endpoints

Intermediate Trial Design
Phase 3 Trial Design
-33% 0% 33% 44% 67%
FurtherStudies Positive
-17% 0% 17% 33% 50%Positive
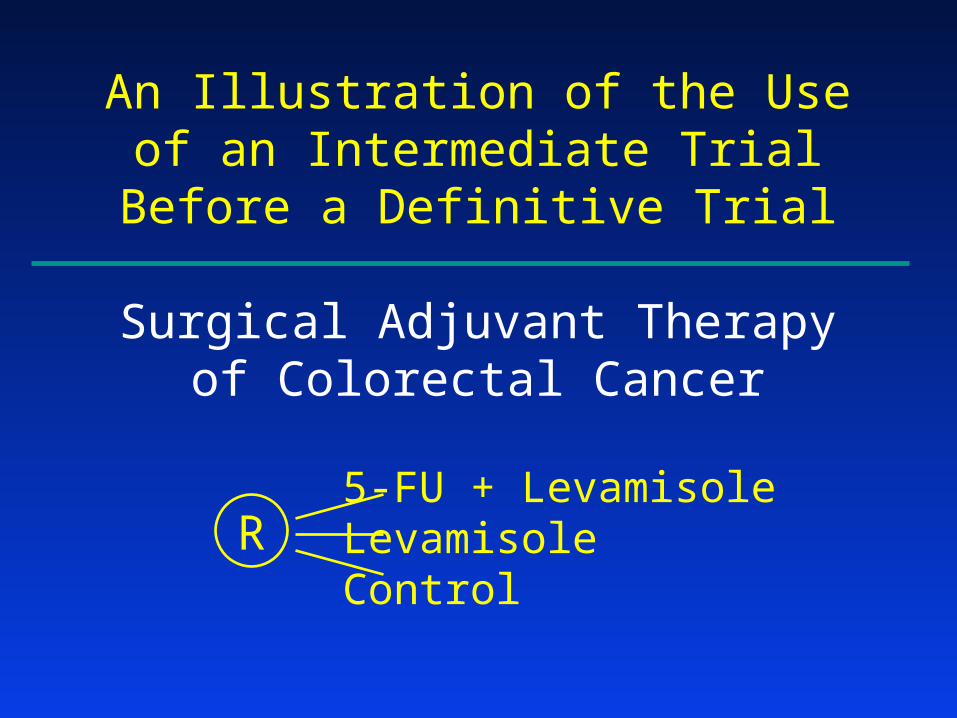
An Illustration of the Useof an Intermediate TrialBefore a Definitive Trial
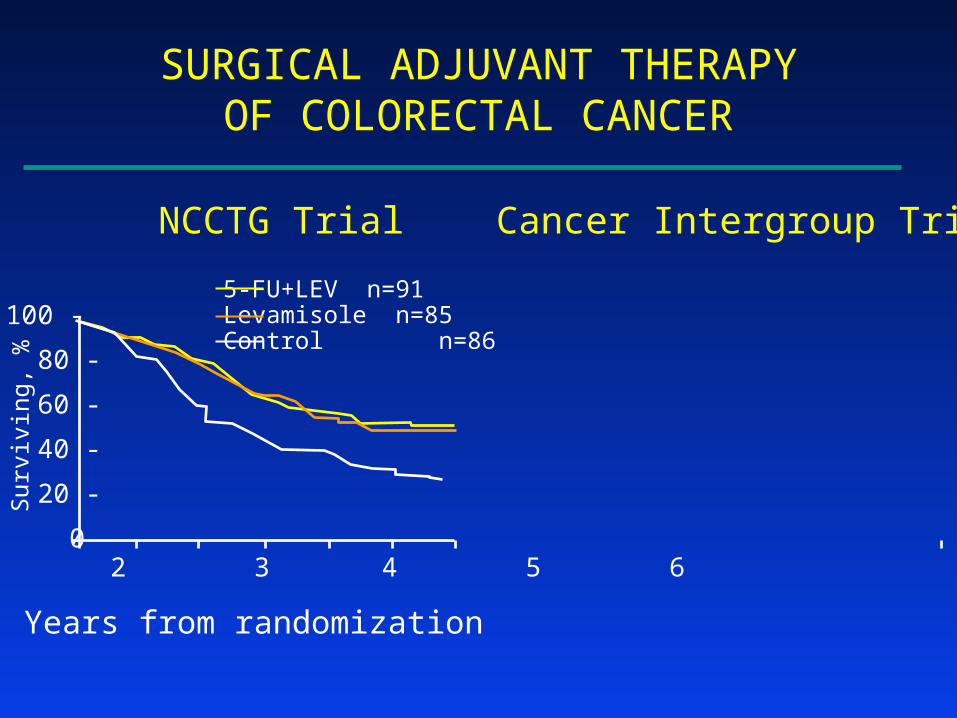
Surgical Adjuvant Therapyof Colorectal Cancer
5-FU + LevamisoleLevamisoleControl
R
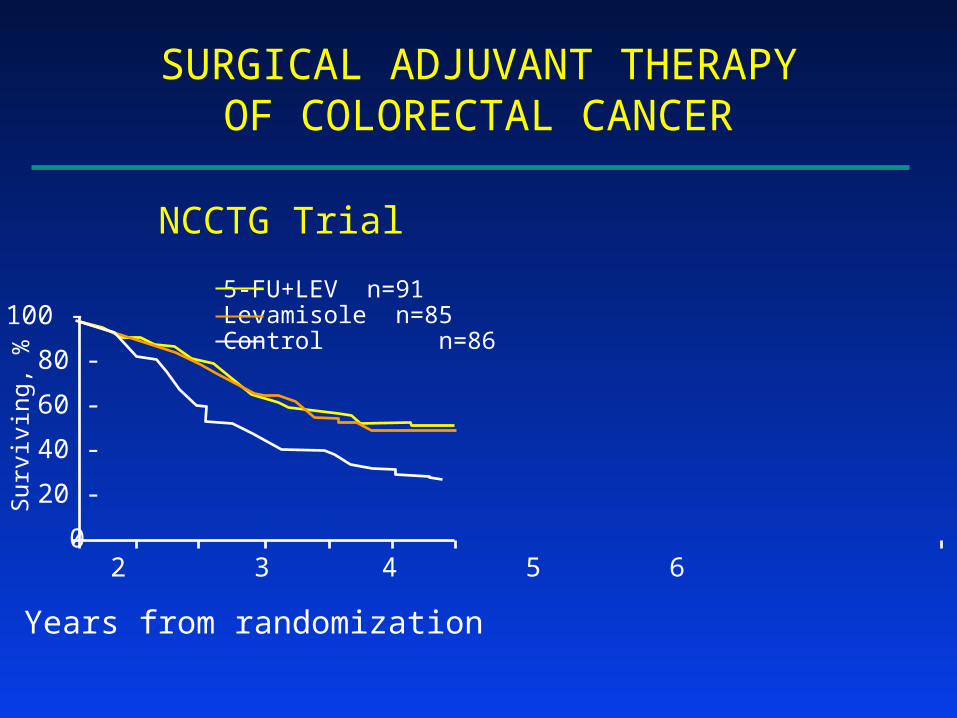
SURGICAL ADJUVANT THERAPYOF COLORECTAL CANCER
Surv
i vin
g, %
0 1 2 3 4 5 6
100 -
80 -
60 -
40 -
20 -
0
Years from randomization
NCCTG Trial
5-FU+LEV n=91Levamisole n=85Control n=86
SURGICAL ADJUVANT THERAPYOF COLORECTAL CANCER
Surv
i vin
g, %
0 1 2 3 4 5 6
100 -
80 -
60 -
40 -
20 -
0
Years from randomization
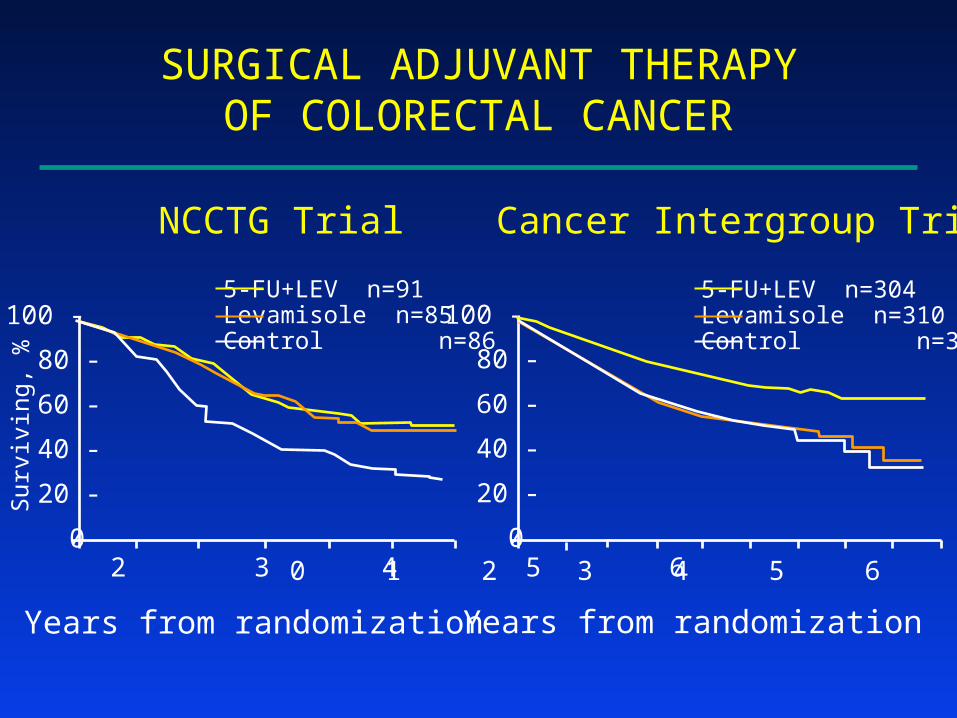
NCCTG Trial Cancer Intergroup Trial
5-FU+LEV n=91Levamisole n=85Control n=86
SURGICAL ADJUVANT THERAPYOF COLORECTAL CANCER
Surv
i vin
g, %
0 1 2 3 4 5 6
100 -
80 -
60 -
40 -
20 -
0
Years from randomization
NCCTG Trial Cancer Intergroup Trial
0 1 2 3 4 5 6 7 8 9
100 -
80 -
60 -
40 -
20 -
0
Years from randomization
5-FU+LEV n=91Levamisole n=85Control n=86
5-FU+LEV n=304Levamisole n=310Control n=315
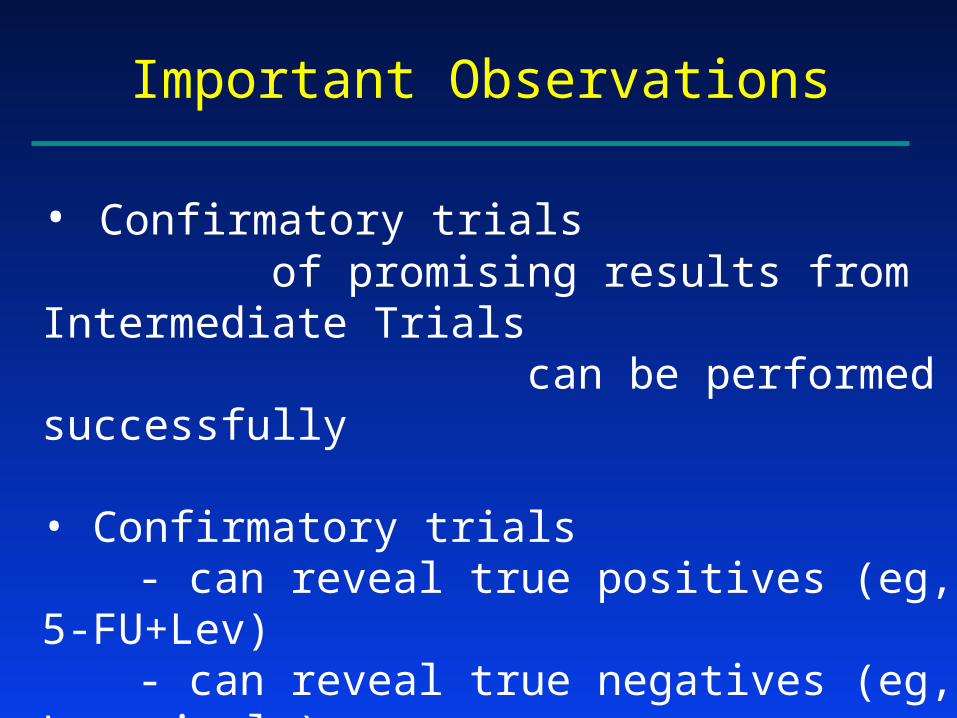
Important Observations
• Confirmatory trials of promising results from Intermediate Trials can be performed successfully
• Confirmatory trials- can reveal true positives (eg, 5-FU+Lev)- can reveal true negatives (eg, Levamisole)

SURGICAL ADJUVANT THERAPYOF COLORECTAL CANCER
Surv
i vin
g, %
0 1 2 3 4 5 6
100 -
80 -
60 -
40 -
20 -
0
Years from randomization
NCCTG Trial Cancer Intergroup Trial
0 1 2 3 4 5 6 7 8 9
100 -
80 -
60 -
40 -
20 -
0
Years from randomization
5-FU+LEV n=91Levamisole n=85Control n=86
5-FU+LEV n=304Levamisole n=310Control n=315

RAZT Labor/Delivery/1 wk to I
NVP Single doses to M/I
Illustration of an Intermediate Trial with “Compelling” Results: HIVNET 012
• 8/99 Results Lancet 1999; 354: 795-802
MCT of HIV N 6-8 wks 14-16 wks
AZT 302 59 (21.3%) 65 (25.1%)
NVP 307 35 (11.9%) 37 (13.1%)
1p = 0.0014 1p = 0.0003

Intermediate Trial Design
Phase 3 Trial Design
-33% 0% 33% 44% 67%
FurtherStudies Positive
-17% 0% 17% 33% 50%Positive

Conclusions: Selected Design Issues
• Blinding & the Choice of Controls
• Required Strength of Evidence
• Phase 2 vs Phase 2B vs Phase 3


