
THE SHINY APP
Presented by: Lance Cundy
Great Plains R Users Group
November 15, 2013

PERSONAL BACKGROUND
Graduate student at SDSU M.S. Mathematics Expected graduation date: May 2014
Fishback Financial Corporation (First Bank & Trust)
Fellowship Student Business Intelligence
Statographics Sports data visualization www.statographics.com

SHINY APP
Interactive web application Data visualization Interactive models
No need to know HTML or JavaScript Hosted by RStudio

RSTUDIO
Software, Education, and Services for the R Community
RStudio IDE User interface consisting of:
Editor Console Plots Workspace Etc.

WHAT DOES SHINY DO?
Users interact with drop down boxes, radio buttons, sliders, text fields, etc. Data can be an input
Output includes plots, tables, summaries

WHAT DOES THE SHINY APP LOOK LIKE?

HOW DO YOU MAKE A SHINY APP?
Consists of two scripts ui.R (user-interface)
Define titles and captions Define input (values and labels) Define output
server.R Dataset Generate output

USER-INTERFACE
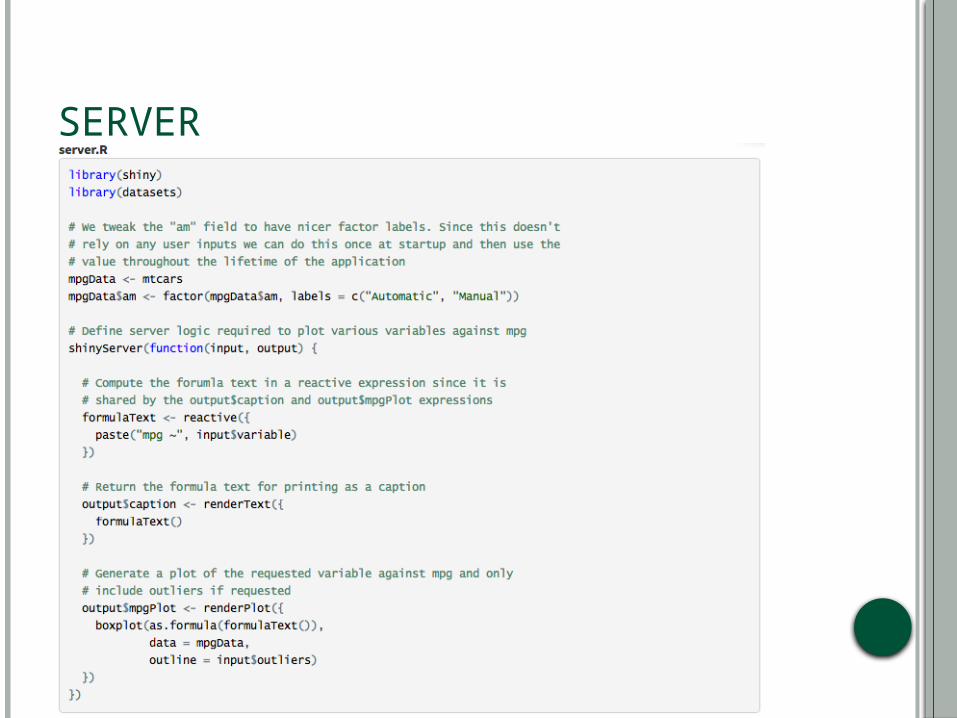
SERVER

OUTPUT

HOW DO YOU DEPLOY?
Locally runApp('/Users/ldc_ldc_ldc/Desktop/Shiny')
On the Web Self-Hosted Shiny Server
Linux Server RStudio-Hosted Shiny Server
Free Beta Test Account

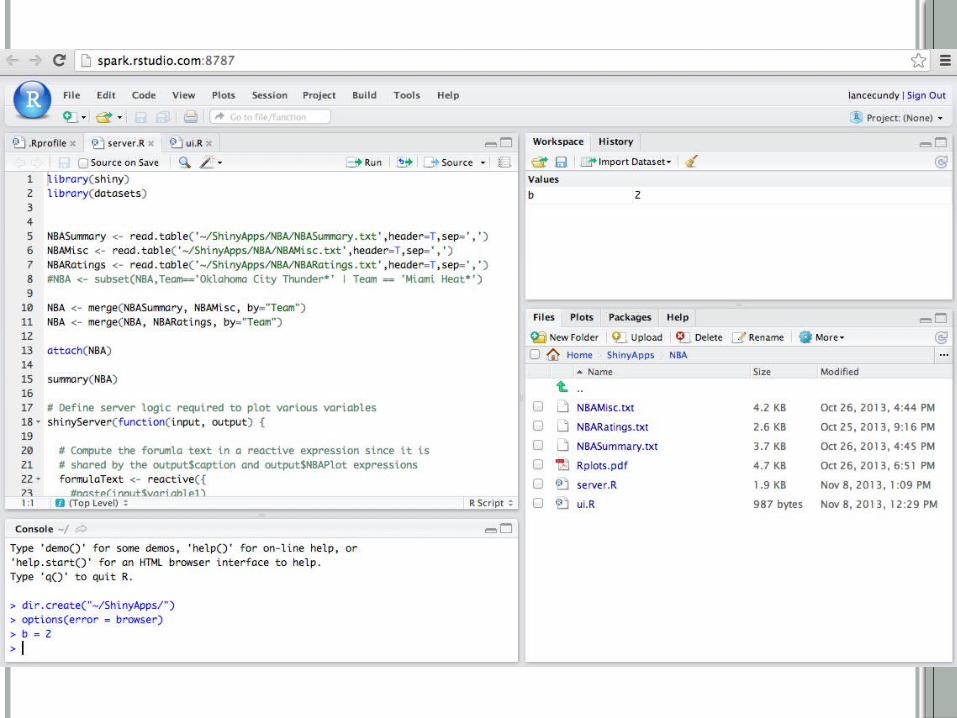
RSTUDIO SHINY SERVER
RStudio on a browser Own URL
http://spark.rstudio.com/lancecundy/NBA/


ADVANTAGES
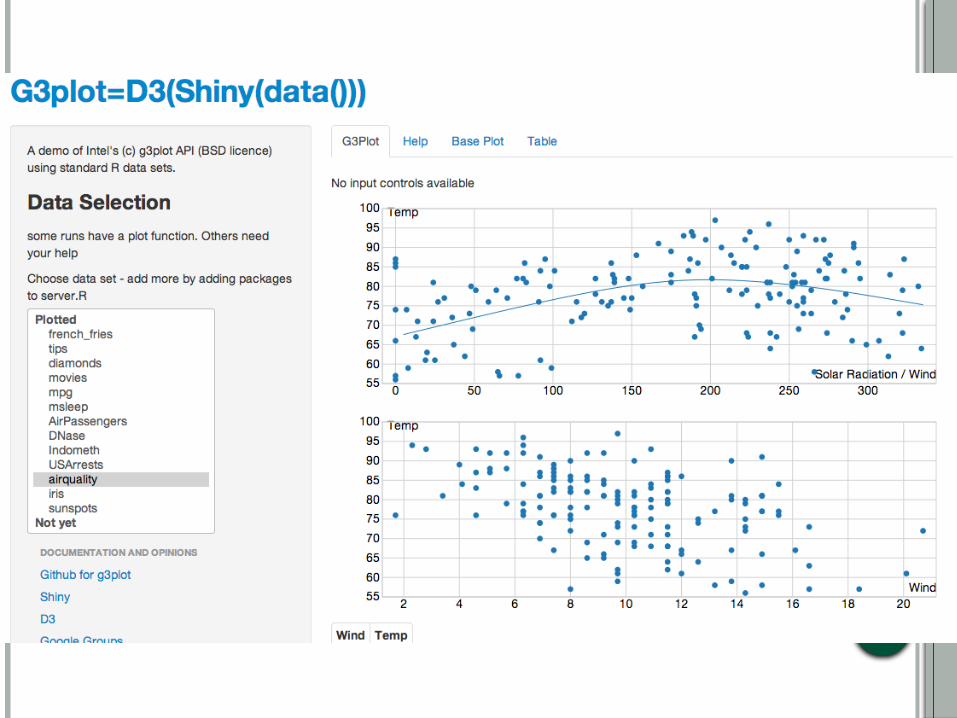
Tutorials Code on GitHub With knowledge of HTML and JavaScript, the
possibilities are endless

HOW CAN A BUSINESS USE SHINY?
Create App User Selects Data/Variables Interactive Modeling Run Scripts for Distribution
CHALLENGES
Debugging Deploying on own server Low flexibility Access levels

FUTURE
Built-in Scheduling Different Layouts/Themes WordPress Plug-in


REFERENCES
http://www.rstudio.com/shiny/


