
Tutorial: Mean Difference Test
T-test, ANOVA, Chi-sq
Number Analytics LLC
March 2017

Coca cola vs Pepsi, taste better?
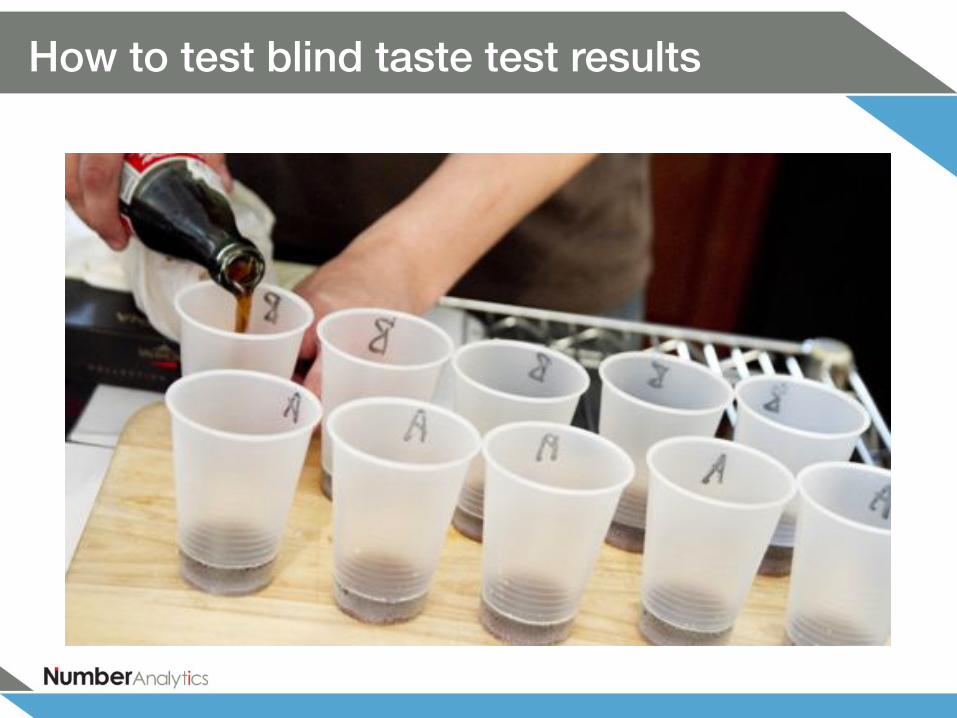
How to test blind taste test results
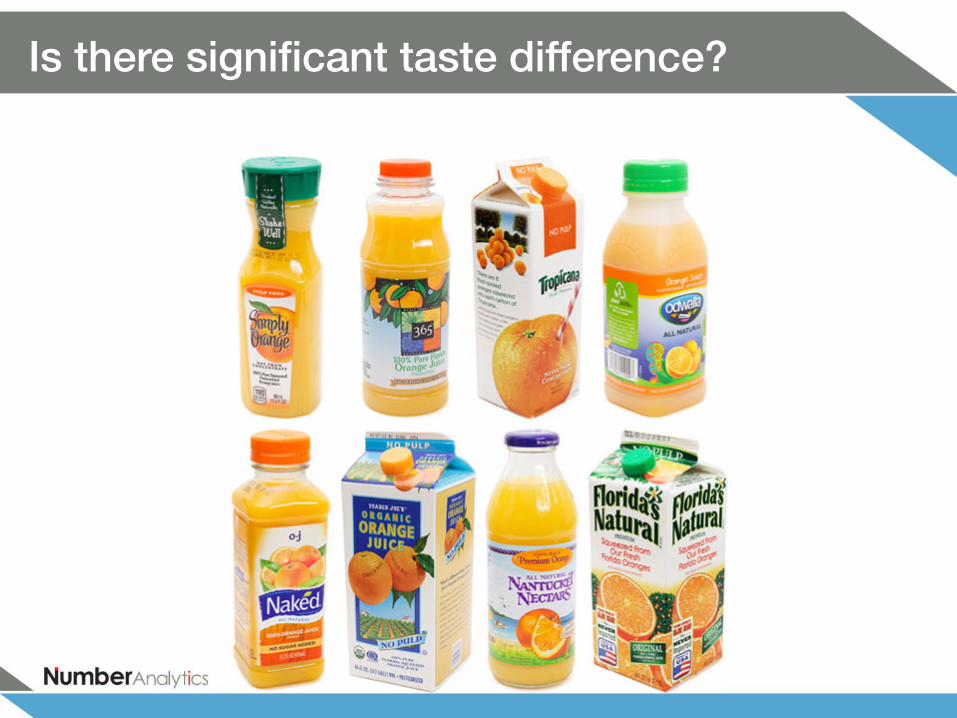
Is there significant taste difference?
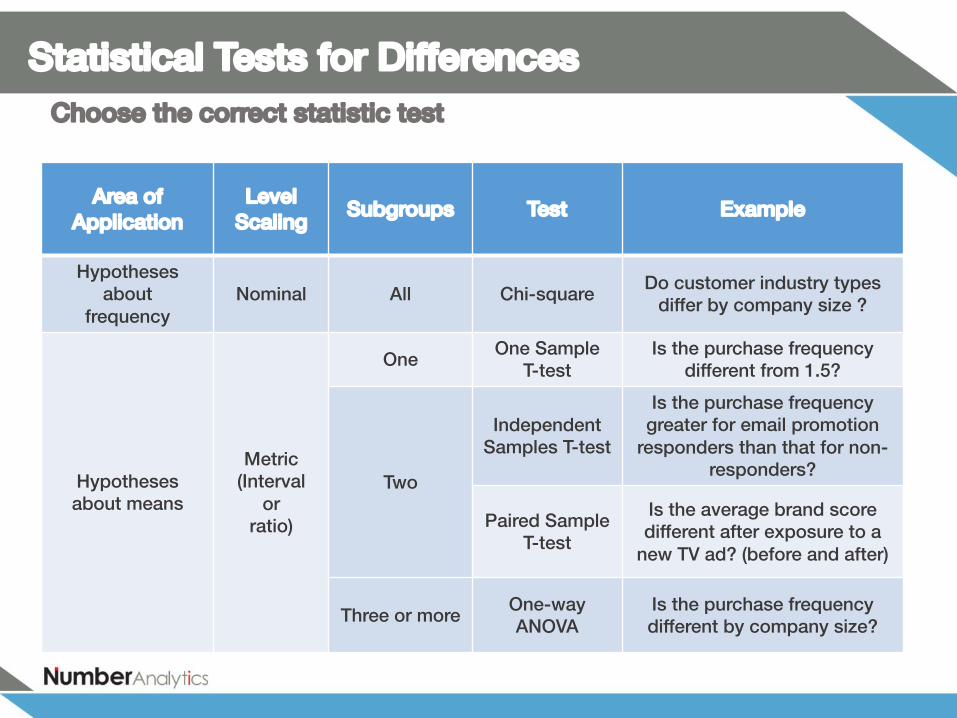
Statistical Tests for DifferencesChoose the correct statistic test
Area of Application
Level Scaling
Subgroups Test Example
Hypotheses about
frequencyNominal All Chi-square
Do customer industry types differ by company size ?
Hypothesesabout means
Metric (Interval
orratio)
OneOne Sample
T-testIs the purchase frequency
different from 1.5?
Two
Independent Samples T-test
Is the purchase frequency greater for email promotion
responders than that for non-responders?
Paired Sample T-test
Is the average brand score different after exposure to a
new TV ad? (before and after)
Three or moreOne-wayANOVA
Is the purchase frequency different by company size?

One Sample T-test

One Sample T-test
You can choose your own file by uploading it to the cloud.
Is the overall rating significantly different than 4?

One Sample T-test
Then manually enter thetest value and choose the sided test.
First select the test variable in your data file
3 STEPS! Easy to apply!
Now click on ‘Run’!

One Sample t-test
Conclusion: Rating is not different from 4 on average.

Independent Samples T-test

Independent Samples T-test
Now we’re interested to know whether
the rating for female group is
significantly different from rating for
male group.
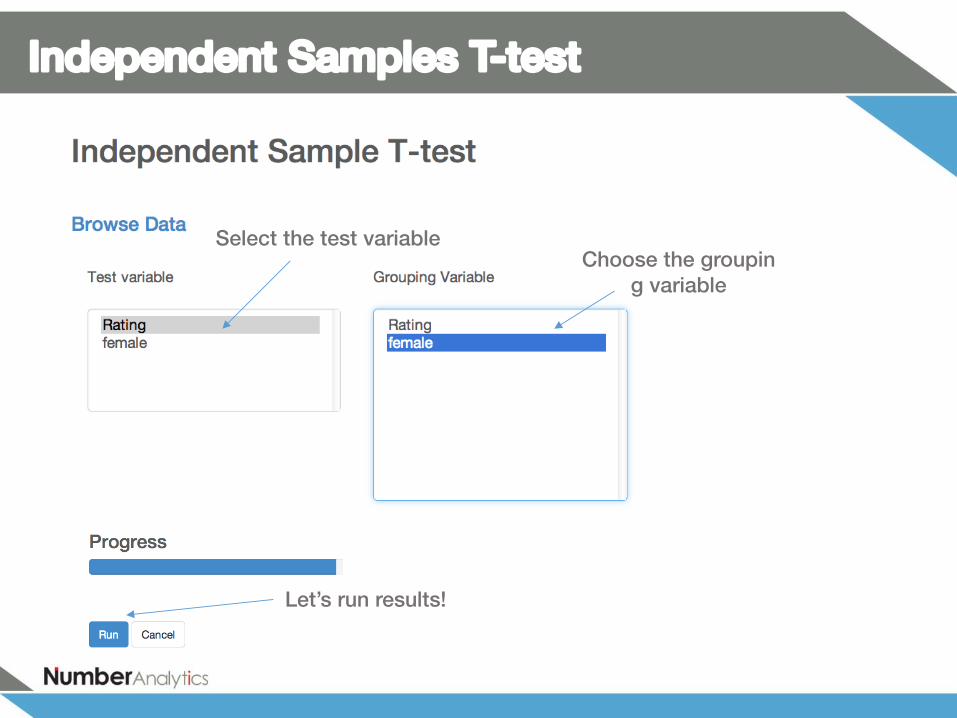
Independent Samples T-test
Choose the grouping variable
Select the test variable
Let’s run results!
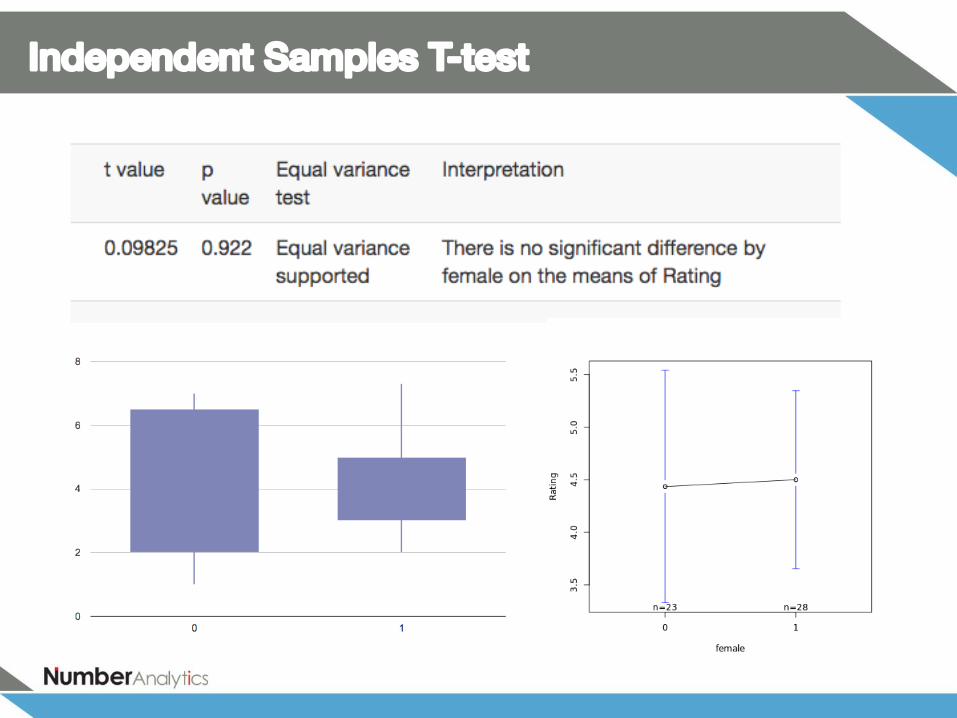
Independent Samples T-test

SPSS style output
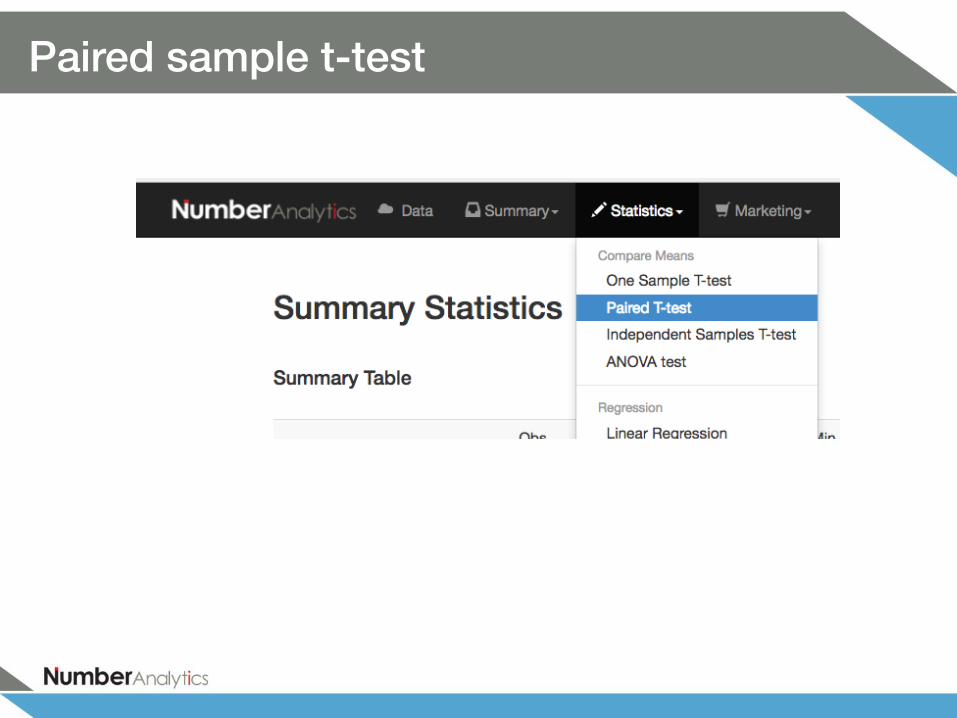
Paired sample t-test
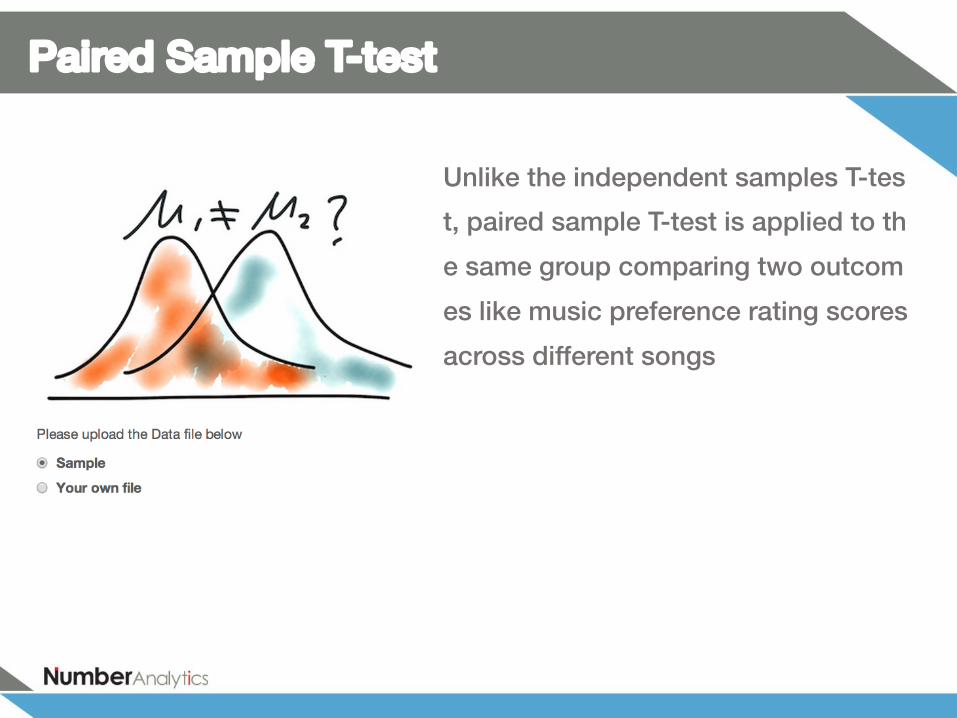
Paired Sample T-test
Unlike the independent samples T-tes
t, paired sample T-test is applied to th
e same group comparing two outcom
es like music preference rating scores
across different songs

Independent Samples T-test
Choose the test variable 2
Select the test variable 1
Let’s run results!

Independent Samples T-test
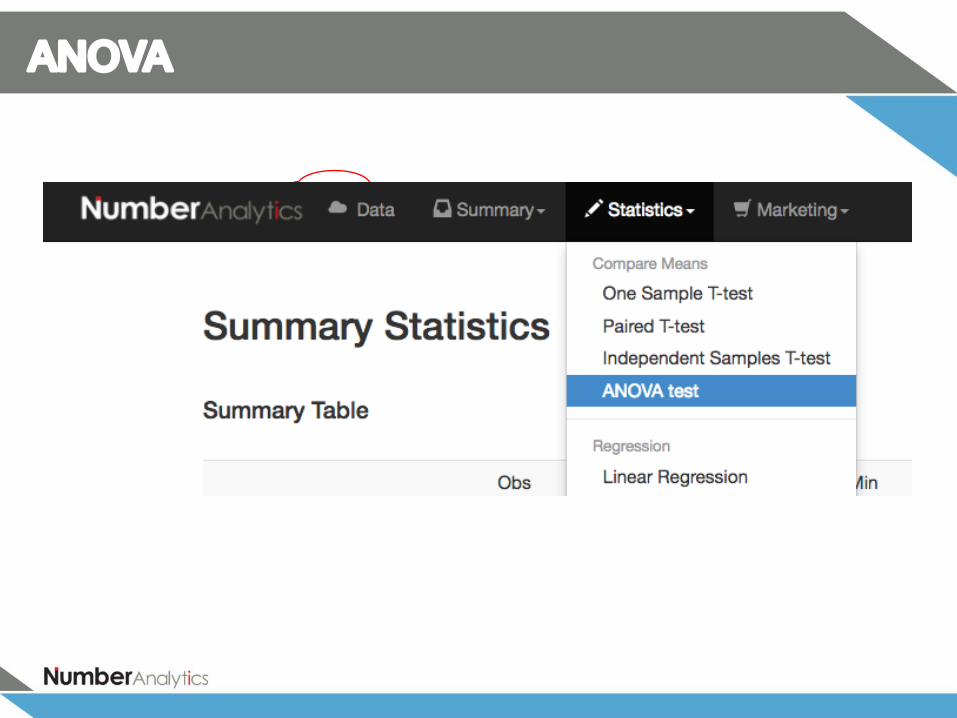
ANOVA

ANOVA
How about the rating amongdifferent ethnical groups?

ANOVA
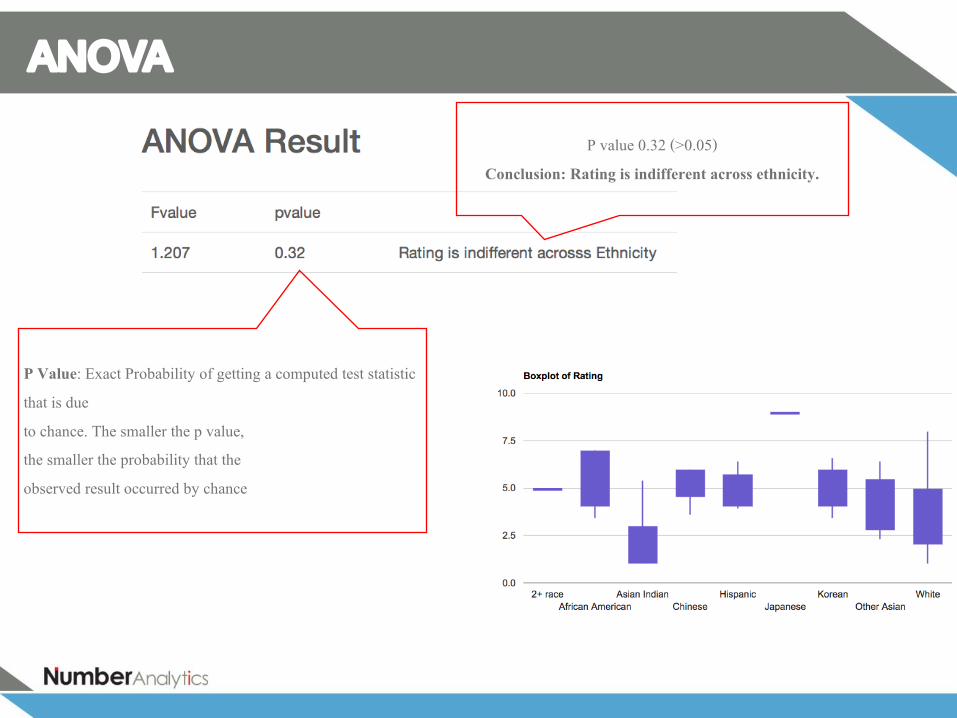
ANOVA
P value 0.32 (>0.05)
Conclusion: Rating is indifferent across ethnicity.
P Value: Exact Probability of getting a computed test statistic
that is due
to chance. The smaller the p value,
the smaller the probability that the
observed result occurred by chance

SPSS style output
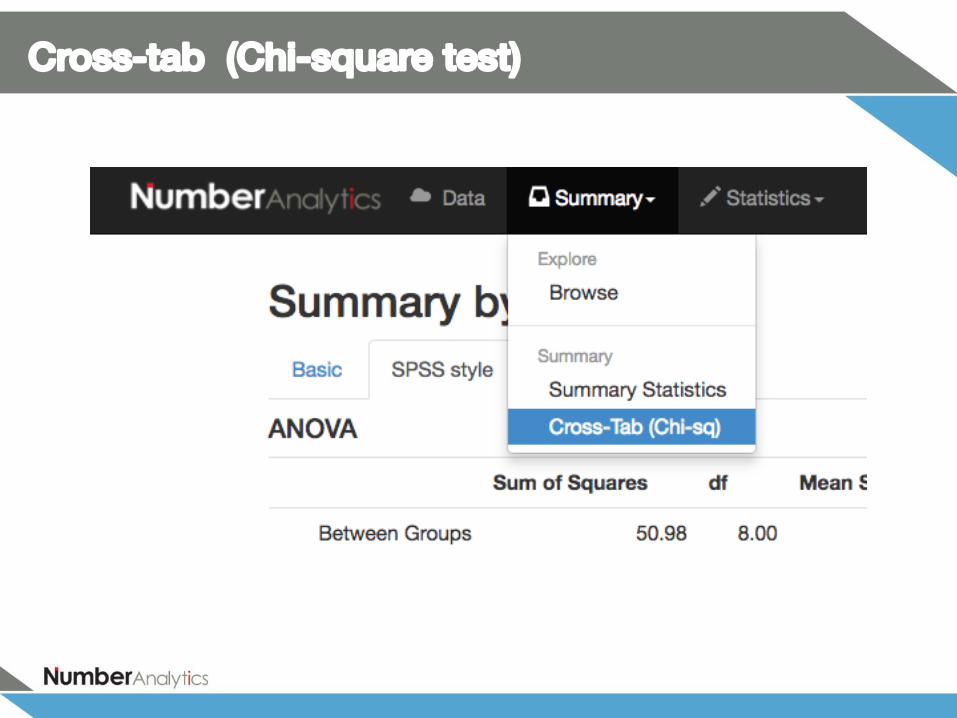
Cross-tab (Chi-square test)
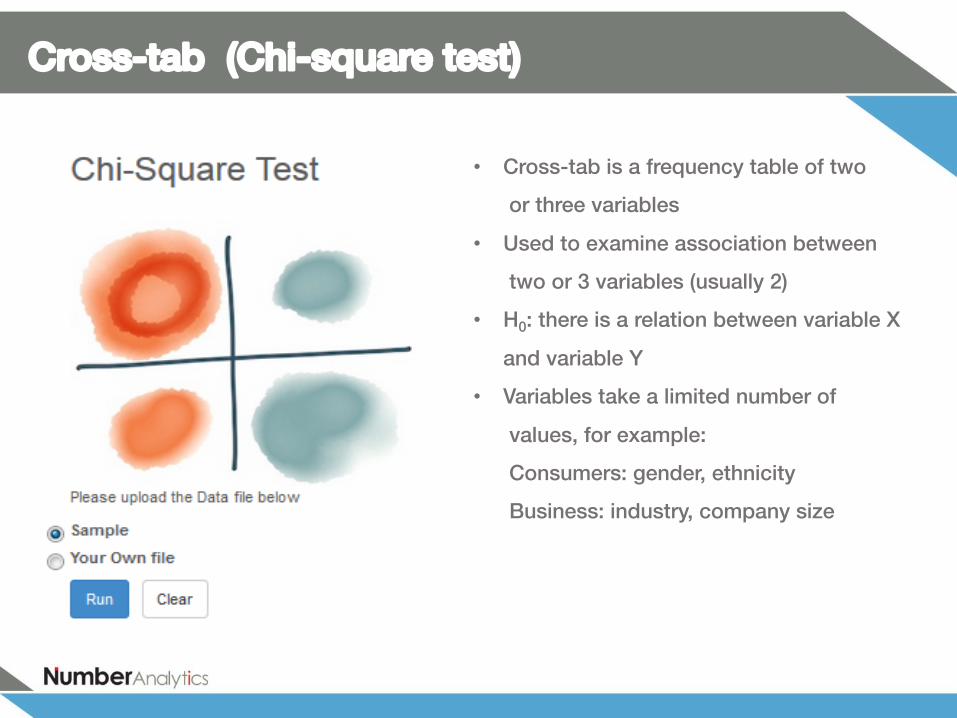
Cross-tab (Chi-square test)
• Cross-tab is a frequency table of two
or three variables
• Used to examine association between
two or 3 variables (usually 2)
• H0: there is a relation between variable X
and variable Y
• Variables take a limited number of
values, for example:
Consumers: gender, ethnicity
Business: industry, company size

Cross-tab (Chi-square test)

Cross-tab (Chi-square test)
P value greater than 0.05, reject H0. Conclusion: There is no relation between
gender and ethnicity

Crosstab table


