
The EUMETSAT Satellite Application Facility
on Land Surface Analysis (Land SAF):
Proposed Products
by:
Alirio Arboleda
Based on material provided by Carla Barroso (IPMA)

OBJECTIVE
• Introduce the EUMETSAT’s Satellite ApplicationFacility (SAF) on Land Surface Analysis (LandSAF) and present the products developed, theircharacteristics and some validation results
• Invite you to use the Land SAF products in yourprojects and applications and to participate to theimprovement of these products by given feedbackto products developers

Satellite Application Facility (SAF) is an European scientific network designed by EUMETSAT.
Objectives
• Improve EUMETSAT’s Member States exploitation of satellite data
• Encourage the utilisation of existing skills and infrastructure in Member States and Cooperating States
• Cost-effective exploitation: Services are distributed in the most appropriate way
• Foster development of cooperation with non-Member States and other organisations
EUMETSAT SAF NETWORK
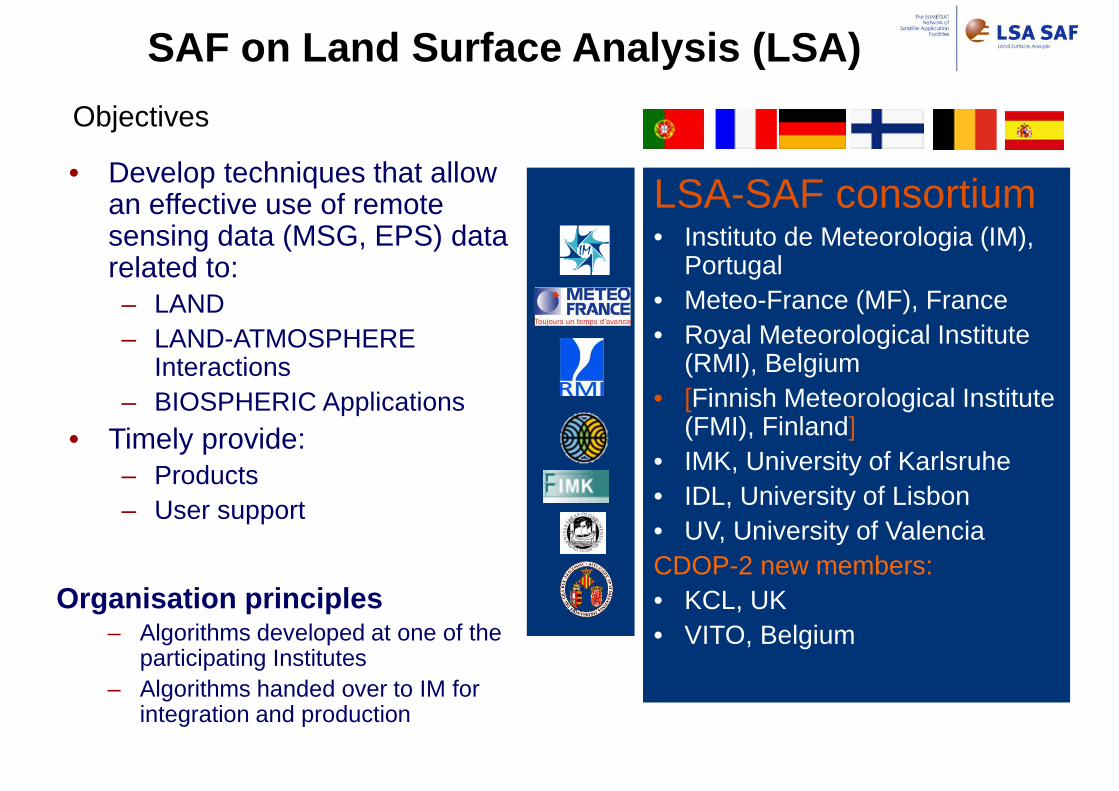
• Develop techniques that allow an effective use of remote sensing data (MSG, EPS) data related to:– LAND– LAND-ATMOSPHERE
Interactions– BIOSPHERIC Applications
• Timely provide:– Products– User support
Objectives
Organisation principles– Algorithms developed at one of the
participating Institutes– Algorithms handed over to IM for
integration and production
LSA-SAF consortium• Instituto de Meteorologia (IM),
Portugal• Meteo-France (MF), France• Royal Meteorological Institute
(RMI), Belgium• [Finnish Meteorological Institute
(FMI), Finland]• IMK, University of Karlsruhe• IDL, University of Lisbon• UV, University of ValenciaCDOP-2 new members:• KCL, UK• VITO, Belgium
SAF on Land Surface Analysis (LSA)

Dev. Phase:
Sep 1999
Initial
Operations
Phase:
Feb 2005
Continuous
Development &
Operations Phase:
Mar 2007
Continuous
Development &
Operations Phase 2:
Mar 2012
02 03 04 05 06 07 08 10 11 12 13 14 15 16 17 18 19 20010099
Meteosat-8 (MSG-1)
Meteosat-9 (MSG-2)
MetOp-A
Meteosat-10 (MSG-3)
MetOp-BMeteosat-11 (MSG-4) MTG-1
MetOp-C
21 22
MTG-S
LSA-SAF chronogram of activities
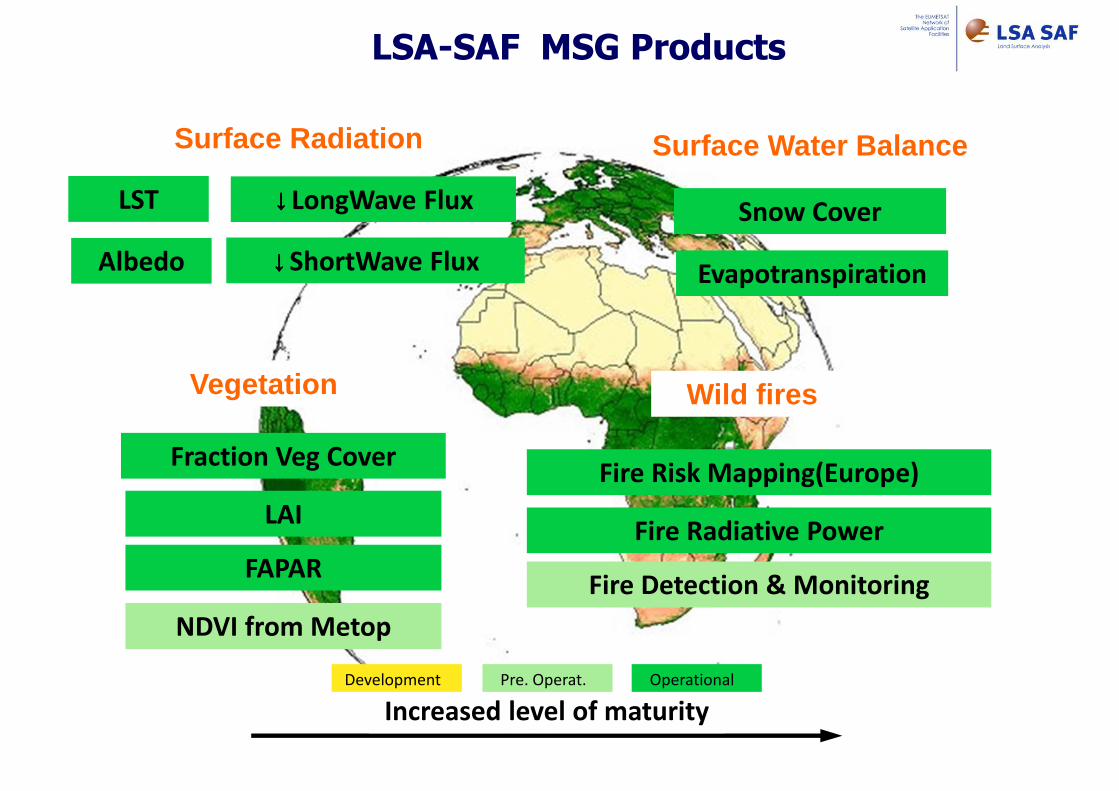
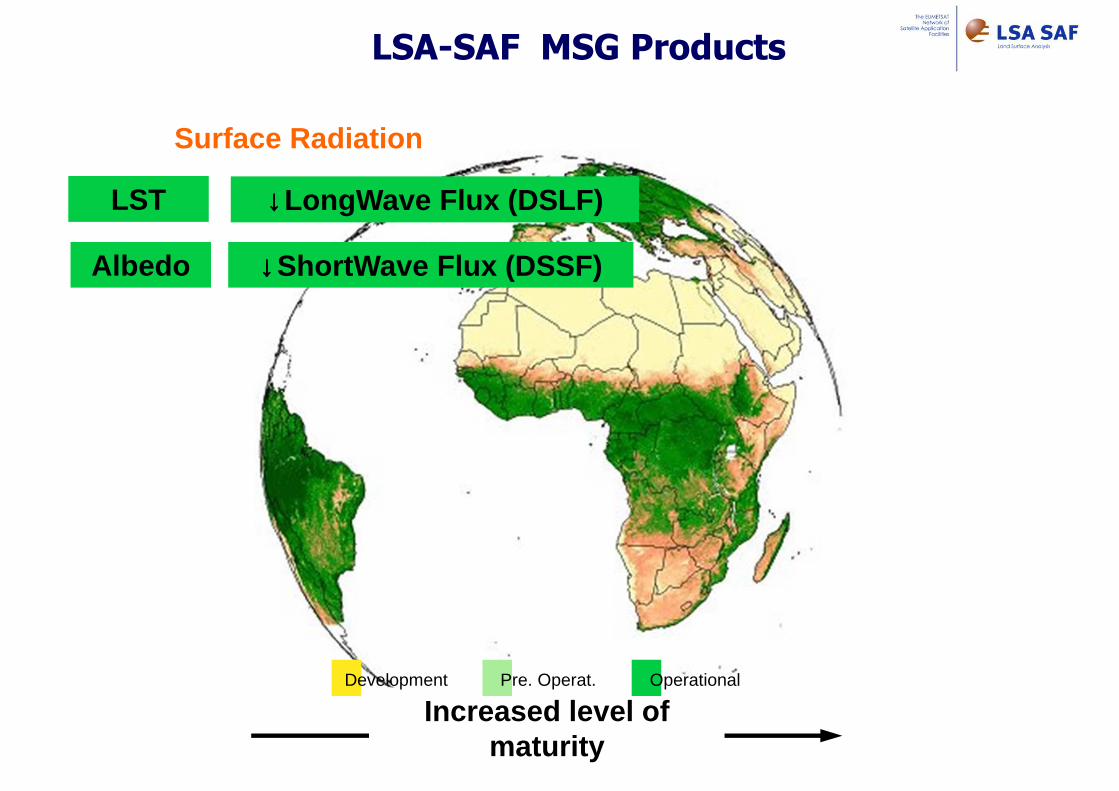
Surface Radiation
↓↓↓↓LongWave Flux
↓↓↓↓ShortWave Flux
Surface Water Balance
Snow Cover
Vegetation
Fraction Veg Cover
LAI
FAPAR
Wild fires
LSA-SAF MSG Products
Increased level of maturity
Development Pre. Operat. Operational
Fire Radiative Power
LST
EvapotranspirationAlbedo
Fire Detection & Monitoring
Fire Risk Mapping(Europe)
NDVI from Metop
Variable time resolution-15 min to 10 days
SEVIRI resolution
EPS products generation for a subset of variables(LST, DSLF, NDVI)
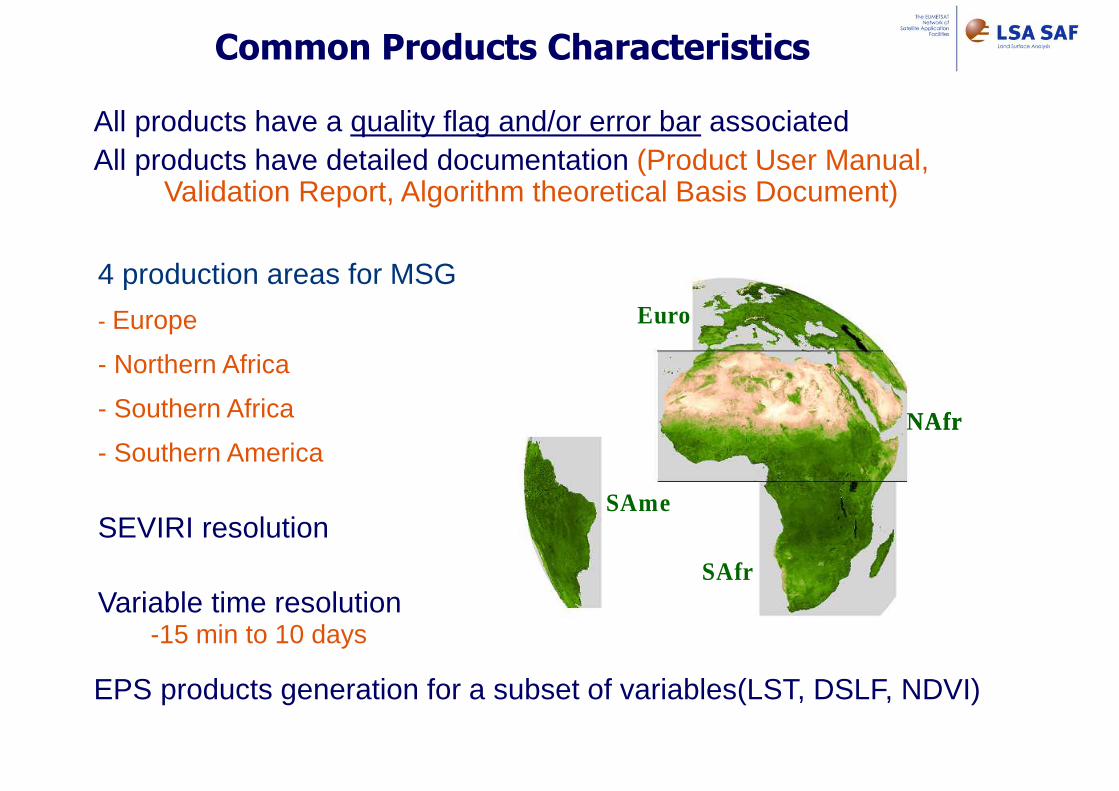
All products have a quality flag and/or error bar associatedAll products have detailed documentation (Product User Manual,
Validation Report, Algorithm theoretical Basis Document)
Euro
NAfr
SAme
SAfr
Euro
NAfr
SAme
SAfr
4 production areas for MSG
- Europe
- Northern Africa
- Southern Africa
- Southern America
Common Products Characteristics
↓↓↓↓LongWave Flux (DSLF)
↓↓↓↓ShortWave Flux (DSSF)
Increased level of maturity
Development Pre. Operat. Operational
LST
Albedo
Surface Radiation
LSA-SAF MSG Products
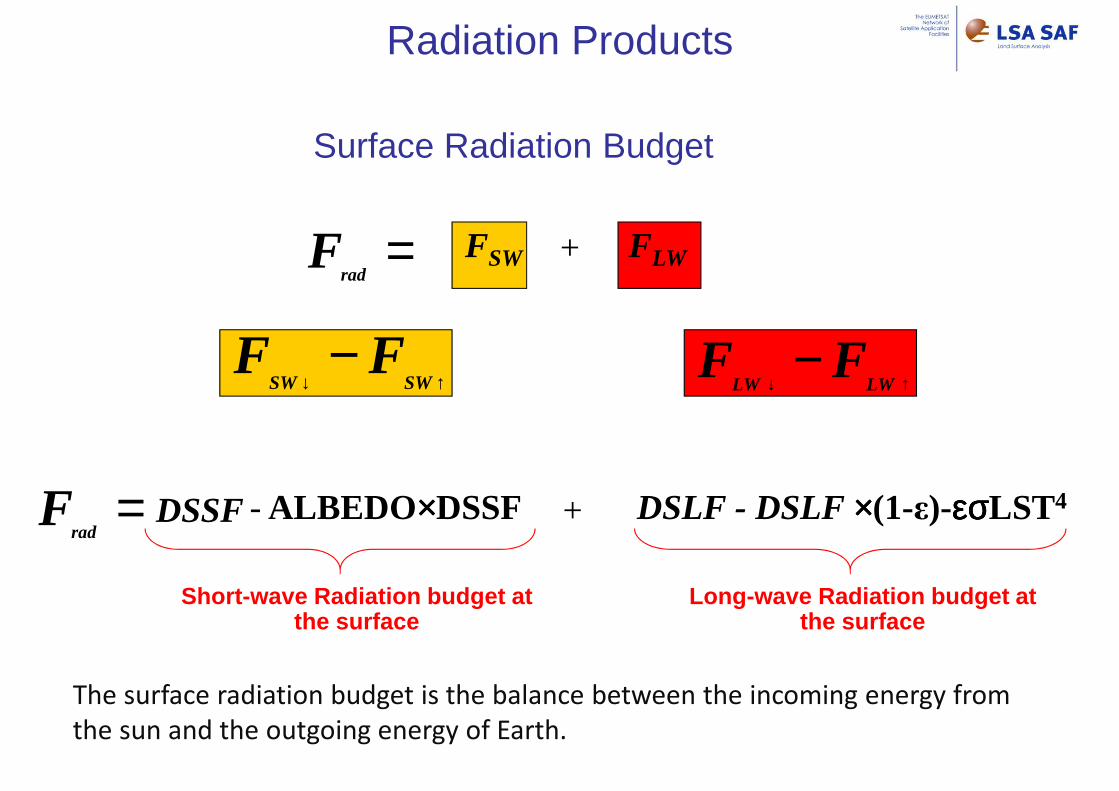
=rad
F
↑↓−
SWSWFF
FSW + FLW
↑↓−
LWLWFF↑↓
−SWSW
FF
DSSF - ALBEDO××××DSSF + DSLF - DSLF ××××(1-ε)-εσεσεσεσLST4=rad
F
Long-wave Radiation budget at the surface
Short-wave Radiation budget at the surface
Radiation Products
The surface radiation budget is the balance between the incoming energy from
the sun and the outgoing energy of Earth.
Surface Radiation Budget

Radiation Products - DSSF
LSA SAF method (Geiger et al., 2008)Input data:•0.6, 0.8 and 1.6 µm SEVIRI channels• TCWV from ECMWF•Cloud mask from NWCSAF
Downwelling Surface Shortwave FluxRadiative energy flux in the wavelength interval [0.3µm, 4.0µm] reaching the Earth's surface per time and surface unit.

atmsurf
atmeffective AA1
1TT
−=
Simplified physical description of the radiation transfer in the cloud-atmosphere-surface system
The effective transmittance of the atmosphere is a funtion of atmospheric constituents
Radiation Products - DSSF
MethodologyeffectivesunTtvSDSSF θcos)(0≈
Solar Constant
Distance sun-earth
(jday)
Solar zenith angle
Effective transmittance
cloudsurfcloudbelowatm
cloudatmeffective AAT
TTT
__1−=
Atmosphere transmittance
Cloud albedoSurface albedo
Cloud transmittance

ProductProductProductProduct HorizontHorizontHorizontHorizontal al al al
ResolutiResolutiResolutiResolution & on & on & on &
CoveragCoveragCoveragCoverageeee
Temporal Temporal Temporal Temporal ResolutionResolutionResolutionResolution
GeneraGeneraGeneraGeneration tion tion tion
FrequeFrequeFrequeFrequencyncyncyncy
Target Target Target Target AccuraAccuraAccuraAccura
cycycycy
DSSFDSSFDSSFDSSF MSG MSG MSG MSG diskdiskdiskdisk
InstantaneoInstantaneoInstantaneoInstantaneous & Dailyus & Dailyus & Dailyus & Daily
30 min 30 min 30 min 30 min & Daily& Daily& Daily& Daily
5555----10 %10 %10 %10 %
=> completed with METOP/AVHRR to improve high latitudes coverage
Radiation Products - DSSF
Characteristics
Instantaneous (30 min) DSSF

Monthly variation of daily accumulated Solar Radiation
15 Jan 2009 15 March 2009 15 May 2009
15 July 2009 15 Sep 2009 15 Nov 2009
Radiation Products - DSSF

Validation at measurement sites
Radiation Products - DSSF
Validation

2004 to 2006
Clear sky:biais : 5 W/m2 stdev : 40 W/m2
Cloudy sky:biais : 5 W/m2 stdev : 115 W/m2
Radiation Products - DSSF
Validation
Snow
Snow
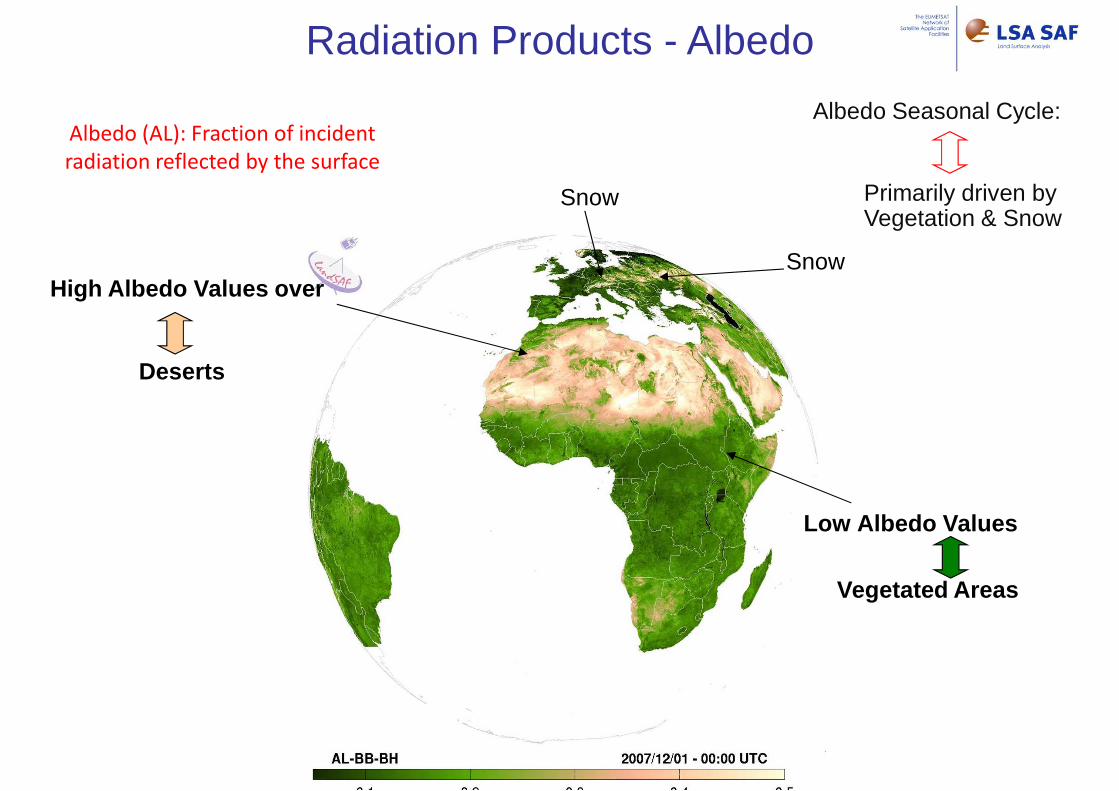
Albedo Seasonal Cycle:
Primarily driven by Vegetation & Snow
High Albedo Values over
Deserts
Low Albedo Values
Vegetated Areas
Radiation Products - Albedo
Albedo (AL): Fraction of incident
radiation reflected by the surface
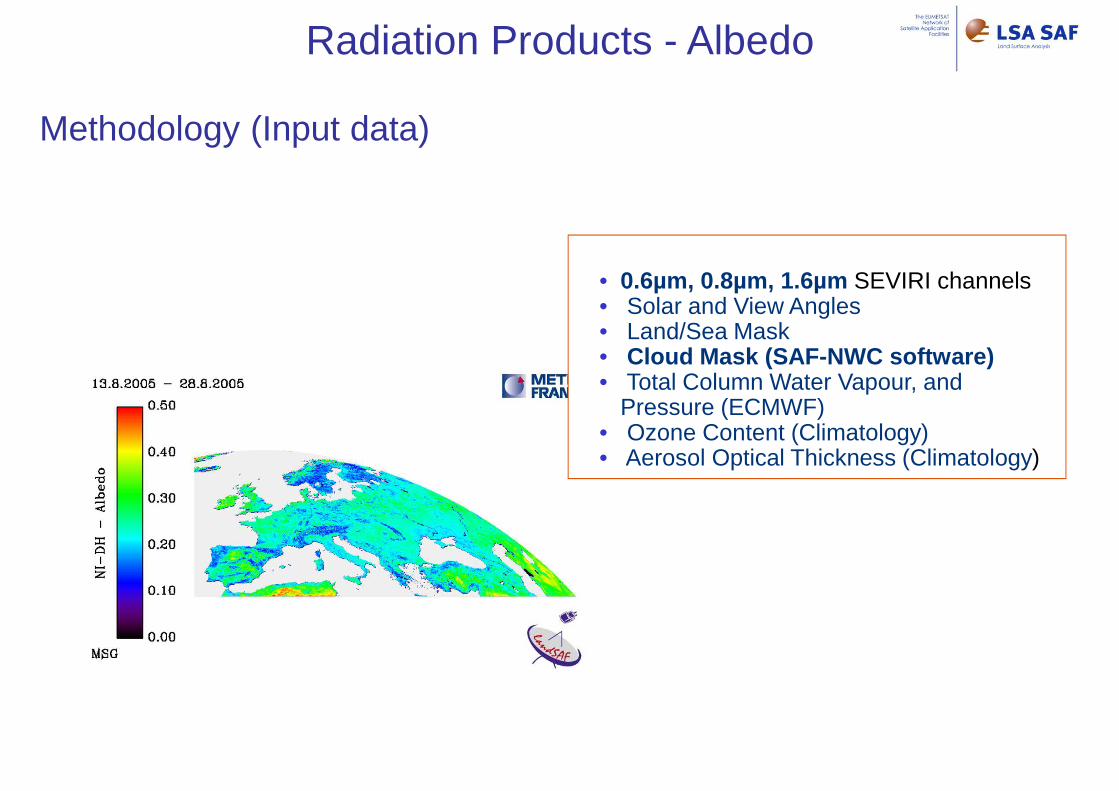
• 0.6µm, 0.8µm, 1.6µm SEVIRI channels• Solar and View Angles• Land/Sea Mask• Cloud Mask (SAF-NWC software)• Total Column Water Vapour, and
Pressure (ECMWF)• Ozone Content (Climatology)• Aerosol Optical Thickness (Climatology)
1.6µm
Methodology (Input data)
Radiation Products - Albedo
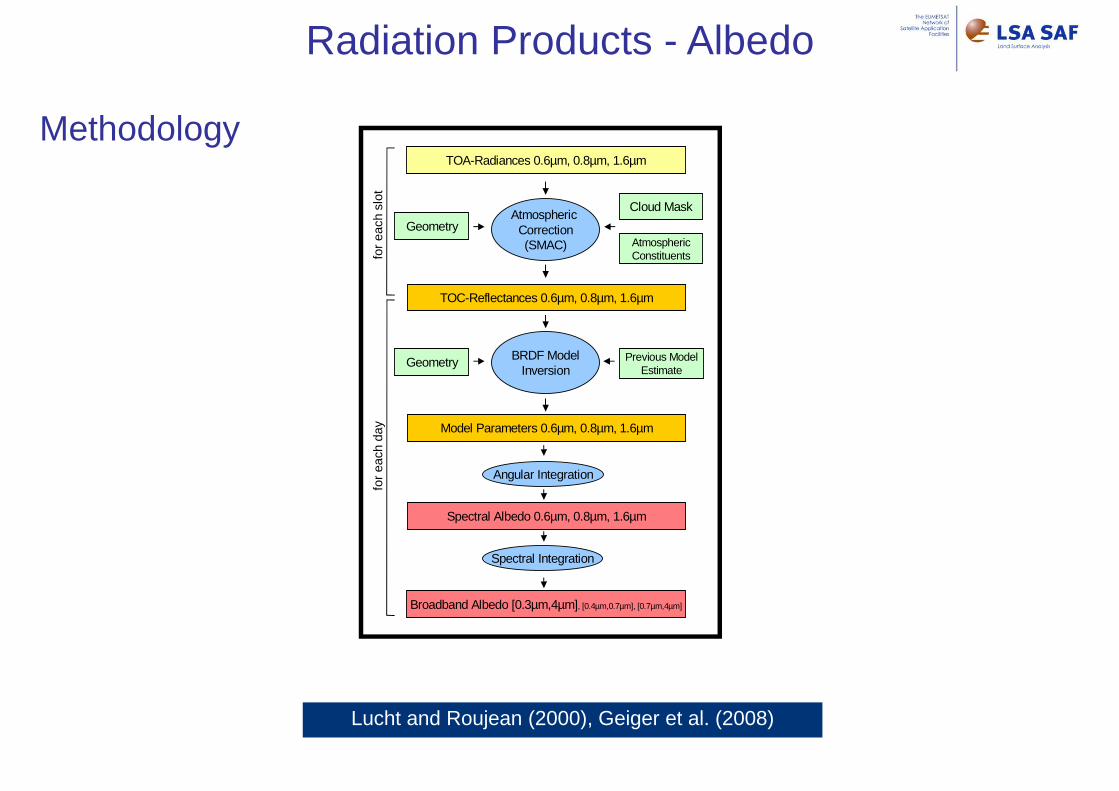
Model Parameters 0.6µm, 0.8µm, 1.6µm
BRDF ModelInversion
Geometry Previous ModelEstimate
Spectral Albedo 0.6µm, 0.8µm, 1.6µm
Angular Integration
Broadband Albedo [0.3µm,4µm], [0.4µm,0.7µm], [0.7µm,4µm]
TOA-Radiances 0.6µm, 0.8µm, 1.6µm
TOC-Reflectances 0.6µm, 0.8µm, 1.6µm
Atmospheric Correction(SMAC)
GeometryAtmosphericConstituents
Cloud Mask
Spectral Integration
for
each
day
for
each
slo
t
Lucht and Roujean (2000), Geiger et al. (2008)
Radiation Products - Albedo
Methodology

Modis SW-BH albedo
ground measurementsMSG albedo
boreal forest
mixed shrub/tree
Radiation Products - Albedo
Validation
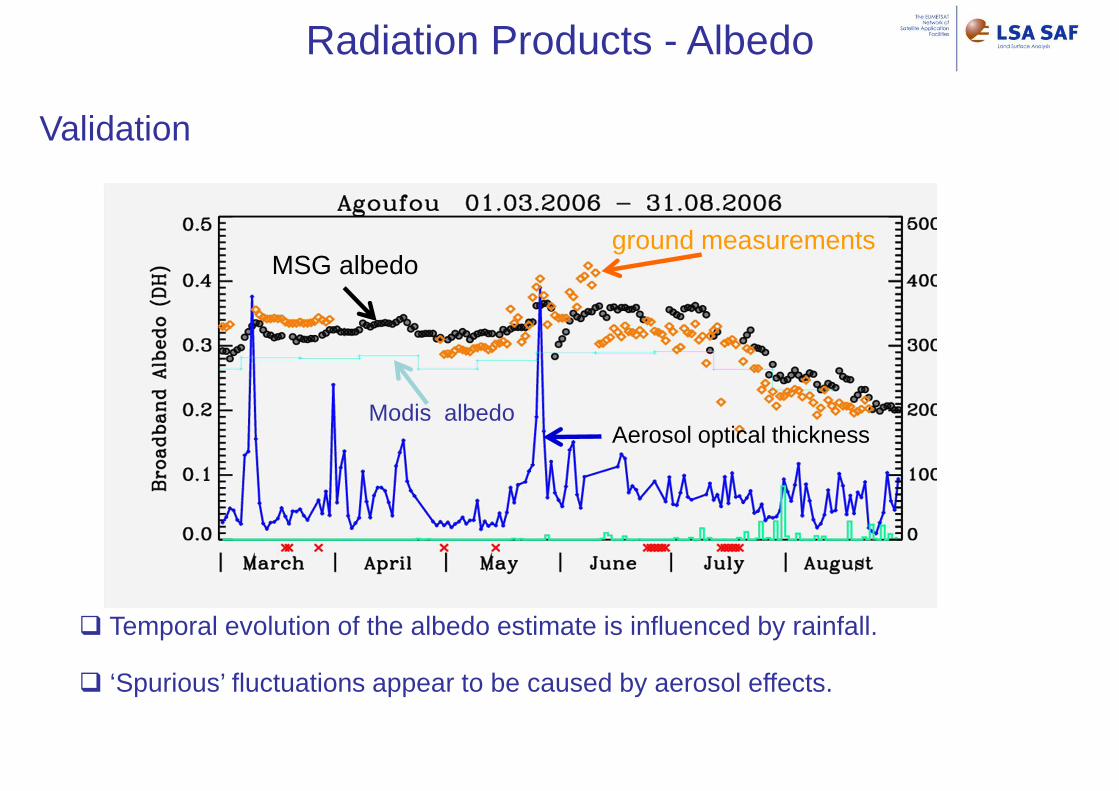
� Temporal evolution of the albedo estimate is influenced by rainfall.
� ‘Spurious’ fluctuations appear to be caused by aerosol effects.
Radiation Products - Albedo
Validation
MSG albedo
Modis albedoAerosol optical thickness
ground measurements
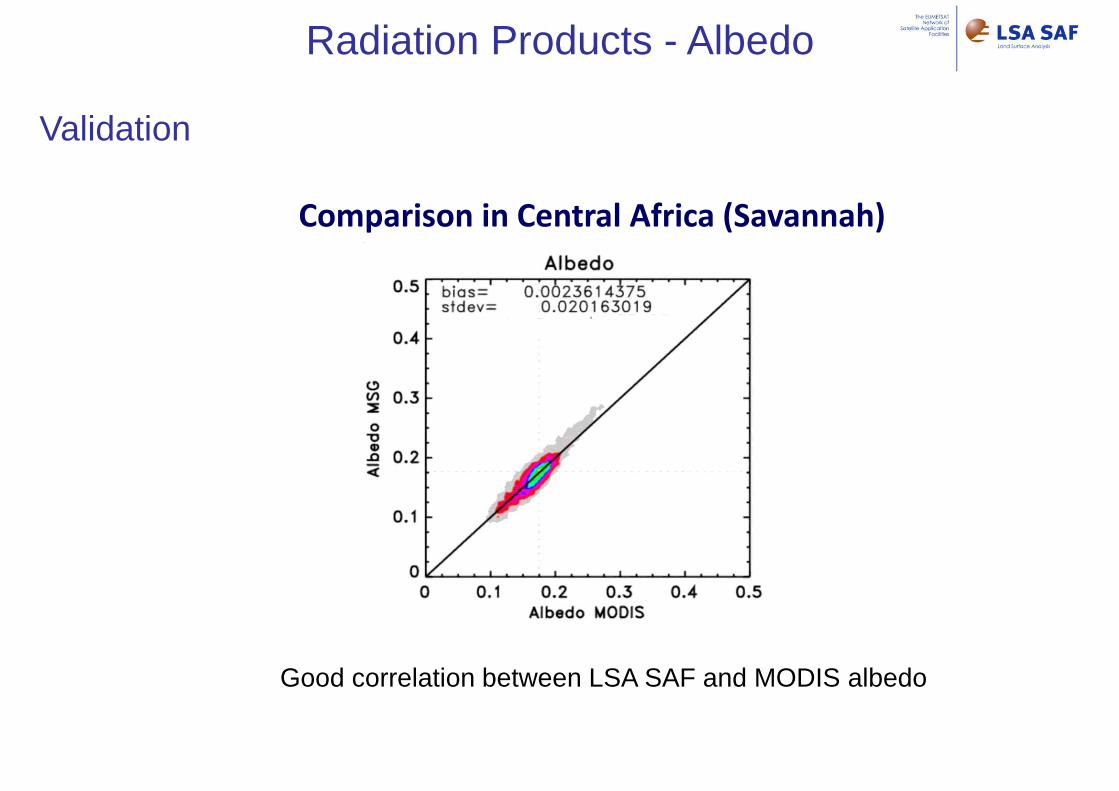
Good correlation between LSA SAF and MODIS albedo
Comparison in Central Africa (Savannah)
Radiation Products - Albedo
Validation
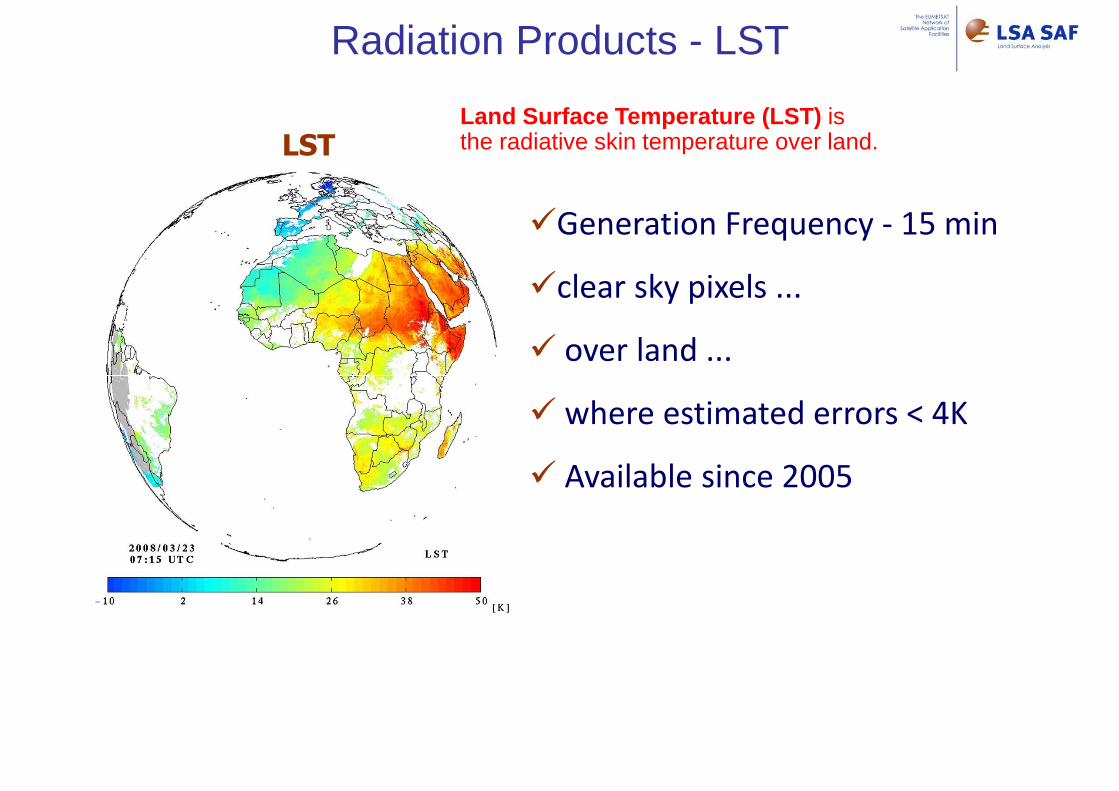
LST
�Generation Frequency - 15 min
�clear sky pixels ...
� over land ...
� where estimated errors < 4K
� Available since 2005
Radiation Products - LST
Land Surface Temperature (LST) is the radiative skin temperature over land.
C2
TT)
ε
∆εB
ε
ε1B(B
2
TT)
ε
∆εA
ε
ε1A(ASTL 12.010.8
232112.010.8
2321 +−+−++++−+=
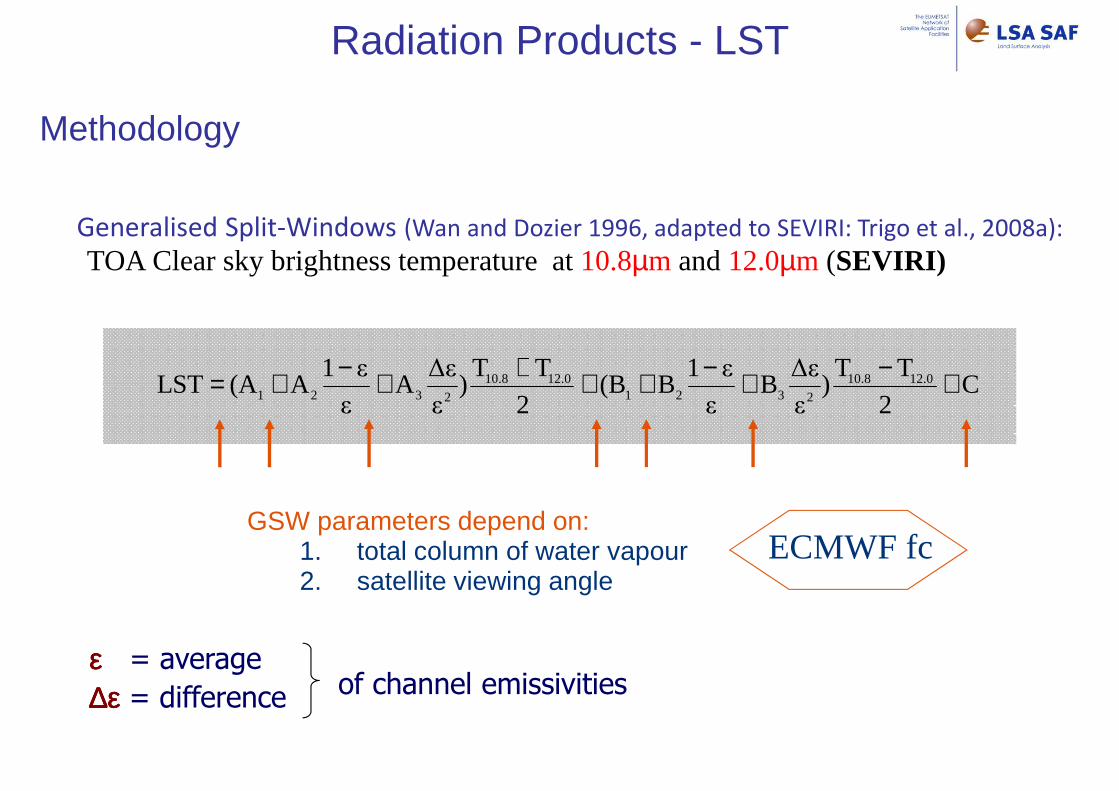
Generalised Split-Windows (Wan and Dozier 1996, adapted to SEVIRI: Trigo et al., 2008a):
TOA Clear sky brightness temperature at 10.8µm and12.0µm (SEVIRI)
εεεε = average
∆ε∆ε∆ε∆ε = difference of channel emissivities
GSW parameters depend on:1. total column of water vapour2. satellite viewing angle
ECMWF fc
Radiation Products - LST
Methodology
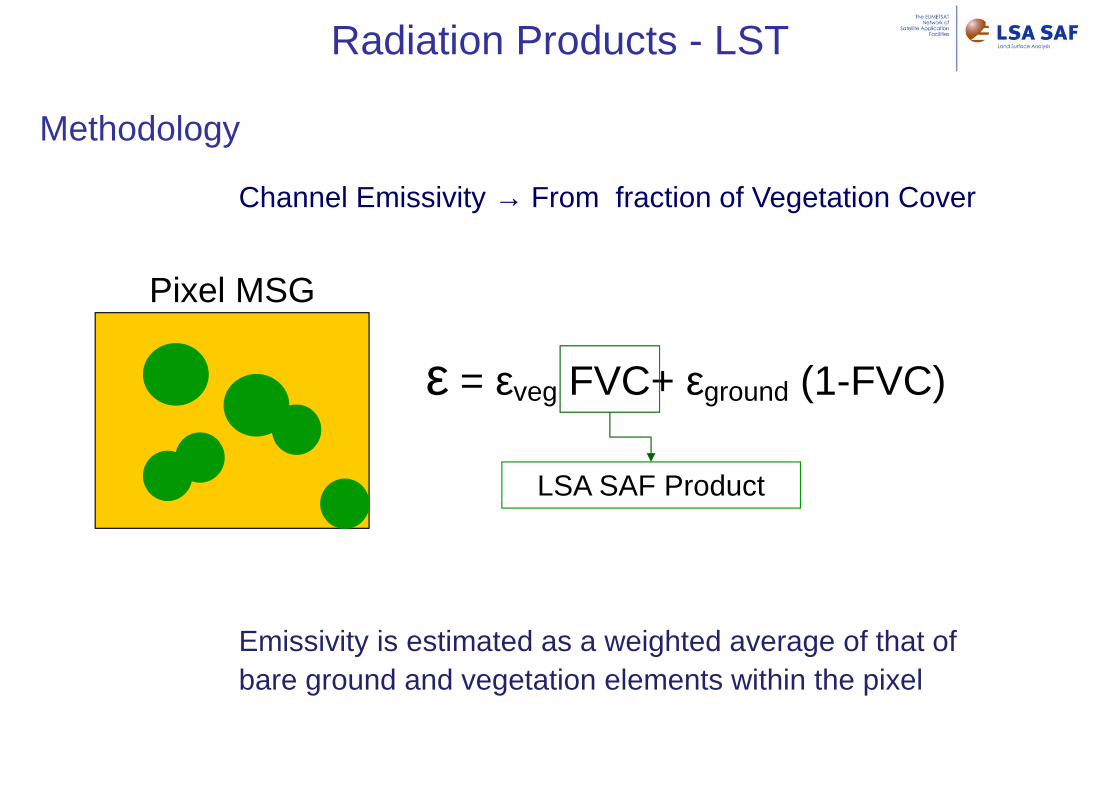
ε = εveg FVC+ εground (1-FVC)
LSA SAF Product
Pixel MSG
Methodology
Radiation Products - LST
Channel Emissivity → From fraction of Vegetation Cover
Emissivity is estimated as a weighted average of that of bare ground and vegetation elements within the pixel
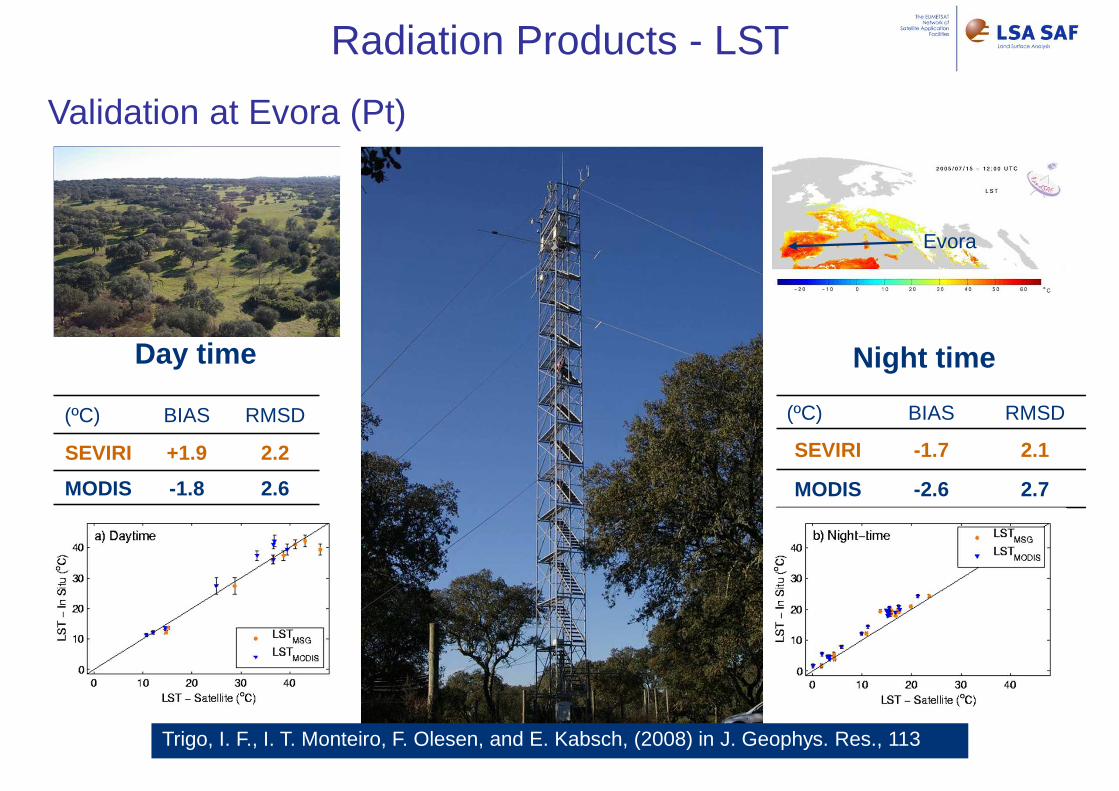
(ºC) BIAS RMSD
SEVIRI +1.9 2.2
MODIS -1.8 2.6
Day time
(ºC) BIAS RMSD
SEVIRI -1.7 2.1
MODIS -2.6 2.7
Trigo, I. F., I. T. Monteiro, F. Olesen, and E. Kabsch, (2008) in J. Geophys. Res., 113
Night time
Evora
Radiation Products - LST
Validation at Evora (Pt)

Freitas, S. C., I. F. Trigo, J. M. Bioucas-Dias, F.M. Goettche, 2010 in IEEE TGRS
0 20 40 60LST SEVIRI/MSG (ºC)
Bias: -0.31ºCRMS: 1.16ºC
May 200860
40
20
0
Obs
In S
itu (
ºC)
Bias: -0.91ºCRMS: 1.67ºC
Jul 200860
40
20
0
Obs
In S
itu (
ºC)
0 20 40 60LST SEVIRI/MSG (ºC)
60
40
20
0
Obs
In S
itu (
ºC)
Nov 2008
0 20 40 60LST SEVIRI/MSG (ºC)
Bias: +0.24ºCRMS: 1. 44ºC
Radiation Products - LST
Validation at Gobabe (NA)
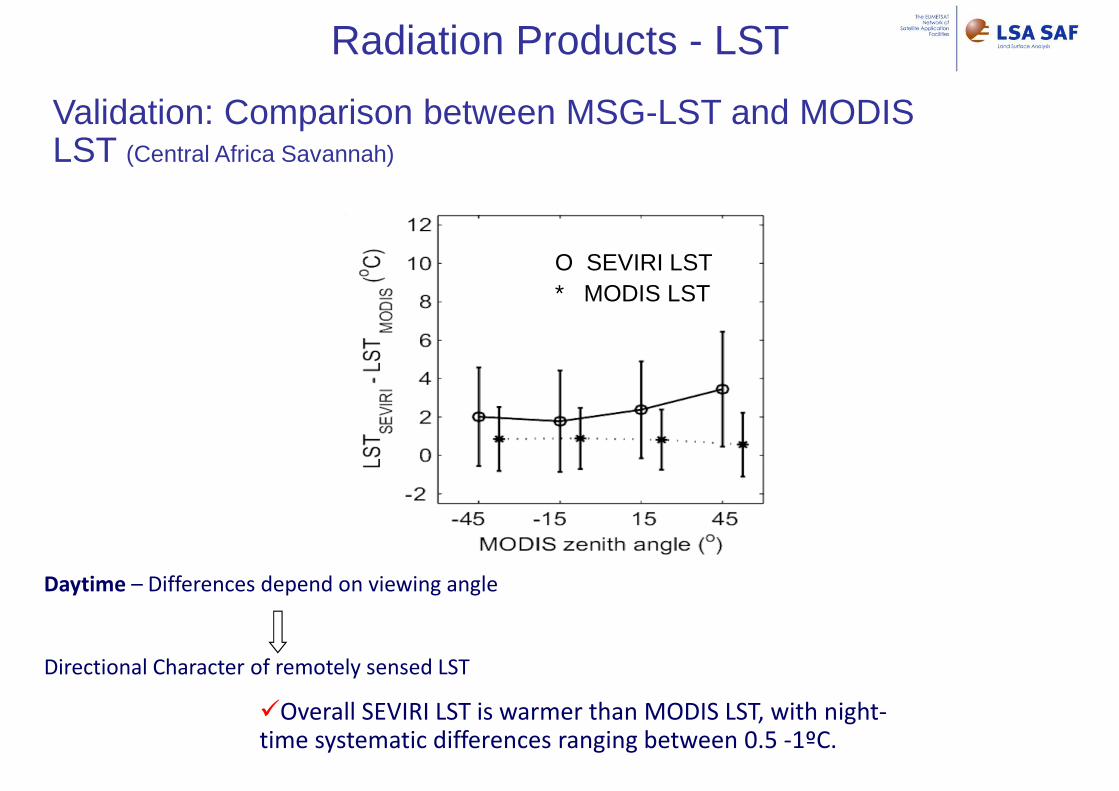
�Overall SEVIRI LST is warmer than MODIS LST, with night-time systematic differences ranging between 0.5 -1ºC.
Directional Character of remotely sensed LST
Daytime – Differences depend on viewing angle
Radiation Products - LST
Validation: Comparison between MSG-LST and MODIS LST (Central Africa Savannah)
O SEVIRI LST* MODIS LST
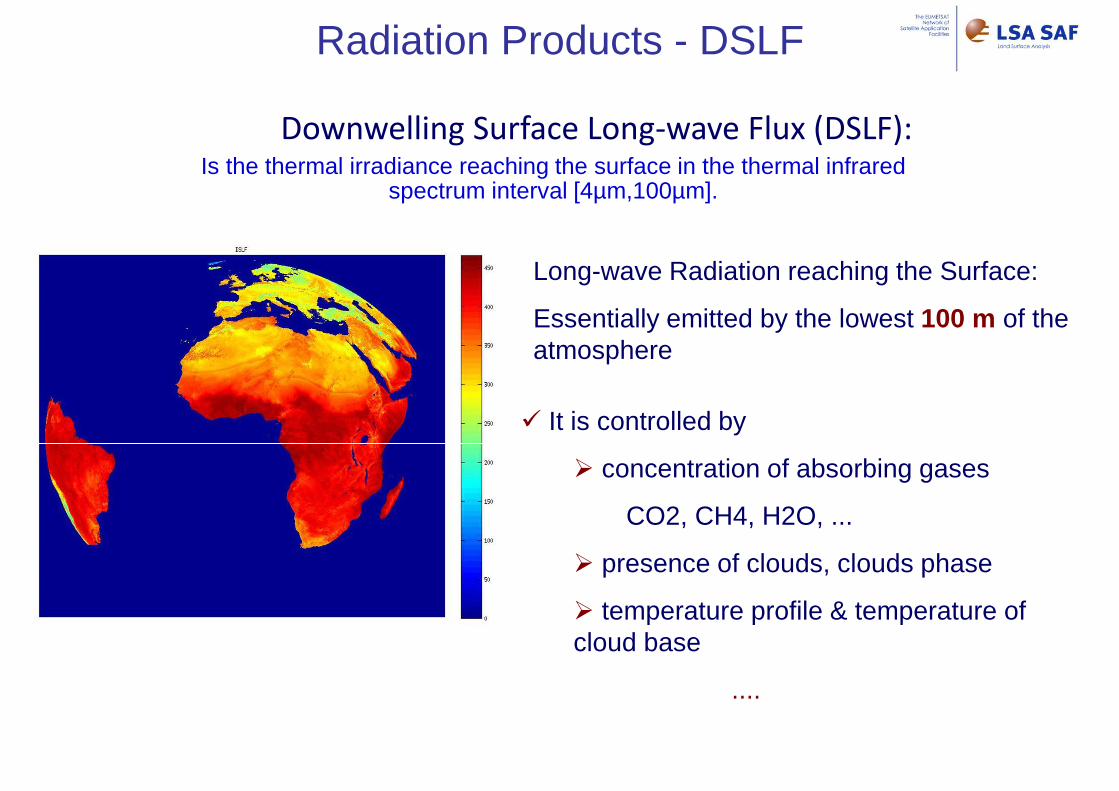
Radiation Products - DSLF
Downwelling Surface Long-wave Flux (DSLF):Is the thermal irradiance reaching the surface in the thermal infrared
spectrum interval [4µm,100µm].
Long-wave Radiation reaching the Surface:
Essentially emitted by the lowest 100 m of the atmosphere
� It is controlled by
� concentration of absorbing gases
CO2, CH4, H2O, ...
� presence of clouds, clouds phase
� temperature profile & temperature of cloud base
....

Total irradiance at the surface within the [4 – 100 µµµµm] interval:
clearcloudyskysky DSLFnnDSLFTDSLF )1(4 −+== σε
+−
+−=m
sky
ww
10exp
1011 βαε ( )δγ +∆+= 22 TdTTsky
Cloud
Fraction of Cloud
Total column water vapour
2m air temperature
2m dew point depression
Bulk Parameterization based on the Stefan-Boltzman Law:
Trigo et al. (2010)
Radiation Products - DSLF
Methodology

Example of instantaneous DSLF product and associated quality flag for 14/03/2014 at 12:00 UTC
Radiation Products - DSLF

15 Jan 2011 15 Apr 2011
15 Jul 2011 15 Oct 2011
Radiation Products - DSLF

CERES SEVIRI DSLFPeriodJan 2006 - Apr 2007
StationsCambourne, UKLerwick, UKToravere, Estonia
CERES SEVIRI DSLF
Bias RMSE Bias RMSE
Clear Sky -0.0 12.7 -2.2 22.3
All Sky -2.1 23.5 3.1 25.3
Problems:
- Cloud identification at the edge
of Meteosat disk
- DSLF model for ice clouds
- Temperature inversions
○ clear sky▪ cloudy sky
Radiation Products - DSLF
Validation: Northern Europe station
CERES SEVIRI DSLF
Bias RMSE Bias RMSE
Clear Sky -0.9 13.4 0.8 14.5
All Sky -1.4 22.7 1.6 22.5
Problems:
- temperature inversions
CERES
○ clear sky▪ cloudy sky
SEVIRI DSLFPeriodJan 2006 - Apr 2007
StationsPalaiseau, FrancePayerne, CHCarpentras, France
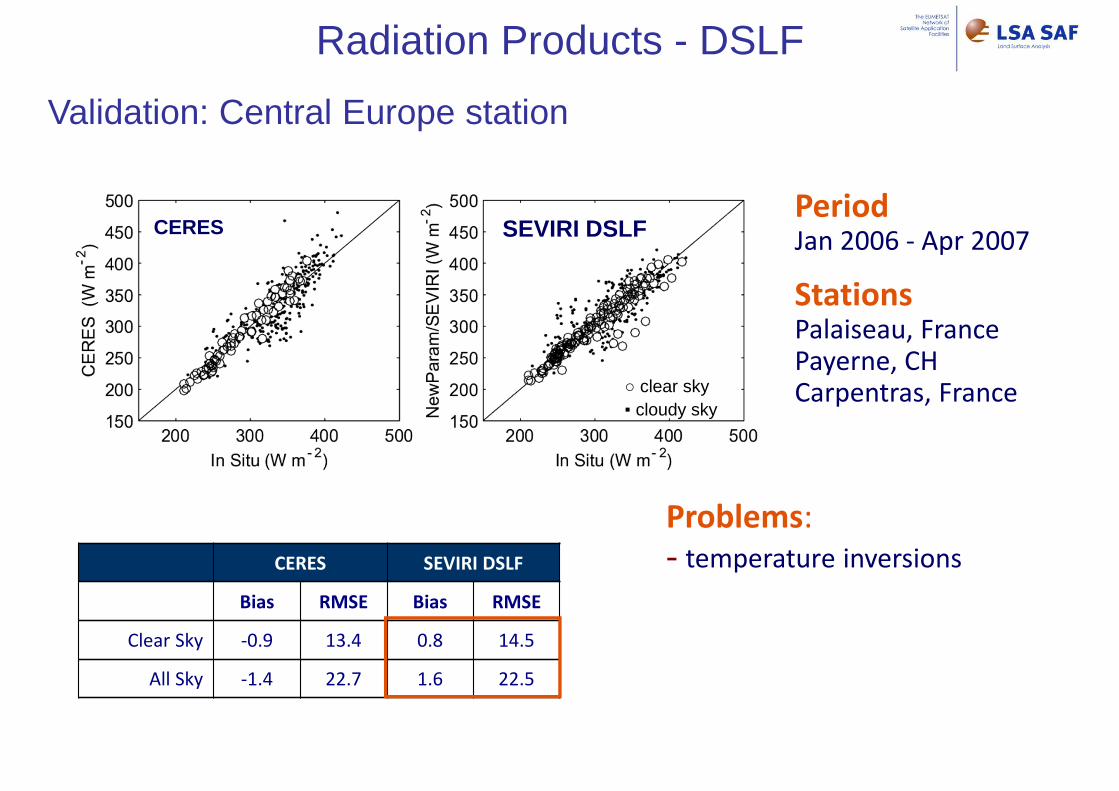
Radiation Products - DSLF
Validation: Central Europe station

PeriodJan 2006 - Apr 2007
StationsTamanrasset, AlgeriaSde Boqer, IsraelNiamey, Niger
CERES SEVIRI DSLF
Bias RMSE Bias RMSE
Clear Sky 13.0 26.8 -4.4 14.1
All Sky 17.5 29.6 -5.4 16.9
Problems:
- Impact of high aerosol loads
CERES
○ clear sky▪ cloudy sky
SEVIRI DSLF
Radiation Products - DSLF
Validation: Semi-arid and desert stations

Surface Water Balance
Evapotranspiration
Increased level of maturity
Development Pre. Operat. Operational
Snow Cover
LSA-SAF MSG Products

0 5 (mm)
0 0.7 (mm/h)
Water balance productsEvapotranspiration (ET)
ET: Flux of water vapour between ground surface and the atmosphere.
Daily cumulated ET (DMET)Instantaneous ET, one image every 30 minutes
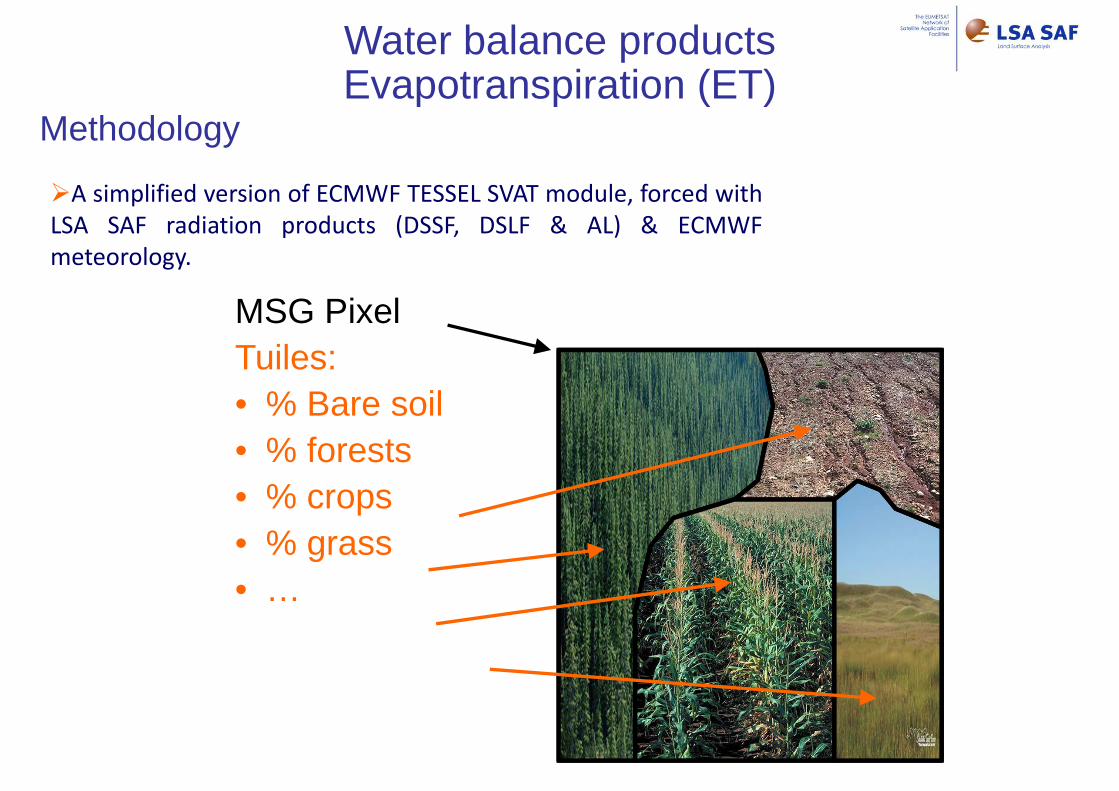
MSG PixelTuiles:• % Bare soil• % forests• % crops• % grass• …
�A simplified version of ECMWF TESSEL SVAT module, forced with
LSA SAF radiation products (DSSF, DSLF & AL) & ECMWF
meteorology.
Methodology
Water balance productsEvapotranspiration (ET)
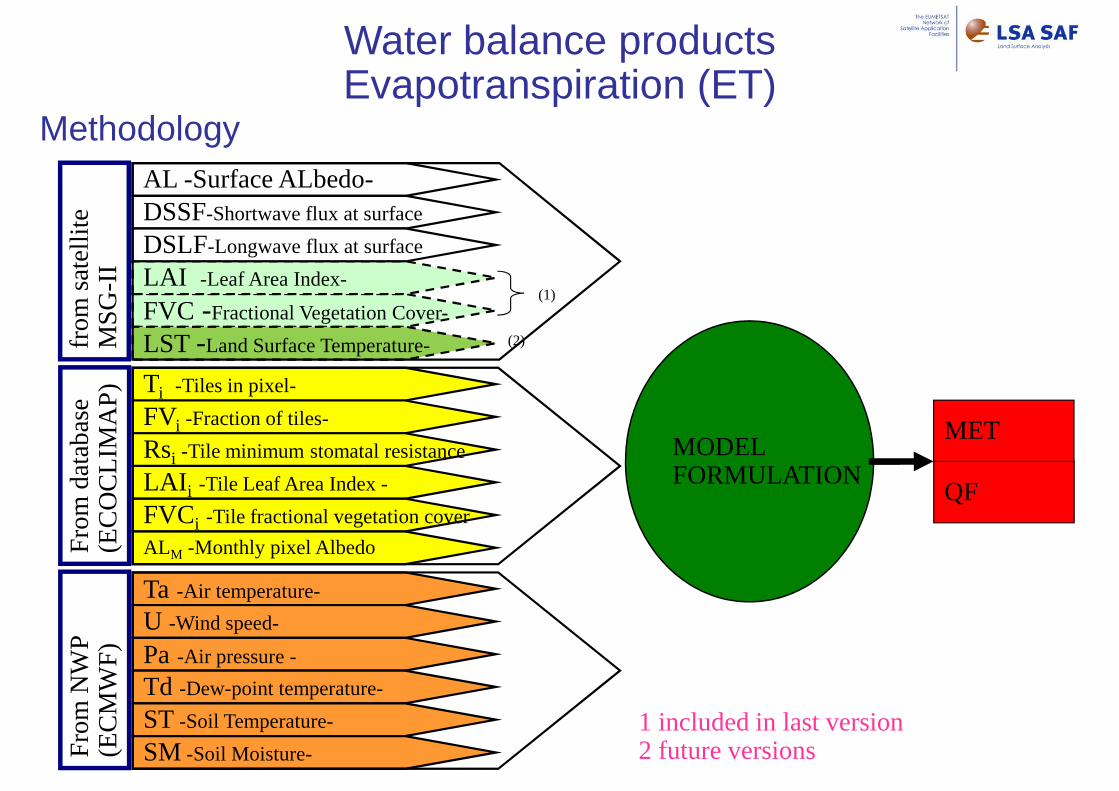
fro
m s
atel
lite
MS
G-I
I
FVC -Fractional Vegetation Cover-
LST -Land Surface Temperature-
LAI -Leaf Area Index-
AL -Surface ALbedo-DSSF-Shortwave flux at surface
DSLF-Longwave flux at surface
Ti -Tiles in pixel-
FVi -Fraction of tiles-
Rsi -Tile minimum stomatal resistance
LAI i -Tile Leaf Area Index -
FVCi -Tile fractional vegetation cover
ALM -Monthly pixel AlbedoFro
m d
atab
ase
(EC
OC
LIM
AP
)F
rom
NW
P
(EC
MW
F)
Ta -Air temperature-
U -Wind speed-
Pa-Air pressure -
Td -Dew-point temperature-
ST -Soil Temperature-
SM -Soil Moisture-
MODELFORMULATION
MET
QF
(1)
1 included in last version2 future versions
(2)
Water balance productsEvapotranspiration (ET)
Methodology

� Comparison to observations in different climatic and environmental conditions
�Comparison to output from other models
�Good agreement between simulations and observations ; the best agreement is observed in areas dominated by grasslands and mixed forests
Validation
Water balance productsEvapotranspiration (ET)
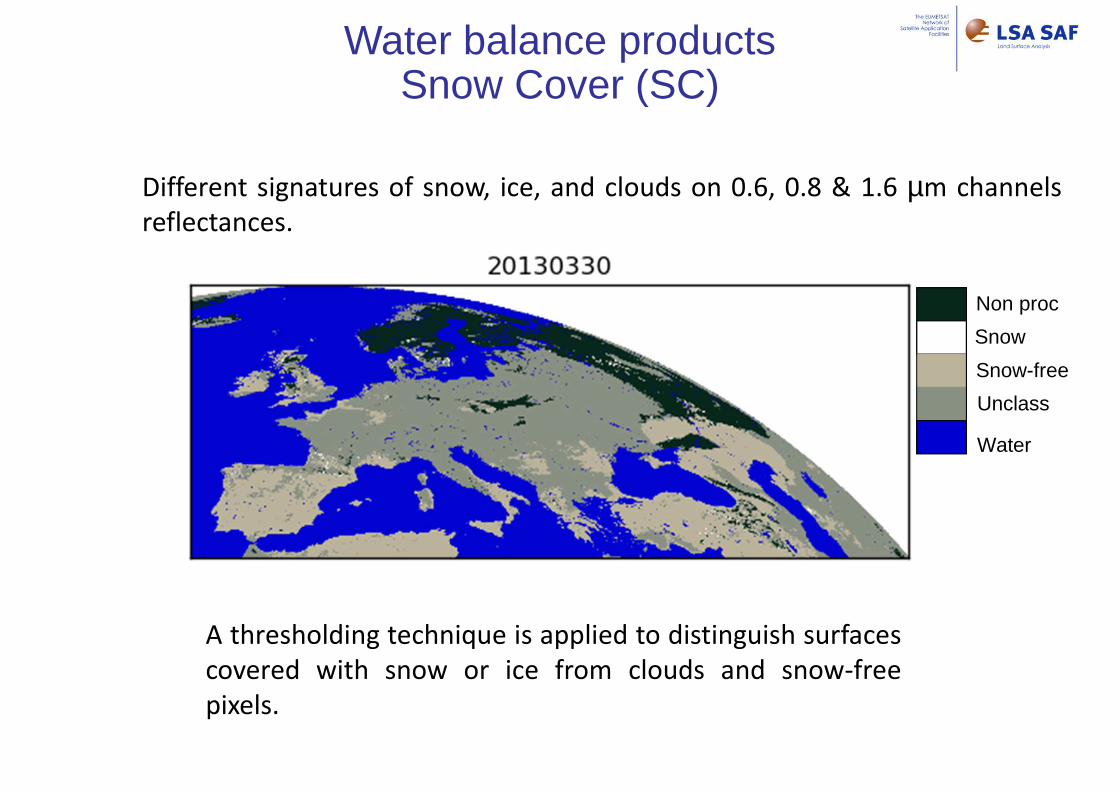
A thresholding technique is applied to distinguish surfaces
covered with snow or ice from clouds and snow-free
pixels.
Snow
Non proc
Snow-free
Unclass
Water
Different signatures of snow, ice, and clouds on 0.6, 0.8 & 1.6 µm channels
reflectances.
Water balance productsSnow Cover (SC)

Fraction Veg Cover
LAI
FAPAR
Increased level of maturity
Development Pre. Operat. Operational
Fire Radiative Power
Fire Detection & Monitoring
Fire Risk Mapping(Europe)
NDVI from Metop
Wild FiresVegetation
LSA-SAF MSG Products
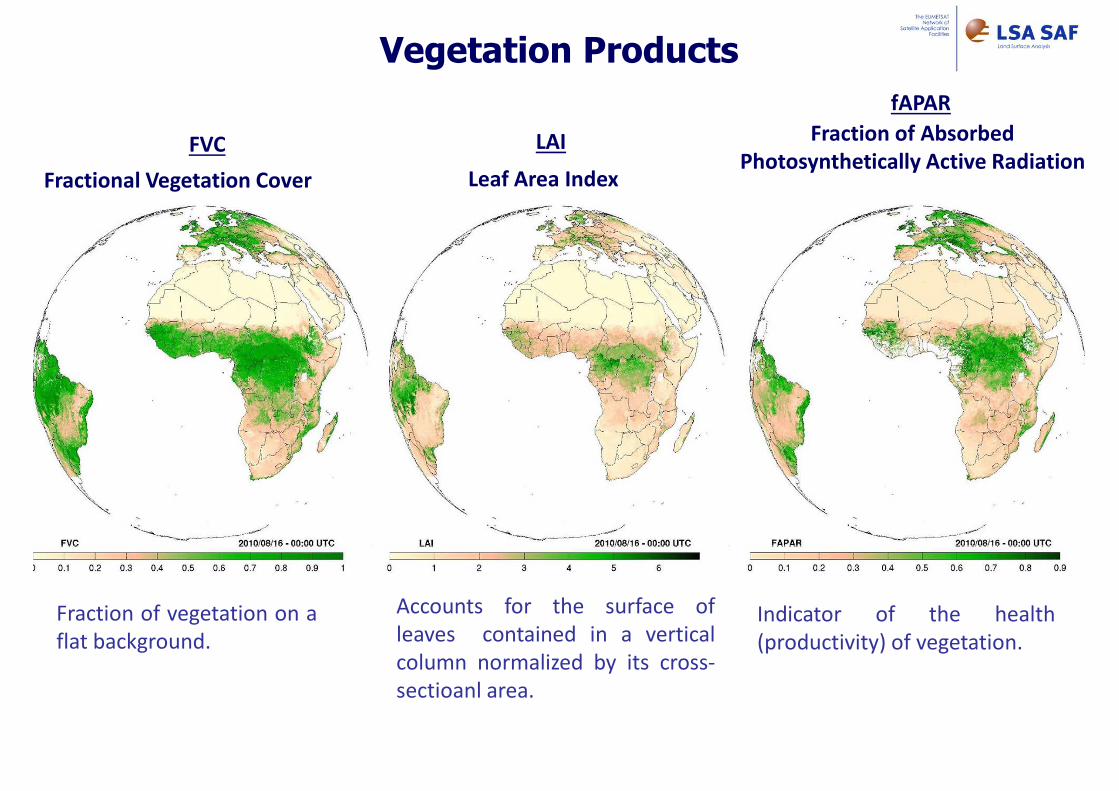
Fractional Vegetation Cover Leaf Area Index
Fraction of Absorbed
Photosynthetically Active Radiation
Vegetation Products
Fraction of vegetation on a
flat background.
Accounts for the surface of
leaves contained in a vertical
column normalized by its cross-
sectioanl area.
Indicator of the health
(productivity) of vegetation.
FVC LAI
fAPAR
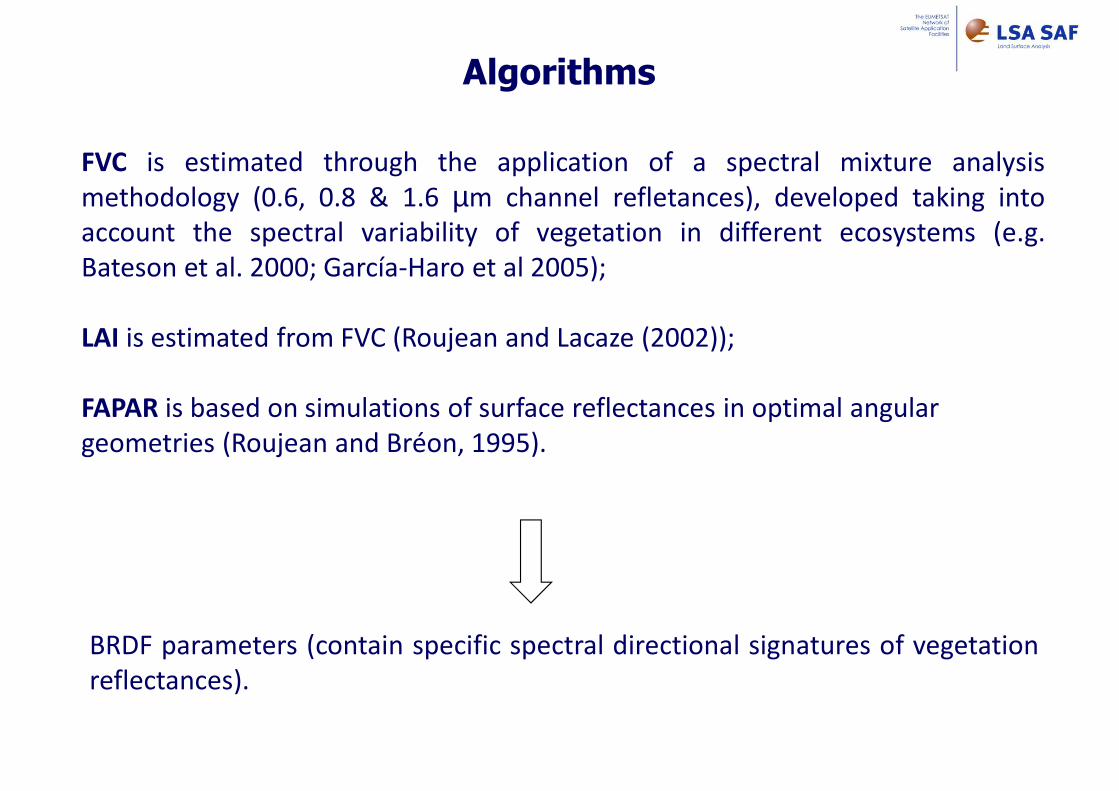
Algorithms
BRDF parameters (contain specific spectral directional signatures of vegetation
reflectances).
FVC is estimated through the application of a spectral mixture analysis
methodology (0.6, 0.8 & 1.6 µm channel refletances), developed taking into
account the spectral variability of vegetation in different ecosystems (e.g.
Bateson et al. 2000; García-Haro et al 2005);
LAI is estimated from FVC (Roujean and Lacaze (2002));
FAPAR is based on simulations of surface reflectances in optimal angular
geometries (Roujean and Bréon, 1995).
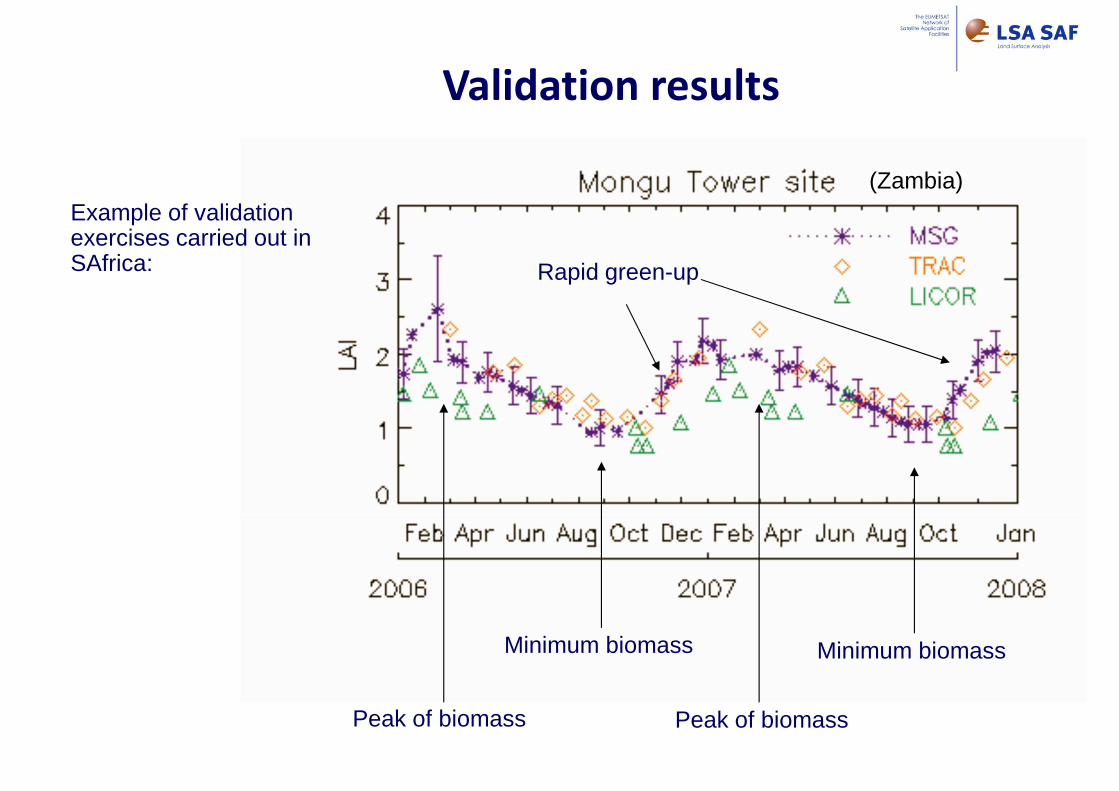
Validation results
Example of validation exercises carried out in SAfrica:
Peak of biomass
Minimum biomass
Peak of biomass
Minimum biomass
Rapid green-up
(Zambia)
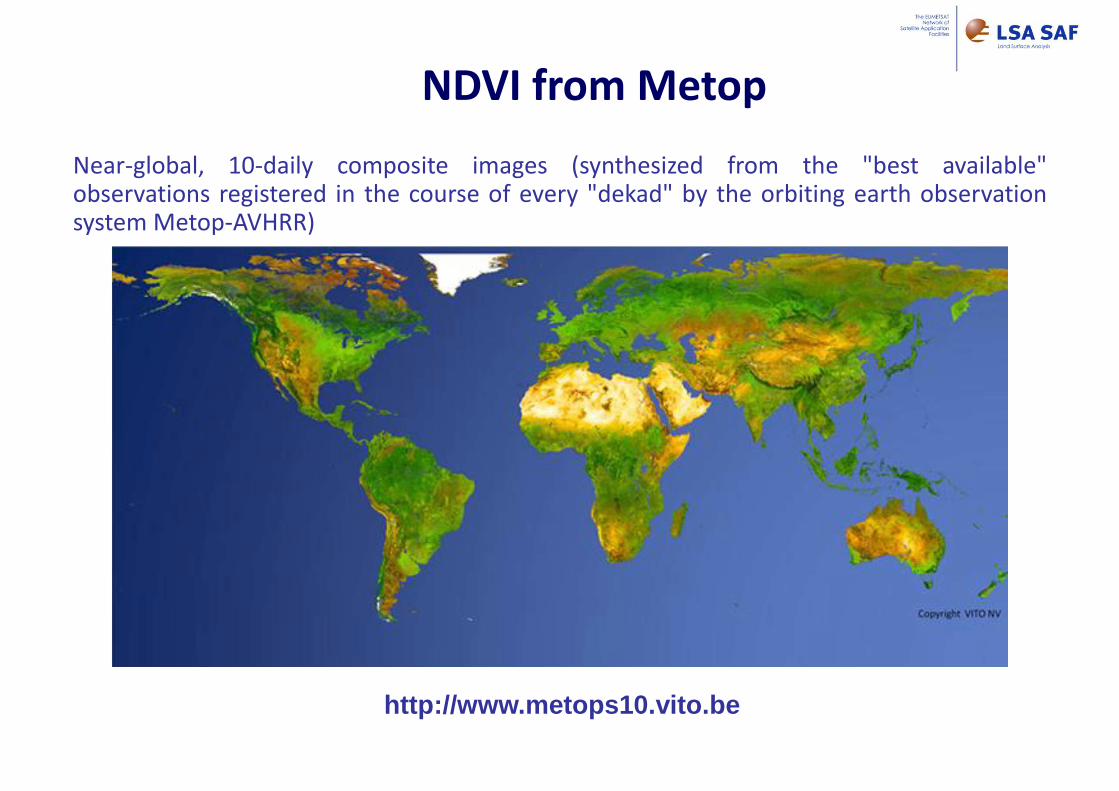
Near-global, 10-daily composite images (synthesized from the "best available"observations registered in the course of every "dekad" by the orbiting earth observationsystem Metop-AVHRR)
http://www.metops10.vito.be
NDVI from Metop

FIRE RADIATIVE POWER (FRP) - The Fire Radiative Power (FRP) is the amount ofradiant energy emitted per unit time during a vegetation fire. is related to the rate atwhich fuel is being consumed
Fire Radiative Power

The FRP product is derived using a Fire Thermal Anomaly (FTA) algorithm. Ii works mainly on statistics derived from the 3.9 µm and 11.0 µm brightness temperatures, and their differences
Fire Radiative Power
By integrating FRP during the lifetime of a vegetation fire we get the total combusted biomass(Kg)

�Detect an active vegetation fire
Fire Radiative Power
FRP product allows to:
�Compute the radiant energy per unit time for the detected fire
�Estimate trace gas emissions from the fire
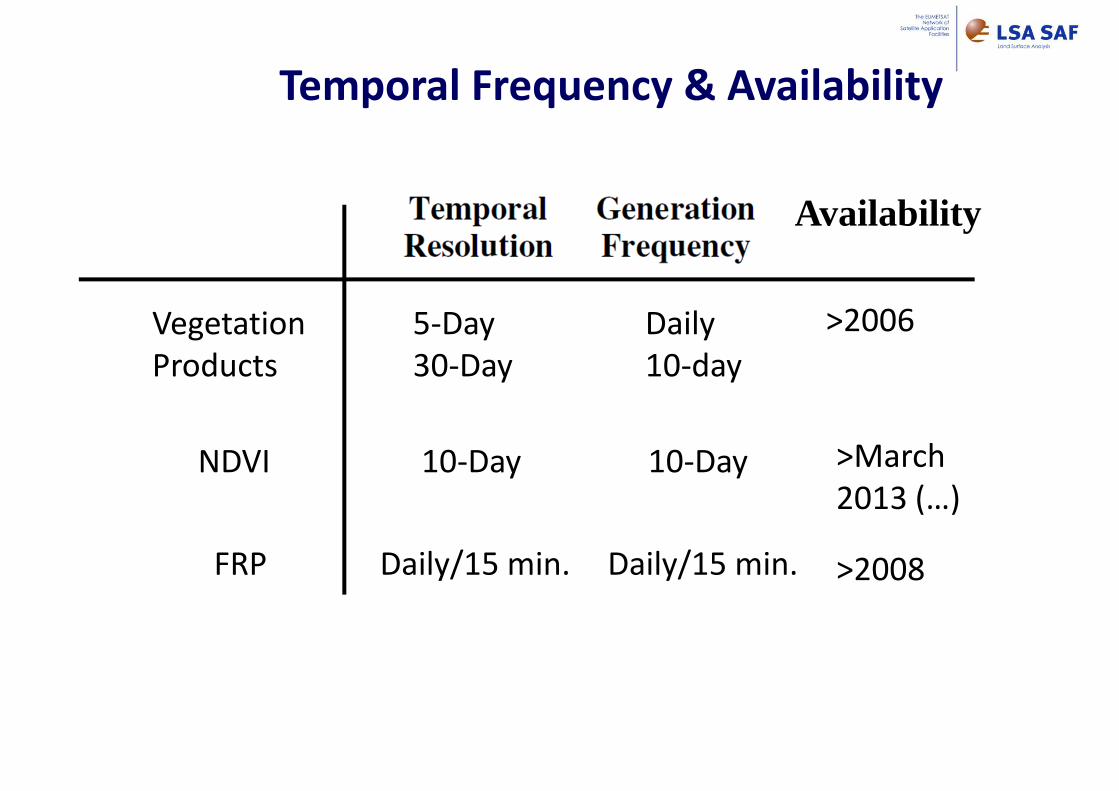
Temporal Frequency & Availability
Availability
>2006
>2008
5-Day
30-Day
Daily
10-day
Daily/15 min. Daily/15 min.
Vegetation
Products
FRP
NDVI 10-Day 10-Day >March
2013 (…)
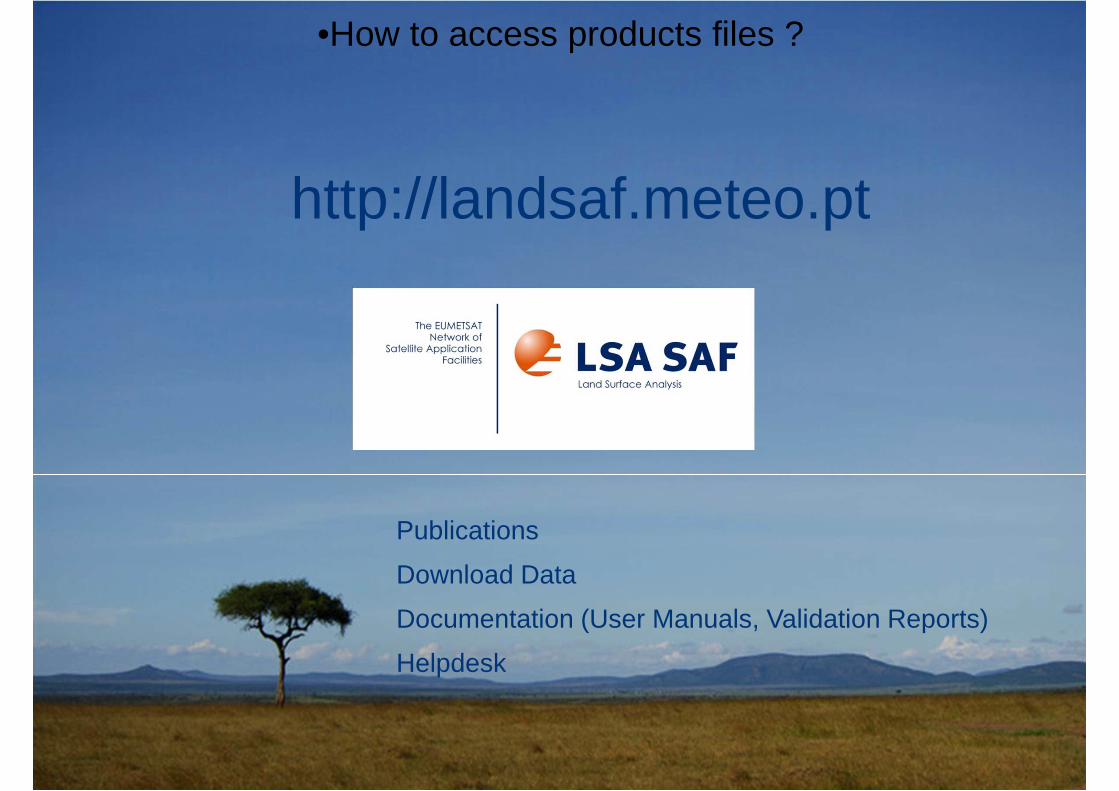
http://landsaf.meteo.pt
Publications
Download Data
Documentation (User Manuals, Validation Reports)
Helpdesk
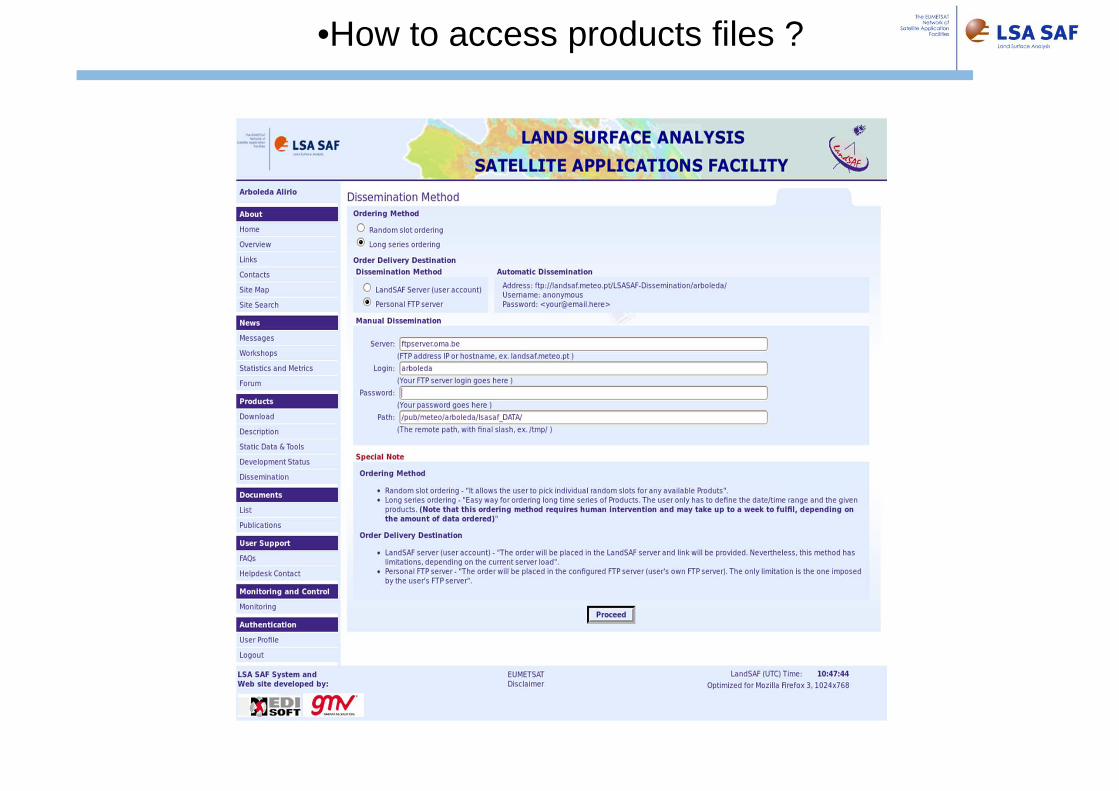
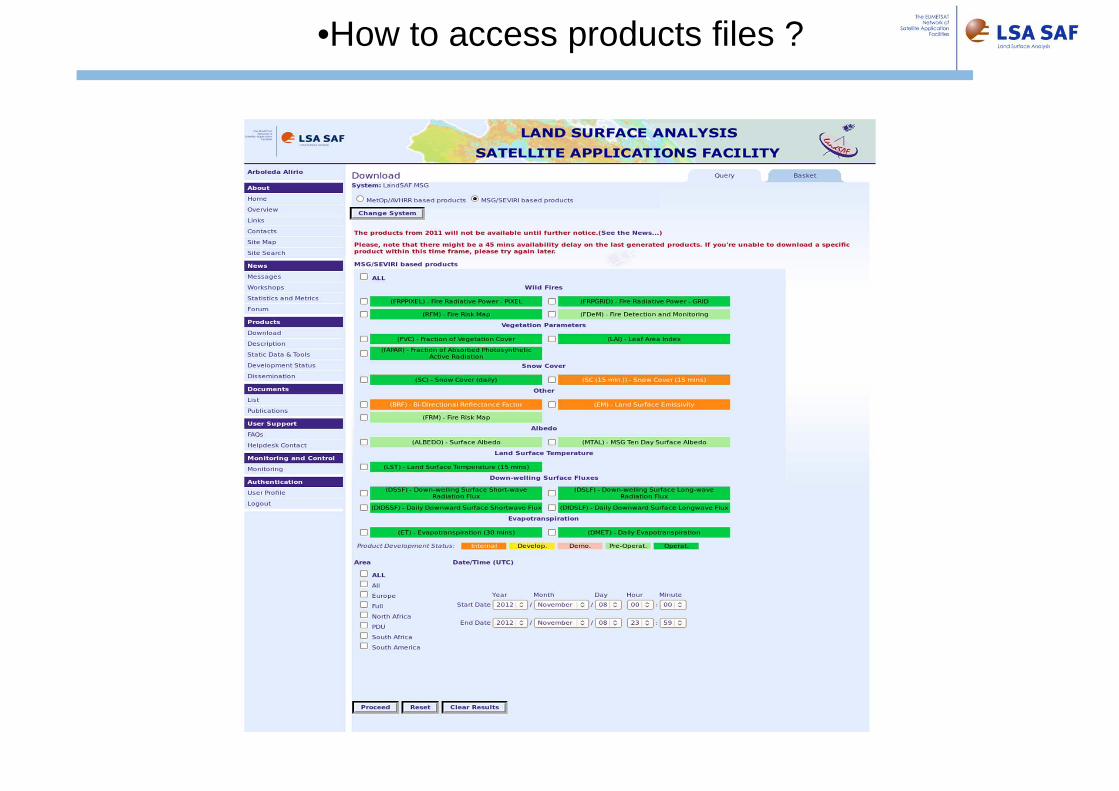
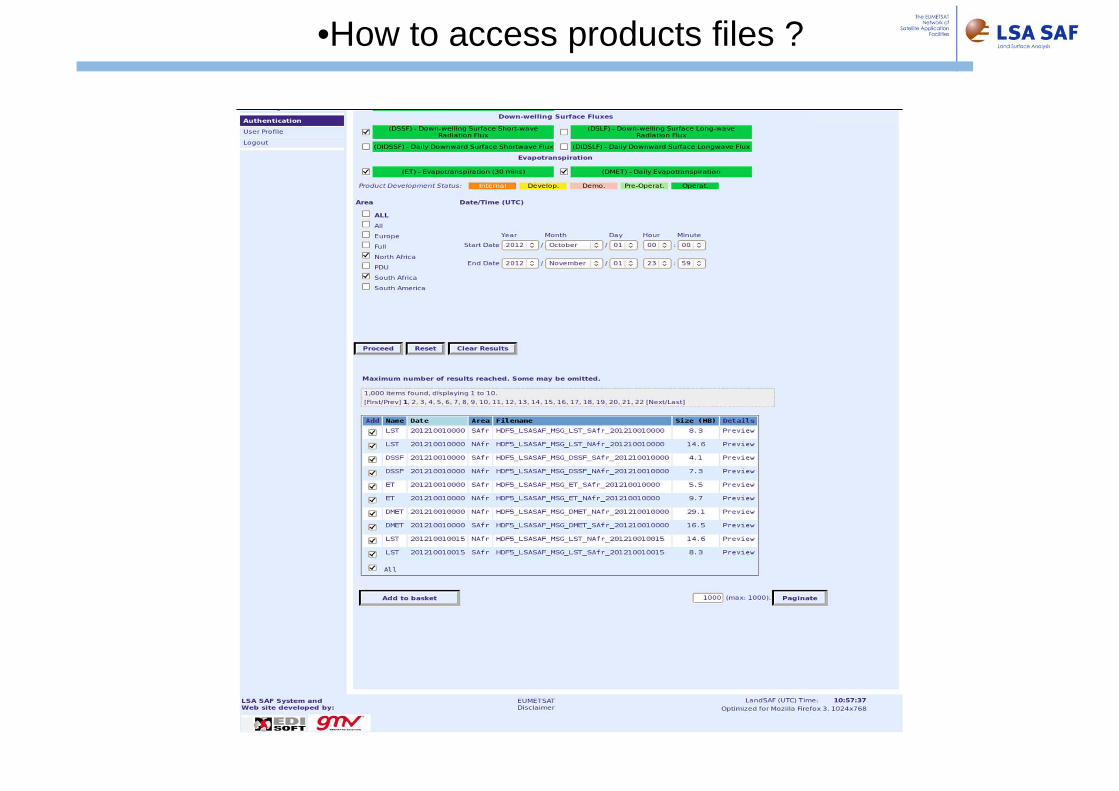
•How to access products files ?

•How to access products files ?

http://landsaf.meteo.pt
1. register
2. login
•How to access products files ?
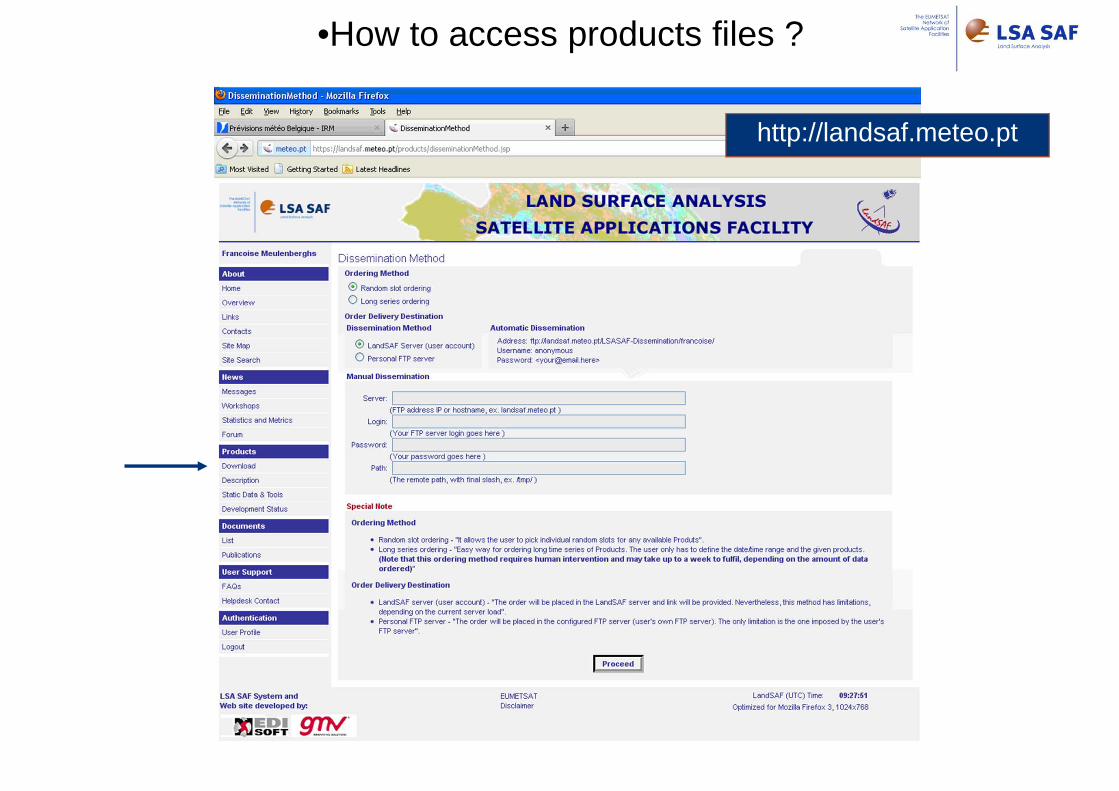
http://landsaf.meteo.pt
•How to access products files ?

•How to access products files ?
•How to access products files ?
•How to access products files ?
•How to access products files ?
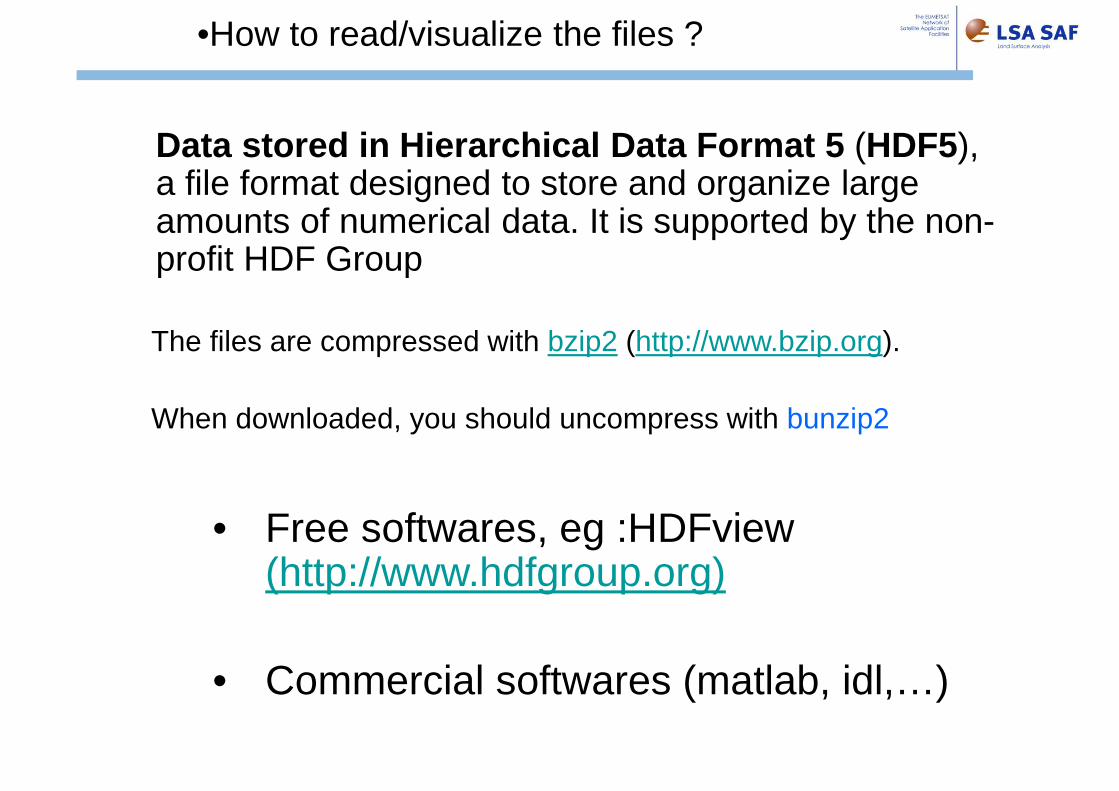
• Free softwares, eg :HDFview (http://www.hdfgroup.org)
• Commercial softwares (matlab, idl,…)
•How to read/visualize the files ?
Data stored in Hierarchical Data Format 5 (HDF5), a file format designed to store and organize large amounts of numerical data. It is supported by the non-profit HDF Group
The files are compressed with bzip2 (http://www.bzip.org).
When downloaded, you should uncompress with bunzip2

(http://www.hdfgroup.org)
This software allows:- Visualize
images- Visualize
values- Histograms- Save images in
other formats
• (.jpg, bmp, gif,….)
Evapotranspiration values (array)
Quality flag (array)
•Visualize data with HDFview
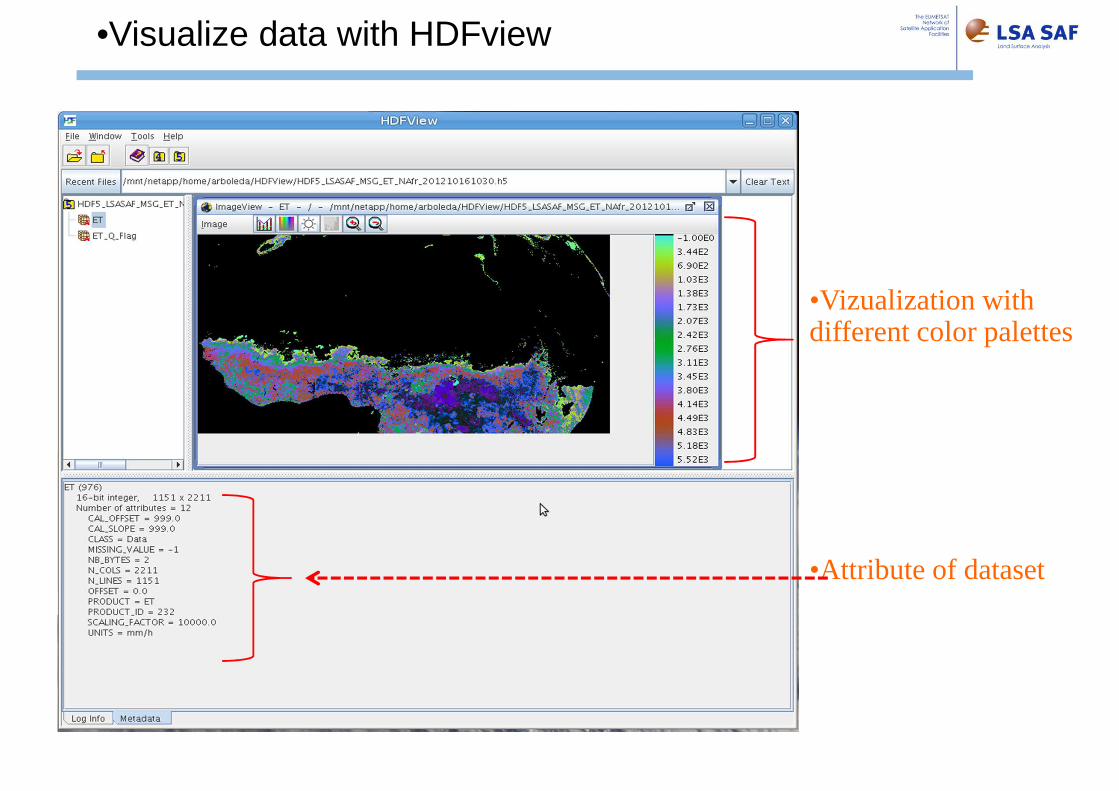
•Attribute of dataset
•Vizualization with different color palettes
•Visualize data with HDFview
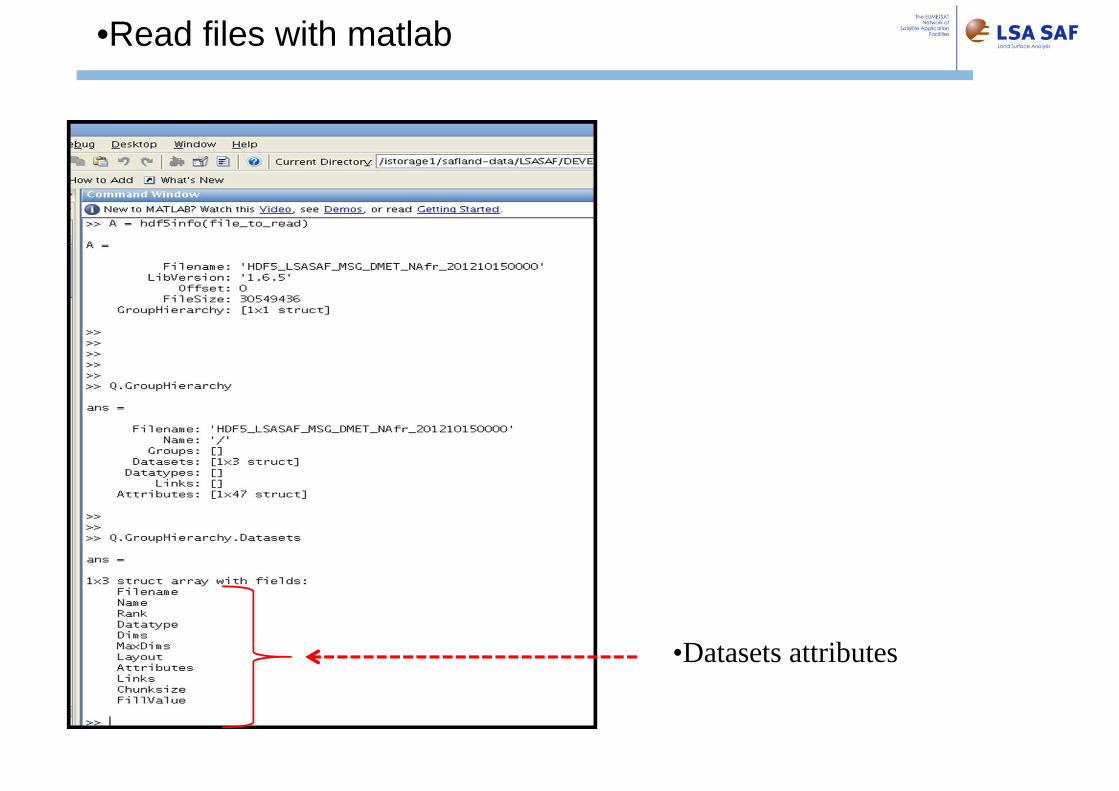
•Datasets attributes
•Read files with matlab

•3 datasets for the hdf5 file•Daily evapotranspiration
•Information on the data: attributes
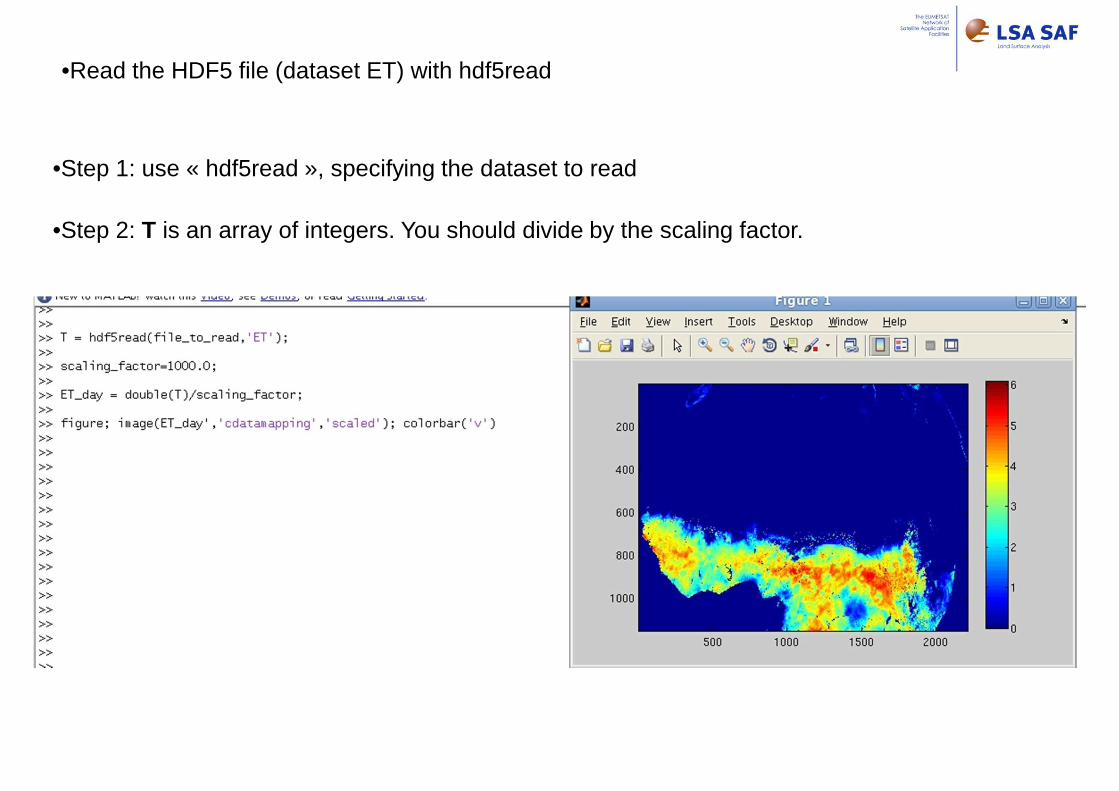
•Read the HDF5 file (dataset ET) with hdf5read
•Step 1: use « hdf5read », specifying the dataset to read
•Step 2: T is an array of integers. You should divide by the scaling factor.
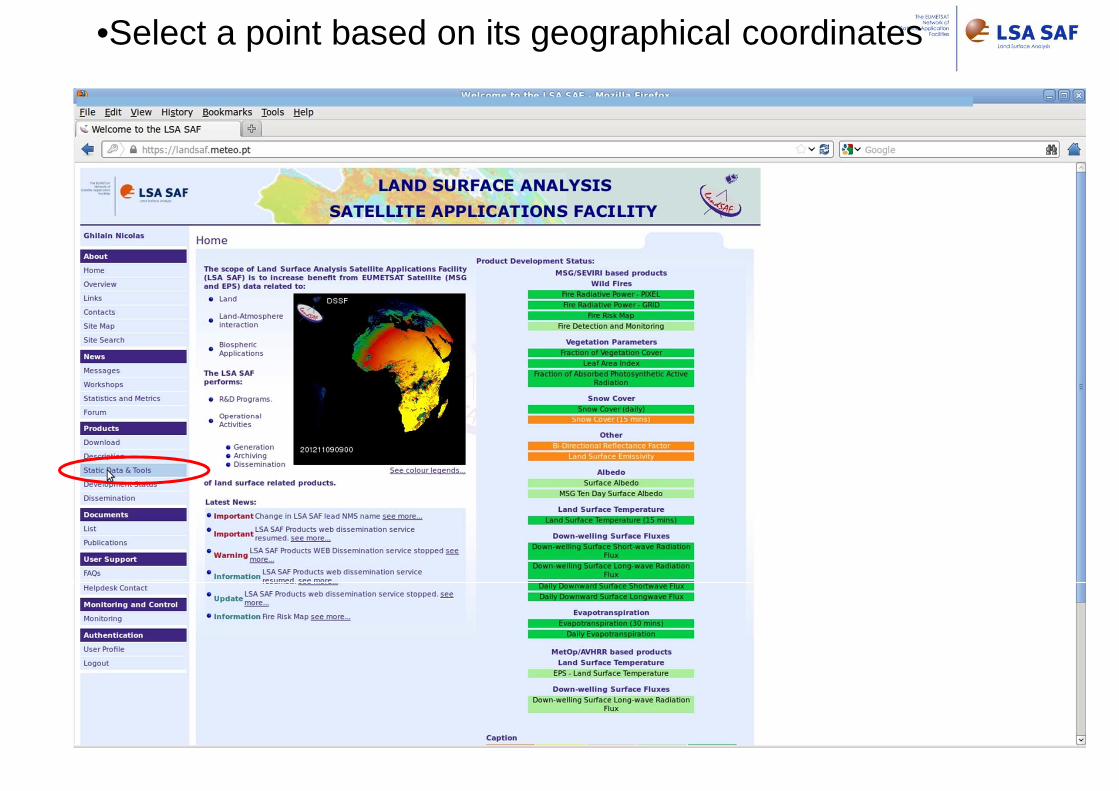
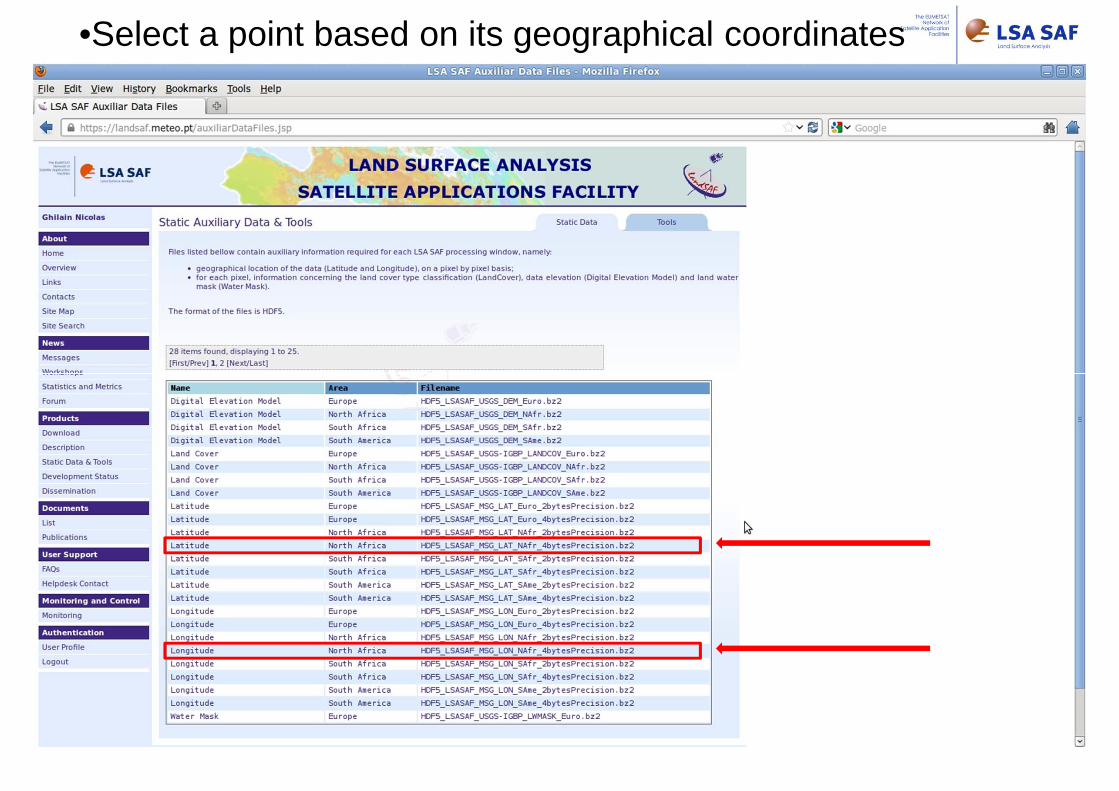
•Select a point based on its geographical coordinates
•Select a point based on its geographical coordinates
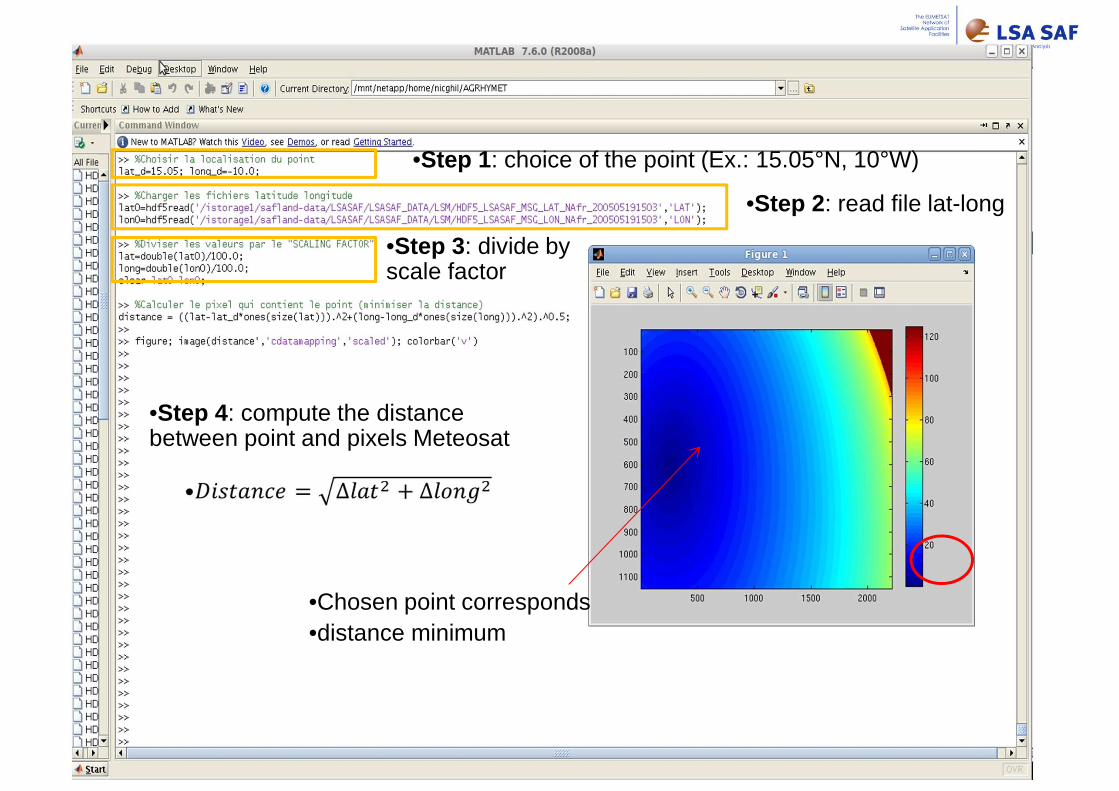
•Chosen point corresponds•distance minimum
•Step 1 : choice of the point (Ex.: 15.05°N, 10°W)
•Step 2 : read file lat-long
•Step 3 : divide by scale factor
•Step 4 : compute the distance between point and pixels Meteosat

•ET in mm/hr
•Quality flag

•Extraction of a time series
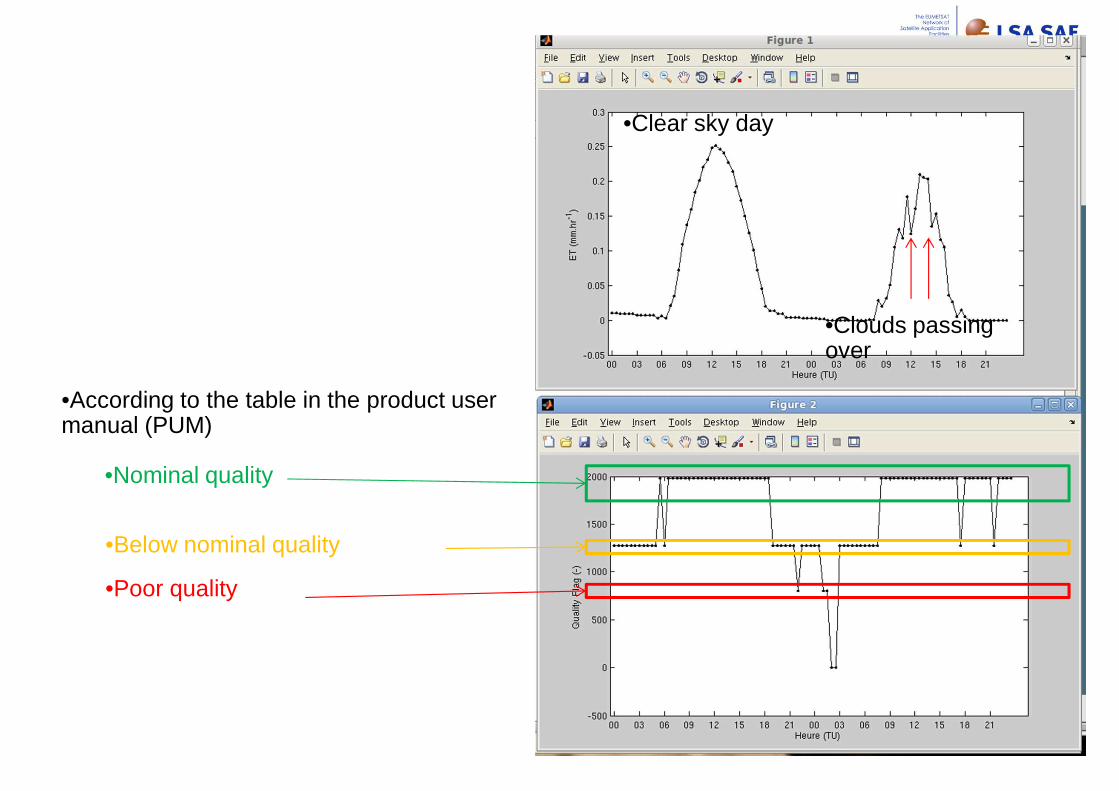
•Clear sky day
•Clouds passing over
•According to the table in the product user manual (PUM)
•Nominal quality
•Below nominal quality
•Poor quality

•Daily values

Questions/Comments?


