The Insurance Industry’s Response to Superstorm Sandy:
Putting the Northeast on the Road to Recovery
Congressional Staff BriefingWashington, DC
December 10, 2012Download at www.iii.org/presentations
Robert P. Hartwig, Ph.D., CPCU, President & EconomistInsurance Information Institute 110 William Street New York, NY 10038
Tel: 212.346.5520 Cell: 917.453.1885 [email protected] www.iii.org

Hurricane Sandy Summary
2
Sandy Will Become One of the Most Expensive Events in
Insurance History
2

3
Summary of Key Claims StatisticsRelated to Hurricane Sandy Sandy Will Likely Become the 3rd Most Expensive Hurricane in US History in Terms of
Insured Losses—With Up to $25 Billion in Claims Paid
Ranks only behind 2005’s Katrina ($48.7B) and 1992’s Andrew ($25.6B) [in 2012 $]
Insurers Expect to Pay an Estimated 1.38 Million Claims to Homeowners, Business Owners and Vehicle Owners
Second only to Hurricane Katrina which produced 1.743 million claims in 2005
Insurers Will Pay Claims on Nearly 1 Million Homes, Quarter Million Vehicles and More than 150,000 Businesses
2012 Could Become the 3rd Costliest Year in US History for Claims Paid to Policyholders—Totaling Approximately $33-$35 Billion as of Late 2012
Ranking behind 2005 ($71.7B) and 1992 ($36.9B) [both stated in 2011 dollars]
2012 Will Likely Be the 2nd Costliest Year for the NFIP (~$7B+), Likely Exhausting the Flood Program’s Remaining Borrowing Authority
Record was $17.74B in 2005 (original dollars), the year of Hurricane Katrina
P/C Insurance Industry Entered 2012 Hurricane Very Strong Financially, with More than $550 Billion in Claims Paying Capital
Industry remains very strong in the wake of Sandy, despite near record catastrophe activity in 2011 and 2012
4
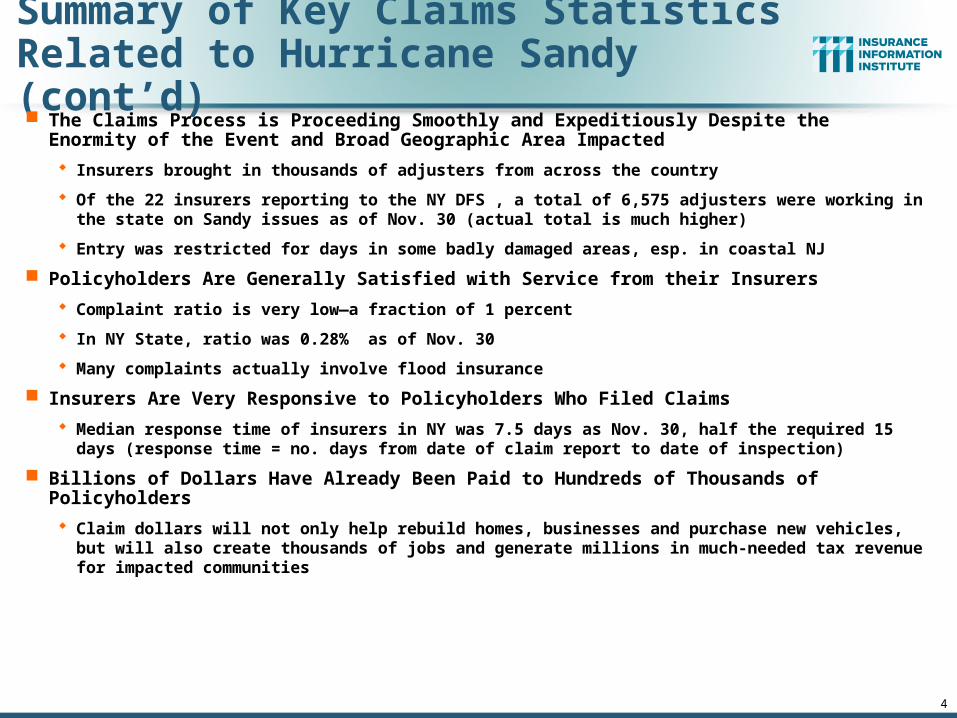
Summary of Key Claims StatisticsRelated to Hurricane Sandy (cont’d) The Claims Process is Proceeding Smoothly and Expeditiously Despite the Enormity of the
Event and Broad Geographic Area Impacted
Insurers brought in thousands of adjusters from across the country
Of the 22 insurers reporting to the NY DFS , a total of 6,575 adjusters were working in the state on Sandy issues as of Nov. 30 (actual total is much higher)
Entry was restricted for days in some badly damaged areas, esp. in coastal NJ
Policyholders Are Generally Satisfied with Service from their Insurers
Complaint ratio is very low—a fraction of 1 percent
In NY State, ratio was 0.28% as of Nov. 30
Many complaints actually involve flood insurance
Insurers Are Very Responsive to Policyholders Who Filed Claims
Median response time of insurers in NY was 7.5 days as Nov. 30, half the required 15 days (response time = no. days from date of claim report to date of inspection)
Billions of Dollars Have Already Been Paid to Hundreds of Thousands of Policyholders
Claim dollars will not only help rebuild homes, businesses and purchase new vehicles, but will also create thousands of jobs and generate millions in much-needed tax revenue for impacted communities

Hurricane Sandy Insured Loss Estimates:Late Season Large Loss* ($ Billions)
$10 - $20B
$16 - $22B
$20 - $25B
$0 $5 $10 $15 $20 $25
Eqecat
AIR
RMS
*US insured property and business interruption losses only. Sandy’s landfall in the northeast US occurred Oct. 29, 2012.Sources: RMS (11/14/12 est.), AIR (11/26/12 est.), Eqecat (11/1/12 est.); Compiled by the Insurance Information Institute.
Average of the midpoints of the 3 risk modeler
estimates is $18.8 billion

6
Top 12 Most Costly Hurricanesin U.S. History
(Insured Losses, 2012 Dollars, $ Billions)
*Estimate as of 12/09/12 based on average of current range estimate midpoints from AIR, Eqecat and RMS..Sources: PCS; Insurance Information Institute inflation adjustments to 2012 dollars using the CPI.
$9.2 $11.1$13.4
$18.8
$25.6
$48.7
$8.7$7.8$6.7$5.6$5.6$4.4
$0
$10
$20
$30
$40
$50
$60
Irene(2011)
Jeanne(2004)
Frances(2004)
Rita (2005)
Hugo (1989)
Ivan (2004)
Charley(2004)
Wilma(2005)
Ike (2008)
Sandy*(2012)
Andrew(1992)
Katrina(2005)
Hurricane Sandy could become the 3rd costliest
hurricane in US insurance history
Hurricane Irene became the 12th most expense hurricane in
US history in 2011
10 of the 12 most costly hurricanes in insurance history occurred over the past 8 years (2004—2012)

7
Top 16 Most Costly Disastersin U.S. History
(Insured Losses, 2012 Dollars, $ Billions)
*Estimate as of 12/09/12 based on average of range midpoints from AIR, RMS and Eqecat..Sources: PCS; Insurance Information Institute inflation adjustments.
$7.8 $8.7 $9.2 $11.1$13.4$18.8
$23.9 $24.6$25.6
$48.7
$7.5$7.1$6.7$5.6$5.6$4.4
$0
$10
$20
$30
$40
$50
$60
Irene (2011) Jeanne(2004)
Frances(2004)
Rita (2005)
Tornadoes/T-Storms
(2011)
Tornadoes/T-Storms
(2011)
Hugo (1989)
Ivan (2004)
Charley(2004)
Wilma(2005)
Ike (2008)
Sandy*(2012)
Northridge(1994)
9/11 Attack(2001)
Andrew(1992)
Katrina(2005)
Hurricane Sandy could become the 5th
costliest event in US insurance history
Hurricane Irene became the 12th most expense hurricane
in US history in 2011
Includes Tuscaloosa, AL,
tornado
Includes Joplin, MO, tornado
NY Gov. Andrew Cuomo has requested $42 billion in federal aid. NJ
Gov. Chris Christie has requested $29.4B

8
Top 16 Most Costly World Insurance Losses, 1970-2012*
(Insured Losses, 2012 Dollars, $ Billions)
*Figures do not include federally insured flood losses.**Average of range estimates of $35B - $40B as of 1/4/12 adjusted to 2012 dollars; Privately insured losses only.***Estimate as of 12/09/12, based on average of midpoints from range estimates from AIR, RMS and Eqecat.Sources: Swiss Re sigma 1/2011; Munich Re; Insurance Information Institute research.
$11.1$13.4 $13.4$13.4$18.8
$23.9 $24.6$25.6
$38.6
$48.7
$7.8 $8.1 $8.5 $8.7 $9.2 $9.6
$0
$10
$20
$30
$40
$50
$60
Hugo (1989)
WinterStormDaria(1991)
ChileQuake(2010)
Ivan (2004)
Charley(2004)
TyphoonMirielle(1991)
Wilma(2005)
ThailandFloods(2011)
NewZealandQuake(2011)
Ike (2008)
Sandy(2012)**
Northridge(1994)
WTC TerrorAttack(2001)
Andrew(1992)
JapanQuake,
Tsunami(2011)**
Katrina(2005)
5 of the top 14 most expensive
catastrophes in world history have occurred within the past 3 yearsHurricane Sandy could
become the 6th costliest event in global insurance
history
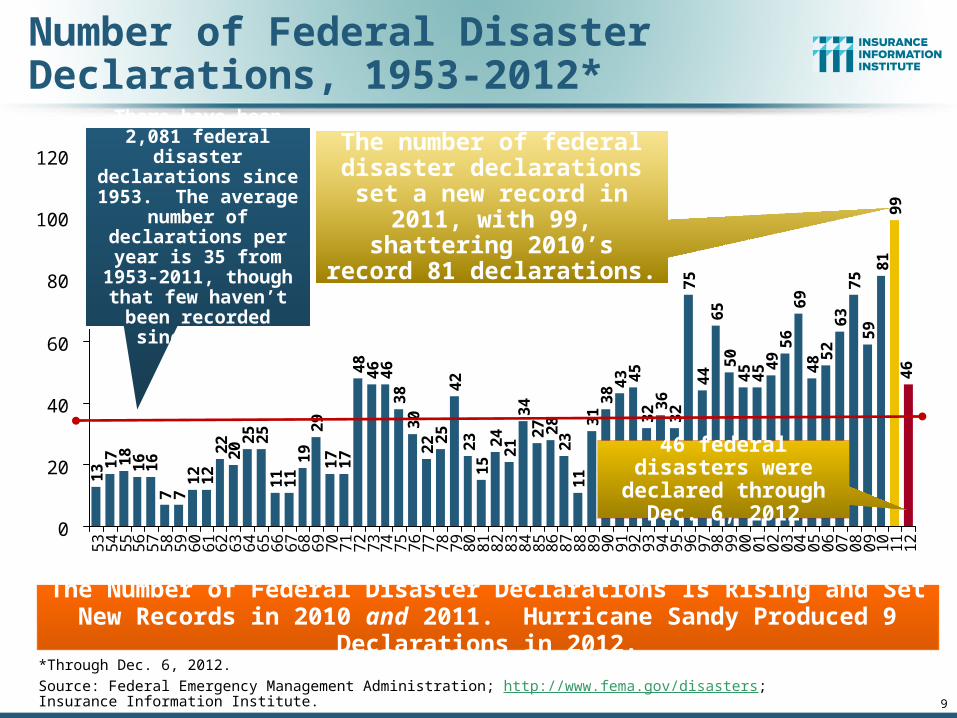
Number of Federal Disaster Declarations, 1953-2012*
13 1
7 18
16
16
7 71
21
22
22
0 25
25
11
11
19
29
17
17
48
46
46
38
30
22 2
54
22
31
52
42
13
42
7 28
23
11
31
38
45
32 3
63
27
54
46
55
04
54
5 49
56
69
48 5
26
37
55
98
19
94
6
43
0
20
40
60
80
100
120
53
54
55
56
57
58
59
60
61
62
63
64
65
66
67
68
69
70
71
72
73
74
75
76
77
78
79
80
81
82
83
84
85
86
87
88
89
90
91
92
93
94
95
96
97
98
99
00
01
02
03
04
05
06
07
08
09
10
11
12
*Through Dec. 6, 2012.Source: Federal Emergency Management Administration; http://www.fema.gov/disasters; Insurance Information Institute.
The Number of Federal Disaster Declarations Is Rising and Set New Records in 2010 and 2011. Hurricane Sandy Produced 9 Declarations in 2012.
The number of federal disaster declarations set a
new record in 2011, with 99, shattering 2010’s record 81
declarations.
There have been 2,081 federal disaster
declarations since 1953. The average
number of declarations per year is 35 from
1953-2011, though that few haven’t been
recorded since 1995.
46 federal disasters were declared through
Dec. 6, 2012
9

10
$1
2.3
$1
0.7
$3
.7
$1
4.0
$1
1.3
$6
.0
$3
3.9
$7
.4 $1
5.9
$3
2.9
$7
1.7
$1
0.3
$7
.3
$2
8.5
$1
1.2
$1
4.1
$3
2.3
$3
4.0
$1
3.7
$4
.7
$7
.8
$3
6.9
$8
.6
$2
5.8
$0
$10
$20
$30
$40
$50
$60
$70
$80
89 90 91 92 93 94 95 96 97 98 99 00 01 02 03 04 05 06 07 08 09 10 11 12*
US Insured Catastrophe Losses
*As of 11/26/12 in 2012 dollars. Includes $18.8B gross loss estimate for Hurricane Sandy.Note: 2001 figure includes $20.3B for 9/11 losses reported through 12/31/01 ($25.9B 2011 dollars). Includes only business and personal property claims, business interruption and auto claims. Non-prop/BI losses = $12.2B ($15.6B in 2011 dollars.) Sources: Property Claims Service/ISO; Insurance Information Institute.
US CAT Losses in 2012 Could Become the 3rd Highest in US History on An Inflation-Adjusted
Basis. 2011 Losses Were the 5th Highest
2012 CAT losses were down nearly 50% from 2011 until Sandy struck in late October
Record Tornado Losses Caused
2011 CAT Losses to Surge
($ Billions, 2011 Dollars)
10
11
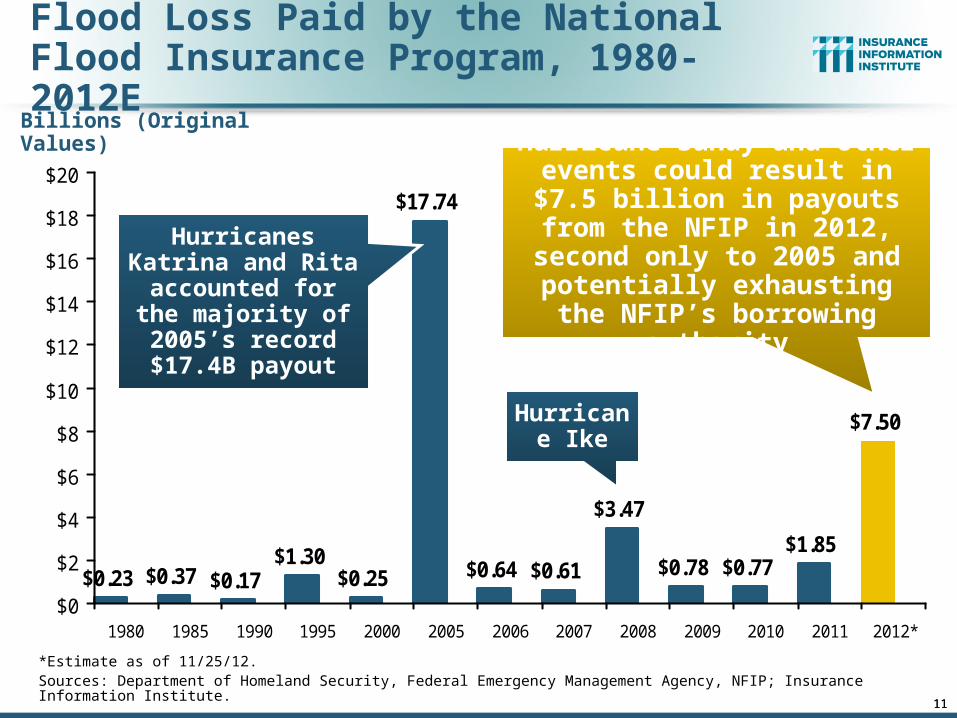
Flood Loss Paid by the National Flood Insurance Program, 1980-2012E
*Estimate as of 11/25/12.Sources: Department of Homeland Security, Federal Emergency Management Agency, NFIP; Insurance Information Institute.
Billions (Original Values)
$0.23 $0.37 $0.17$1.30
$0.25
$17.74
$0.64 $0.61
$3.47
$0.78 $0.77$1.85
$7.50
$0
$2
$4
$6
$8
$10
$12
$14
$16
$18
$20
1980 1985 1990 1995 2000 2005 2006 2007 2008 2009 2010 2011 2012*
Hurricanes Katrina and Rita accounted for the majority of
2005’s record $17.4B payout
Hurricane Ike
11
Hurricane Sandy and other events could result in $7.5
billion in payouts from the NFIP in 2012, second only to 2005
and potentially exhausting the NFIP’s borrowing authority

Auto, 230,500 ,
17%
Commercial, 167,500 ,
12%
Homeowner, 982,000 ,
71%
Hurricane Sandy resulted in an
estimated 1.38 million privately insured
claims resulting in an estimated $10 to $25
billion in insured losses. Hurricane
Katrina produced 1.74 million claims and
$47.6B in losses (in 2011 $)
Hurricane Sandy: Number of Claims by Type*
*PCS claim count estimate as of 11/26/12. Loss estimate represents high and low end estimates by risk modelers RMS, Eqecat and AIR. PCS estimate of insured losses as of 11/26/12 $11 billion. All figures exclude losses paid by the NFIP.Source: PCS; AIR, Eqecat, AIR Worldwide; Insurance Information Institute. 12

New Jersey, 360,000 ,
36%
All Other, 292,000 ,
30%
New York, 330,000 ,
34%
Hurricane Sandy
•Estimated 982,000 homeowners
claims**
•$6.6 billion in insured losses.
•Average loss per claim is $6,718
•About 1/3 of claims in NY, 1/3 in NJ and
1/3 in all other states
Hurricane Sandy: Number of Homeowners Claims by State*
*Preliminary as of 11/26/12.Source: PCS. 13
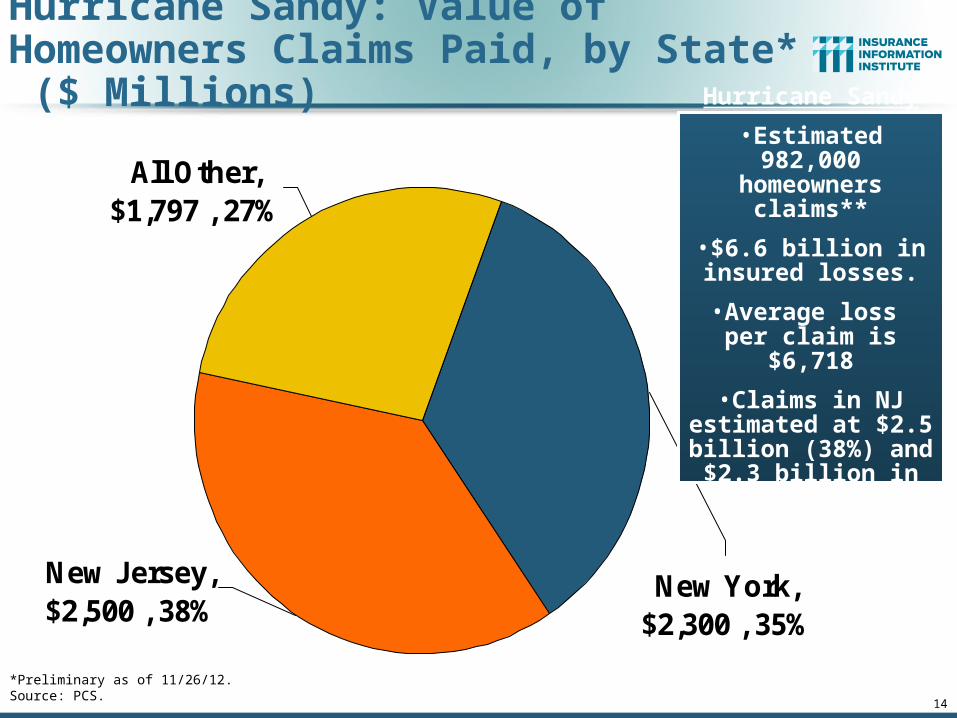
New Jersey, $2,500 , 38%
New York, $2,300 , 35%
All Other, $1,797 , 27%
Hurricane Sandy: Value of Homeowners Claims Paid, by State* ($ Millions)
*Preliminary as of 11/26/12.Source: PCS. 14
Hurricane Sandy
•Estimated 982,000 homeowners
claims**
•$6.6 billion in insured losses.
•Average loss per claim is $6,718
•Claims in NJ estimated at $2.5
billion (38%) and $2.3 billion in NY (35%)

New Jersey, 60,000 , 26%
All Other, 40,500 , 18%
New York, 130,000 ,
56%
Hurricane Sandy
•Estimated 230,500 vehicle claims
•$779 million in insured losses.
•Average loss per claim is $3,380
•Nearly 60% of the claims occurred in
NY state.
Hurricane Sandy: Number of Auto Claims by State*
*Preliminary as of 11/26/12.Source: PCS. 15
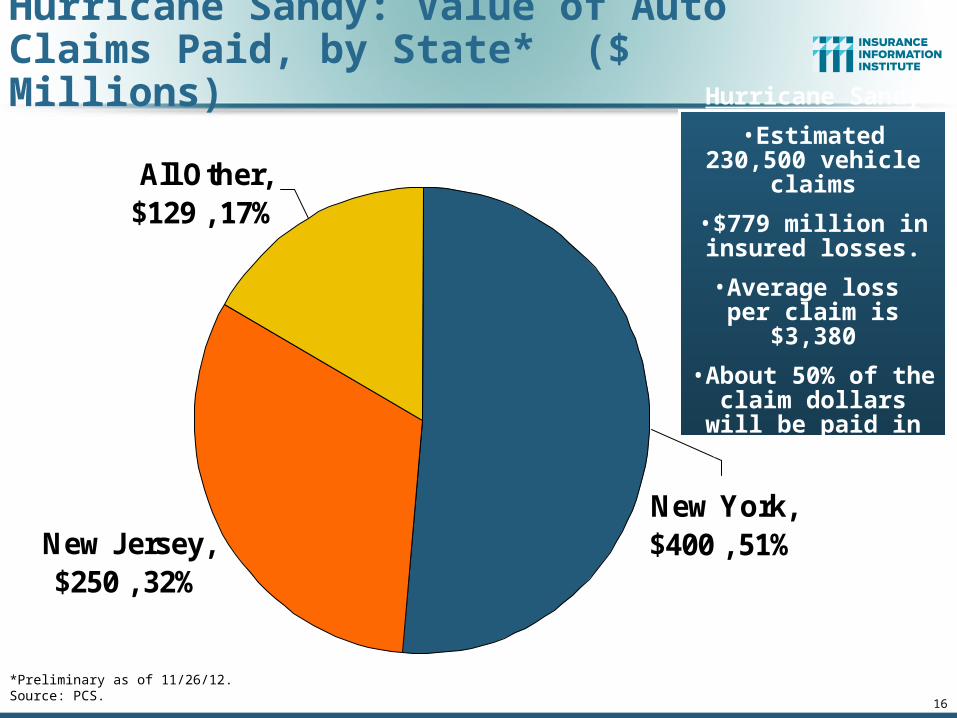
New Jersey, $250 , 32%
All Other, $129 , 17%
New York, $400 , 51%
Hurricane Sandy
•Estimated 230,500 vehicle claims
•$779 million in insured losses.
•Average loss per claim is $3,380
•About 50% of the claim dollars will be paid in NY, 32% in
NJ.
Hurricane Sandy: Value of Auto Claims Paid, by State* ($ Millions)
*Preliminary as of 11/26/12.Source: PCS. 16

17
Federal Aid Requests by States With Greatest Sandy Impact (as of 12/10/12)
*As of Dec. 10, 2012.Source: New York Times, Dec. 6, 2012; Insurance Information Institute.
Billions
$0
$10
$20
$30
$40
$50
$60
$70
New York New Jersey Connecticut Obama AdministrationProposal
Mitigation/Prevention
Repair
State Aid Requests Come at a Challenging Time in the Nation's Fiscal History
$33.0
$7.4
$29.5
$42.0$9.0
$6.0
$36.9
$7.9
17
$33B to repair subways, hospitals and other
facilities; $9B to upgrade infrastructure against future storms
$3.2
$60.4*
$39.5B to repair schools roads, bridges,
businesses, homes and other facilities; $7.4B to
for mitigation and prevention against future
storms
$3.2B to bury power lines, upgrade transmission
systems, build sewage treatment plants and other
mitigation projects

Flood Insurance Program: 2012 Reforms
18
2012 Reforms Were a Step in the Right Direction—But Too Late to
Help With Sandy Shortfall
18

Source: Wharton Center for Risk Management and Decision Processes, Issue Brief, Nov. 2012; Insurance Information Institute.
Residential NFIP Flood Take-Up Rates in NJ (2010) & Sandy Storm Surge
19
Flood coverage penetration rates were extremely low in
many very vulnerable areas in NJ, with take-up rates far below
50% in many areas

Source: Wharton Center for Risk Management and Decision Processes, Issue Brief, Nov. 2012; Insurance Information Institute.
Residential NFIP Flood Take-Up Rates in NY, CT (2010) & Sandy Storm Surge
20
Flood coverage
penetration rates were
extremely low in many very vulnerable
areas of NY and CT, with take-up rates far below 50% in many areas

21
Flood Insurance Reform & Modernization Act of 2012: Key Provisions Reauthorized NFIP and Its Financing Through 9/30/17 Increase in Average Annual Limit on Premium Increase
Increases annual limit on premium increase from 10% to 20%
Phase-in of Actuarial Rates for Certain Properties Applies to non-primary residences, severe repetitive loss properties,
properties where flood losses have exceed property value, business property, property that has sustained damage > 50% of fair market value
Actuarial Sound Rates for Certain Severe Repetitive Loss Properties Charge actuarially sound rates to any prospective or repetitive loss
properties that refused to accept offers of mitigation assistance after a major disaster
Prohibition of Premium Rate Subsidy on New or Lapsed Policies
Source: Independent Insurance Agents and Brokers Association at http://www.iiaba.net/webfolder/na/jeff/big%20i%20firm%20summary.pdf; Insurance Information Institute.
www.iii.org
Thank you for your timeand your attention!
Twitter: twitter.com/bob_hartwigDownload at www.iii.org/presentations
Insurance Information Institute Online:
22


