The Roadmap toIOOS StoryTemplate
Why Have a Roadmap to IOOS Story Template
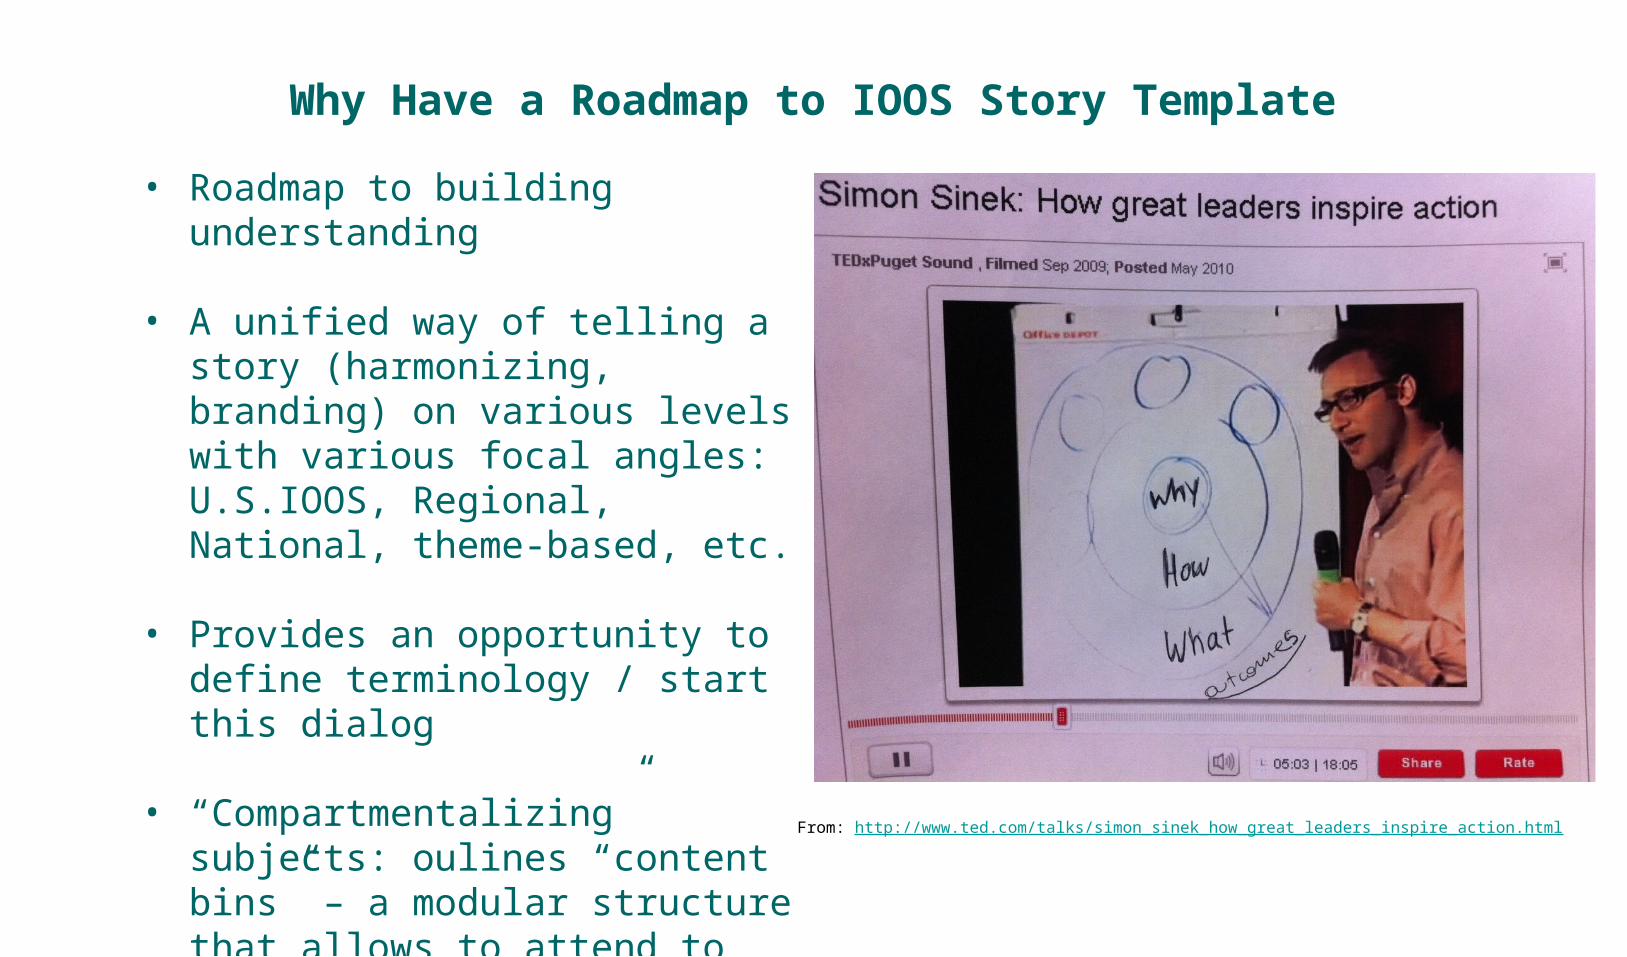
• Roadmap to building understanding
• A unified way of telling a story (harmonizing, branding) on various levels with various focal angles:U.S.IOOS, Regional, National, theme-based, etc.
• Provides an opportunity to define terminology / start this dialog
• “Compartmentalizing” subjects: oulines “content bins” – a modular structure that allows to attend to content on a pieced basis, as resources permit.
From: http://www.ted.com/talks/simon_sinek_how_great_leaders_inspire_action.html
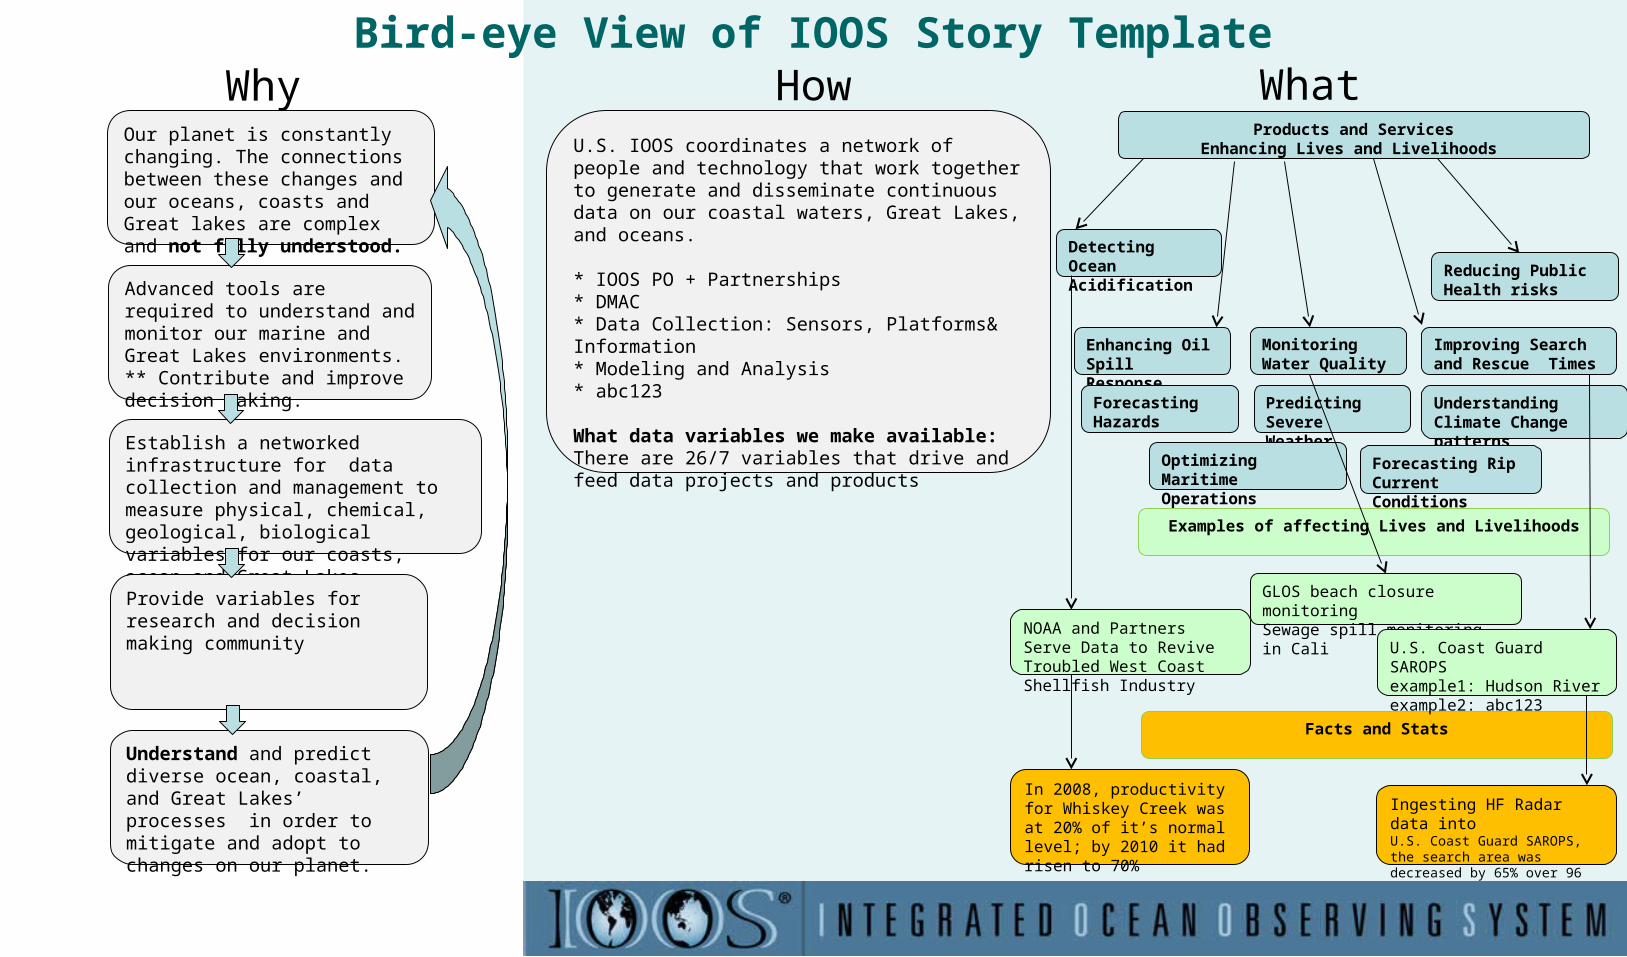
Our planet is constantly changing. The connections between these changes and our oceans, coasts and Great lakes are complex and not fully understood.
Advanced tools are required to understand and monitor our marine and Great Lakes environments.** Contribute and improve decision making.
Establish a networked infrastructure for data collection and management to measure physical, chemical, geological, biological variables for our coasts, ocean and Great Lakes.
Provide variables for research and decision making community
Understand and predict diverse ocean, coastal, and Great Lakes’ processes in order to mitigate and adopt to changes on our planet.
Why HowU.S. IOOS coordinates a network of people and technology that work together to generate and disseminate continuous data on our coastal waters, Great Lakes, and oceans.
* IOOS PO + Partnerships* DMAC* Data Collection: Sensors, Platforms& Information* Modeling and Analysis* abc123
What data variables we make available: There are 26/7 variables that drive and feed data projects and products
What
Monitoring Water Quality
Improving Search and Rescue Times
Detecting Ocean Acidification
Enhancing Oil Spill Response
Products and ServicesEnhancing Lives and Livelihoods
NOAA and Partners Serve Data to Revive Troubled West Coast Shellfish Industry
Examples of affecting Lives and Livelihoods
GLOS beach closure monitoringSewage spill monitoring in Cali
Predicting Severe Weather
Understanding Climate Change patterns
Forecasting Rip Current Conditions
Reducing Public Health risks
Forecasting Hazards
Optimizing Maritime Operations
Facts and Stats
In 2008, productivity for Whiskey Creek was at 20% of it’s normal level; by 2010 it had risen to 70%
U.S. Coast Guard SAROPSexample1: Hudson Riverexample2: abc123
Ingesting HF Radar data intoU.S. Coast Guard SAROPS, the search area was decreased by 65% over 96 hours.
Bird-eye View of IOOS Story Template
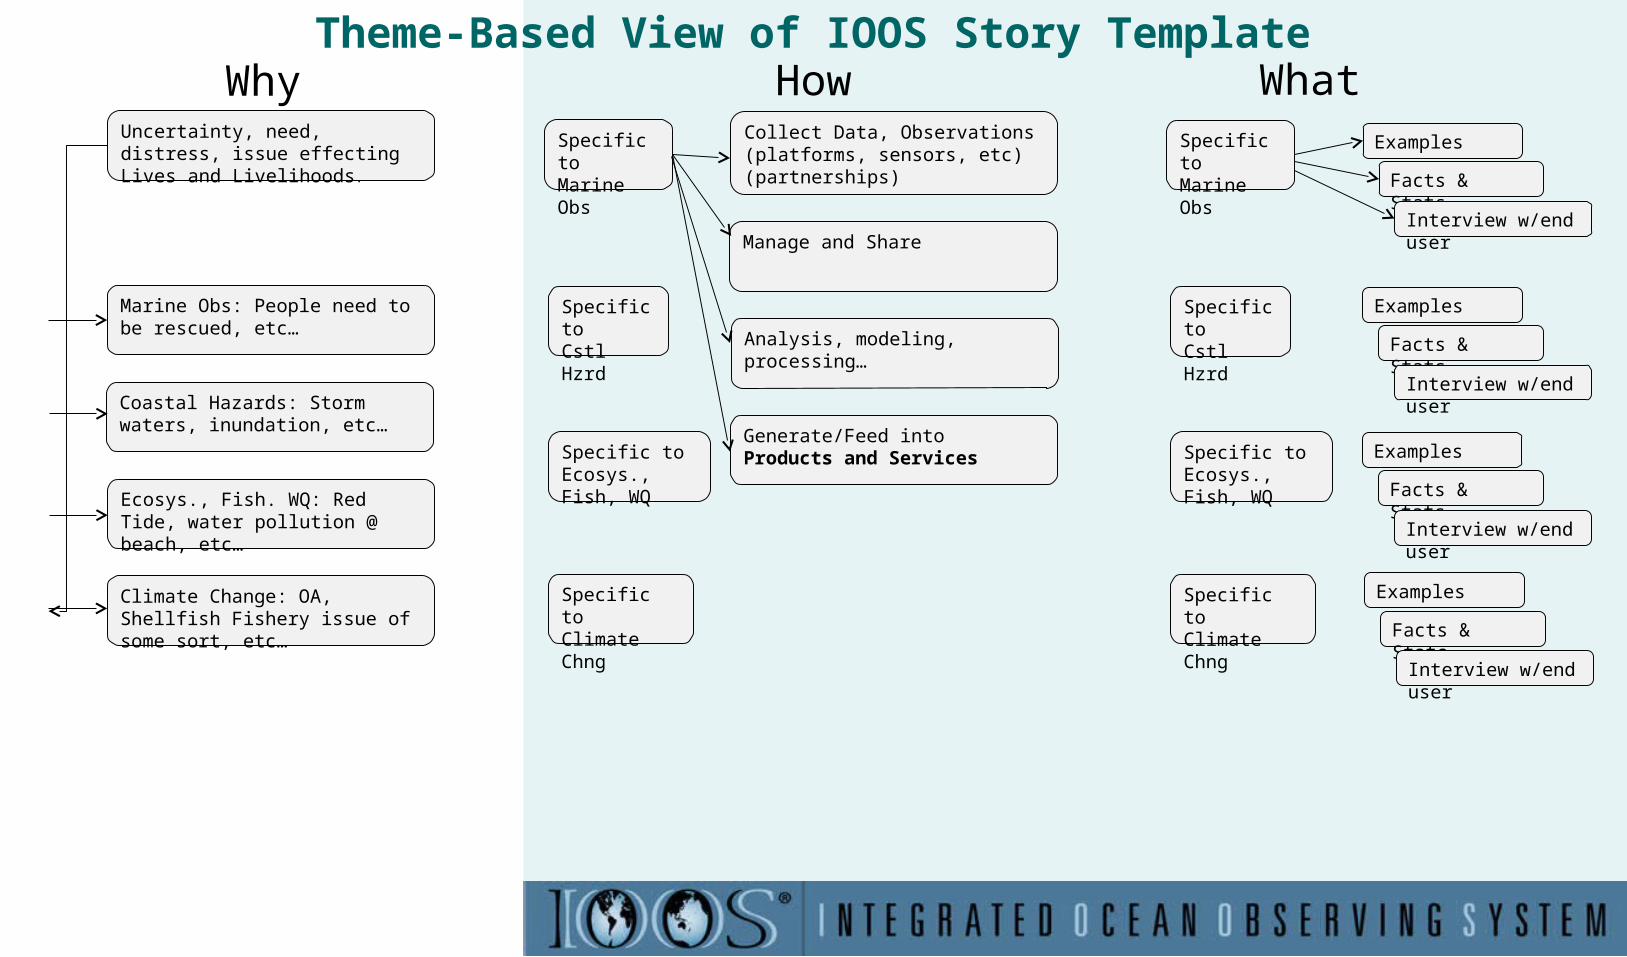
The IOOS Story TemplateUncertainty, need, distress, issue effecting Lives and Livelihoods.
Why How What
Marine Obs: People need to be rescued, etc…
Coastal Hazards: Storm waters, inundation, etc…
Ecosys., Fish. WQ: Red Tide, water pollution @ beach, etc…
Climate Change: OA, Shellfish Fishery issue of some sort, etc…
Collect Data, Observations (platforms, sensors, etc) (partnerships)
Manage and Share
Analysis, modeling, processing…
Generate/Feed intoProducts and Services
Specific toMarine Obs
Specific toClimate Chng
Specific toCstl Hzrd
Specific toEcosys., Fish, WQ
Examples
Facts & Stats
Interview w/end user
Examples
Facts & Stats
Interview w/end user
Examples
Facts & Stats
Interview w/end user
Examples
Facts & Stats
Interview w/end user
Specific toMarine Obs
Specific toClimate Chng
Specific toCstl Hzrd
Specific toEcosys., Fish, WQ
Theme-Based View of IOOS Story Template


