
The Wolfson Centre for Bulk Solids Handling Technology
UNIVERSITY OF GREENWICH
BCURA Agreement B89
Project Start Date: 01/10/2007
Project End Date: 30/09/2010
Final Report
Improving Performance of Discharge Equipment for Coals with Poor
Handling Characteristics
University Project Manager
Professor Mike Bradley
The Wolfson Centre for Bulk Handling Solids Technology
University of Greenwich
Central Avenue
Chatham, Kent, ME4 4TB
Tel: 020 8331 8646; Fax: 020 8331 8647
BCURA Industrial Supervisor Dr. Ruth Poultney
Tata Steel Teesside Technology Centre
PO Box 11
Grangetown
Middlesbrough, TS6 6US
Tel: 01642 382107; Fax: 01642 460321
PhD Programme Author
Mr. Karol Ariza-Zafra
The Wolfson Centre for Bulk Handling Solids Technology
University of Greenwich
Central Avenue
Chatham, Kent, ME4 4TB
Tel: 020 8331 8646
ii
EXECUTIVE SUMMARY
Introduction Some coals handled in the UK have variable or poor flow properties, owing to near-critical moisture
contents and/or substantial fines contents. Unreliable flow and variable discharge rates are
commonplace when handling these coals through existing equipment, much of which was not
designed using the appropriate techniques for determining optimum plant geometry. Inappropriate
silo design often results in the granular material discharging through a flow channel above the outlet
of the silo, creating stagnant zones near the walls. This type of discharge is known as core flow and is
in most cases, the cause of the problems mentioned above. To obtain best results in terms of
reliability and consistency, it is desirable for the solids to discharge in a mass flow pattern. In this
type of flow pattern, the solids slip at the walls of the silo and there is an even movement throughout
the cross section of the bin.
Although through the use of standard techniques it is possible to ensure silos are designed to
discharge in mass flow and cope with any given set of flow properties, the redesign and rebuilding of
existing hoppers and associated equipment are rarely justifiable on economic grounds. It is therefore
desirable to have available a range of retro-fit techniques which can be applied to existing silos (and
designed into new equipment), to enable the handling of coals with a wider range of flow properties.
Research on the use of static inserts inside bunkers has shown them to be a simple and cost-effective
retro-fit method to improve discharge, by modifying the discharge pattern developed in the silo. They
consume no energy and have little to go wrong, compared with mechanical flow-assisting devices.
However, in most cases there are no quantitative-based guidelines for the selection of the size, shape
or position of the insert that could maximize the benefits produced. Other research on the design of
discharge-control devices for controlled feed-rate has shown that even where flow is reliable,
discharge rate variation can be substantial for many industrial systems, and that relatively small
changes can improve regularity and repeatability of flow significantly. Retrofitting a novel device,
which exploits this understanding, in existing industrial discharge control systems, has led to
substantially improved reliability, accuracy and consistency of flow.
Objectives
To develop an understanding that supports the use of static inserts in existing storage silos to
improve discharge performance, allowing them to handle coals that exhibit problematic flow
properties reliably. From this understanding, practical guidelines for the design and installation of
the inserts should be issued.
To evaluate the application of a novel powder discharge control device (based on the use of
special channel profiles and pore-pressure control) for coal handling plants.
Overview of the Work Undertaken, Results and Discussion Although the project was originally proposed to pursue two objectives, it was agreed with the
industrial and academic supervisory team to place on hold the work with the discharge control device
and focus on the development of the insert technology for improving discharge. After the inspection
of some coal handling processes, it was found that most of the problems were a consequence of core
flow developed during discharge. This suggested that the use of inserts could potentially be a more
suitable solution for those types of problems.
Work was undertaken in three main stages:
Test rig development for the study of static inserts as flow promoting devices
Study of insert configuration to optimize discharge performance
Case study to optimise the flow of a granular coal from a silo with multiple outlets.
In the first stage of the project, a test rig was designed and built to evaluate the influence of flat plate
inserts in the discharge behaviour of coal in a hopper exhibiting a core flow pattern. The tests showed
that the installation of the flat plates widened the discharge channel observed in absence of inserts,
iii
and even movement at the wall was observed in a short section at the top of the silo. These
observations indicated a significant improvement in the discharge pattern of the silo. The test rig was
then modified with the inclusion of a system to infer the discharge pattern accurately. Two inverted
cone inserts were evaluated; one designed using a method developed by Johanson in 1965 and the
other one using a modified Johanson method (proposed in the project). The results showed that when
the head of material was relatively low, Johanson‟s insert widened the flow channel until it touched
the walls of the silo, but it did not produce mass flow as the material in the lower part of the silo
remained stagnant. When the head of material was large, mass flow was obtained. Using the
modified insert the improvement was evident because it was capable of producing mass flow at lower
heights of head of material. When the head of material was large, the solids were drawn more evenly
across the silo than when Johanson‟s insert was used.
The second section of the work focused on the evaluation of different shapes, sizes and positions of
inserts to maximize the benefits produced. The tests were carried out at bench scale and inverted
cones were evaluated to compare the outcome with the results obtained with the larger rig. The
comparison showed that the bench scale set up gave a good indication of the performance of the
inserts. To tackle the problems commonly associated with the use of inverted cones, a novel open
double cone type of insert was designed. This generated more consistent results than the inverted
cones, it was capable of sustaining mass flow with lower heads of material and produced steadier
values of flow rate. Combining the methods for inverted cones and open double cones, a method was
proposed for the design of double cones, which also showed an improvement in discharge rate
consistency and mass flow capabilities when compared with inverted cones. For silos containing
highly cohesive materials, they offer a better option than open double cones, because the minimum
silo outlet size required would be smaller. However, open double cones still gave a better
performance in terms of producing mass flow at low heads of material.
The last part of the work comprised an industrial case study where insert technology could be applied
to overcome discharge problems. A 650 tonne silo storing granular coal has been reported to exhibit
an unreliable flow rate and changes in the bulk density of the coal. The silo features multiple outlets
discharging one at a time, causing the solids to move in a core flow pattern. A bench scale model of
the silo was built to study the discharge behaviour of the coal and it was observed to develop a narrow
channel above the open outlet. Due to the complex geometry of the silo, one of the inserts described
above could not be used and therefore a customized insert was designed. With this insert in place, the
flow channel expanded until it touched the walls of the silo allowing the majority of material to move
during discharge. This type of insert should reduce or eliminate the problems on plant.
Conclusions
Inverted cones, double cones and open double cones have been evaluated as flow-promoting devices
for conical hoppers. In each case, a procedure for the design and positioning of the insert has been
issued, including the refinement of a established method for inverted cones and two new methods for
the other inserts. Each type of insert was capable of producing mass flow in silos previously
discharging in core flow. Compared to all inserts evaluated, the open double cone insert gave the most
consistent result especially for low values of head of material, and the double cone represents the best
choice for cohesive materials.
Achievements
The outcome of the project includes the design methods for various types of inserts, offering a
powerful tool for a process engineer facing flow problems caused by core flow in conical silos. The
right choice of insert should be made according to the exigencies of the process and the characteristics
of the materials. However, the simplicity of the methods ensure that even in circumstances where a
difficult bulk material needs to be handled, an economic and easy to implement solution can be found.
Even in cases where the silo geometry is different from conical shape, the understanding of the effect
the inserts have on the flow conditions of bulk solids gives the engineer the basis to tackle the
problem, as demonstrated in the case study of the granular coal silo with multiple outlets.
iv
CONTENTS
EXECUTIVE SUMMARY ii
CONTENTS iv
Chapter One: Introduction 1
1.1 Objectives 2
1.2 Overview of Previous Research on Inserts 2
1.3 Greenwich Discharge Control Device 3
Chapter Two: Test Rig Development for the Study of Static Inserts as
Flow Promoting Devices
4
2.1 Initial Stages 5
2.1.1 Test Rig Design and Construction 5
2.1.2 Commissioning of the Test Rig 6
2.1.3 Results and Discussion 7
2.2 Evolution of the Test Rig 11
2.2.1 Test Rig Design and Construction 11
2.2.1.1 Main Structure 11
2.2.1.2 Inserts 13
2.2.1.3 Discharge Pattern Tracer System 14
2.2.2 Commissioning of the Test Rig 16
2.2.2.1 Silo Allowed to Drain After Filling 16
2.2.2.2 Silo with Additional Material Fed During Discharge 17
2.2.3 Results and Discussion 18
2.2.3.1 Silo Allowed to Drain After Filling 18
2.2.3.2 Silo with Additional Material Fed During Discharge 21
2.2.3.3 Vertical Load Acting on the Cylindrical Section of the Silo 23
2.2.3.4 Vertical Load Acting on the Inserts 24
2.3 Summary 25
Chapter Three: Study of Insert Configuration to Optimize Discharge
Performance
26
3.1 Test Rig Description 26
3.2 Inserts 27
3.2.1 Inverted Cone Inserts 27
3.2.2 Open Double Cone Inserts 28
3.2.2.1 First Generation 28
3.2.2.2 Second Generation 30
3.2.2.3 Third Generation 31
3.2.3 Double Cone Inserts 31
3.2.3.1 First Generation 32
3.2.3.2 Second Generation 32
3.3 Results and Discussion 33
3.4 Summary 37
v
Chapter Four: Case Study – Granular Coal Silo with Multiple Outlets 37
4.1 Description of the Industrial Silo 37
4.2 Bench Scale Model 38
4.2.1 Half Silo Test Rig 39
4.2.2 Complete Silo Test Rig 40
4.3 Summary 44
CONCLUSIONS 44
PROPOSED WORK FOR A SUBSEQUENT PROGRAMME 47
PUBLICATIONS ARISING FROM THE PROJECT 48
REFERENCES 48
LIST OF FIGURES AND TABLES 49
APPENDIX A 51
APPENDIX B 54
LIST OF FIGURES AND TABLES IN APPENDICES 57
ANNEXES (COPY OF PUBLICATIONS) 57
Review of Models for Predicting the Discharge Rates of Bulk Particulates
from Silos and Bins
58
Study of Discharge Behaviour in a Silo Retrofitted with Flow-Promoting
Inserts
67
Achieving Mass Flow in Silos with Shallow Converging Sections Using
Inverted Cones
70

1
CHAPTER ONE: INTRODUCTION
The process for the handling and storage of coal can vary significantly from company to company and
even plant to plant within a particular company. Coal is commonly stored in silos or piled in
stockyards (in which it is exposed to the weather conditions which can result in varying moisture
content within the stockpiles ranging from dry at the surface to a drained condition towards the base –
additional moisture can also be introduced from wetting to reduce dust and lift off). Following bulk
storage and subsequent reclaim, it is crushed and stored in buffer silos that feed the production
process. Additional stages such as blending, drying or further size reduction may be required
depending on the type of industry. The influence of the design of handling equipment on reliable
operation is usually not fully appreciated until problems occur. As a result, flow problems (like
material hang-ups, intermittent or erratic flow, inconsistent coal characteristics, loss of storage
capacity, among others) are commonly found in storage equipment. Many different methods are
employed to overcome these flow problems, ranging from vibrators and nitrogen cannons to manually
hammering silos.
To devise a solution for the flow problems outlined above, it is fundamental to comprehend the
mechanisms that made those problems appear in the first place. In a silo that has been designed for
reliable flow, there is an even draw of material across the whole cross-sectional area of the bin,
discharging in a first in first out flow pattern. This process produces a compact and consistent
discharge. To achieve this effect (known as mass flow, see Figure 1.1a), the walls of the converging
section of the silo must be steep enough to allow the flow of material in contact with the wall -
overcoming the frictional forces at this boundary. Additionally, the aperture of the silo must be large
enough to ensure that a cohesive arch (bridge) of material will not form over the outlet and prevent
flow. Should either appropriate convergence angle or outlet dimension not be present in the storage
scheme the material near the walls will become stagnant, and a discharge channel will be formed that
originates from above the active flow region of the outlet - this discharge behaviour is known as core
flow (see Figure 1.1b). For this discharge behaviour, the fresh material fed to the silo will tend to be
drawn into the central channel and will enter the process almost immediately and the material that was
fed first will come out only when the silo is drained completely (which in some cases can be after
several years). The lack of residence time for freshly introduced material in the bin and the material
shearing against itself at the boundaries of the preferential flow channel are the main causes of
irregular discharge and inconsistent bulk characteristics (particularly bulk density).
Figure 1.1a Mass Flow Figure 1.1b Core Flow
Figure 1.1 Discharge Patterns
Although through the use of standard techniques it is possible to ensure silos are designed to
discharge in mass flow and cope with any given set of flow properties, this is often not a practical
solution, as the redesign and rebuilding of existing hoppers and associated equipment are rarely
2
justifiable on economic grounds. It is therefore desirable to have available a range of retro-fit
techniques, which can be applied to existing silos (or even designed-in as an option on new
equipment) to enable the handling of coals with a wider range of flow properties.
Research on the use of static inserts inside bunkers has been shown to be a simple and cost-effective
retro-fit method to improve discharge, by modifying the discharge pattern developed in the silo. They
consume no energy and have little to go wrong, compared with mechanical flow assistance devices,
yet have been effective in promoting flow from bins with materials which would simply not discharge
reliably without the insert. However, in most cases there are no quantitative-based guidelines for the
selection of the size, shape or position of the insert that could maximize the benefits produced.
Other research at The Wolfson Centre for Bulk Solids Handling Technology on the design of
discharge-control devices for controlled feed-rate [Farnish, 2000] has shown that even where flow is
reliable, discharge rate variation can be substantial for many industrial systems, and that relatively
small changes can improve regularity and repeatability of flow significantly. A novel device has been
developed (UK patent applied for) which exploits this understanding, comprising:-
The use of flow channel profiles specially selected (in the light of measured bulk solid flow
properties) to promote shear against the walls which constrain the flow, rather than within the
flow itself.
The use of pore-pressure control (the regulation of the gas pressure in the interstices between the
particles through introducing or exhausting air to or from the flow at a controlled rate).
The value of the former approach has been shown in several projects where The Wolfson Centre has
re-engineered (at relatively low cost) pre-existing industrial discharge control systems, leading to
substantially improved reliability, accuracy and consistency of flow.
1.1 Objectives
To develop an understanding that supports the use of inserts in existing storage silos to improve
discharge performance, allowing them to handle coals that exhibit problematic flow properties
reliably. From this understanding, practical guidelines for the design and installation of the
inserts should be issued.
To evaluate the application of a novel powder discharge control device (based on the use of
special channel profiles and pore-pressure control) to coal handling plants.
1.2 Overview of Previous Research on Inserts
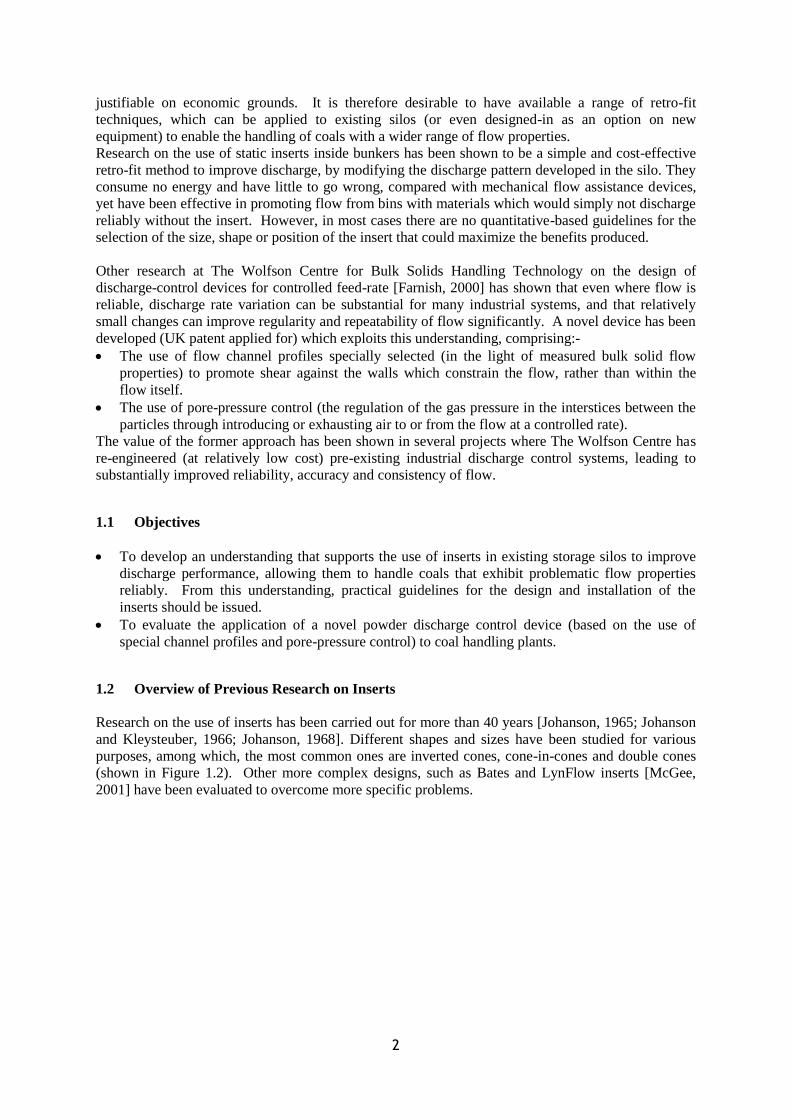
Research on the use of inserts has been carried out for more than 40 years [Johanson, 1965; Johanson
and Kleysteuber, 1966; Johanson, 1968]. Different shapes and sizes have been studied for various
purposes, among which, the most common ones are inverted cones, cone-in-cones and double cones
(shown in Figure 1.2). Other more complex designs, such as Bates and LynFlow inserts [McGee,
2001] have been evaluated to overcome more specific problems.
3
a b c
Figure 1.2 Common Shapes of Inserts; a – Inverted Cone, b – Cone-in-Cone and c –
Double-Cone
In one of the earliest publications [Johanson, 1965], Johanson made a theoretical approach to
determine the optimum size and position of the inverted cones inside conical hoppers. He developed a
procedure to calculate the geometry of the insert and its placement to widen the discharge channel in
core flow hoppers. Later, Johanson and Kleysteuber [Johanson, 1966] studied the pressures exerted on
inserts (inverted cones) and the way they should be supported inside the hoppers to avoid structural
failure. In the early nineteen eighties, a different type of insert was developed by Johanson, which
was part of a patented blending apparatus for bulk solids. This insert, known as Binsert, is a conical
hopper designed to obtain mass flow, which is installed in a silo and is capable of improving its
discharge performance. These types of inserts are generally known as „cone-in-cone‟ inserts.
In the mid-nineteen eighties, Tuzun and Nedderman [Tuzun, 19851; Tuzun, 19852], studied the effect
that triangular and cubic inserts had on the shape of streamlines of particles when discharging in a
silo, as well as the effect of the inserts on the stress profiles on the walls of the silo. However, this
study was focused more towards modelling the phenomena, than towards industrial application or
flow promotion. A decade later, Strusch and Schwedes [Strusch, 1994; Strusch, 1998] measured wall
stress distribution and forces on inserts inside plane flow hoppers and developed a mathematical
model based on slice element methods.
During the last fifteen years, a large percentage of the research done on inserts has been carried out at
the POSTEC institute, where several projects [Klonteig, 1997; Karlsen, 1998; Enstad, 1999;
Schuricht, 2001; Ding, 2002; Ding, 2003; Ding, 20041; Ding, 20042; Ding, 2005; Enstad, 2007; Ding,
2008; Xiao, 2008; Hartl, 2008; Schuricht, 2008] have been conducted on the use of cone-in-cone and
double-cone inserts aiming to obtain mass flow in core flow silos. In 2006, Chou and Chang [Chou,
2006], following the approach made by Strusch and Schwedes [Strusch, 1994; Strusch, 1998] for
plane flow hoppers, developed a theoretical model for the prediction of wall stresses and insert loads
in a conical hopper with a inverted cone insert. However, it is a theoretical development only and has
not been verified experimentally.
1.3 Greenwich Discharge Control Device
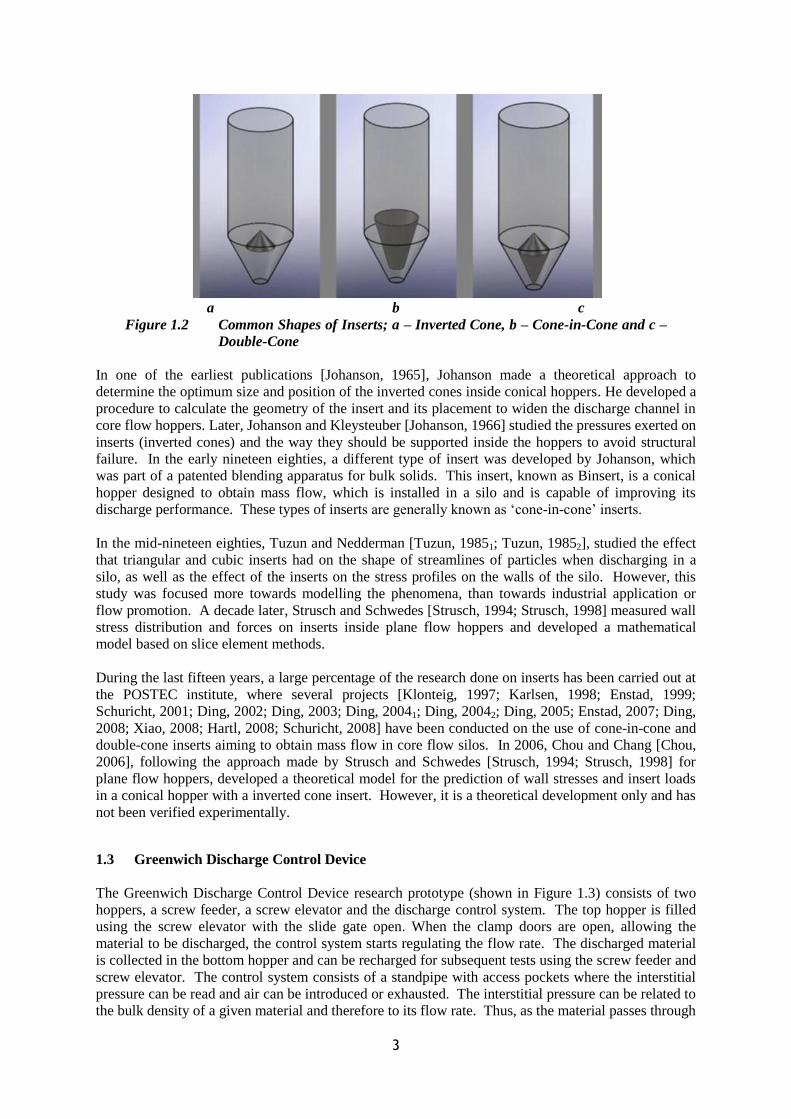
The Greenwich Discharge Control Device research prototype (shown in Figure 1.3) consists of two
hoppers, a screw feeder, a screw elevator and the discharge control system. The top hopper is filled
using the screw elevator with the slide gate open. When the clamp doors are open, allowing the
material to be discharged, the control system starts regulating the flow rate. The discharged material
is collected in the bottom hopper and can be recharged for subsequent tests using the screw feeder and
screw elevator. The control system consists of a standpipe with access pockets where the interstitial
pressure can be read and air can be introduced or exhausted. The interstitial pressure can be related to
the bulk density of a given material and therefore to its flow rate. Thus, as the material passes through
4
the standpipe, the interstitial pressure is read and then shifted to the desired value with the
introduction/exhaustion of air consequently modifying the flow rate.
Figure 1.3 Greenwich Discharge Control Device
The initial development of the discharge control technology was undertaken at The Wolfson Centre
for Bulk Solids Handling Technology using devices with the same functioning principle but with
manual operation. It included some performance enhancements and was designed to operate
automatically. Part of the work undertaken in the present project included the instrumentation of the
prototype, which comprised the selection and installation of the data acquisition system, installation of
a dust control system and the creation of software for the automatic operation of the prototype.
However, in agreement with the industrial and academic supervisory team, the work on the
Greenwich Discharge Control Device was placed on hold to give priority to the development of the
insert technology. This decision was the result of the analysis of the problems exhibited by some coal
handling processes. The processes observed (including coke production and coal injection into blast
furnaces) use coal with particle sizes ranging from a few microns to several centimetres, and
processing conditions varying from stockpile storage, exposed to the elements, to controlled
atmosphere transport and storage using nitrogen. Some of the problems identified included silos
hammered due to flow stoppages, rathole forming in bunkers which reduced the live storage capacity
and produced flow unreliability, bulk density variability affecting the consistency of the downstream
process, among others. In most of the cases observed, the solution of the problem was associated with
the change of flow behaviour of the coal inside the silos, what could be achieved through the use of
inserts but not through the use of the use of the Greenwich Discharge Control Device.
CHAPTER TWO: TEST RIG DEVELOPMENT FOR THE STUDY OF STATIC INSERTS
AS FLOW PROMOTING DEVICES
The aim of this chapter is to present the practical work undertaken at a laboratory scale (0.1 – 0.4 m3
silo capacity) for the study of static inserts. The contents comprise a description of the rigs employed
as well as their design, construction, commissioning, the results obtained and their analysis. The work
included two types of inserts, flat plates and inverted cones, which, although different in shape,
produce a similar effect of the flowing material. A method for the design and positioning of these two
types of inserts is also analysed in the present chapter.

5
2.1 Initial Stages
2.1.1 Test Rig Design and Construction
The first step undertaken was to design and build a fairly basic test rig to try to understand the way the
static inserts affect the discharge of bulk solids. The rig should at least provide the opportunity to
observe a granular material discharging from a bin, both in the presence and absence of inserts. For
this purpose, the test rig shown in Figure 2.1 was designed.
Figure 2.1 Schematic Design of the Initial Test Rig
The rig consisted of a conical hopper of 30° half angle hanging from load cells, a slide valve with an
attached load cell and a bracket supported on a load cell, where various types of inserts can be
mounted. For the construction, a modular metal frame was used for the rig, and an existing hopper
was adapted to comply with the required geometry. The conical hopper made of stainless steel, had a
half angle of 30° and vertical section diameter of 550 mm. The height of the vertical section was 270
mm and the hopper outlet diameter was 150 mm. To modify the hopper, a stainless steel extension
cone was designed and assembled on the lower part of the hopper, in order to reduce the diameter of
its outlet to 100 mm.
Although the hopper was initially designed to be suspended from four load cells, only three were used
to reduce the costs and ensure an even distribution of the load. LCM Systems-BF2 beam load cells,
with a range extending from 0 to 30 Kg, were employed for this purpose. Two steel rails were welded
on one of the modules of the frame to allow the movement of the slide valve, which was built on a
trolley. The slide gate was built on a trolley, which rolled on two rails welded on to one of the
modules of the frame. A square mild steel plate was mounted on the trolley acting as the shutter. The
bracket for the inserts consisted of a 6 mm stainless steel rod hanging from a 0-30 Kg LCM Systems-
BF2 beam load cell, which was mounted on the upper most module of the frame. The rod gave the
possibility of modifying the vertical position of the inserts, allowing study of the effect of relative
insert position on the discharge of solids. Additionally, the reading obtained from the load cell
holding the rod would provide a measurement of the vertical load acting on the inserts, which is a key
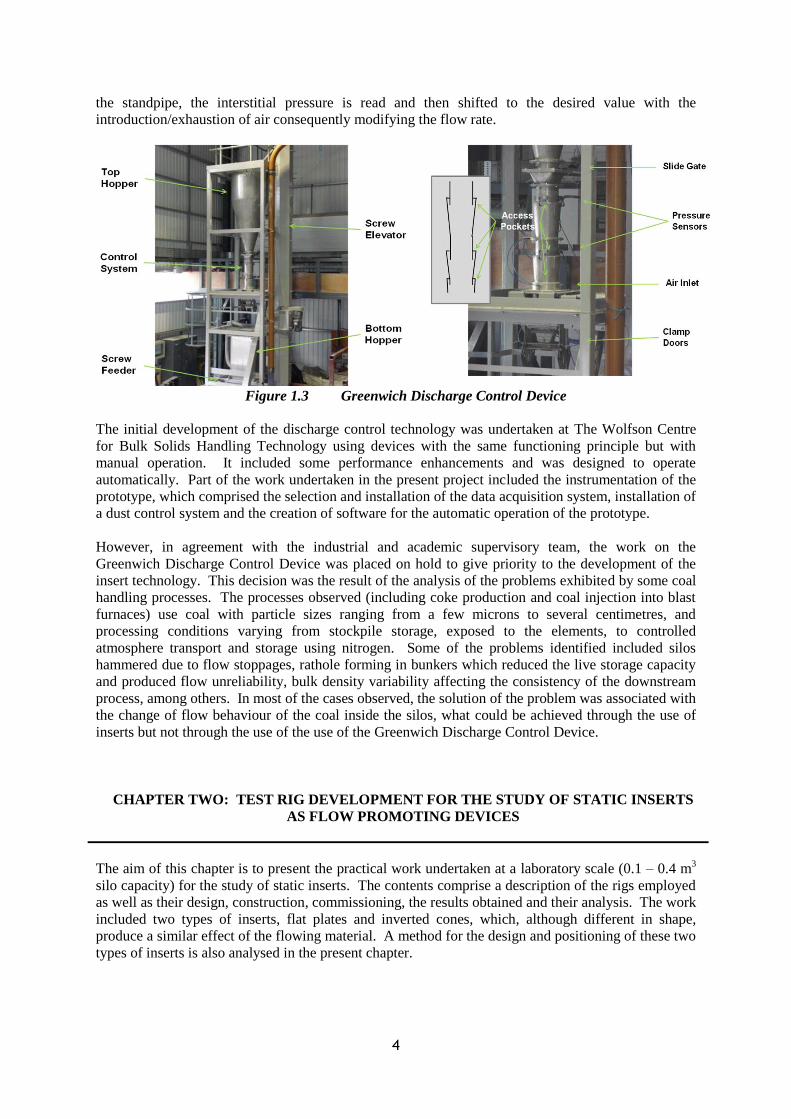
design feature from a structural point of view. Figure 2.2 shows the finished test rig.
6
Figure 2.2 Initial Test Rig
In order to collect the data from the tests, a data acquisition system was designed and built. For this
purpose ADAM 4016 I/O units were used. Software was created to store and display the data during
the tests, the application development tool used was ADAMView 1st Edition.
2.1.2 Commissioning of the Test Rig
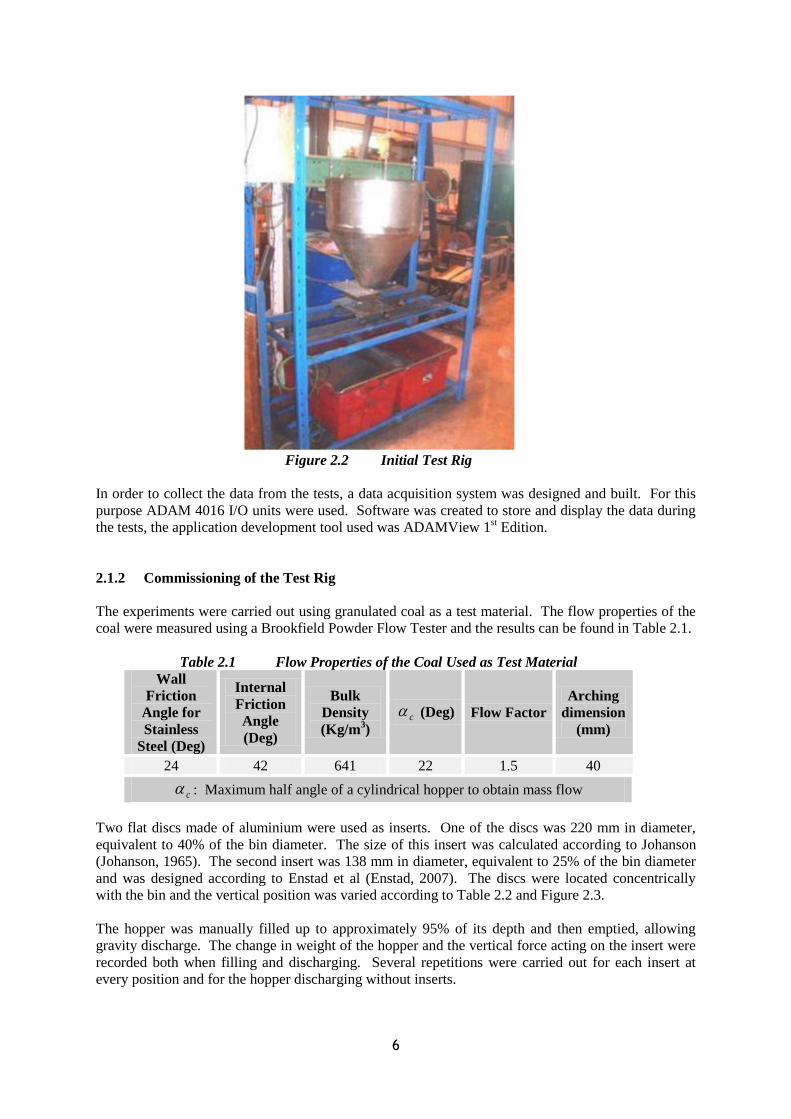
The experiments were carried out using granulated coal as a test material. The flow properties of the
coal were measured using a Brookfield Powder Flow Tester and the results can be found in Table 2.1.
Table 2.1 Flow Properties of the Coal Used as Test Material
Wall
Friction
Angle for
Stainless
Steel (Deg)
Internal
Friction
Angle
(Deg)
Bulk
Density
(Kg/m3)
c (Deg) Flow Factor
Arching
dimension
(mm)
24 42 641 22 1.5 40
c : Maximum half angle of a cylindrical hopper to obtain mass flow
Two flat discs made of aluminium were used as inserts. One of the discs was 220 mm in diameter,
equivalent to 40% of the bin diameter. The size of this insert was calculated according to Johanson
(Johanson, 1965). The second insert was 138 mm in diameter, equivalent to 25% of the bin diameter
and was designed according to Enstad et al (Enstad, 2007). The discs were located concentrically
with the bin and the vertical position was varied according to Table 2.2 and Figure 2.3.
The hopper was manually filled up to approximately 95% of its depth and then emptied, allowing
gravity discharge. The change in weight of the hopper and the vertical force acting on the insert were
recorded both when filling and discharging. Several repetitions were carried out for each insert at
every position and for the hopper discharging without inserts.

7
Table 2.2 Inserts Vertical Position
Distance from the outlet of the hopper (mm)
Position Insert Diameter
220 mm
Insert Diameter
138 mm
A 190 119
B 240 239
C 300 330
Figure 2.3 Inserts Vertical Position
2.1.3 Results and Discussion
The results obtained from the tests for the loads on inserts are presented in Figures 2.4 and 2.5.
Although the load applied to the insert during the filling process was recorded, it has not been
presented in the results, because for research purposes what happens at the moment when the
discharge starts is really important.

8
a
P
osi
tio
n A
b
P
osi
tio
n B
c
Posi
tion
C
Figure 2.4 Measurements of the Vertical Load Acting on the Large Insert
9
a
P
osi
tio
n A
b
P
osi
tio
n B
c
Posi
tion
C
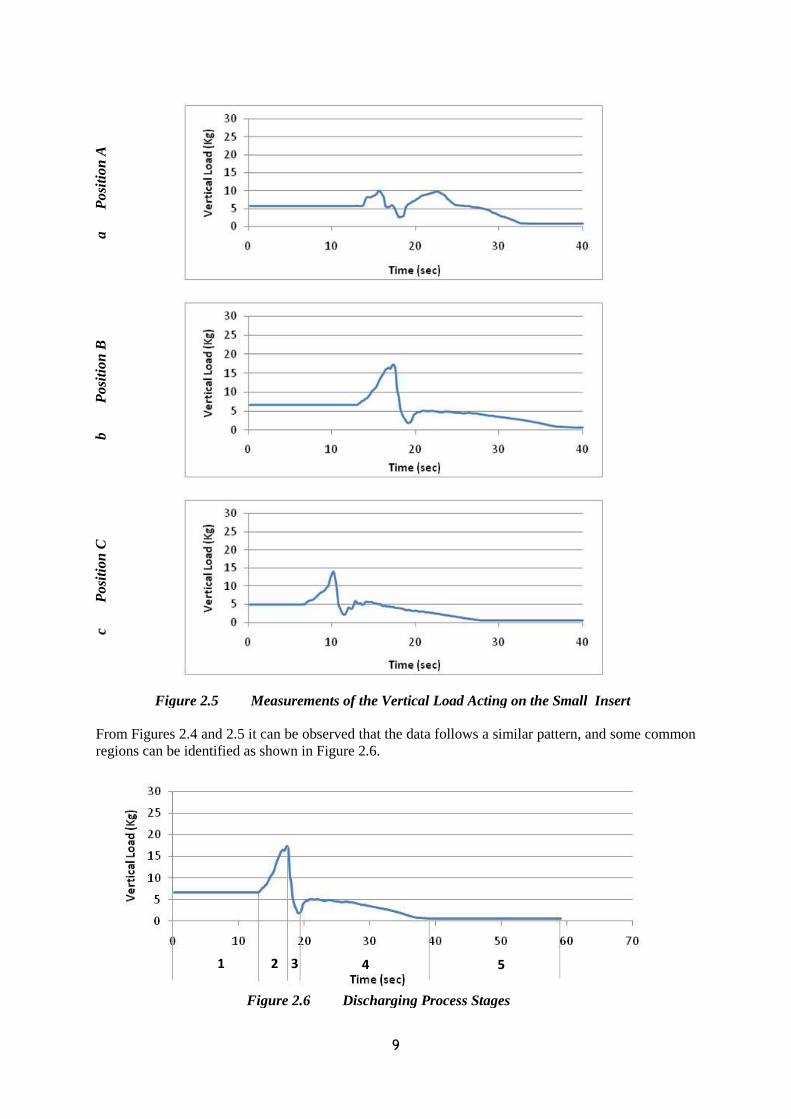
Figure 2.5 Measurements of the Vertical Load Acting on the Small Insert
From Figures 2.4 and 2.5 it can be observed that the data follows a similar pattern, and some common
regions can be identified as shown in Figure 2.6.
Figure 2.6 Discharging Process Stages
1 2 3 4 5

10
Region 1 in Figure 2.6 represents the end of the filling process. The value of the vertical load is the
maximum that can be reached during that process. This value is affected by the filling method as
variables, like the mass flow rate and relative position of the filling stream, produce changes in the
bulk density of the material and in the distribution of stresses.
Region 2 is the time period from the initiation of flow to the peak vertical load. It was this region that
was the most important for the objectives of this project, as it represents the highest load the insert
will support during operation of the silo, and it is the parameter that should be taken into account
when carrying out a structural design. When the outlet of the bin opens the discharge starts, the
material forms an arch which collapses to produce flow. This effect propagates upwards as the
material starts moving. Just before expanding and failing, the coefficient of friction between the
granular material and the wall of the insert reaches its peak value and the material around the insert
forms an arch. This arch is supported on the edge of the insert increasing the load applied.
The effect continues propagating upwards and the material around the insert dilates, the movement
causes a reduction in the coefficient of friction and therefore a reduction in the applied force. The
magnitude of the force continues reducing until the coefficient of friction is fully mobilized and a
minimum is reached, as it can be seen in region 3.
After the initial effect of dilation is finished, the material fails at the annulus around the insert. The
vertical load increases as the material reaches the flow-equilibrium state, and then a constant value of
the vertical load is maintained if the head of material in the silo is not allowed to drop to a certain
level or there will be a smooth reduction if the silo is allowed to empty, as shown in region 4.
Region 5 indicates the end of the discharge. However, as can be seen in Figure 2.6, in this case the
vertical load does not drop down to zero. This is because the insert was a flat plate and there was
remnant material above it at the end of the process.
It is noticeable that the instrumentation affected the readings considerably in some cases. The load
cell used for the measurements had a range up to 30 Kg. However, it can be seen in Figures 2.4a,
2.4b and 2.4c that the measurements stop at 25 Kg, while the trend of the graph would suggest a
higher peak value.
Initially, a load cell with a capacity up to 30 Kg was considered adequate and even 25 Kg seemed
enough, as the calculated loads were far below these values. Comparing the results for the large insert
Figure 2.4 and for the small one Figure 2.5, the resolution of the data was increased, giving smoother
measurements. This was achieved through development of the acquisition software. It is worth
noting that although the resolution of the data for the first tests was lower, the trend and key values of
the results were not significantly affected by it.
An aspect that did affect the results was the way the inserts where attached to the load cell. These
types of load cells generally have a thread for a 6 mm rod, so the inserts were suspended using a long
rod of this diameter. The problem was that any side force applied on the insert would flex the rod,
causing the insert to move away from the centre of the bin. This was noticed both during the filling
and discharging stages. Movement of the insert away from the centre line would cause preferential
draw from one side of the bin, redistributing the stresses on the powder unevenly and asymmetrically.
From the results of the large insert, it can be seen that the peak value is similar for the positions A and
B in Figures 2.4a and 2.4b respectively. However for position C, Figure 2.4c, the vertical load is
lower. This is not unexpected because the lower the head of powder, the stronger the effect it exerts
on the load.
It is interesting what happens with the small insert. In the lowest position, the value of the peak is
quite small in Figure 2.5a. Then there is a considerable increment on this value when the insert is

11
placed in the middle position in Figure 2.5b, and when the insert is raised further up, the peak value
decreases, Figure 2.5c.
The head of material would explain the difference between the peak values for the highest and middle
position, as stated above. However, contrary to what happens with the large insert, the value of the
peak for the small insert at the lowest position decreases with respect to the other two positions,
although supporting a taller head of material. This is explained by the fact that when the small insert
is placed low down, there will be higher interaction with the wall, which will support part of the
vertical load exerted.
In general the test results agree with the results presented by Johanson in Appendix B, Figure B.2.
The trend of the data and the reduction of the peak for small inserts are similar, but Johanson‟s results
showed no peak at all. However, they did not show agreement with predictions made by Johanson‟s
model. Table 2.3 shows a comparison between the vertical loads measured and those calculated using
the method developed by Johanson.
Table 2.3 Vertical Loads on Inserts: Calculated vs Measured
Insert 220 mm 138 mm
Position A B C A B C
Calculated
Load (Kg) 11.8 11.3 10.2 5.6 5.3 4.5
Measured
Load (Kg) 25+ 25+ 25+ 10.2 17.3 14.1
As can be seen in Table 2.3, the theoretical method did not produce accurate predictions of the loads
acting on the inserts. However, the method was developed for inverted cones and not for flat plates.
Even if the latter behaves as a rough inverted cone, the method was not necessarily expected to
predict values for these devices.
2.2 Evolution of the Test Rig
2.2.1 Test Rig Design and Construction
2.2.1.1 Main Structure
Although the work explained in Section 2.1 produced encouraging results, it also unveiled some
operational problems that need to be overcome before taking the next step in the experimental
programme. For this reason, the test rig had to be modified before continuing with any test work.
The modification of the rig gave the opportunity to include the measurement of variables that had not
been taken into account previously. Figure 2.7 illustrates some of the differences between the original
and the modified rig, and these differences will be explained while describing the new rig.
12
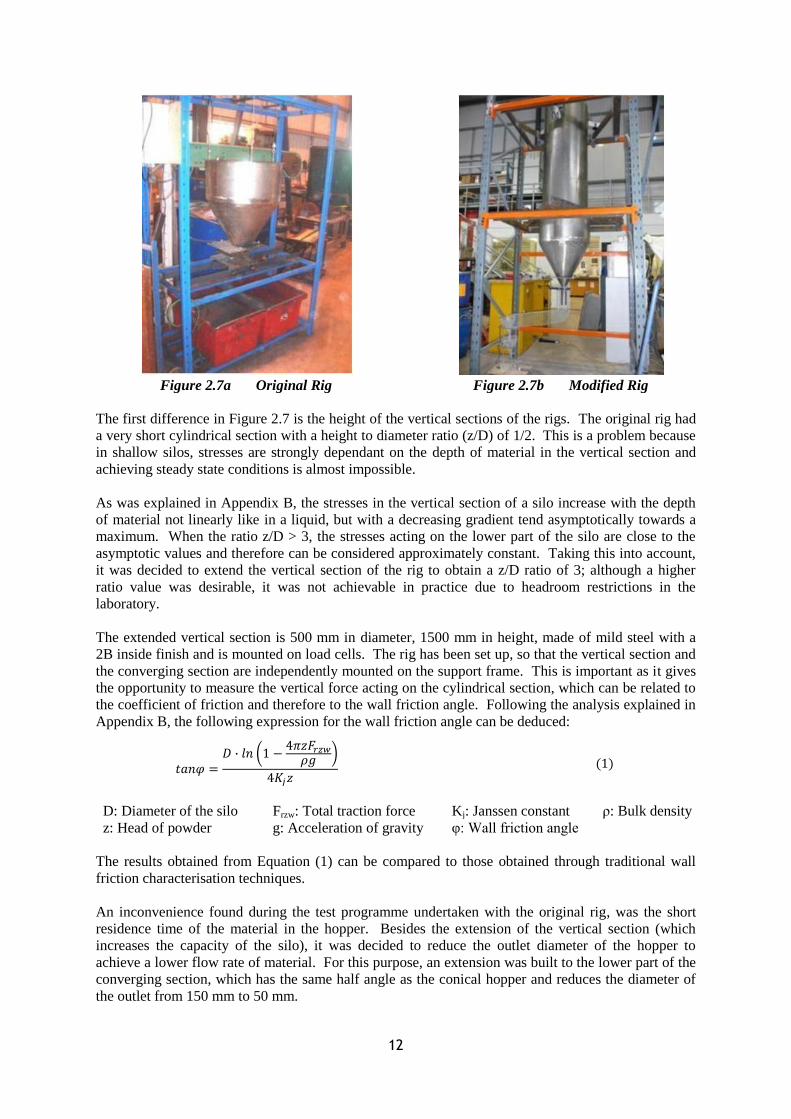
Figure 2.7a Original Rig Figure 2.7b Modified Rig
The first difference in Figure 2.7 is the height of the vertical sections of the rigs. The original rig had
a very short cylindrical section with a height to diameter ratio (z/D) of 1/2. This is a problem because
in shallow silos, stresses are strongly dependant on the depth of material in the vertical section and
achieving steady state conditions is almost impossible.
As was explained in Appendix B, the stresses in the vertical section of a silo increase with the depth
of material not linearly like in a liquid, but with a decreasing gradient tend asymptotically towards a
maximum. When the ratio z/D > 3, the stresses acting on the lower part of the silo are close to the
asymptotic values and therefore can be considered approximately constant. Taking this into account,
it was decided to extend the vertical section of the rig to obtain a z/D ratio of 3; although a higher
ratio value was desirable, it was not achievable in practice due to headroom restrictions in the
laboratory.
The extended vertical section is 500 mm in diameter, 1500 mm in height, made of mild steel with a
2B inside finish and is mounted on load cells. The rig has been set up, so that the vertical section and
the converging section are independently mounted on the support frame. This is important as it gives
the opportunity to measure the vertical force acting on the cylindrical section, which can be related to
the coefficient of friction and therefore to the wall friction angle. Following the analysis explained in
Appendix B, the following expression for the wall friction angle can be deduced:
(1)
D: Diameter of the silo Frzw: Total traction force Kj: Janssen constant ρ: Bulk density
z: Head of powder g: Acceleration of gravity υ: Wall friction angle
The results obtained from Equation (1) can be compared to those obtained through traditional wall
friction characterisation techniques.
An inconvenience found during the test programme undertaken with the original rig, was the short
residence time of the material in the hopper. Besides the extension of the vertical section (which
increases the capacity of the silo), it was decided to reduce the outlet diameter of the hopper to
achieve a lower flow rate of material. For this purpose, an extension was built to the lower part of the
converging section, which has the same half angle as the conical hopper and reduces the diameter of
the outlet from 150 mm to 50 mm.
13
2.2.1.2 Inserts
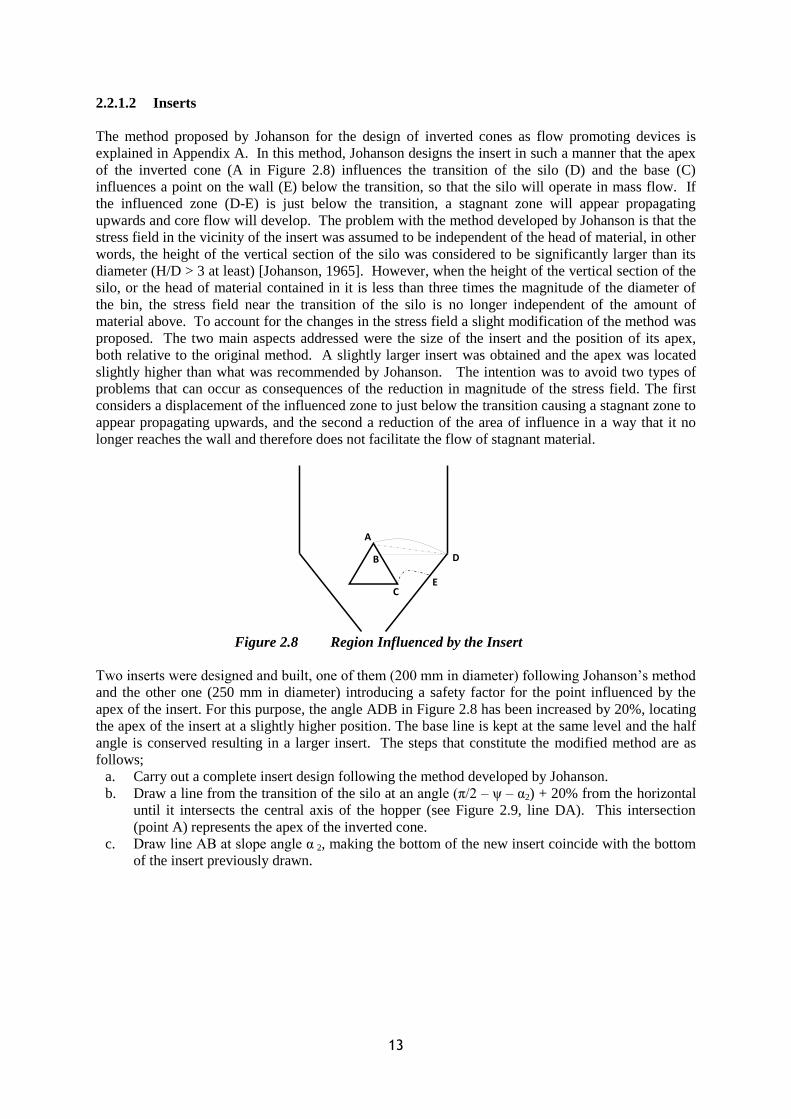
The method proposed by Johanson for the design of inverted cones as flow promoting devices is
explained in Appendix A. In this method, Johanson designs the insert in such a manner that the apex
of the inverted cone (A in Figure 2.8) influences the transition of the silo (D) and the base (C)
influences a point on the wall (E) below the transition, so that the silo will operate in mass flow. If
the influenced zone (D-E) is just below the transition, a stagnant zone will appear propagating
upwards and core flow will develop. The problem with the method developed by Johanson is that the
stress field in the vicinity of the insert was assumed to be independent of the head of material, in other
words, the height of the vertical section of the silo was considered to be significantly larger than its
diameter (H/D > 3 at least) [Johanson, 1965]. However, when the height of the vertical section of the
silo, or the head of material contained in it is less than three times the magnitude of the diameter of
the bin, the stress field near the transition of the silo is no longer independent of the amount of
material above. To account for the changes in the stress field a slight modification of the method was
proposed. The two main aspects addressed were the size of the insert and the position of its apex,
both relative to the original method. A slightly larger insert was obtained and the apex was located
slightly higher than what was recommended by Johanson. The intention was to avoid two types of
problems that can occur as consequences of the reduction in magnitude of the stress field. The first
considers a displacement of the influenced zone to just below the transition causing a stagnant zone to
appear propagating upwards, and the second a reduction of the area of influence in a way that it no
longer reaches the wall and therefore does not facilitate the flow of stagnant material.
Figure 2.8 Region Influenced by the Insert
Two inserts were designed and built, one of them (200 mm in diameter) following Johanson‟s method
and the other one (250 mm in diameter) introducing a safety factor for the point influenced by the
apex of the insert. For this purpose, the angle ADB in Figure 2.8 has been increased by 20%, locating
the apex of the insert at a slightly higher position. The base line is kept at the same level and the half
angle is conserved resulting in a larger insert. The steps that constitute the modified method are as
follows;
a. Carry out a complete insert design following the method developed by Johanson.
b. Draw a line from the transition of the silo at an angle (π/2 – ψ – α2) + 20% from the horizontal
until it intersects the central axis of the hopper (see Figure 2.9, line DA). This intersection
(point A) represents the apex of the inverted cone.
c. Draw line AB at slope angle α 2, making the bottom of the new insert coincide with the bottom
of the insert previously drawn.
A
B D
EC

14
Figure 2.9 Modified Method
One of the features of the original rig that caused significant problems was the way the inserts were
located inside the silo. The insert was held in position by a long rod connected to a load cell at the top
of the rig, this made its position very sensitive to side loads, so it was common to see it moving
sideways during the filling and discharge processes. The lateral movement of the insert was the main
cause for the offset discharge obtained. An additional problem caused by this mechanism was that
mounting and bracket obstructed the inlet of the silo complicating the loading of material. Taking
these factors into account, a support device was designed attempting to simulate the manner in which
the insert would be supported in an industrial installation.
The support device had to be easy to install and remove, but stable and strong enough to support the
forces acting on the insert with minimum interference to the flow of material. The device built (see
Figure 2.10) comprised a central mild steel disc with three horizontal arms that sat on the walls of the
converging section of the bin, the load cell was attached to the disc with a 12 mm studding and
another 12 mm studding coupled the load cell and the insert. The cable of the load cell was passed
through a stainless steel tube welded underneath one of the arms of the device, and then through a
small orifice on the wall of the hopper.
Figure 2.10 Insert Support Device
2.2.1.3 Discharge Pattern Tracer System
The ideal performance of a silo is achieved when its contents discharge in a mass flow pattern.
Therefore, determining the discharge behaviour of a silo has played an important role in bulk solids
research. Through the years, different methods have been used to identify the type of pattern
developed inside a silo during discharge, from these methods the most widely employed is the use of
tracers [Karlsen, 1998; Schuricht, 2001; Ding, 20042; Enstad, 2007; Ding, 2008; Hartl, 2008].
α2
B’
F
E
γ
D
π/2 – ψ - α2
A
+ 20%
A’
B
15
A tracer system basically consists of measuring the residence time of markers placed at known points
inside a silo, which are allowed to discharge with the stored material. With the residence time and the
position of each tracer, a flow pattern can be deduced. Thus in a silo with central discharge, if mass
flow is developed, tracers placed at the same depth should have similar residence times, and the lower
the position, the lower the residence time. In contrast, if core flow is developed, markers placed at the
same depth will have different residence times, increasing with the horizontal distance from the centre
and the lower the position, the higher the residence time, except for the tracers placed in the channel
above the outlet, which will have the shortest residence times of all.
For this purpose, a tracer system was designed comprising two main parts, the tracer positioning tool
and the tracer detection device. The positioning tool consisted of a guide made with nine 24 mm ID
mild-steel tubes of 600 mm in length. The tubes determined the horizontal positions of the markers,
so they were evenly distributed in the pattern of a cross. Through each guide tube, a placement tube
20 mm OD mild-steel could slide independently, allowing the tracers to be dropped at different depths
inside the bin (see Figure 2.11). Note that the length of the placement tubes varied depending on their
position relative to the centre of the bin and the insert used. An additional marker was positioned just
above the outlet to be used as a reference.
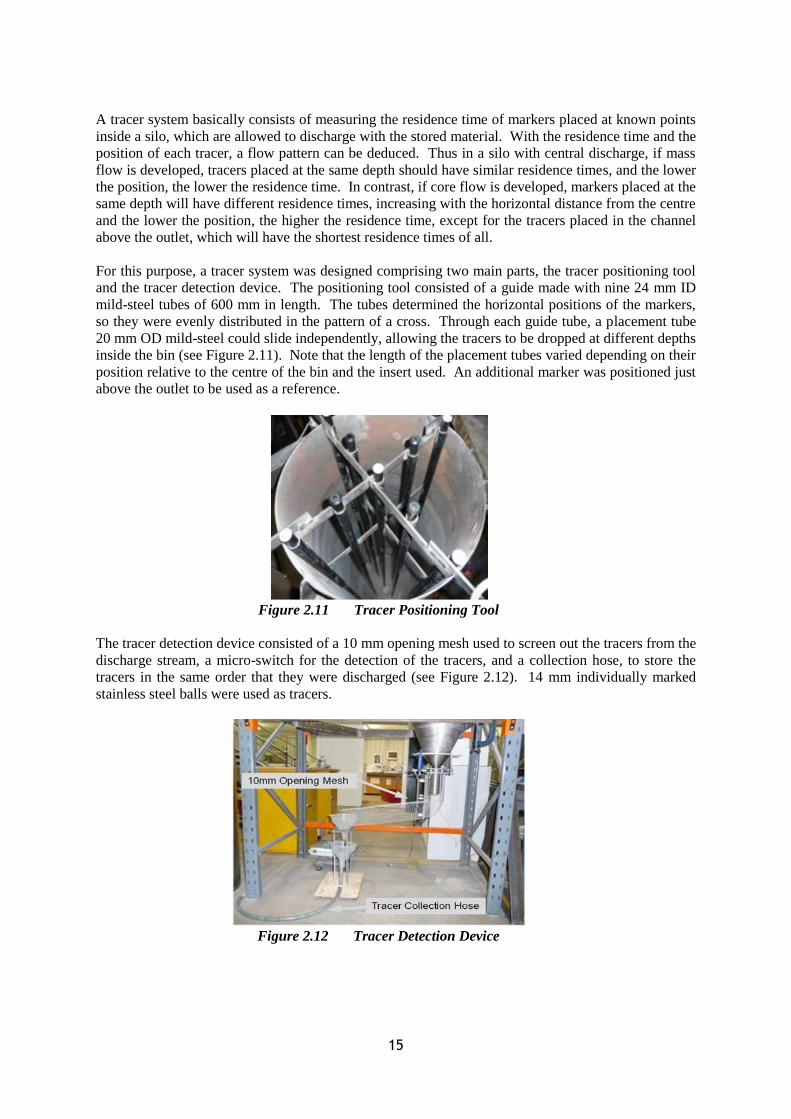
Figure 2.11 Tracer Positioning Tool
The tracer detection device consisted of a 10 mm opening mesh used to screen out the tracers from the
discharge stream, a micro-switch for the detection of the tracers, and a collection hose, to store the
tracers in the same order that they were discharged (see Figure 2.12). 14 mm individually marked
stainless steel balls were used as tracers.
Figure 2.12 Tracer Detection Device
16
2.2.2 Commissioning of the Test Rig
The experiments were carried out using sub-400 micron olivine sand as a test material. The flow
properties of the sand were measured using a Brookfield Powder Flow Tester and the results can be
found in Table 2.4.
Table 2.4 Flow Properties of the Sand Used as Test Material
Wall Friction Angle
for Stainless Steel
(Deg)
Wall Friction Angle
for Mild Steel
(Deg)
Internal Friction
Angle
(Deg)
Bulk Density
(Kg/m3)
25 29 39 1950
Two polished mild steel inserts with a 30° half angle to the vertical were evaluated, one designed with
the method developed by Johanson and the other with the modified method proposed. Johanson‟s
insert was 0.2 m in diameter, 40% of the diameter of the bin and its apex was positioned at 0.12 m
upwards from the transition of the bin, the modified insert was 0.25 m in diameter, 50% of the
diameter of the bin and its apex was positioned at 0.16 m upwards from the transition of the bin. To
facilitate silo filling and the collection of discharged material, 0.5 m3 polypropylene bulk bags were
used and manipulated with an overhead crane. Two types of test were undertaken, in the first type the
silo was filled with sand and then left to drain completely. In the second type of test, the silo was
filled and then additional material was fed while discharging, to maintain a constant head of material
in the silo.
2.2.2.1 Silo Allowed to Drain After Filling
Three sets of tests were carried out; without the insert, with the small insert and with the large insert,
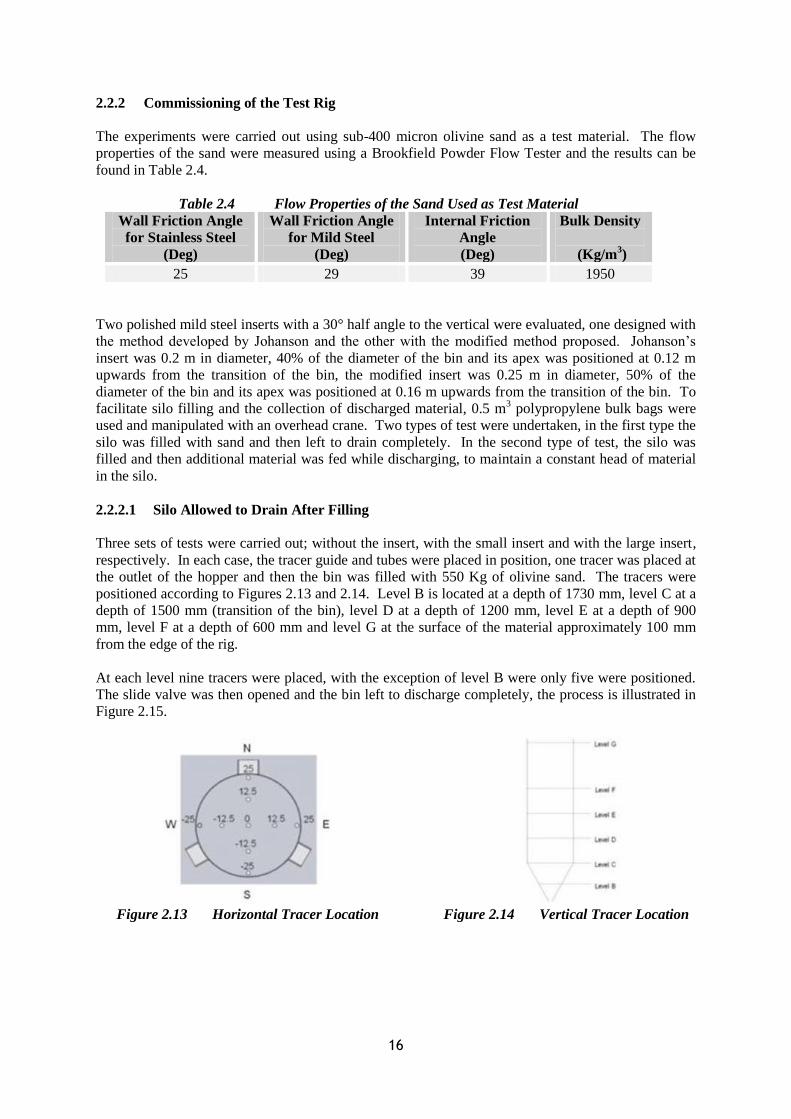
respectively. In each case, the tracer guide and tubes were placed in position, one tracer was placed at
the outlet of the hopper and then the bin was filled with 550 Kg of olivine sand. The tracers were
positioned according to Figures 2.13 and 2.14. Level B is located at a depth of 1730 mm, level C at a
depth of 1500 mm (transition of the bin), level D at a depth of 1200 mm, level E at a depth of 900
mm, level F at a depth of 600 mm and level G at the surface of the material approximately 100 mm
from the edge of the rig.
At each level nine tracers were placed, with the exception of level B were only five were positioned.
The slide valve was then opened and the bin left to discharge completely, the process is illustrated in
Figure 2.15.
Figure 2.13 Horizontal Tracer Location Figure 2.14 Vertical Tracer Location
17
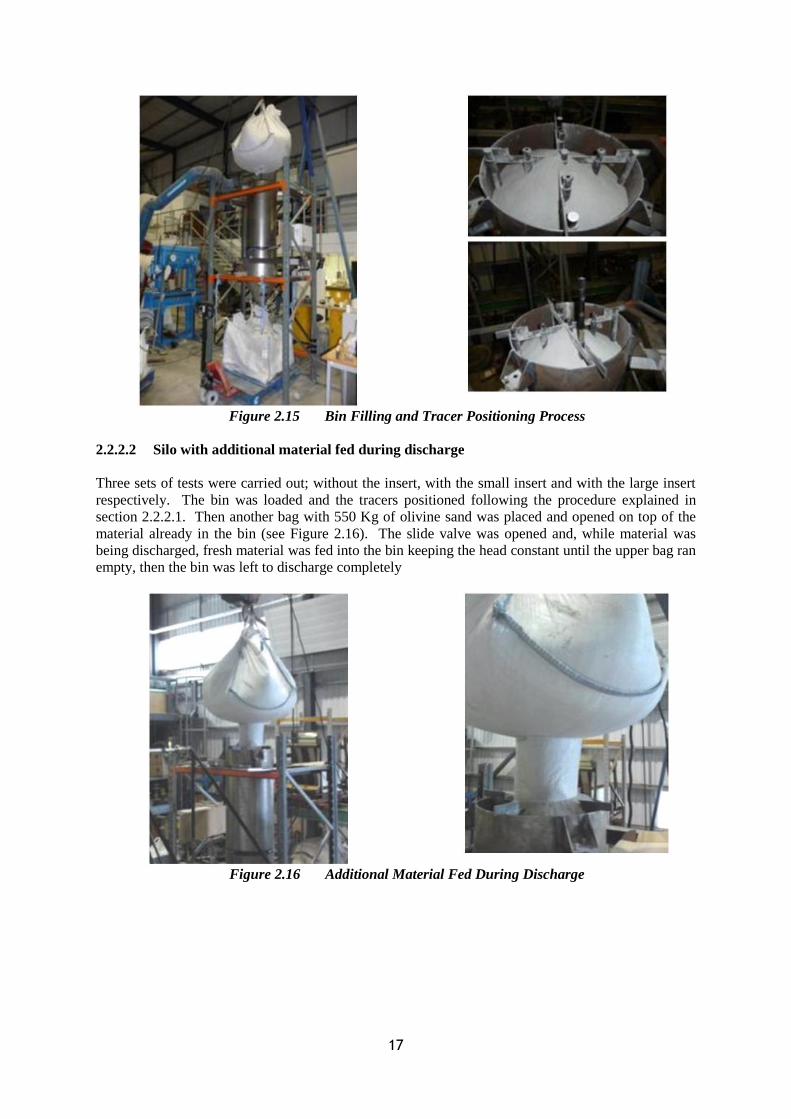
Figure 2.15 Bin Filling and Tracer Positioning Process
2.2.2.2 Silo with additional material fed during discharge
Three sets of tests were carried out; without the insert, with the small insert and with the large insert
respectively. The bin was loaded and the tracers positioned following the procedure explained in
section 2.2.2.1. Then another bag with 550 Kg of olivine sand was placed and opened on top of the
material already in the bin (see Figure 2.16). The slide valve was opened and, while material was
being discharged, fresh material was fed into the bin keeping the head constant until the upper bag ran
empty, then the bin was left to discharge completely
Figure 2.16 Additional Material Fed During Discharge
18
2.2.3 Results and Discussion
2.2.3.1 Silo Allowed to Drain After Filling
West - East
North - South
b.
Surface
Profile
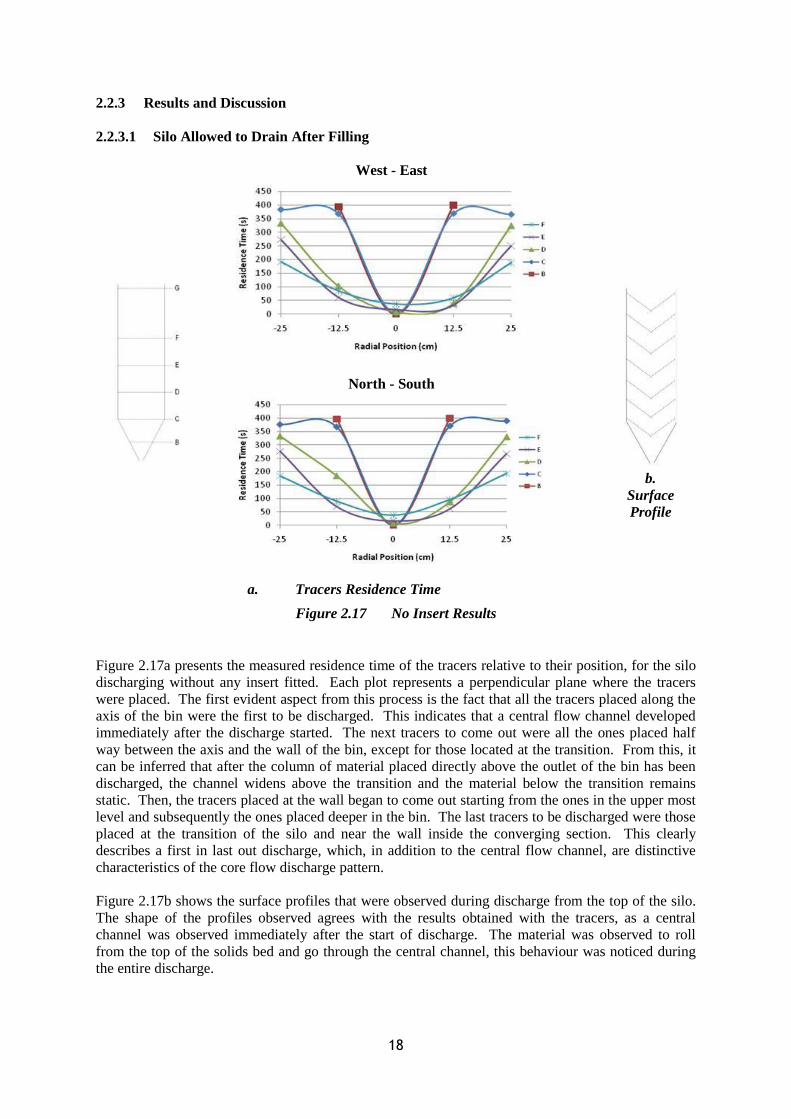
a. Tracers Residence Time
Figure 2.17 No Insert Results
Figure 2.17a presents the measured residence time of the tracers relative to their position, for the silo
discharging without any insert fitted. Each plot represents a perpendicular plane where the tracers
were placed. The first evident aspect from this process is the fact that all the tracers placed along the
axis of the bin were the first to be discharged. This indicates that a central flow channel developed
immediately after the discharge started. The next tracers to come out were all the ones placed half
way between the axis and the wall of the bin, except for those located at the transition. From this, it
can be inferred that after the column of material placed directly above the outlet of the bin has been
discharged, the channel widens above the transition and the material below the transition remains
static. Then, the tracers placed at the wall began to come out starting from the ones in the upper most
level and subsequently the ones placed deeper in the bin. The last tracers to be discharged were those
placed at the transition of the silo and near the wall inside the converging section. This clearly
describes a first in last out discharge, which, in addition to the central flow channel, are distinctive
characteristics of the core flow discharge pattern.
Figure 2.17b shows the surface profiles that were observed during discharge from the top of the silo.
The shape of the profiles observed agrees with the results obtained with the tracers, as a central
channel was observed immediately after the start of discharge. The material was observed to roll
from the top of the solids bed and go through the central channel, this behaviour was noticed during
the entire discharge.
19
West - East
North - South
b.
Surface
Profile
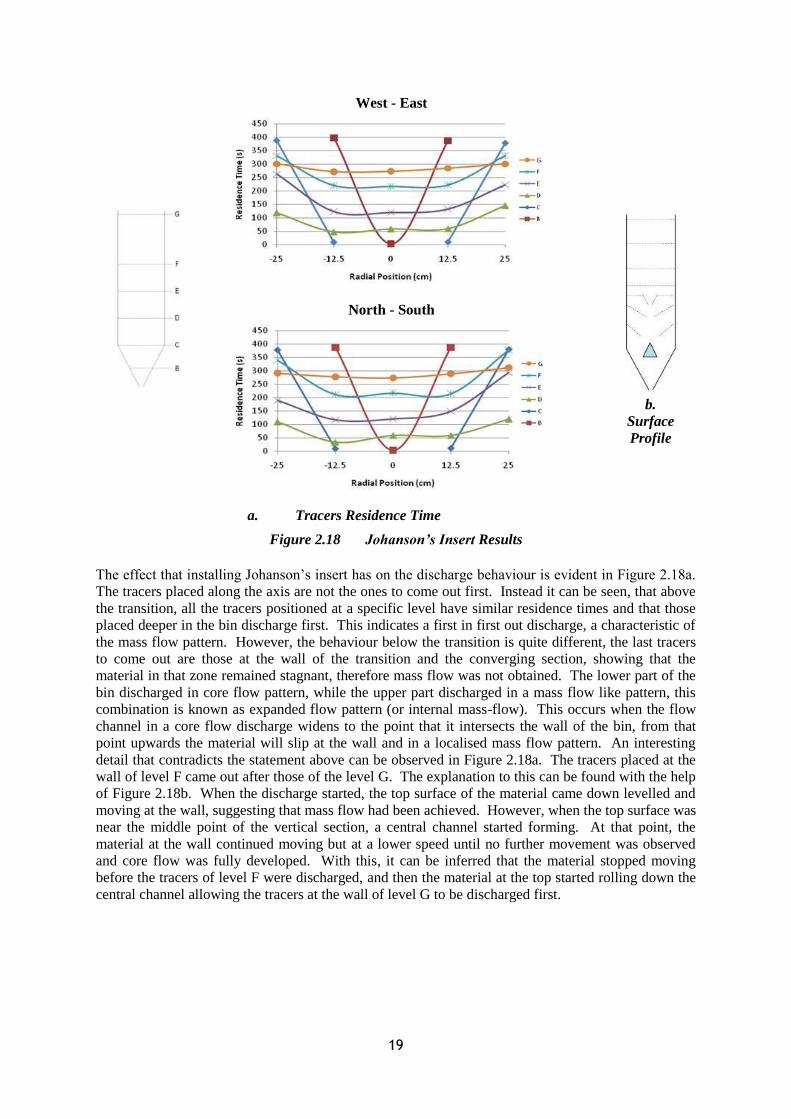
a. Tracers Residence Time
Figure 2.18 Johanson’s Insert Results
The effect that installing Johanson‟s insert has on the discharge behaviour is evident in Figure 2.18a.
The tracers placed along the axis are not the ones to come out first. Instead it can be seen, that above
the transition, all the tracers positioned at a specific level have similar residence times and that those
placed deeper in the bin discharge first. This indicates a first in first out discharge, a characteristic of
the mass flow pattern. However, the behaviour below the transition is quite different, the last tracers
to come out are those at the wall of the transition and the converging section, showing that the
material in that zone remained stagnant, therefore mass flow was not obtained. The lower part of the
bin discharged in core flow pattern, while the upper part discharged in a mass flow like pattern, this
combination is known as expanded flow pattern (or internal mass-flow). This occurs when the flow
channel in a core flow discharge widens to the point that it intersects the wall of the bin, from that
point upwards the material will slip at the wall and in a localised mass flow pattern. An interesting
detail that contradicts the statement above can be observed in Figure 2.18a. The tracers placed at the
wall of level F came out after those of the level G. The explanation to this can be found with the help
of Figure 2.18b. When the discharge started, the top surface of the material came down levelled and
moving at the wall, suggesting that mass flow had been achieved. However, when the top surface was
near the middle point of the vertical section, a central channel started forming. At that point, the
material at the wall continued moving but at a lower speed until no further movement was observed
and core flow was fully developed. With this, it can be inferred that the material stopped moving
before the tracers of level F were discharged, and then the material at the top started rolling down the
central channel allowing the tracers at the wall of level G to be discharged first.
20
West - East
North - South
b.
Surface
Profile
a. Tracers Residence Time
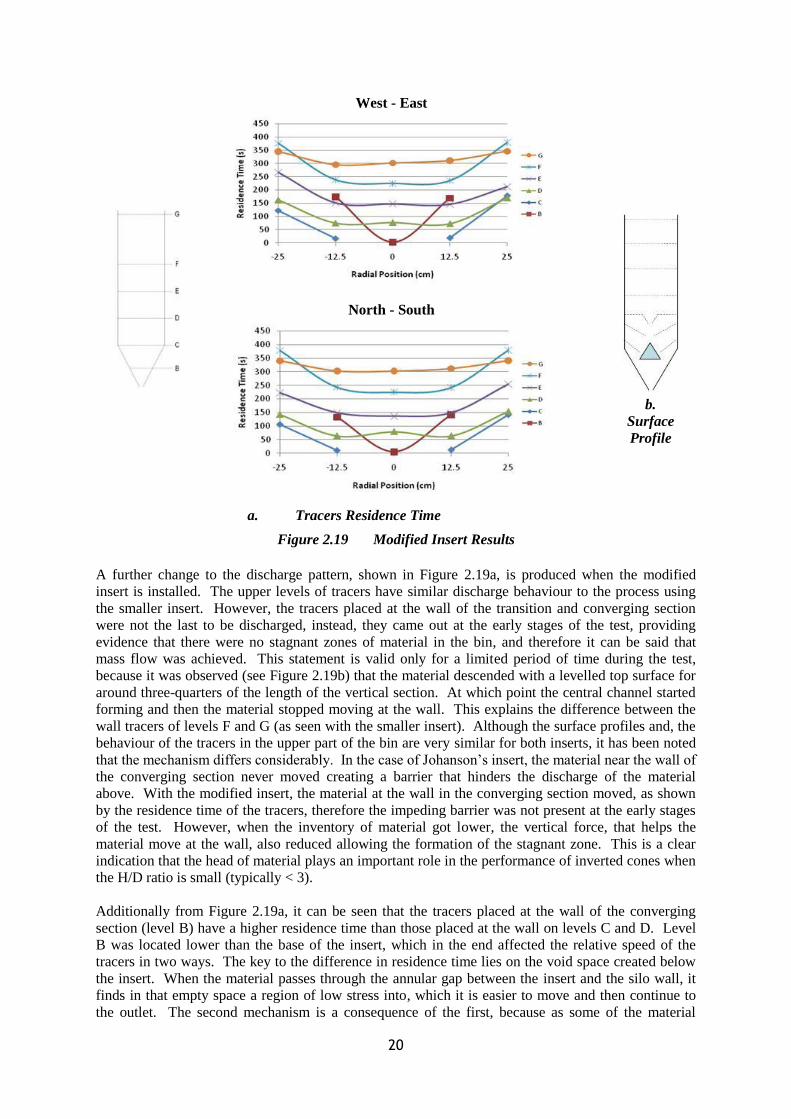
Figure 2.19 Modified Insert Results
A further change to the discharge pattern, shown in Figure 2.19a, is produced when the modified
insert is installed. The upper levels of tracers have similar discharge behaviour to the process using
the smaller insert. However, the tracers placed at the wall of the transition and converging section
were not the last to be discharged, instead, they came out at the early stages of the test, providing
evidence that there were no stagnant zones of material in the bin, and therefore it can be said that
mass flow was achieved. This statement is valid only for a limited period of time during the test,
because it was observed (see Figure 2.19b) that the material descended with a levelled top surface for
around three-quarters of the length of the vertical section. At which point the central channel started
forming and then the material stopped moving at the wall. This explains the difference between the
wall tracers of levels F and G (as seen with the smaller insert). Although the surface profiles and, the
behaviour of the tracers in the upper part of the bin are very similar for both inserts, it has been noted
that the mechanism differs considerably. In the case of Johanson‟s insert, the material near the wall of
the converging section never moved creating a barrier that hinders the discharge of the material
above. With the modified insert, the material at the wall in the converging section moved, as shown
by the residence time of the tracers, therefore the impeding barrier was not present at the early stages
of the test. However, when the inventory of material got lower, the vertical force, that helps the
material move at the wall, also reduced allowing the formation of the stagnant zone. This is a clear
indication that the head of material plays an important role in the performance of inverted cones when
the H/D ratio is small (typically < 3).
Additionally from Figure 2.19a, it can be seen that the tracers placed at the wall of the converging
section (level B) have a higher residence time than those placed at the wall on levels C and D. Level
B was located lower than the base of the insert, which in the end affected the relative speed of the
tracers in two ways. The key to the difference in residence time lies on the void space created below
the insert. When the material passes through the annular gap between the insert and the silo wall, it
finds in that empty space a region of low stress into, which it is easier to move and then continue to
the outlet. The second mechanism is a consequence of the first, because as some of the material
21
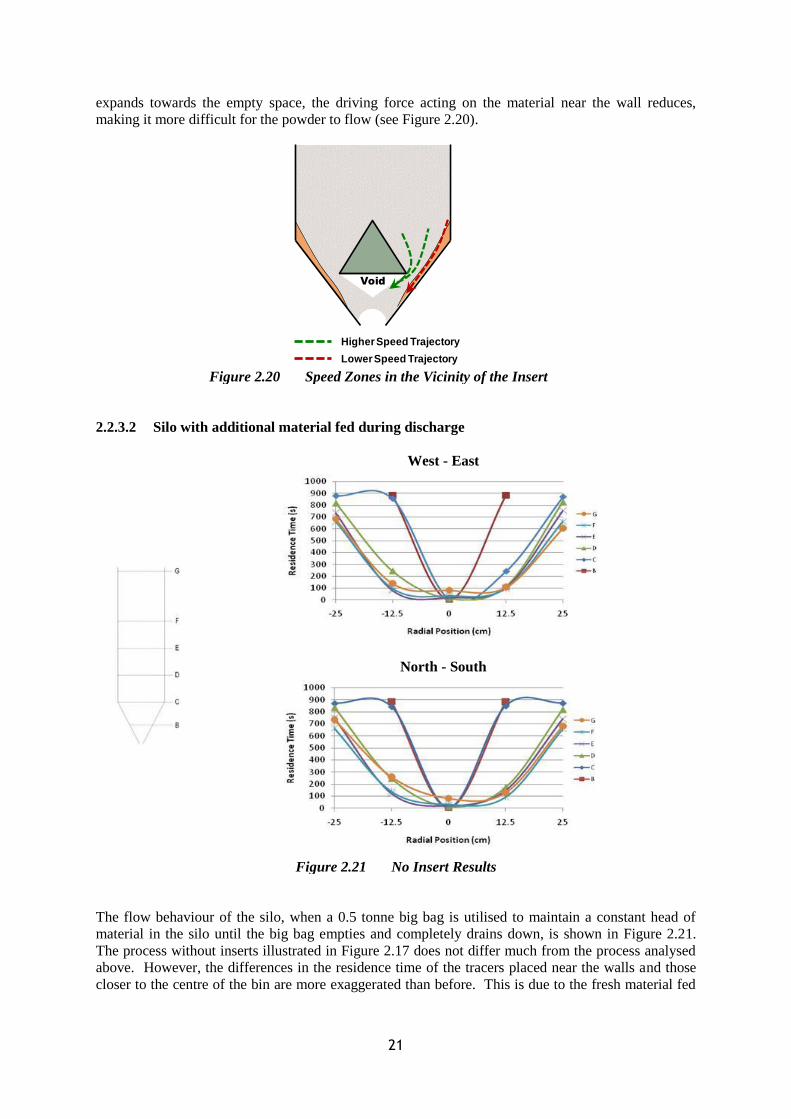
expands towards the empty space, the driving force acting on the material near the wall reduces,
making it more difficult for the powder to flow (see Figure 2.20).
Figure 2.20 Speed Zones in the Vicinity of the Insert
2.2.3.2 Silo with additional material fed during discharge
West - East
North - South
Figure 2.21 No Insert Results
The flow behaviour of the silo, when a 0.5 tonne big bag is utilised to maintain a constant head of
material in the silo until the big bag empties and completely drains down, is shown in Figure 2.21.
The process without inserts illustrated in Figure 2.17 does not differ much from the process analysed
above. However, the differences in the residence time of the tracers placed near the walls and those
closer to the centre of the bin are more exaggerated than before. This is due to the fresh material fed
Higher Speed Trajectory
Lower Speed Trajectory
Void

22
into the bin from the big bag flowing straight down the central flow channel and therefore being
discharged before the material near the wall, confirming the first in last out discharge.
West - East
North - South
Figure 2.22 Johanson’s Insert Results
Unlike the process without the insert, when Johanson‟s insert is fitted there is a substantial change in
the discharge behaviour with respect to the same process previously analysed. As seen in Figure 2.22,
the markers placed at the wall of the converging section are not the last ones to come out, and there
are small differences in the residence times of tracers placed at a common level in the silo. This
affirmed that mass flow was achieved in the discharge. The fact that mass flow was not achieved in
the process without additional material fed, but it was achieved when the head of powder was kept
constant, suggests that the former process had insufficient driving force (weight of powder acting over
a horizontal plane at the height of the insert apex) to shear the powder at the walls, especially as that
force was being reduced with the discharge of material.

23
West - East
North - South
Figure 2.23 Modified Insert Results
In general, it can be deduced that further improvement was achieved when fitting the modified insert.
Although mass flow had already been obtained for the process with a variable head of powder, here
the difference between the residence times of tracers at a specific level was reduced further, getting
closer to the concept of ideal mass flow, where that difference is nonexistent. In general terms, the
performance of the bin is more consistent and homogeneous when the large insert is fitted. It can be
observed in Figures 2.22 and 2.23 that the behaviour of the tracers located at level B is similar to the
process without additional material, this was expected as most of the magnitude of the stress in the
lower part of the silo is taken by the insert and the wall round it, somehow isolating the lower region
from the stress conditions in the upper part.
2.2.3.3 Vertical Load Acting on the Cylindrical Section of the Bin
Figure 2.24 Comparison of Vertical Loads on the Cylindrical Section of the Rig
24
The magnitudes of the loads measured on the cylindrical section of the bin, both with and without
inserts, as a function of the head of material are presented in Figure 2.24. The value before time zero
represents the vertical load acting on the walls at the end of the filling process. It is noticeable that an
incremental change in the load occurs at the start of the discharge process, and what happens after
depends on the head of material and flow pattern developed.
For the process where the silo was left to drain, the load decreases rapidly as the head of material
decreases, but, when additional material was fed, the load remains approximately constant at the
incremented value as long as the head of material does not decrease. In the data collected, a
decrement of the load is observed after some time even while material was still being fed. This was
due to a slight reduction in the height of the top free surface in the silo resulting from the big-bag feed
hopper elongating as it emptied.
The explanation for the incremental increase in the vertical load at the initiation of discharge is
provided by the change of direction of the principal stress field, when the material goes from the
filling state to the discharging state. During the filling state the direction of principal stress field is
mainly vertical, therefore the main load is applied on the cross sectional area of the bin. When the
discharge starts, the direction of the stress field changes, increasing its horizontal component and
decreasing its vertical component, thus the normal stress at the wall increases and therefore so does
the traction load.
With the measured load and Equation (1) from section 2.2.1.1, a value of 14.3° is calculated for the
wall friction angle. This value was significantly smaller (50%) than the one measured with a standard
shear test. It is the opinion of the author that this is a consequence of the use of the insert, because
even if mass flow was achieved, the insert was taking part of the load in the lower part of the
cylindrical section, therefore modifying the stress distribution in that area of the bin, which is a
critical part as it is where the highest stresses are exerted.
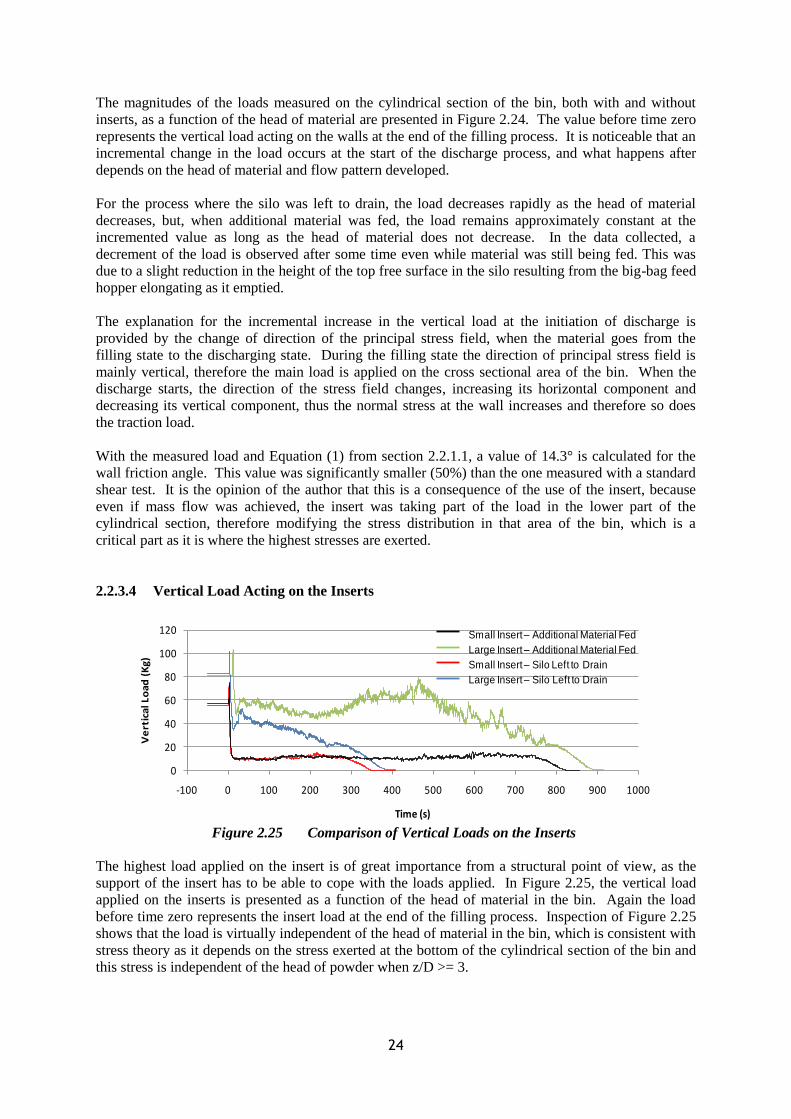
2.2.3.4 Vertical Load Acting on the Inserts
Figure 2.25 Comparison of Vertical Loads on the Inserts
The highest load applied on the insert is of great importance from a structural point of view, as the
support of the insert has to be able to cope with the loads applied. In Figure 2.25, the vertical load
applied on the inserts is presented as a function of the head of material in the bin. Again the load
before time zero represents the insert load at the end of the filling process. Inspection of Figure 2.25
shows that the load is virtually independent of the head of material in the bin, which is consistent with
stress theory as it depends on the stress exerted at the bottom of the cylindrical section of the bin and
this stress is independent of the head of powder when z/D >= 3.
0
20
40
60
80
100
120
-100 0 100 200 300 400 500 600 700 800 900 1000
Ve
rtic
al L
oa
d (
Kg
)
Time (s)
Large Insert – Additional Material Fed
Small Insert – Additional Material Fed
Small Insert – Silo Left to Drain
Large Insert – Silo Left to Drain
25
In section 2.1.3, each of the different stages of the measurement of the load acting on the insert was
analyzed and explained. The arguments provided in that section also apply to these results. What had
changed in this case was the magnitude of the loads exerted. The method, developed by Johanson for
the prediction of the loads acting on the inserts, is presented in Appendix B. This method was first
evaluated with the results obtained in section 2.1.3, where the experimental results did not compare
favourably with the predictions made by the method. The characteristics of the test presented in this
section offer a better platform to validate Johanson‟s method, and the predictions made are virtually
identical to the values measured during the tests, for both the large and the small insert as seen in
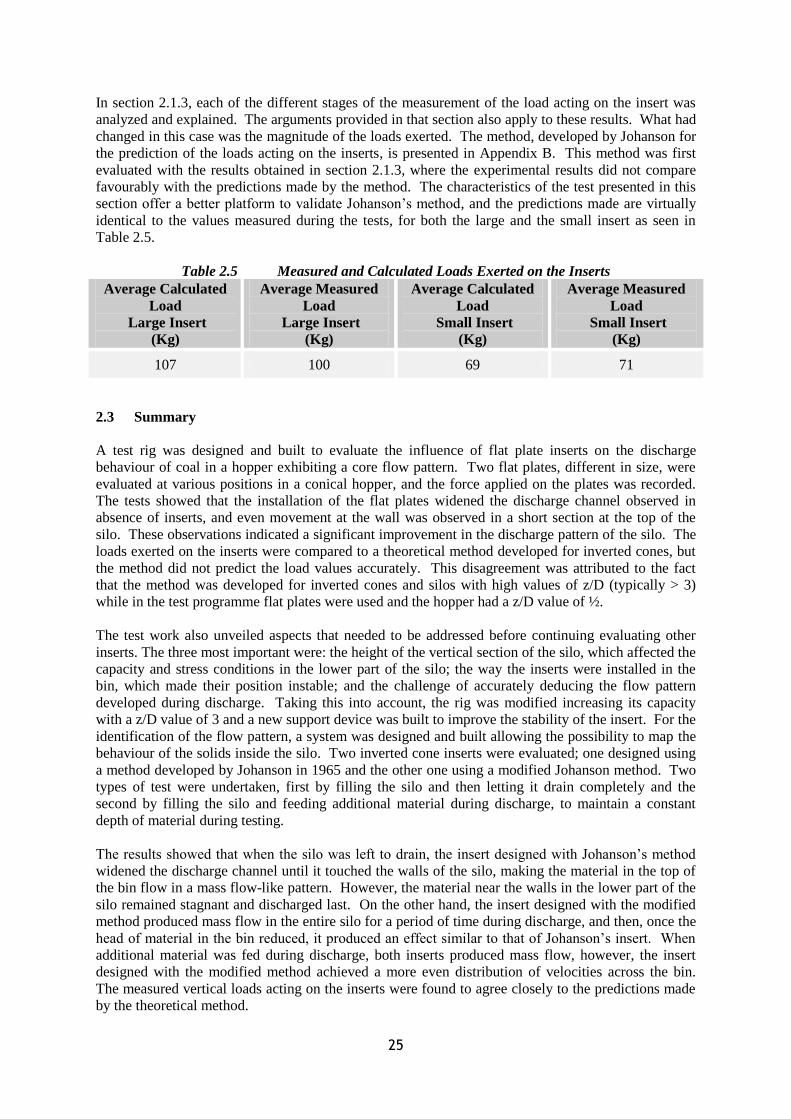
Table 2.5.
Table 2.5 Measured and Calculated Loads Exerted on the Inserts
Average Calculated
Load
Large Insert
(Kg)
Average Measured
Load
Large Insert
(Kg)
Average Calculated
Load
Small Insert
(Kg)
Average Measured
Load
Small Insert
(Kg)
107 100 69 71
2.3 Summary
A test rig was designed and built to evaluate the influence of flat plate inserts on the discharge
behaviour of coal in a hopper exhibiting a core flow pattern. Two flat plates, different in size, were
evaluated at various positions in a conical hopper, and the force applied on the plates was recorded.
The tests showed that the installation of the flat plates widened the discharge channel observed in
absence of inserts, and even movement at the wall was observed in a short section at the top of the
silo. These observations indicated a significant improvement in the discharge pattern of the silo. The
loads exerted on the inserts were compared to a theoretical method developed for inverted cones, but
the method did not predict the load values accurately. This disagreement was attributed to the fact
that the method was developed for inverted cones and silos with high values of z/D (typically > 3)
while in the test programme flat plates were used and the hopper had a z/D value of ½.
The test work also unveiled aspects that needed to be addressed before continuing evaluating other
inserts. The three most important were: the height of the vertical section of the silo, which affected the
capacity and stress conditions in the lower part of the silo; the way the inserts were installed in the
bin, which made their position instable; and the challenge of accurately deducing the flow pattern
developed during discharge. Taking this into account, the rig was modified increasing its capacity
with a z/D value of 3 and a new support device was built to improve the stability of the insert. For the
identification of the flow pattern, a system was designed and built allowing the possibility to map the
behaviour of the solids inside the silo. Two inverted cone inserts were evaluated; one designed using
a method developed by Johanson in 1965 and the other one using a modified Johanson method. Two
types of test were undertaken, first by filling the silo and then letting it drain completely and the
second by filling the silo and feeding additional material during discharge, to maintain a constant
depth of material during testing.
The results showed that when the silo was left to drain, the insert designed with Johanson‟s method
widened the discharge channel until it touched the walls of the silo, making the material in the top of
the bin flow in a mass flow-like pattern. However, the material near the walls in the lower part of the
silo remained stagnant and discharged last. On the other hand, the insert designed with the modified
method produced mass flow in the entire silo for a period of time during discharge, and then, once the
head of material in the bin reduced, it produced an effect similar to that of Johanson‟s insert. When
additional material was fed during discharge, both inserts produced mass flow, however, the insert
designed with the modified method achieved a more even distribution of velocities across the bin.
The measured vertical loads acting on the inserts were found to agree closely to the predictions made
by the theoretical method.
26
CHAPTER THREE: STUDY OF INSERT CONFIGURATION TO OPTIMIZE
DISCHARGE PERFORMANCE
To undertake a reasonable study of static inserts, different shapes and sizes should be evaluated.
However, the construction of numerous inserts at the scale presented in Chapter 2, would involve
costs beyond the budget of this project. For this reason, it was decided to work at a small scale (0.002
to 0.005 m3) which facilitated the construction and evaluation of the inserts, reducing the costs
involved. This chapter presents a description of the test rig employed, as well as the design and
evaluation of different types of inserts.
3.1 Test Rig Description
It has been shown that the best way to evaluate the performance of the inserts is to analyze the change
in flow pattern. In Chapter 2, a method of discharge pattern identification using tracers was
described. However, to employ the same type of technique at the scale proposed for the test rig would
be impractical. For that reason, it was decided to build the test rig using transparent material to
observe the behaviour of the granular material in the vicinity of the walls.
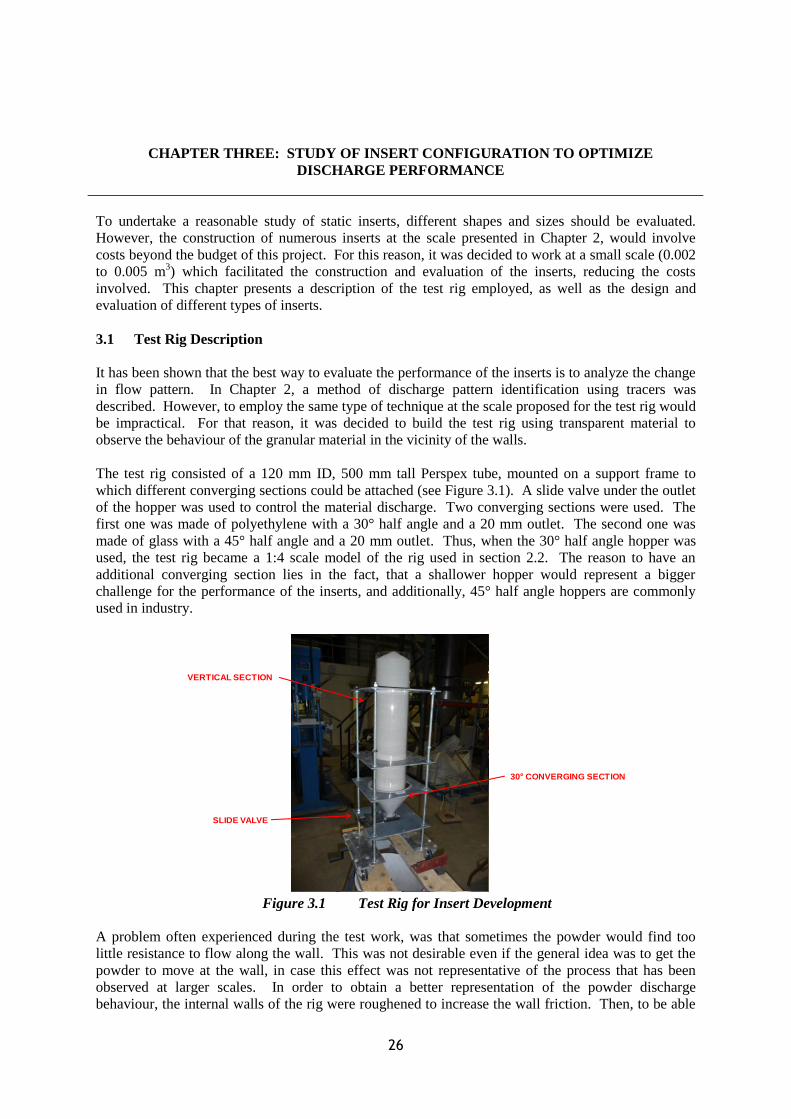
The test rig consisted of a 120 mm ID, 500 mm tall Perspex tube, mounted on a support frame to
which different converging sections could be attached (see Figure 3.1). A slide valve under the outlet
of the hopper was used to control the material discharge. Two converging sections were used. The
first one was made of polyethylene with a 30° half angle and a 20 mm outlet. The second one was
made of glass with a 45° half angle and a 20 mm outlet. Thus, when the 30° half angle hopper was
used, the test rig became a 1:4 scale model of the rig used in section 2.2. The reason to have an
additional converging section lies in the fact, that a shallower hopper would represent a bigger
challenge for the performance of the inserts, and additionally, 45° half angle hoppers are commonly
used in industry.
Figure 3.1 Test Rig for Insert Development
A problem often experienced during the test work, was that sometimes the powder would find too
little resistance to flow along the wall. This was not desirable even if the general idea was to get the
powder to move at the wall, in case this effect was not representative of the process that has been
observed at larger scales. In order to obtain a better representation of the powder discharge
behaviour, the internal walls of the rig were roughened to increase the wall friction. Then, to be able
VERTICAL SECTION
30 CONVERGING SECTION
SLIDE VALVE

27
to compare both types of surface, two vertical sections were used, one smooth and one rough (see
Figure 3.2). For the same reason, in some cases the converging section was lined using sheets of thin
clear plastic to provide a surface finish that was less smooth than the glass.
The test rig also included two additional features to help with the understanding of the discharge
behaviour of the model. The first consisted of an impact plate sensor located underneath the outlet of
the rig, which would detect any changes in the instantaneous discharge rate (see Figure 3.3). This
could act as an important accessory for the identification of the discharge pattern, as a bin discharging
in mass flow is expected to produce a more uniform discharge rate than one discharging in core flow.
The second feature was a receiving vessel mounted on load cells, where the weight of the material
discharged could be measured and then recorded. This would help to quantify the average discharge
rate of the rig.
3.2 Inserts
The inserts were designed using the CAD tool SolidWorks from Dassault Systèmes SolidWorks Corp.
They were created using a rapid prototype machine, which takes virtual designs from computer aided
design (CAD), transforms them into thin, virtual, horizontal cross-sections and then creates successive
layers until the model is complete. The machine reads the data from a CAD drawing and lays down
successive layers of plastic, building up the model from a series of cross sections. These layers,
which correspond to the virtual cross section from the CAD model, are joined together or fused
automatically to create the final shape. The primary advantage to additive fabrication is its ability to
create almost any shape or geometric feature [Wright, 2001].
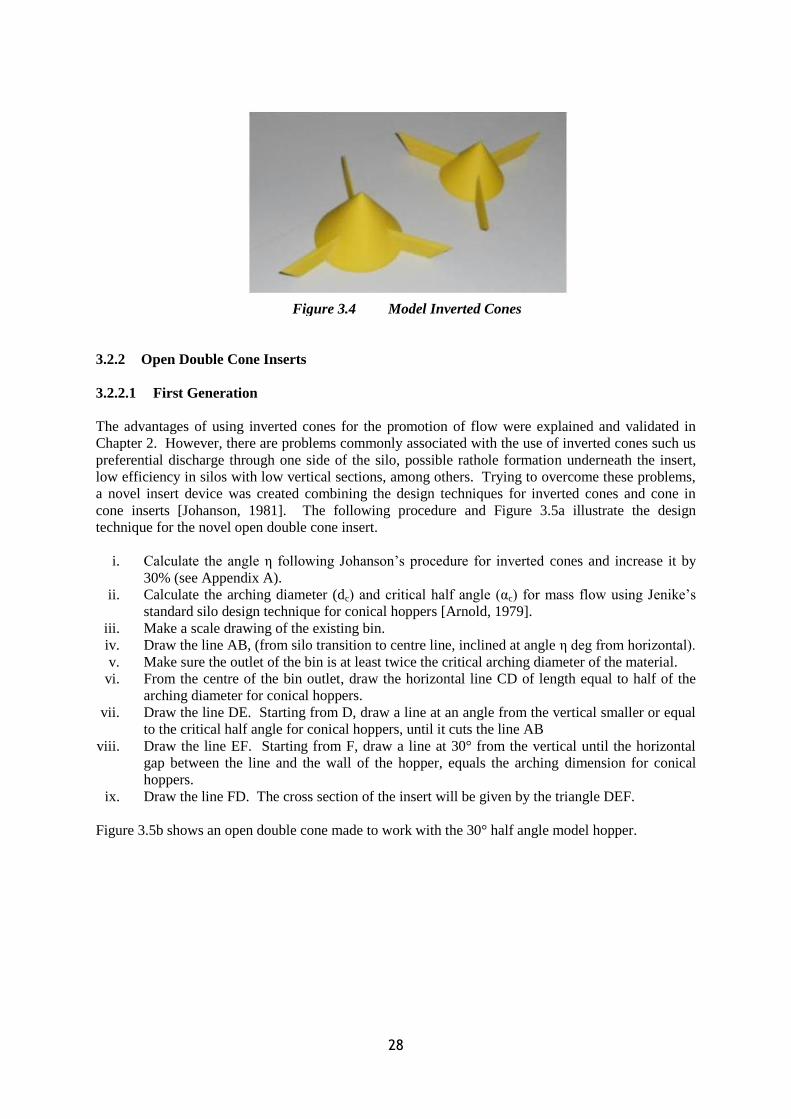
3.2.1 Inverted Cone Inserts
In order to observe how close this model represents a real process, two inverted cone inserts were
made according to the methods presented in Chapter 2. In this way, the model would become a scale
representation of the rig described in section 2.2, when using the 30° half angle converging section.
The inserts created had a 30° half angle and were 60 mm and 48 mm in diameter, respectively. Each
was supported on the converging section of the bin by three arms attached to their main body (see
Figure 3.4). An additional insert, designed using Johanson‟s method, was made to be used with 45°
half angle converging section, it had a 30° half angle and was 67 mm in diameter.
Figure 3.2 Vertical Sections Employed Figure 3.3 Additional Converging Section and
Impact Plate
28
Figure 3.4 Model Inverted Cones
3.2.2 Open Double Cone Inserts
3.2.2.1 First Generation
The advantages of using inverted cones for the promotion of flow were explained and validated in
Chapter 2. However, there are problems commonly associated with the use of inverted cones such us
preferential discharge through one side of the silo, possible rathole formation underneath the insert,
low efficiency in silos with low vertical sections, among others. Trying to overcome these problems,
a novel insert device was created combining the design techniques for inverted cones and cone in
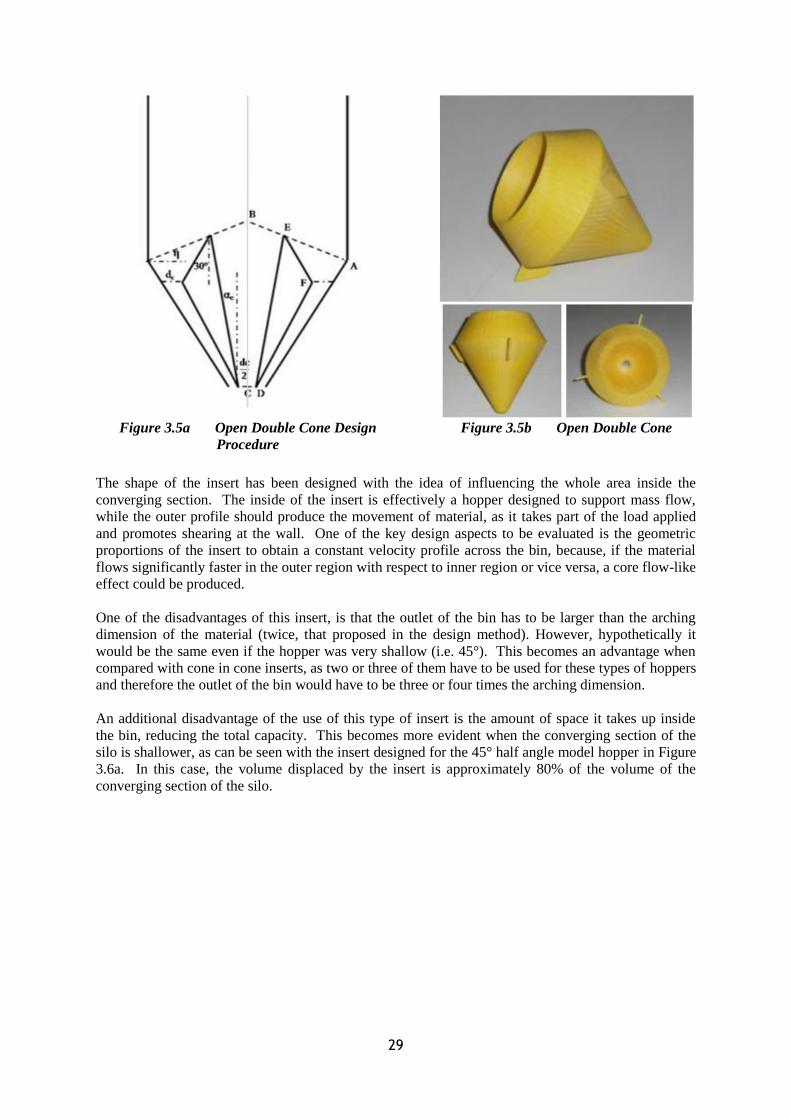
cone inserts [Johanson, 1981]. The following procedure and Figure 3.5a illustrate the design
technique for the novel open double cone insert.
i. Calculate the angle η following Johanson‟s procedure for inverted cones and increase it by
30% (see Appendix A).
ii. Calculate the arching diameter (dc) and critical half angle (αc) for mass flow using Jenike‟s
standard silo design technique for conical hoppers [Arnold, 1979].
iii. Make a scale drawing of the existing bin.
iv. Draw the line AB, (from silo transition to centre line, inclined at angle η deg from horizontal).
v. Make sure the outlet of the bin is at least twice the critical arching diameter of the material.
vi. From the centre of the bin outlet, draw the horizontal line CD of length equal to half of the
arching diameter for conical hoppers.
vii. Draw the line DE. Starting from D, draw a line at an angle from the vertical smaller or equal
to the critical half angle for conical hoppers, until it cuts the line AB
viii. Draw the line EF. Starting from F, draw a line at 30° from the vertical until the horizontal
gap between the line and the wall of the hopper, equals the arching dimension for conical
hoppers.
ix. Draw the line FD. The cross section of the insert will be given by the triangle DEF.
Figure 3.5b shows an open double cone made to work with the 30° half angle model hopper.
29
Figure 3.5a Open Double Cone Design
Procedure
Figure 3.5b Open Double Cone
The shape of the insert has been designed with the idea of influencing the whole area inside the
converging section. The inside of the insert is effectively a hopper designed to support mass flow,
while the outer profile should produce the movement of material, as it takes part of the load applied
and promotes shearing at the wall. One of the key design aspects to be evaluated is the geometric
proportions of the insert to obtain a constant velocity profile across the bin, because, if the material
flows significantly faster in the outer region with respect to inner region or vice versa, a core flow-like
effect could be produced.
One of the disadvantages of this insert, is that the outlet of the bin has to be larger than the arching
dimension of the material (twice, that proposed in the design method). However, hypothetically it
would be the same even if the hopper was very shallow (i.e. 45°). This becomes an advantage when
compared with cone in cone inserts, as two or three of them have to be used for these types of hoppers
and therefore the outlet of the bin would have to be three or four times the arching dimension.
An additional disadvantage of the use of this type of insert is the amount of space it takes up inside
the bin, reducing the total capacity. This becomes more evident when the converging section of the
silo is shallower, as can be seen with the insert designed for the 45° half angle model hopper in Figure
3.6a. In this case, the volume displaced by the insert is approximately 80% of the volume of the
converging section of the silo.
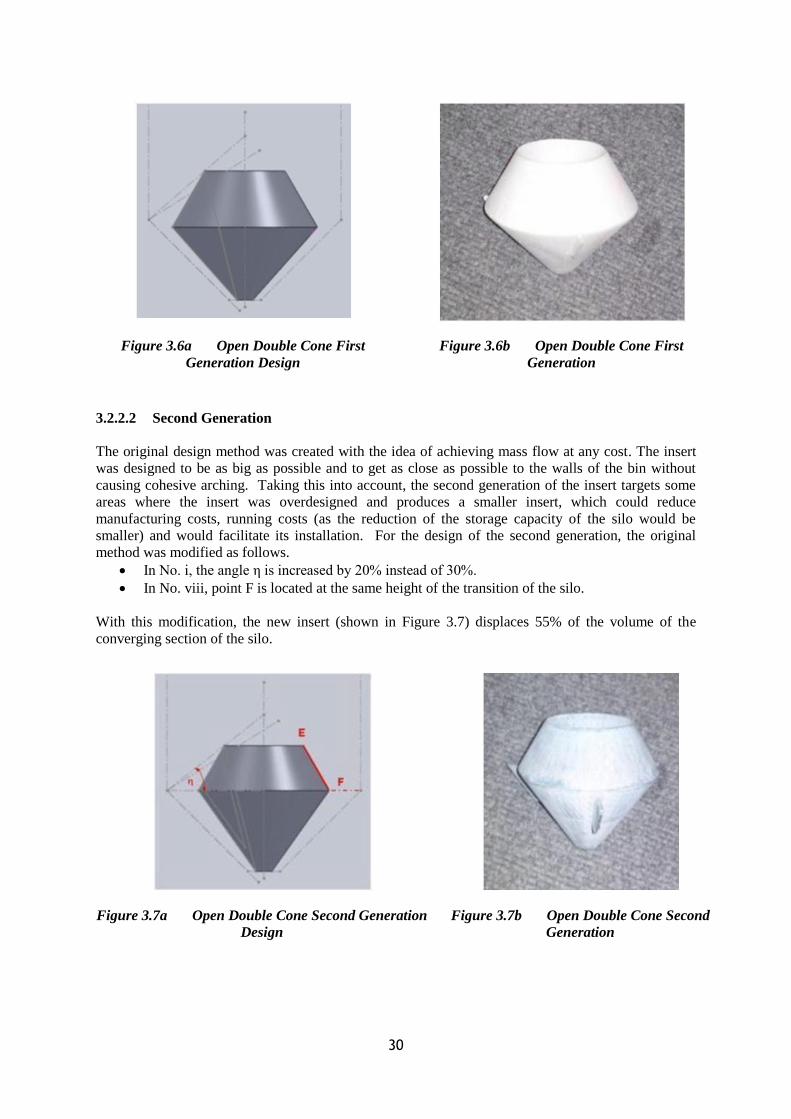
30
3.2.2.2 Second Generation
The original design method was created with the idea of achieving mass flow at any cost. The insert
was designed to be as big as possible and to get as close as possible to the walls of the bin without
causing cohesive arching. Taking this into account, the second generation of the insert targets some
areas where the insert was overdesigned and produces a smaller insert, which could reduce
manufacturing costs, running costs (as the reduction of the storage capacity of the silo would be
smaller) and would facilitate its installation. For the design of the second generation, the original
method was modified as follows.
In No. i, the angle η is increased by 20% instead of 30%.
In No. viii, point F is located at the same height of the transition of the silo.
With this modification, the new insert (shown in Figure 3.7) displaces 55% of the volume of the
converging section of the silo.
Figure 3.6a Open Double Cone First
Generation Design
Figure 3.6b Open Double Cone First
Generation
Figure 3.7a Open Double Cone Second Generation
Design
Figure 3.7b Open Double Cone Second
Generation
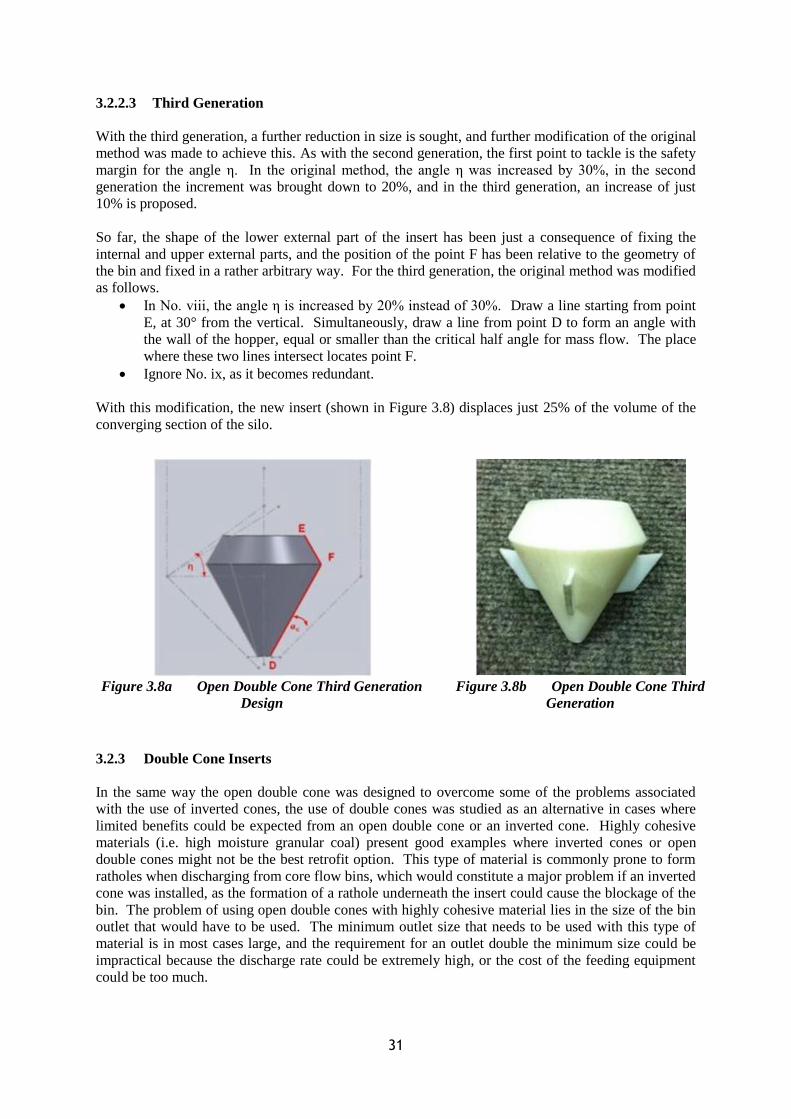
31
3.2.2.3 Third Generation
With the third generation, a further reduction in size is sought, and further modification of the original
method was made to achieve this. As with the second generation, the first point to tackle is the safety
margin for the angle η. In the original method, the angle η was increased by 30%, in the second
generation the increment was brought down to 20%, and in the third generation, an increase of just
10% is proposed.
So far, the shape of the lower external part of the insert has been just a consequence of fixing the
internal and upper external parts, and the position of the point F has been relative to the geometry of
the bin and fixed in a rather arbitrary way. For the third generation, the original method was modified
as follows.
In No. viii, the angle η is increased by 20% instead of 30%. Draw a line starting from point
E, at 30° from the vertical. Simultaneously, draw a line from point D to form an angle with
the wall of the hopper, equal or smaller than the critical half angle for mass flow. The place
where these two lines intersect locates point F.
Ignore No. ix, as it becomes redundant.
With this modification, the new insert (shown in Figure 3.8) displaces just 25% of the volume of the
converging section of the silo.
3.2.3 Double Cone Inserts
In the same way the open double cone was designed to overcome some of the problems associated
with the use of inverted cones, the use of double cones was studied as an alternative in cases where
limited benefits could be expected from an open double cone or an inverted cone. Highly cohesive
materials (i.e. high moisture granular coal) present good examples where inverted cones or open
double cones might not be the best retrofit option. This type of material is commonly prone to form
ratholes when discharging from core flow bins, which would constitute a major problem if an inverted
cone was installed, as the formation of a rathole underneath the insert could cause the blockage of the
bin. The problem of using open double cones with highly cohesive material lies in the size of the bin
outlet that would have to be used. The minimum outlet size that needs to be used with this type of
material is in most cases large, and the requirement for an outlet double the minimum size could be
impractical because the discharge rate could be extremely high, or the cost of the feeding equipment
could be too much.
Figure 3.8a Open Double Cone Third Generation
Design
Figure 3.8b Open Double Cone Third
Generation
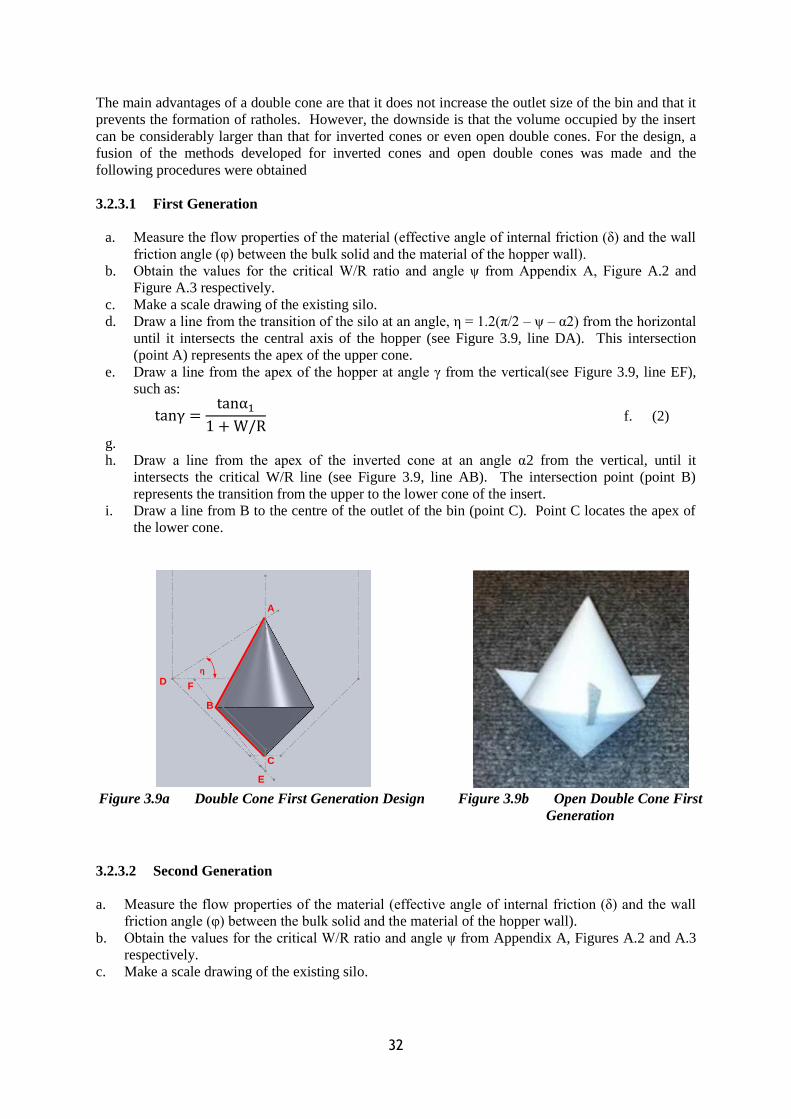
32
The main advantages of a double cone are that it does not increase the outlet size of the bin and that it
prevents the formation of ratholes. However, the downside is that the volume occupied by the insert
can be considerably larger than that for inverted cones or even open double cones. For the design, a
fusion of the methods developed for inverted cones and open double cones was made and the
following procedures were obtained
3.2.3.1 First Generation
a. Measure the flow properties of the material (effective angle of internal friction (δ) and the wall
friction angle (υ) between the bulk solid and the material of the hopper wall).
b. Obtain the values for the critical W/R ratio and angle ψ from Appendix A, Figure A.2 and
Figure A.3 respectively.
c. Make a scale drawing of the existing silo.
d. Draw a line from the transition of the silo at an angle, η = 1.2(π/2 – ψ – α2) from the horizontal
until it intersects the central axis of the hopper (see Figure 3.9, line DA). This intersection
(point A) represents the apex of the upper cone.
e. Draw a line from the apex of the hopper at angle γ from the vertical(see Figure 3.9, line EF),
such as:
f. (2)
g.
h. Draw a line from the apex of the inverted cone at an angle α2 from the vertical, until it
intersects the critical W/R line (see Figure 3.9, line AB). The intersection point (point B)
represents the transition from the upper to the lower cone of the insert.
i. Draw a line from B to the centre of the outlet of the bin (point C). Point C locates the apex of
the lower cone.
3.2.3.2 Second Generation
a. Measure the flow properties of the material (effective angle of internal friction (δ) and the wall
friction angle (υ) between the bulk solid and the material of the hopper wall).
b. Obtain the values for the critical W/R ratio and angle ψ from Appendix A, Figures A.2 and A.3
respectively.
c. Make a scale drawing of the existing silo.
Figure 3.9a Double Cone First Generation Design Figure 3.9b Open Double Cone First
Generation
ηF
D
αc
η
A
B
C
F
E
D
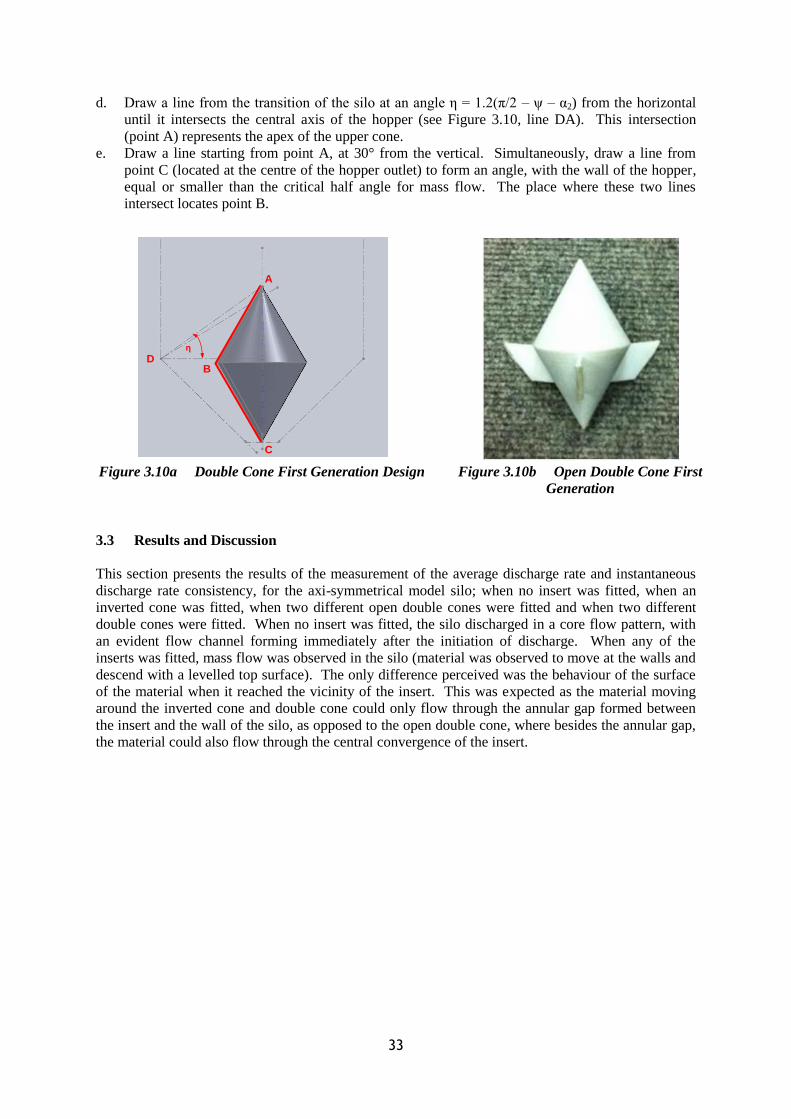
33
d. Draw a line from the transition of the silo at an angle η = 1.2(π/2 – ψ – α2) from the horizontal
until it intersects the central axis of the hopper (see Figure 3.10, line DA). This intersection
(point A) represents the apex of the upper cone.
e. Draw a line starting from point A, at 30° from the vertical. Simultaneously, draw a line from
point C (located at the centre of the hopper outlet) to form an angle, with the wall of the hopper,
equal or smaller than the critical half angle for mass flow. The place where these two lines
intersect locates point B.
3.3 Results and Discussion
This section presents the results of the measurement of the average discharge rate and instantaneous
discharge rate consistency, for the axi-symmetrical model silo; when no insert was fitted, when an
inverted cone was fitted, when two different open double cones were fitted and when two different
double cones were fitted. When no insert was fitted, the silo discharged in a core flow pattern, with
an evident flow channel forming immediately after the initiation of discharge. When any of the
inserts was fitted, mass flow was observed in the silo (material was observed to move at the walls and
descend with a levelled top surface). The only difference perceived was the behaviour of the surface
of the material when it reached the vicinity of the insert. This was expected as the material moving
around the inverted cone and double cone could only flow through the annular gap formed between
the insert and the wall of the silo, as opposed to the open double cone, where besides the annular gap,
the material could also flow through the central convergence of the insert.
Figure 3.10a Double Cone First Generation Design Figure 3.10b Open Double Cone First
Generation
η
A
B
C
D

34
a b
Figure 3.11 No Insert Results
a b
Figure 3.12 Inverted Cone Results
a b
Figure 3.13 Open Double Cone Second Generation Results
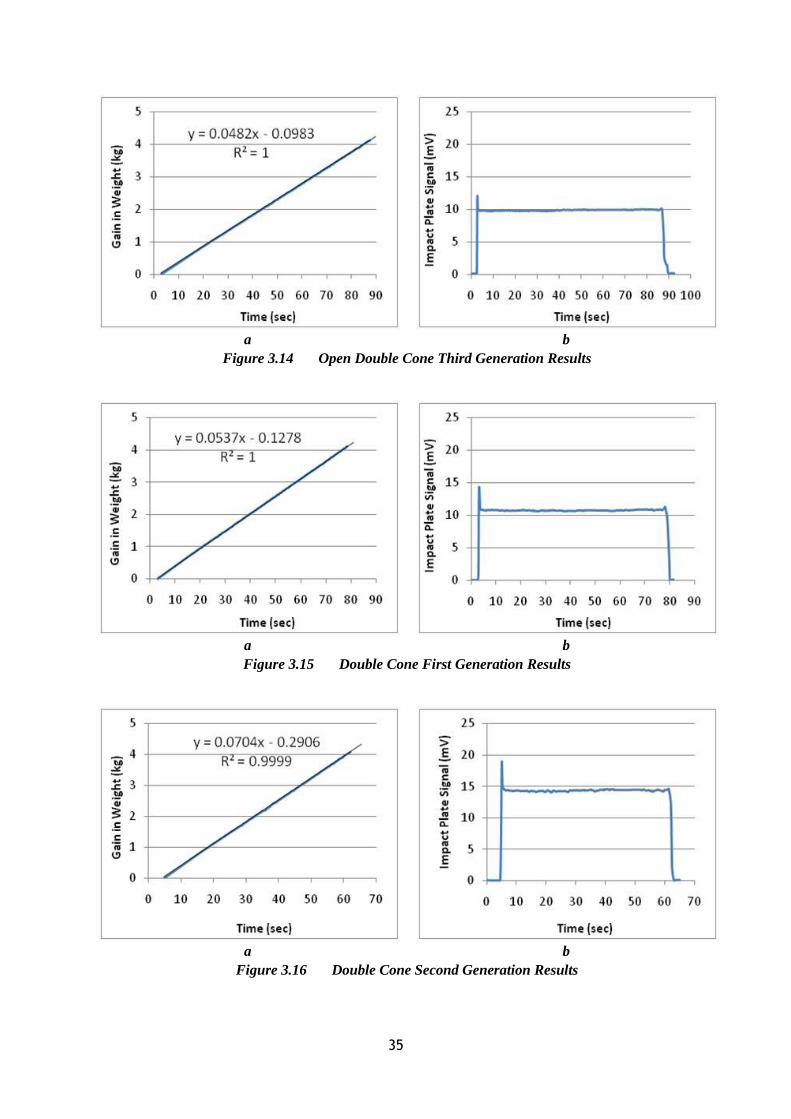
35
a b
Figure 3.14 Open Double Cone Third Generation Results
a b
Figure 3.15 Double Cone First Generation Results
a b
Figure 3.16 Double Cone Second Generation Results
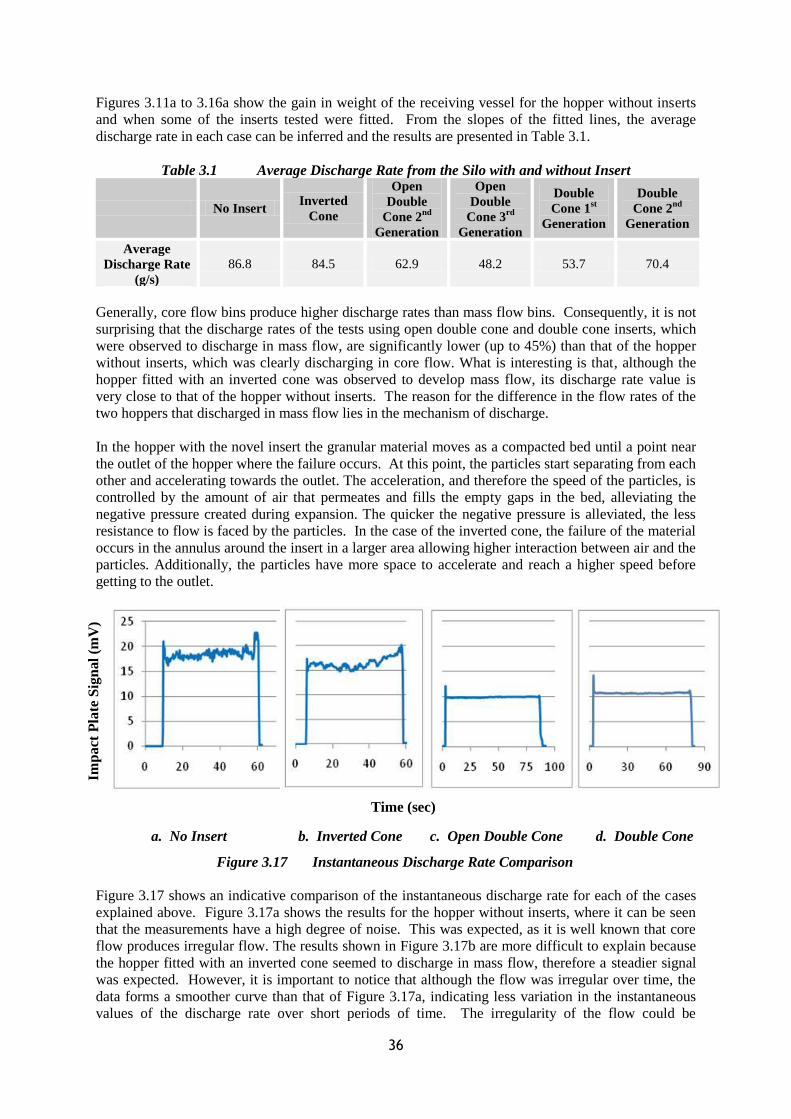
36
Figures 3.11a to 3.16a show the gain in weight of the receiving vessel for the hopper without inserts
and when some of the inserts tested were fitted. From the slopes of the fitted lines, the average
discharge rate in each case can be inferred and the results are presented in Table 3.1.
Table 3.1 Average Discharge Rate from the Silo with and without Insert
No Insert Inverted
Cone
Open
Double
Cone 2nd
Generation
Open
Double
Cone 3rd
Generation
Double
Cone 1st
Generation
Double
Cone 2nd
Generation
Average
Discharge Rate
(g/s)
86.8 84.5 62.9 48.2 53.7 70.4
Generally, core flow bins produce higher discharge rates than mass flow bins. Consequently, it is not
surprising that the discharge rates of the tests using open double cone and double cone inserts, which
were observed to discharge in mass flow, are significantly lower (up to 45%) than that of the hopper
without inserts, which was clearly discharging in core flow. What is interesting is that, although the
hopper fitted with an inverted cone was observed to develop mass flow, its discharge rate value is
very close to that of the hopper without inserts. The reason for the difference in the flow rates of the
two hoppers that discharged in mass flow lies in the mechanism of discharge.
In the hopper with the novel insert the granular material moves as a compacted bed until a point near
the outlet of the hopper where the failure occurs. At this point, the particles start separating from each
other and accelerating towards the outlet. The acceleration, and therefore the speed of the particles, is
controlled by the amount of air that permeates and fills the empty gaps in the bed, alleviating the
negative pressure created during expansion. The quicker the negative pressure is alleviated, the less
resistance to flow is faced by the particles. In the case of the inverted cone, the failure of the material
occurs in the annulus around the insert in a larger area allowing higher interaction between air and the
particles. Additionally, the particles have more space to accelerate and reach a higher speed before
getting to the outlet.
Imp
act
Pla
te S
ign
al
(mV
)
Time (sec)
a. No Insert b. Inverted Cone c. Open Double Cone d. Double Cone
Figure 3.17 Instantaneous Discharge Rate Comparison
Figure 3.17 shows an indicative comparison of the instantaneous discharge rate for each of the cases
explained above. Figure 3.17a shows the results for the hopper without inserts, where it can be seen
that the measurements have a high degree of noise. This was expected, as it is well known that core
flow produces irregular flow. The results shown in Figure 3.17b are more difficult to explain because
the hopper fitted with an inverted cone seemed to discharge in mass flow, therefore a steadier signal
was expected. However, it is important to notice that although the flow was irregular over time, the
data forms a smoother curve than that of Figure 3.17a, indicating less variation in the instantaneous
values of the discharge rate over short periods of time. The irregularity of the flow could be

37
indicative of uneven failure in the annulus around the insert, which could not be completely activated
at all times. From Figures 3.17c and 3.17d, it can be seen that the results for the hopper fitted with the
open double cone and the double cone are completely different from the previous two cases. The
consistency of the discharge rate is evident both over shorter and longer periods of time, which is
ideal for most industrial applications and proves the advantages of these inserts over inverted cones.
3.4 Summary
This chapter presented the methods for the design of open double cone and double cone inserts. Open
double cones are a novel type of insert that was designed to try and influence the whole area of the
converging section of a silo. The main advantages of this type of insert were the ability to produce
mass flow even when the angles of the hopper were very shallow and when the head of material was
low. Additionally, from the inserts tested, it was the least prone to producing a preferential discharge
down one side of the silo. The disadvantages of these inserts were the volumes occupied inside the
silo, and the size of the silo outlet, which had to be at least twice the value of the minimum arching
dimension. Double cone inserts solve the problem of the silo outlet size, as they need to be just equal
to minimum arching dimension, which makes them an excellent alternative when dealing with
cohesive powders. They also performed well with very shallow hoppers, but were a bit more prone to
preferential draw down one side, but not as much as inverted cones. Their performance under low
values of head of material was not as consistent as that of open double cones, but they produced better
results than the inverted cones.
CHAPTER FOUR: CASE STUDY – GRANULAR COAL SILO WITH MULTIPLE
OUTLETS
In the previous chapters, the use of static inserts for the promotion of flow in conical hoppers with a
single outlet has been presented. However, a common source of problems in plants handling granular
materials is silos with multiple outlets that are used independently. Devising a procedure for using
inserts to correct core flow issues in multiple outlet bins is an extremely complex problem, due to the
number of variables involved: the geometry of the silo, the number of outlets, the outlet size, shape
and position, the type of feeder interfaced. If all the outlets are operated simultaneously, the general
rules for inserts should still apply, but multiple inserts will be required for each or every 2 or 4 outlets
etc. However, if outlets are to be operated singularly (independently), the process of expanding the
flow channel becomes significantly more difficult with each case becoming potentially unique. The
best case for a general solution is a guidance procedure that should be followed, to optimise different
outlet configurations. However, this should not be a reason to discourage the evaluation of inserts as
possible solutions in certain cases. In this chapter, the problems occurring in a 650 ton granular coal
silo featuring multiple outlets are analysed, and a solution based on insert technology is proposed.
4.1 Description of the Industrial Silo
An industrial silo with multiple outlets storing granular coal has been reported to exhibit unreliable
flow rate and changes in the bulk density of the coal. The silo has a cylindrical vertical section of 18
m height and 7.5 m diameter, a 20° half angle conical hopper with a 2.6 m diameter outlet, which is
transitioned to a wedge hopper with a 0.4 m by 3.5 m slot. Four circular outlets 0.4 m in diameter are
equally spaced along the slot, but one of them is permanently blocked (see Figure 4.1). According to
flow property measurements, the geometry of the vessel should be capable of achieving mass flow, if
material was drawn over the entire length of the slot. However, because coal is discharged from a
single outlet, mass flow is not possible and a discharge channel is expected to form above the outlet
that is operated.
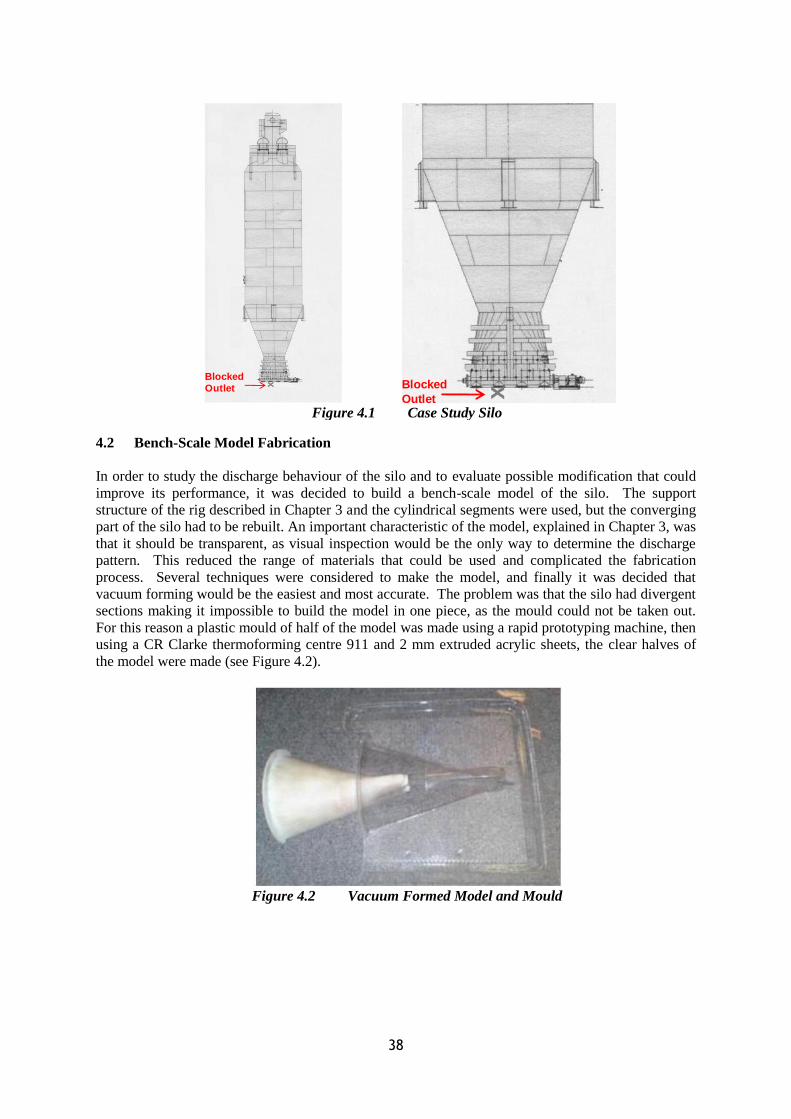
38
4.2 Bench-Scale Model Fabrication
In order to study the discharge behaviour of the silo and to evaluate possible modification that could
improve its performance, it was decided to build a bench-scale model of the silo. The support
structure of the rig described in Chapter 3 and the cylindrical segments were used, but the converging
part of the silo had to be rebuilt. An important characteristic of the model, explained in Chapter 3, was
that it should be transparent, as visual inspection would be the only way to determine the discharge
pattern. This reduced the range of materials that could be used and complicated the fabrication
process. Several techniques were considered to make the model, and finally it was decided that
vacuum forming would be the easiest and most accurate. The problem was that the silo had divergent
sections making it impossible to build the model in one piece, as the mould could not be taken out.
For this reason a plastic mould of half of the model was made using a rapid prototyping machine, then
using a CR Clarke thermoforming centre 911 and 2 mm extruded acrylic sheets, the clear halves of
the model were made (see Figure 4.2).
Figure 4.2 Vacuum Formed Model and Mould
Figure 4.1 Case Study Silo
x
Blocked
Outlet xBlocked
Outlet
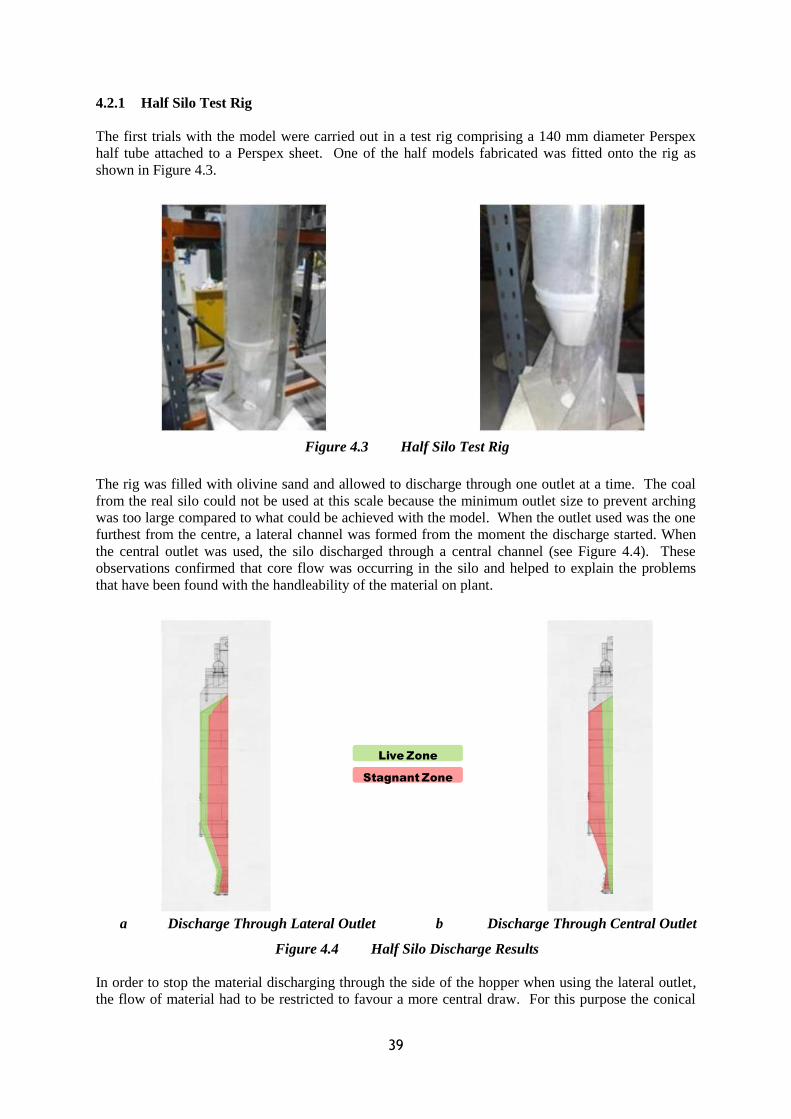
39
4.2.1 Half Silo Test Rig
The first trials with the model were carried out in a test rig comprising a 140 mm diameter Perspex
half tube attached to a Perspex sheet. One of the half models fabricated was fitted onto the rig as
shown in Figure 4.3.
The rig was filled with olivine sand and allowed to discharge through one outlet at a time. The coal
from the real silo could not be used at this scale because the minimum outlet size to prevent arching
was too large compared to what could be achieved with the model. When the outlet used was the one
furthest from the centre, a lateral channel was formed from the moment the discharge started. When
the central outlet was used, the silo discharged through a central channel (see Figure 4.4). These
observations confirmed that core flow was occurring in the silo and helped to explain the problems
that have been found with the handleability of the material on plant.
In order to stop the material discharging through the side of the hopper when using the lateral outlet,
the flow of material had to be restricted to favour a more central draw. For this purpose the conical
Figure 4.3 Half Silo Test Rig
a Discharge Through Lateral Outlet b Discharge Through Central Outlet
Figure 4.4 Half Silo Discharge Results
Live Zone
Stagnant Zone
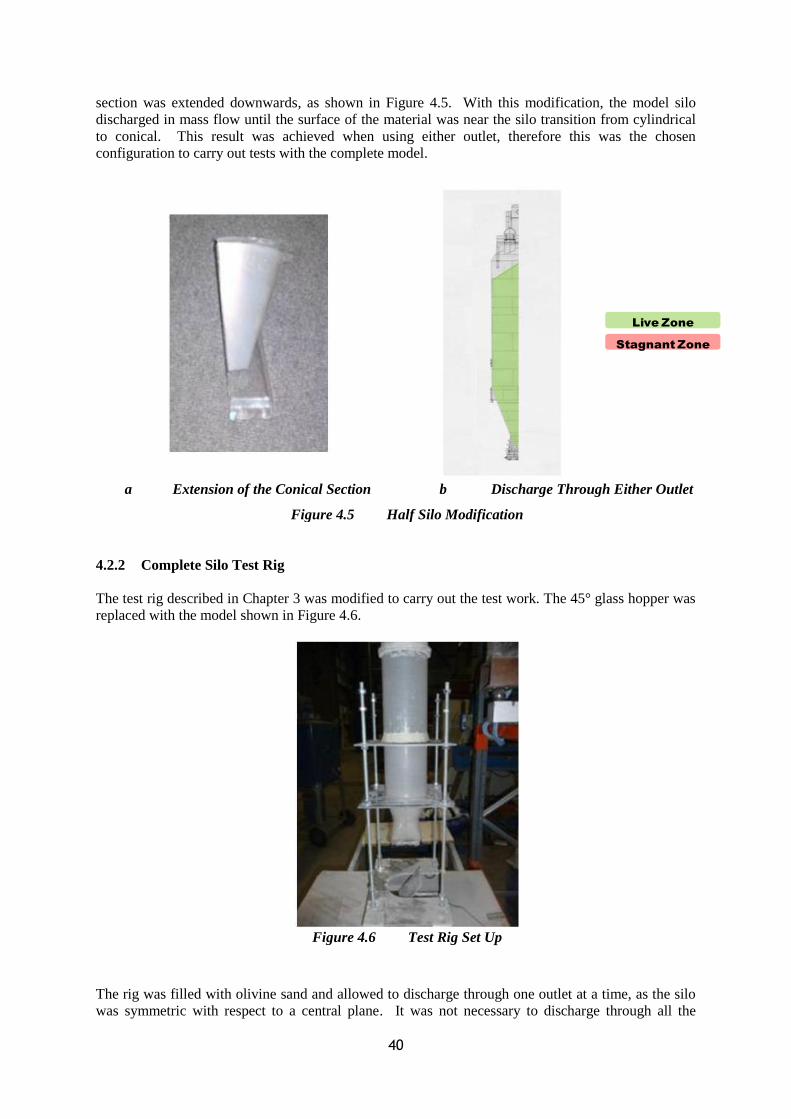
40
section was extended downwards, as shown in Figure 4.5. With this modification, the model silo
discharged in mass flow until the surface of the material was near the silo transition from cylindrical
to conical. This result was achieved when using either outlet, therefore this was the chosen
configuration to carry out tests with the complete model.
4.2.2 Complete Silo Test Rig
The test rig described in Chapter 3 was modified to carry out the test work. The 45° glass hopper was
replaced with the model shown in Figure 4.6.
Figure 4.6 Test Rig Set Up
The rig was filled with olivine sand and allowed to discharge through one outlet at a time, as the silo
was symmetric with respect to a central plane. It was not necessary to discharge through all the
a Extension of the Conical Section b Discharge Through Either Outlet
Figure 4.5 Half Silo Modification
Live Zone
Stagnant Zone

41
outlets, but just through two of them. The results resembled what was observed with the half silo rig,
as a lateral and a central channel were formed when using the lateral and the central outlet
respectively. Then, the cone extension was tried, but in this case there was not much improvement
and channels were still appearing during the discharge.
However, there was a substantial difference between the half and the complete silo rigs. The flat
sheet, to which the half tube was attached, acted as an extra wall reducing the resistance to flow. The
friction between two layers of powder is higher than the friction between a layer of powder and the
surface of the wall.
To achieve the same result in the complete rig, a flat plate should be installed in the centre of the silo
and along the full height of it. However, this would not be adequate at large scale because only one
side of the silo would discharge creating enormous side loads endangering the stability of the silo.
Instead, it was decided to install a flat plate that extended up to the transition of the silo (see Figure
4.7). This point was chosen because it is where the cross section area stops changing, and therefore it
is the lowest point where the maximum discharge channel width could be achieved with the central
plate.
Figure 4.7 Flat Plate
The installation of the flat plate had a very positive impact in the discharge behaviour of the hopper, a
short section at the top of the silo was observed to slide at the wall and then discharge through a
channel notably wider than before. However, it was observed that at the outlet of the conical
extension, the material was moving a lot faster near the cone than near the flat plate where it was
almost stagnant.
In order to achieve further improvement, it was decided to vary two parameters and study the effect
on the discharge pattern. The first parameter was the length of the conical extension, which involved
a variation of the size of its outlet, and the second one was the shape of that outlet. The idea of
changing the shape of the conical extension outlet was considered to promote flow near the flat plate
and restrict flow near the cone.
Three types of outlets and several extension lengths were tried, as the symmetry of the silo allowed
two different configurations to be tested within the same set up. Figure 4.8a shows the first type of
outlet shape, which was discussed above. It has a semicircular shape with the edge at an even level,
and Figure 4.8a also shows how two different extension lengths could be tested. Figure 4.8b shows
the second type of outlet that was tried. It allowed the powder to discharge with less restriction near
the flat plate. This produced a lengthening of the section at the top of the silo where the material slid
at the wall and went down levelled. Although, the improvement obtained with the change of outlet
shape was evident, the powder was still discharging more slowly near the central plate. For that
reason, it was decided to modify the shape of the outlet to promote further flow of the material near
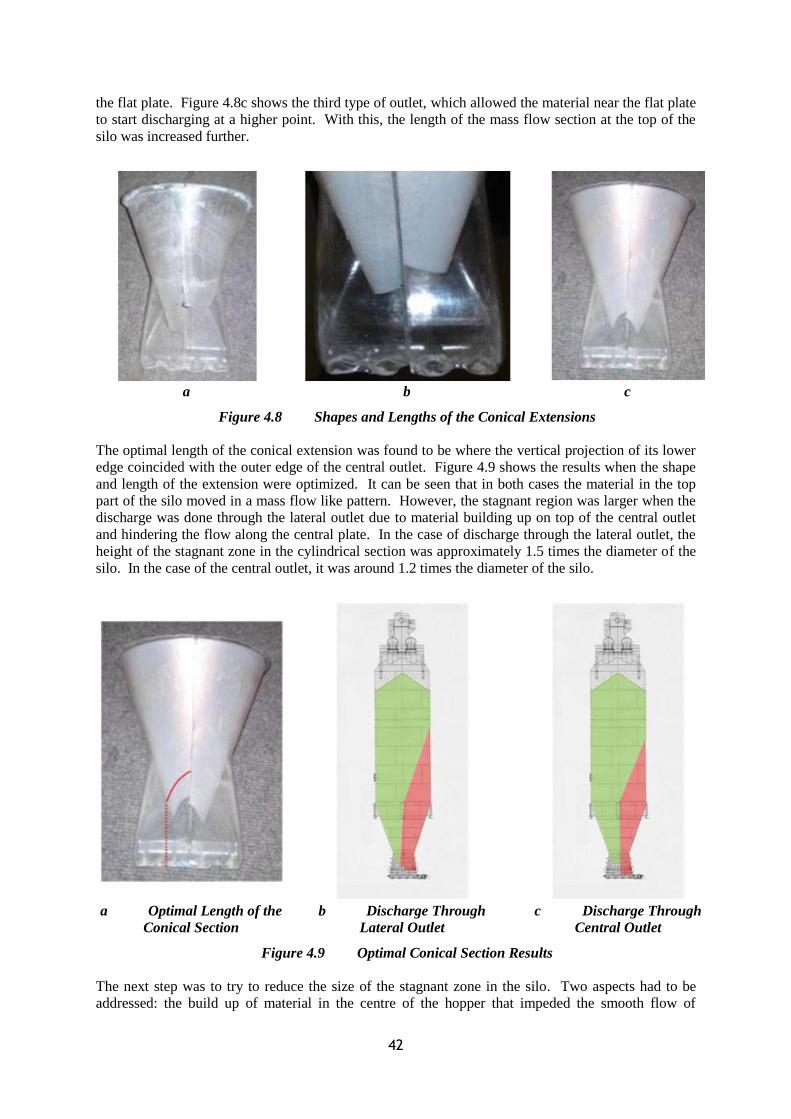
42
the flat plate. Figure 4.8c shows the third type of outlet, which allowed the material near the flat plate
to start discharging at a higher point. With this, the length of the mass flow section at the top of the
silo was increased further.
The optimal length of the conical extension was found to be where the vertical projection of its lower
edge coincided with the outer edge of the central outlet. Figure 4.9 shows the results when the shape
and length of the extension were optimized. It can be seen that in both cases the material in the top
part of the silo moved in a mass flow like pattern. However, the stagnant region was larger when the
discharge was done through the lateral outlet due to material building up on top of the central outlet
and hindering the flow along the central plate. In the case of discharge through the lateral outlet, the
height of the stagnant zone in the cylindrical section was approximately 1.5 times the diameter of the
silo. In the case of the central outlet, it was around 1.2 times the diameter of the silo.
The next step was to try to reduce the size of the stagnant zone in the silo. Two aspects had to be
addressed: the build up of material in the centre of the hopper that impeded the smooth flow of
a b c
Figure 4.8 Shapes and Lengths of the Conical Extensions
a Optimal Length of the
Conical Section
b Discharge Through
Lateral Outlet
c Discharge Through
Central Outlet
Figure 4.9 Optimal Conical Section Results
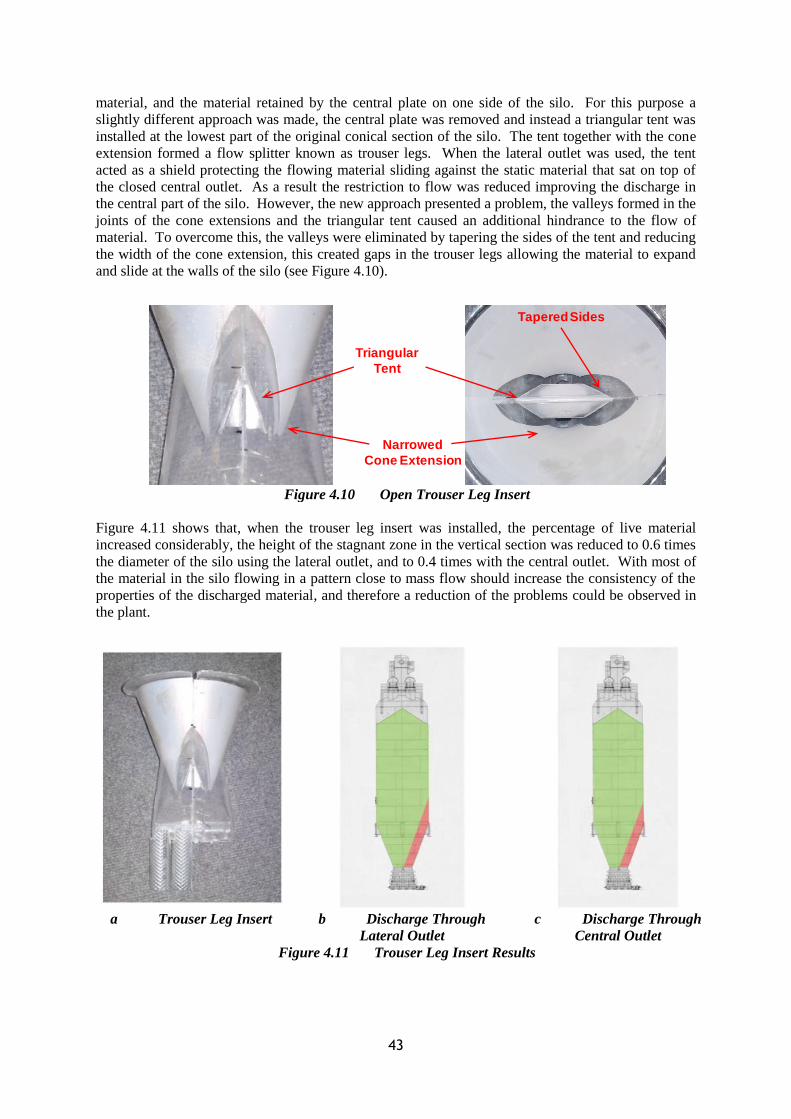
43
material, and the material retained by the central plate on one side of the silo. For this purpose a
slightly different approach was made, the central plate was removed and instead a triangular tent was
installed at the lowest part of the original conical section of the silo. The tent together with the cone
extension formed a flow splitter known as trouser legs. When the lateral outlet was used, the tent
acted as a shield protecting the flowing material sliding against the static material that sat on top of
the closed central outlet. As a result the restriction to flow was reduced improving the discharge in
the central part of the silo. However, the new approach presented a problem, the valleys formed in the
joints of the cone extensions and the triangular tent caused an additional hindrance to the flow of
material. To overcome this, the valleys were eliminated by tapering the sides of the tent and reducing
the width of the cone extension, this created gaps in the trouser legs allowing the material to expand
and slide at the walls of the silo (see Figure 4.10).
Figure 4.11 shows that, when the trouser leg insert was installed, the percentage of live material
increased considerably, the height of the stagnant zone in the vertical section was reduced to 0.6 times
the diameter of the silo using the lateral outlet, and to 0.4 times with the central outlet. With most of
the material in the silo flowing in a pattern close to mass flow should increase the consistency of the
properties of the discharged material, and therefore a reduction of the problems could be observed in
the plant.
Figure 4.10 Open Trouser Leg Insert
a Trouser Leg Insert b Discharge Through
Lateral Outlet
c Discharge Through
Central Outlet
Figure 4.11 Trouser Leg Insert Results
Narrowed
Cone Extension
Triangular
Tent
Tapered Sides

44
4.3 Summary
This chapter presented an industrial case study comprising a 650 tonne silo storing granular coal,
which had been reported to exhibit an unreliable flow rate and changes in the bulk density of the coal.
The silo was cylindrical with a conical converging section which is transitioned into a wedge hopper.
Four circular outlets were equally spaced along the slotted bottom of the wedge hopper, but one was
permanently blocked. According to flow property measurements, the geometry of the vessel should
be capable of achieving mass flow, if material was drawn over the entire length of the slot. However,
because coal is discharged from one outlet at a time, mass flow is not possible and a core flow
discharge channel was expected to form above the outlet that is operated. To study the discharge
behaviour of the silo, a 0.003 m3 transparent model was built. As was expected the silo was found to
develop a narrow discharge channel above the open outlet, this type of core flow behaviour is thought
to cause the problems experienced on plant. The type of geometry of the silo did not allow the use of
one of the inserts described in Chapter 3 and a new approach had to be taken. Several alternatives
were tested and the one that gave the best results was developed further. The solution proposed
consisted of making the coal fail at a point different from the circular outlets, trying to minimize the
effect of having only one outlet open. For this purpose an internal trouser leg (stream divider) was
installed. With the insert in place the flow channel was expanded until it touched the walls of the silo
allowing most of the material in the cylindrical section of the silo to discharge in mass flow-like
pattern. Therefore, the insert installed changed the discharge pattern of the silo from core flow to
expanded flow.
CONCLUSIONS
Test Rig Development for the Study of Static Inserts as Flow Promoting Devices
The maximum load exerted on an insert is applied immediately after the silo starts discharging.
When the outlet of the silo opens the material tries to support itself forming an arch. If the
vertical force, due to the self weight of the material, overcomes the strength of the arch it will
break and the discharge will initiate. The arching and failing effect propagates upwards allowing
the material to expand and move. Just before the material in vicinity of the insert starts moving,
the arch is supported on the base of the insert and part of the force acting on the arch is
transmitted on to the insert increasing the total load. Additionally, it is a known fact that the
coefficient of friction between two materials reaches its peak value just before movement starts.
Therefore, the value of the total force exerted must also increase, because it is function of the
coefficient of friction between the granular material and the wall of the insert.
Although for tall silos the maximum vertical stress is regarded as independent of the head of
material, when the height of the vertical section of the silo is not much bigger than its diameter
(less than three times), the vertical stress becomes a strong function of the head of powder. In
general, it could be concluded that, for this type of silo, the lower an insert is placed in the hopper
the higher the force exerted on it. However, if the insert is lowered beyond a certain point, the
walls of the silo support some of the material around the insert and the exerted force decreases, as
it is shown by the results obtained from the tests using a hopper with a vertical section length
equal to half its diameter.
The results obtained from the test program validate the method developed by Johanson for the
calculation of the maximum load exerted on inverted cones when installed in a tall silo. The
theoretical predictions were in every case within 7% of the experimental measurements.
However, the same method failed when it was applied to flat plates installed in a short silo. For
this case the predicted values were between 50 and 70% smaller than the experimental
measurements.
The developed discharge pattern tracer system accurately mapped the behaviour of the solids
discharging from the silos, it not only differentiated core flow, mass flow and expanded flow

45
patterns but also identified velocity profiles across the bin. The system therefore provided a
quantitative method for the evaluation and comparison of the performance of the inserts. An
important discovery, made from the tracer system data, showed that the particles passing through
the annular gap between the insert and the hopper move at different speeds. The particles passing
near the wall of the insert move faster than those near the walls of the hopper, which is a
consequence of two mechanisms. Firstly, when the material passes through the annular gap, it
finds a void space below the insert (a region of low stress) into which, it is easier to move and
then continue to the outlet. The second mechanism is a consequence of the first, because as some
of the material expands towards the empty space, the driving force acting on the material near the
hopper wall reduces, making it more difficult for the powder to flow in that region.
The comparison made in a 0.4m3 Laboratory scale test rig between two inverted cone inserts, one
designed using a the method developed by Johanson and the other one using a modified Johanson
method proposed in the project, showed that the modified insert was more effective at achieving
mass flow in silos previously discharging in core flow. When the head of material in the silo was
higher than three times the diameter of the bin, both inserts successfully converted the discharge
pattern in the bin from core flow to mass flow. However, when using the modified insert, the
difference in resident time between particles located at the same depth in the silo was smaller than
when using Johanson‟s insert. This could result in discharged material with more homogeneous
properties. The advantages of the modified insert were more significant when the head of
material in the silo dropped under three times the diameter of the bin. In this case the insert
designed using Johanson‟s method did not produce mass flow during the silo discharge, instead it
widened the discharge channel until it touched the walls of the silo obtaining an expanded flow
pattern. These results contrasted with those obtained using the insert designed using the modified
method, which under the same test conditions successfully continued to produce mass flow. The
key difference between both inserts was not only the larger size of the insert but probably more
important, the higher location of its apex. This allowed changes in the stress field around the
insert without compromising its performance. The results obtained with Johanson‟s insert show
the effect the head of material has on the size of the region influenced by the insert, this region
lies between two lines starting from the apex and the base of the insert respectively. When the
head of material is large, both influencing lines touch the wall of the silo before they intersect
each other, therefore the material near the wall is influenced and movement occurs. When the
head of material reduces, the trajectory of the lines change intersecting each other before reaching
the wall. In this case only the material in the region comprised by the intersecting lines move and
the material near the wall of the silo remains stagnant.
Study of Insert Configuration to Optimize Discharge Performance
The similarities between the results obtained from the laboratory scale test rig and the bench scale
test, when using two different inverted cones, support the use of the bench scale model as a
qualitative method for the evaluation of insert performance. Emulating the test work carried out
with the laboratory scale rig, an insert designed using Johanson‟s method and one using the
modified method were compared in the bench scale rig. The results showed that both inserts
could produce mass flow, but the material in the vertical section continued moving and levelled to
a deeper point in the silo when using the bigger insert (modified method) rather than Johanson‟s
insert. This phenomena was also observed in the tests carried out in the laboratory scale rig,
showing that the modified insert had better performance than Johanson‟s insert when working
with low heads of material.
Both the laboratory scale rig and the bench scale rig provided evidence that hoppers operating in
core flow are more prone to exhibit a preferential draw down one side, than those operating in
mass flow. The results also suggested that the discharge behaviour of core flow hoppers is more
sensitive to filling conditions, and consolidation.
The method developed for the design of a novel open double cone insert was conceived to try to
overcome the problems commonly associated with the use of inverted cones; such us preferential
discharge down one side of the silo, possible rathole formation underneath the insert and low
efficiency in silos with low height vertical sections. The profile of the insert was designed to
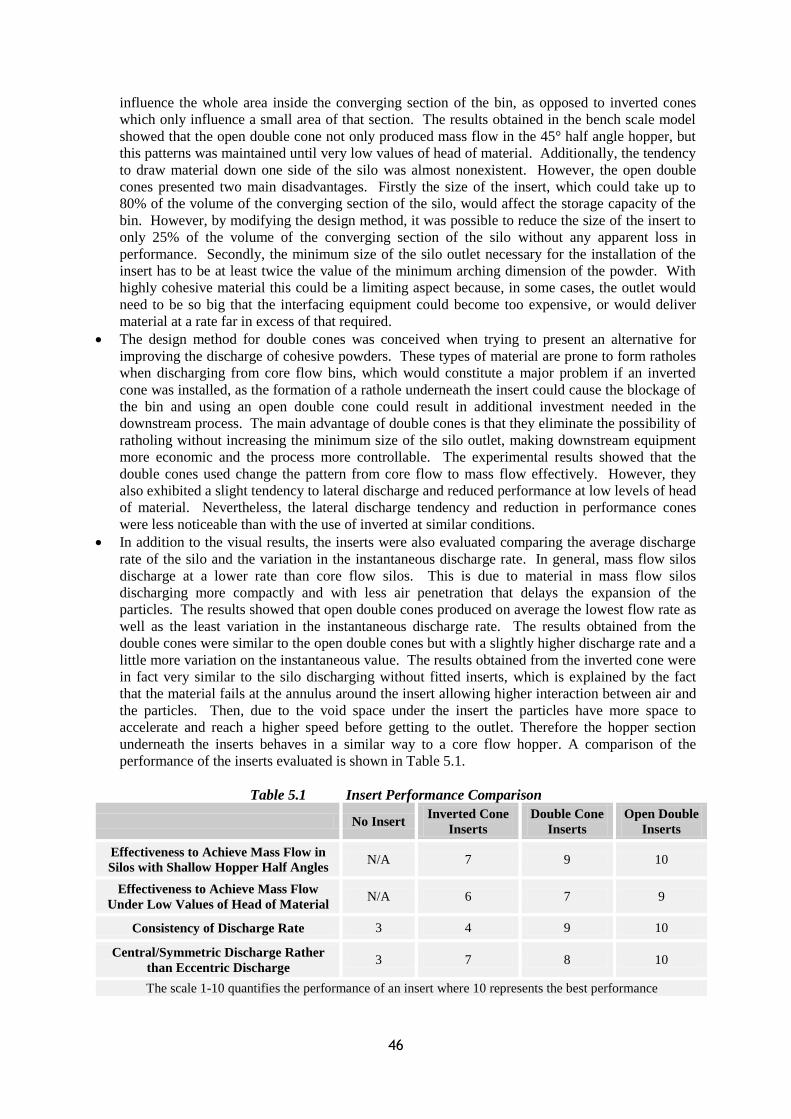
46
influence the whole area inside the converging section of the bin, as opposed to inverted cones
which only influence a small area of that section. The results obtained in the bench scale model
showed that the open double cone not only produced mass flow in the 45° half angle hopper, but
this patterns was maintained until very low values of head of material. Additionally, the tendency
to draw material down one side of the silo was almost nonexistent. However, the open double
cones presented two main disadvantages. Firstly the size of the insert, which could take up to
80% of the volume of the converging section of the silo, would affect the storage capacity of the
bin. However, by modifying the design method, it was possible to reduce the size of the insert to
only 25% of the volume of the converging section of the silo without any apparent loss in
performance. Secondly, the minimum size of the silo outlet necessary for the installation of the
insert has to be at least twice the value of the minimum arching dimension of the powder. With
highly cohesive material this could be a limiting aspect because, in some cases, the outlet would
need to be so big that the interfacing equipment could become too expensive, or would deliver
material at a rate far in excess of that required.
The design method for double cones was conceived when trying to present an alternative for
improving the discharge of cohesive powders. These types of material are prone to form ratholes
when discharging from core flow bins, which would constitute a major problem if an inverted
cone was installed, as the formation of a rathole underneath the insert could cause the blockage of
the bin and using an open double cone could result in additional investment needed in the
downstream process. The main advantage of double cones is that they eliminate the possibility of
ratholing without increasing the minimum size of the silo outlet, making downstream equipment
more economic and the process more controllable. The experimental results showed that the
double cones used change the pattern from core flow to mass flow effectively. However, they
also exhibited a slight tendency to lateral discharge and reduced performance at low levels of head
of material. Nevertheless, the lateral discharge tendency and reduction in performance cones
were less noticeable than with the use of inverted at similar conditions.
In addition to the visual results, the inserts were also evaluated comparing the average discharge
rate of the silo and the variation in the instantaneous discharge rate. In general, mass flow silos
discharge at a lower rate than core flow silos. This is due to material in mass flow silos
discharging more compactly and with less air penetration that delays the expansion of the
particles. The results showed that open double cones produced on average the lowest flow rate as
well as the least variation in the instantaneous discharge rate. The results obtained from the
double cones were similar to the open double cones but with a slightly higher discharge rate and a
little more variation on the instantaneous value. The results obtained from the inverted cone were
in fact very similar to the silo discharging without fitted inserts, which is explained by the fact
that the material fails at the annulus around the insert allowing higher interaction between air and
the particles. Then, due to the void space under the insert the particles have more space to
accelerate and reach a higher speed before getting to the outlet. Therefore the hopper section
underneath the inserts behaves in a similar way to a core flow hopper. A comparison of the
performance of the inserts evaluated is shown in Table 5.1.
Table 5.1 Insert Performance Comparison
No Insert Inverted Cone
Inserts
Double Cone
Inserts
Open Double
Inserts
Effectiveness to Achieve Mass Flow in
Silos with Shallow Hopper Half Angles N/A 7 9 10
Effectiveness to Achieve Mass Flow
Under Low Values of Head of Material N/A 6 7 9
Consistency of Discharge Rate 3 4 9 10
Central/Symmetric Discharge Rather
than Eccentric Discharge 3 7 8 10
The scale 1-10 quantifies the performance of an insert where 10 represents the best performance
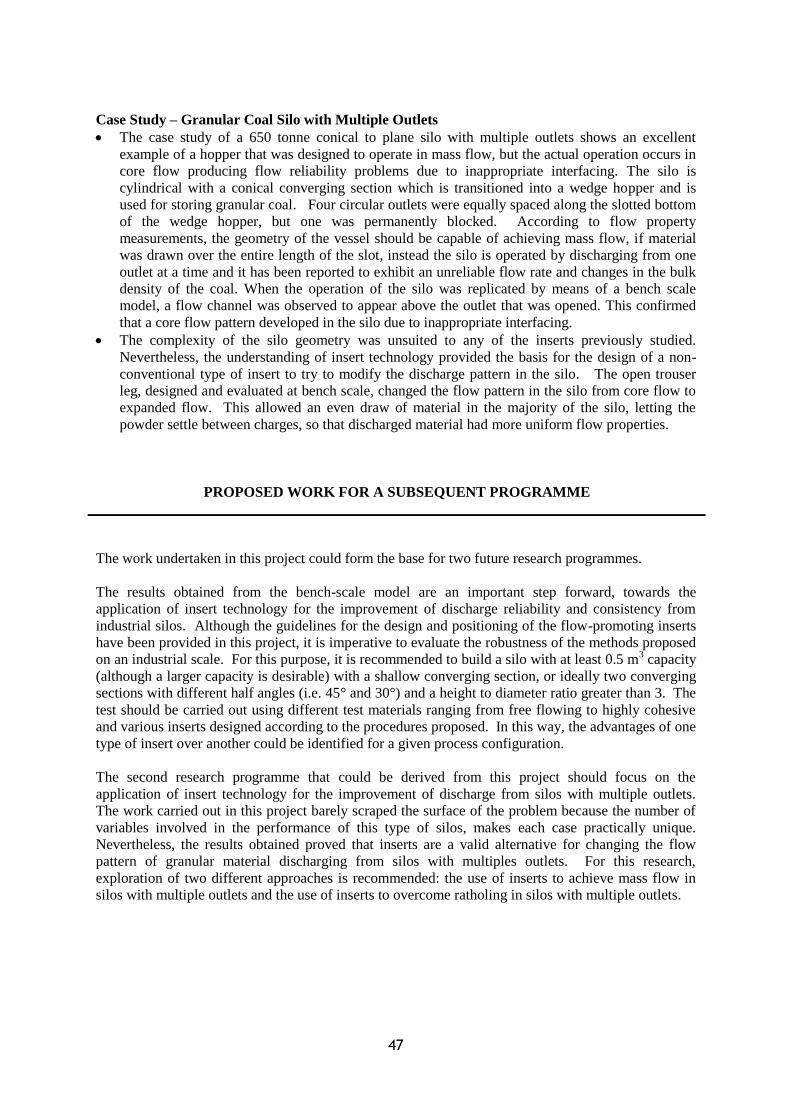
47
Case Study – Granular Coal Silo with Multiple Outlets
The case study of a 650 tonne conical to plane silo with multiple outlets shows an excellent
example of a hopper that was designed to operate in mass flow, but the actual operation occurs in
core flow producing flow reliability problems due to inappropriate interfacing. The silo is
cylindrical with a conical converging section which is transitioned into a wedge hopper and is
used for storing granular coal. Four circular outlets were equally spaced along the slotted bottom
of the wedge hopper, but one was permanently blocked. According to flow property
measurements, the geometry of the vessel should be capable of achieving mass flow, if material
was drawn over the entire length of the slot, instead the silo is operated by discharging from one
outlet at a time and it has been reported to exhibit an unreliable flow rate and changes in the bulk
density of the coal. When the operation of the silo was replicated by means of a bench scale
model, a flow channel was observed to appear above the outlet that was opened. This confirmed
that a core flow pattern developed in the silo due to inappropriate interfacing.
The complexity of the silo geometry was unsuited to any of the inserts previously studied.
Nevertheless, the understanding of insert technology provided the basis for the design of a non-
conventional type of insert to try to modify the discharge pattern in the silo. The open trouser
leg, designed and evaluated at bench scale, changed the flow pattern in the silo from core flow to
expanded flow. This allowed an even draw of material in the majority of the silo, letting the
powder settle between charges, so that discharged material had more uniform flow properties.
PROPOSED WORK FOR A SUBSEQUENT PROGRAMME
The work undertaken in this project could form the base for two future research programmes.
The results obtained from the bench-scale model are an important step forward, towards the
application of insert technology for the improvement of discharge reliability and consistency from
industrial silos. Although the guidelines for the design and positioning of the flow-promoting inserts
have been provided in this project, it is imperative to evaluate the robustness of the methods proposed
on an industrial scale. For this purpose, it is recommended to build a silo with at least 0.5 m3 capacity
(although a larger capacity is desirable) with a shallow converging section, or ideally two converging
sections with different half angles (i.e. 45° and 30°) and a height to diameter ratio greater than 3. The
test should be carried out using different test materials ranging from free flowing to highly cohesive
and various inserts designed according to the procedures proposed. In this way, the advantages of one
type of insert over another could be identified for a given process configuration.
The second research programme that could be derived from this project should focus on the
application of insert technology for the improvement of discharge from silos with multiple outlets.
The work carried out in this project barely scraped the surface of the problem because the number of
variables involved in the performance of this type of silos, makes each case practically unique.
Nevertheless, the results obtained proved that inserts are a valid alternative for changing the flow
pattern of granular material discharging from silos with multiples outlets. For this research,
exploration of two different approaches is recommended: the use of inserts to achieve mass flow in
silos with multiple outlets and the use of inserts to overcome ratholing in silos with multiple outlets.
48
PUBLICATIONS ARISING FROM THE PROJECT
K. Ariza-Zafra, R.J. Berry and M. Bradley, Review of Models for Predicting the Discharge Rates of
Bulk Particulates from Silos and Bins. Proceedings of RELPOFLOW IV, 2008.
K. Ariza-Zafra, R.J. Berry, M. Bradley and J. Santana, Study of Discharge Behaviour in a Silo
Retrofitted with Flow-Promoting Inserts. Proceedings of WCPT6, 2010.
K. Ariza-Zafra, R.J. Berry and M. Bradley, Achieving Mass Flow in Silos with Shallow Converging
Sections Using Inverted Cones. Proceedings of Bulk Solids Europe, 2010.
REFERENCES
Arnold, 1979 P. Arnold, A. McLean and A. Roberts. Bulk Solids: Storage, Flow and Handling,
TUNRA Ltd, University of Newcastle, Australia, 1979.
Arnold, 2001 P. Arnold, Some Observations on the Application of Static Flow Promotion
Devices for Discharging Bulk Solids from Bins, Proceedings of 7th International
Conference on Bulk Materials Storage, Handling and Transportation. 2001
Bates, 2001 L. Bates, Improving Flow from Hoppers Using Inserts and Novel Wall Profiles,
Proceedings of 7th International Conference on Bulk Materials Storage, Handling
and Transportation. 2001
Chou, 2006 C. Chou and J. Chang, Theoretical Wall Stresses and Insert Loads in a Bin-
Hopper with a Conical Insert Using the Differential Slice Method, Advanced
Powder Technology, Volume 17, Issue 5, 2006
Ding, 2002 S. Ding, Predictions of Loads on Walls and Insert in a Gravity Flow Silo Using
ABAQUS, POSTEC Newsletter, No 20, 2002
Ding, 2003 S. Ding, Parameter Investigation of the Effect of a Double-Cone Insert on Silo
Discharge Mode, POSTEC Newsletter, No 21, 2003
Ding, 20041 S. Ding, An Experimental Study of Effect of a Double Cone Insert, POSTEC
Newsletter, No 22, 2004
Ding, 20042 S. Ding, Investigation of Flow and Pressure in Silos During Filling and
Discharging in Presence of Inserts, PhD Thesis, The University of Edinburgh,
2004
Ding, 2005 S. Ding, Effect of a Double Cone Insert on Silo Discharge, POSTEC Newsletter,
No 23, 2005
Ding, 2008 S. Ding, G. Enstad, M. Jecmenica, J. Ooi and J. Rotter, Prediction of Flow Mode
During Silo Discharge and its Preliminary Verification, Proceedings of
RELPOFLOW IV, 2008
Enstad, 1999 G. Enstad, Use of Inverted Cones and Double Cones as Inserts for Obtaining
Mass Flow, POSTEC Newsletter, No 17, 1999
Enstad, 2007 G.G. Enstad, M. Wojcik, J. Hartl, J. Ooi, M. Rotter and S. Ding, Experimental
Investigation of the Flow Pattern and Wall Pressure Distribution in a Silo with a
Double-Cone Insert, Part. Part. Syst. Charact., Vol. 24, 2007
Enstad, 2008 Personal Interview with Professor G. Enstad, Norway, August 2008
Farnish, 2000 Farnish RJ, Bradley MSA, Pittman AN: The Effect of Dispensing Head Design
on Reliability and Consistency of Flow Rates During Discharge Operations,
Trans IMechE 2000-3, 2000
Hartl, 2008 J. Hartl, J. Ooi and G. Enstad, An Experimental Study of Cone-in-Cone Insert
Configurations in a Full-Scale Silo, Proceedings of RELPOFLOW IV, 2008

49
Jenike, 20081 Jenike & Johanson Inc., Binsert Retrofit Solves Segregation Problems at Owens-
Brockway Glass,
http://www.jenikeandjohanson.com/pages/education/cases/glass_batch_case/glas
s_batch.html, 2008
Jenike, 20082 Jenike & Johanson Inc., Binsert Systems Prevents Flow Problems at Chino
Smelter Modernization Project,
http://jenike.net/pages/education/cases/pdf_docs/22jjcase.pdf, 2008
Johanson, 1964 J. Johanson, Stress and Velocity Fields in Gravity Flow of Bulk Solids, Journal
of Applied Mechanics, Vol 31, Trans. ASME, Vol 86, Series E, 1964
Johanson, 1965 J.R. Johanson, The Use of Flow-Corrective Inserts in Bins, J. Eng. Ind., Paper
No. 65-MH-1, 1965
Johanson, 1966 J.R. Johanson and W.K. Kleysteuber, Flow Corrective Inserts in Bins, Chemical
Engineering Progress, Vol 62, No 11, 1966
Johanson, 1968 J.R. Johanson, The Placement of Inserts to Correct Flow in Bins, Powder
Technology, Vol. 1, 1968
Johanson, 1981 J.R. Johanson, Blending apparatus for Bulk Solids, United States Patent
4,286,883, 1981
Karlsen, 1998 A. Karlsen, Use of Inserts for Controlling the Flow Pattern in Silos, Telemark
College, Dep of Technology, Final Year Project, 1998
Klonteig, 1997 J. Klonteig, Control of Flow Patterns in Silos by Means of Internal Structures
Placed in the Hopper. Telemark College, Dep of Technology, Final Year Project,
1997
McGee, 2001 E. McGee, P. Marjanovic and L. Bates, Improving Flow from Hoppers Using
Inserts and Novel Wall Profiles, Bulk Materials Storage, Handling and
Transportation, Conference Proceedings, Vol 1, 2001
Nedderman, 1992 Nedderman, Statics and Kinematics of Granular Materials, Cambridge
University Press, 1992.
Schulze, 2008 D. Schulze, Stresses in Silos, http://www.dietmar-schulze.de/fre.html, 2008
Schuricht, 2001 T. Schuricht, C. Furll and G. Enstad, Full Scale Silo Tests and Numerical
Simulation of the Cone In Cone Concept for Mass Flow, Handbook of
Conveying and Handling of Particulate Solids, Levy and Kalman (Eds), 2001
Schuricht, 2008 T. Schuricht, C. Furll and G. Enstad, Experimental and Calculated loads on Cone
in Cone Inserts, Proceedings of RELPOFLOW IV, 2008
Strusch, 1994 J. Strusch and J. Schwedes, The Use of Slice Element Methods for Calculating
Insert Load, Bulk Solids Handling, Vol 14, 1994
Strusch, 1998 J. Strusch and J. Schwedes, Wall Stress Distributions in Silos with Inserts and
Loads on Inserts, in: Silos: Fundamentals of Theory, Behaviour and Design,
Brown and Nielsen (Eds), 1998
Tuzun, 19851 U. Tuzun, R.M. Nedderman, Gravity Flow of Granular Material Round
Obstacles I, Chemical Engineering Science, Vol 40, 1985
Tuzun, 19852 U. Tuzun, R.M. Nedderman, Gravity Flow of Granular Material Round
Obstacles II, Chemical Engineering Science, Vol 40, 1985
Wright, 2001 Wright, Paul K. (2001). 21st Century manufacturing. New Jersey: Prentice-Hall
Inc.
Xiao, 2008 G. Xiao, D. Xu and S. Ding, Numerical Simulation Study upon Granular
Materials Flow in Silos, Proceedings of RELPOFLOW IV, 2008
LIST OF FIGURES AND TABLES
Figure 1.1 Discharge Patterns 1
Figure 4.2 Common Shapes of Inserts 3

50
Figure 4.3 Greenwich Discharge Control Device 4
Figure 2.1 Schematic Design of the Initial Test Rig 5
Figure 2.2 Initial Test Rig 6
Figure 2.3 Inserts Vertical Position 7
Figure 2.4 Measurements of the Vertical Load Acting on the Large Insert 8
Figure 2.5 Measurements of the Vertical Load Acting on the Small Insert 9
Figure 2.6 Discharging Process Stages 9
Figure 2.7 Original and Modified Rig 12
Figure 2.8 Region Influenced by the Insert 13
Figure 2.9 Modified Method 14
Figure 2.10 Insert Support Device 14
Figure 2.11 Tracer Positioning Tool 15
Figure 2.12 Tracer Detection Device 15
Figure 2.13 Horizontal Tracer Location 16
Figure 2.14 Vertical Tracer Location 16
Figure 2.15 Bin Filling and Tracer Positioning Process 17
Figure 2.16 Additional Material Fed During Discharge 17
Figure 2.17 No Insert Results 18
Figure 2.18 Johanson‟s Insert Results 19
Figure 2.19 Modified Insert Results 20
Figure 2.20 Speed Zones in the Vicinity of the Insert 21
Figure 2.21 No Insert Results 21
Figure 2.22 Johanson‟s Insert Results 22
Figure 2.23 Modified Insert Results 23
Figure 2.24 Comparison of Vertical Loads on the Cylindrical Section of the Rig 23
Figure 2.25 Comparison of Vertical Loads on the Inserts 24
Figure 3.1 Test Rig for Insert Development 26
Figure 3.2 Vertical Sections Employed 27
Figure 3.3 Additional Converging Section and Impact Plate 27
Figure 3.4 Model Inverted Cones 28
Figure 3.5 Open Double Cone 29
Figure 3.6 Open Double Cone First Generation 30
Figure 3.7 Open Double Cone Second Generation 30
Figure 3.8 Open Double Cone Third Generation 31
Figure 3.9 Open Double Cone First Generation 32
Figure 3.10 Open Double Cone First Generation 33
Figure 3.11 No Insert Results 34
Figure 3.12 Inverted Cone Results 34
Figure 3.13 Open Double Cone Second Generation Results 34
Figure 3.14 Open Double Cone Third Generation Results 35
Figure 3.15 Double Cone First Generation Results 35
Figure 3.16 Double Cone Second Generation Results 35
Figure 3.17 Instantaneous Discharge Rate Comparison 36
Figure 4.1 Case Study Silo 38
Figure 4.2 Vacuum Formed Model and Mould 38
Figure 4.3 Half Silo Test Rig 39
Figure 4.4 Half Silo Discharge Results 39
Figure 4.5 Half Silo Modification 40
Figure 4.6 Test Rig Set Up 40
Figure 4.7 Flat Plate 41
Figure 4.8 Shapes and Lengths of the Conical Extensions 42
Figure 4.9 Optimal Conical Section Results 42
Figure 4.10 Open Trouser Leg Insert 43
Figure 4.11 Trouser Leg Insert Results 43
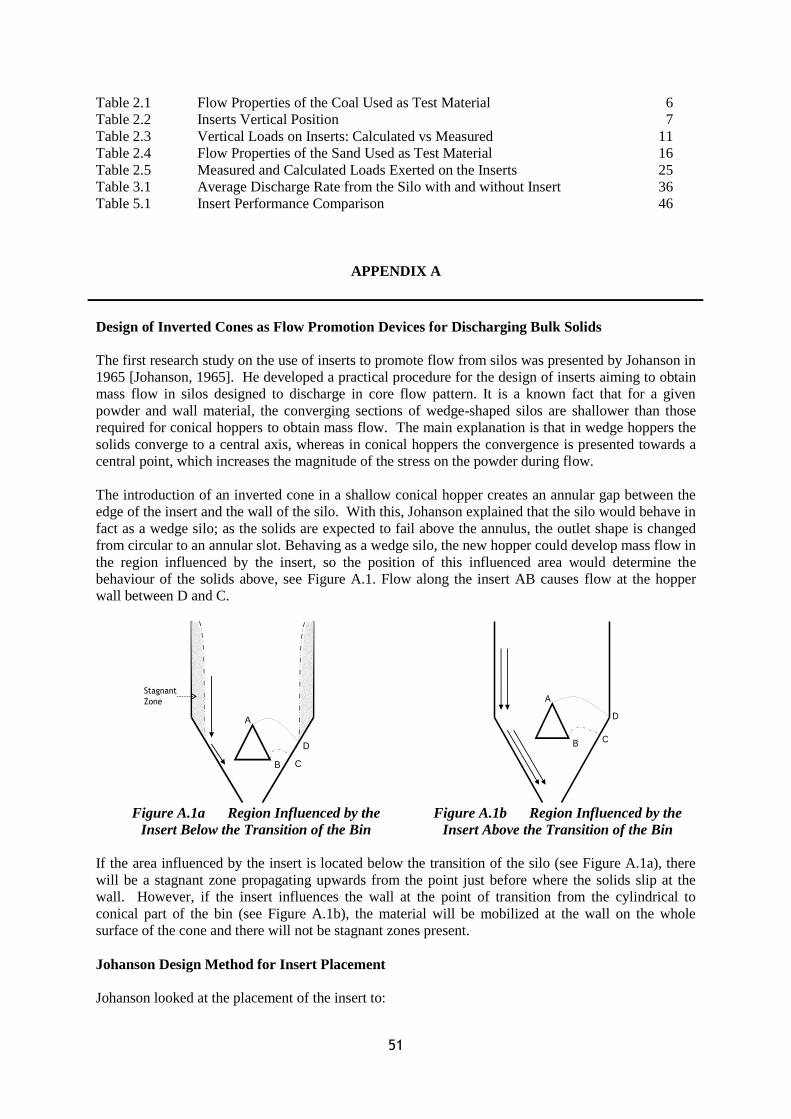
51
Table 2.1 Flow Properties of the Coal Used as Test Material 6
Table 2.2 Inserts Vertical Position 7
Table 2.3 Vertical Loads on Inserts: Calculated vs Measured 11
Table 2.4 Flow Properties of the Sand Used as Test Material 16
Table 2.5 Measured and Calculated Loads Exerted on the Inserts 25
Table 3.1 Average Discharge Rate from the Silo with and without Insert 36
Table 5.1 Insert Performance Comparison 46
APPENDIX A
Design of Inverted Cones as Flow Promotion Devices for Discharging Bulk Solids
The first research study on the use of inserts to promote flow from silos was presented by Johanson in
1965 [Johanson, 1965]. He developed a practical procedure for the design of inserts aiming to obtain
mass flow in silos designed to discharge in core flow pattern. It is a known fact that for a given
powder and wall material, the converging sections of wedge-shaped silos are shallower than those
required for conical hoppers to obtain mass flow. The main explanation is that in wedge hoppers the
solids converge to a central axis, whereas in conical hoppers the convergence is presented towards a
central point, which increases the magnitude of the stress on the powder during flow.
The introduction of an inverted cone in a shallow conical hopper creates an annular gap between the
edge of the insert and the wall of the silo. With this, Johanson explained that the silo would behave in
fact as a wedge silo; as the solids are expected to fail above the annulus, the outlet shape is changed
from circular to an annular slot. Behaving as a wedge silo, the new hopper could develop mass flow in
the region influenced by the insert, so the position of this influenced area would determine the
behaviour of the solids above, see Figure A.1. Flow along the insert AB causes flow at the hopper
wall between D and C.
Figure A.1a Region Influenced by the
Insert Below the Transition of the Bin
Figure A.1b Region Influenced by the
Insert Above the Transition of the Bin
If the area influenced by the insert is located below the transition of the silo (see Figure A.1a), there
will be a stagnant zone propagating upwards from the point just before where the solids slip at the
wall. However, if the insert influences the wall at the point of transition from the cylindrical to
conical part of the bin (see Figure A.1b), the material will be mobilized at the wall on the whole
surface of the cone and there will not be stagnant zones present.
Johanson Design Method for Insert Placement
Johanson looked at the placement of the insert to:
A
B C
D
A
B C
D
Stagnant
Zone
A
B C
D
A
B C
D
Stagnant
Zone

52
Optimize the length of wall over which the insert influences flow pattern CD (determined
from ratio W/R, annulus width / insert radius).
Calculate the location of the point at which flow starts on the hopper wall (Point D),
determined by ψ (principal stress trajectory).
In order to simplify the solution of the stress field, Johanson assumes that the bin with the inserts
behaves as a wedge-shaped hopper, as mentioned above. Then the stress field is approximated to the
radial stress field proposed by Jenike [Johanson, 1964; Nedderman, 1992] for wedge-shaped hoppers.
Using this approximation, Johanson calculated a critical ratio W/R (annulus width / insert radius) and
presented the results in a graphical form, see Figure A.2.
Figure A.2 Approximate Critical W/R for Inserts and Hoppers with the Same Slope;
Johanson [Johanson, 1965]
The results presented in Figure A.2 were obtained assuming a symmetric, wedge-shaped hopper, and
hence these results are only applicable when the insert and the hopper have the same half angle.
However, Johanson found experimentally that the “critical W/R-values are essentially independent of
the slope of the insert. Thus, Figure A.2 gives acceptable values for any half angle of the insert.
Johanson calculated the location of the point D, then defined ψ as the angle between the line AD and
the wall of the insert and presented values of ψ in terms of the effective angle of internal friction of
the bulk solid (δ), the half angle of the hopper (α2) and the half angle of the insert (α1), see Figure A.3.

53
Figure A.3 Approximate Angle ψ to Determine Limit of Flow Along Hopper Walls;
Johanson [Johanson, 1965]
As with the W/R ratio, the results for the angle ψ were obtained for symmetrical, wedge-shaped
hoppers and would be valid only when the hopper and the insert have the same slope, but again these
results seem to be valid for any slope angle of the insert wall.
With the information obtained above, Johanson developed the following design procedure to retrofit
inverted cones into existing silos performing in core flow pattern, see Figure A.4.
a. The first step consists of selecting the half angle (α2) of the insert. 30° is recommended for
most materials. However when cleanout is not necessary (i.e. for materials which are not time-
sensitive), a flat plate could be used instead. When the bin is discharging, material will build
up on the flat plate effectively forming an inverted cone. In this case for design purposes, the
angle α2 is calculated as:
(A.1)
b. To continue to the next step, the flow properties of the bulk solid must be known. If that is not
the case the effective angle of internal friction (δ) and the wall friction angle (υ) between the
bulk solid and the material of the hopper wall have to be measured.
c. Once the flow properties are known, the values for the critical W/R ratio and angle ψ can be
obtained from Figures A.2 and A.3 respectively.
d. Make a scale drawing of the existing silo.
e. Draw a line from the transition of the silo at an angle π/2 – ψ – α2 from the horizontal until it
intersects the central axis of the hopper (see Figure A.4, line DA). This intersection (point A)
represents the apex of the inverted cone.
f. Draw a line from the apex of the hopper at angle η from the vertical, such as:
(A.2)
g. This line represents the critical ratio W/R (see Figure A.4, line EF).
h. Draw a line from the apex of the inverted cone at an angle α2 from the vertical, until it
intersects the critical W/R line (see Figure A.4, line AB). The intersection point (point B)
represents the bottom of the insert; thus the size and location of the insert are determined.
However, it may be desirable to make a 10% reduction on the critical W/R value as a factor of
safety.
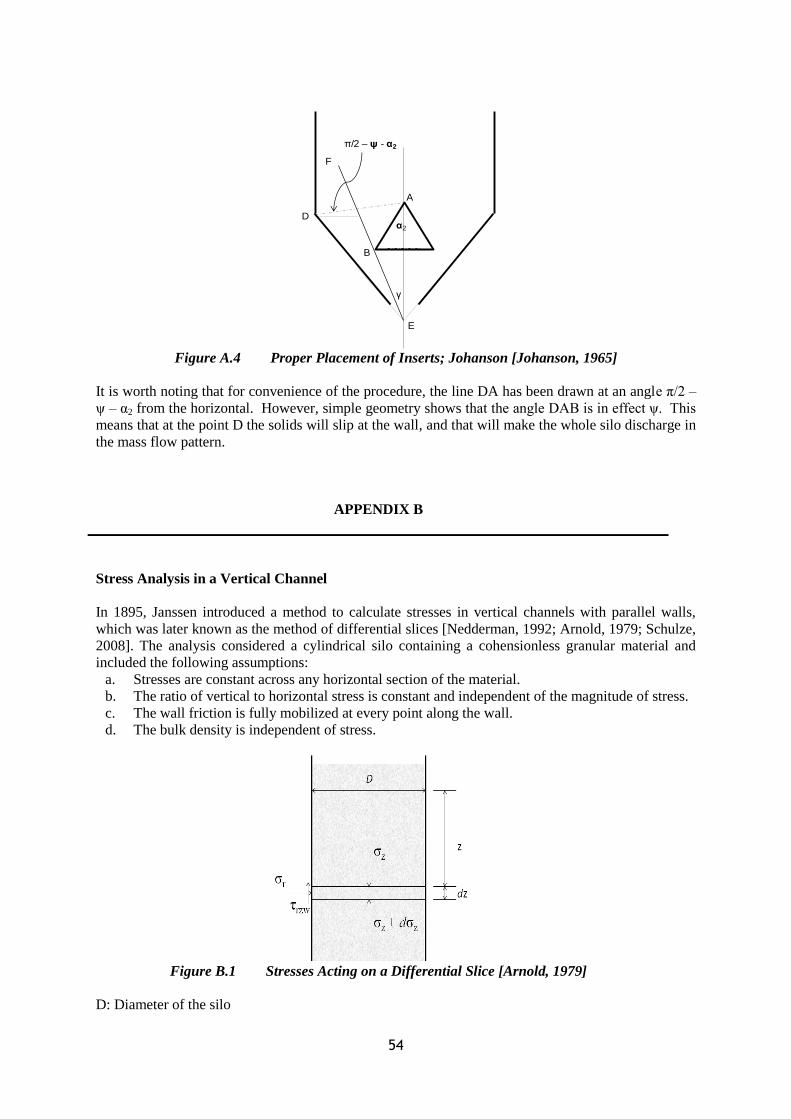
54
Figure A.4 Proper Placement of Inserts; Johanson [Johanson, 1965]
It is worth noting that for convenience of the procedure, the line DA has been drawn at an angle π/2 –
ψ – α2 from the horizontal. However, simple geometry shows that the angle DAB is in effect ψ. This
means that at the point D the solids will slip at the wall, and that will make the whole silo discharge in
the mass flow pattern.
APPENDIX B
Stress Analysis in a Vertical Channel
In 1895, Janssen introduced a method to calculate stresses in vertical channels with parallel walls,
which was later known as the method of differential slices [Nedderman, 1992; Arnold, 1979; Schulze,
2008]. The analysis considered a cylindrical silo containing a cohensionless granular material and
included the following assumptions:
a. Stresses are constant across any horizontal section of the material.
b. The ratio of vertical to horizontal stress is constant and independent of the magnitude of stress.
c. The wall friction is fully mobilized at every point along the wall.
d. The bulk density is independent of stress.
Figure B.1 Stresses Acting on a Differential Slice [Arnold, 1979]
D: Diameter of the silo
α2
F
E
γ
D
π/2 – ψ - α2
A
B
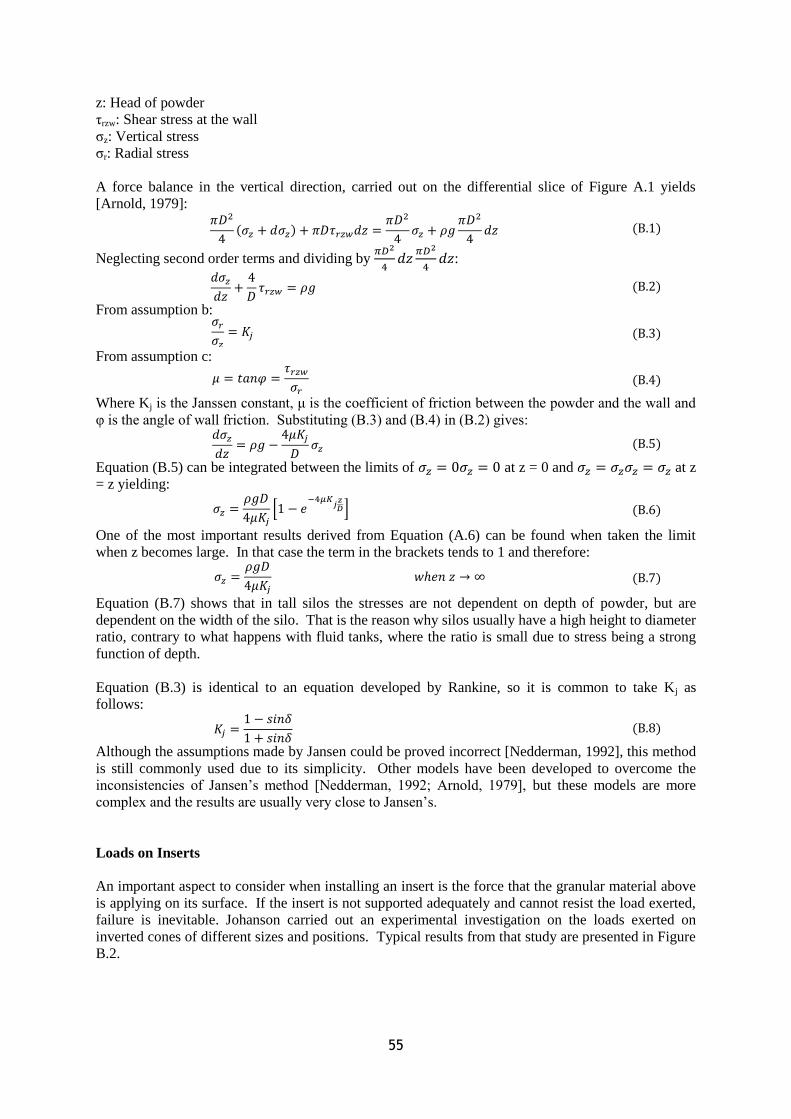
55
z: Head of powder
τrzw: Shear stress at the wall
σz: Vertical stress
σr: Radial stress
A force balance in the vertical direction, carried out on the differential slice of Figure A.1 yields
[Arnold, 1979]:
(B.1)
Neglecting second order terms and dividing by
:
(B.2)
From assumption b:
(B.3)
From assumption c:
(B.4)
Where Kj is the Janssen constant, μ is the coefficient of friction between the powder and the wall and
υ is the angle of wall friction. Substituting (B.3) and (B.4) in (B.2) gives:
(B.5)
Equation (B.5) can be integrated between the limits of at z = 0 and at z
= z yielding:
(B.6)
One of the most important results derived from Equation (A.6) can be found when taken the limit
when z becomes large. In that case the term in the brackets tends to 1 and therefore:
(B.7)
Equation (B.7) shows that in tall silos the stresses are not dependent on depth of powder, but are
dependent on the width of the silo. That is the reason why silos usually have a high height to diameter
ratio, contrary to what happens with fluid tanks, where the ratio is small due to stress being a strong
function of depth.
Equation (B.3) is identical to an equation developed by Rankine, so it is common to take Kj as
follows:
(B.8)
Although the assumptions made by Jansen could be proved incorrect [Nedderman, 1992], this method
is still commonly used due to its simplicity. Other models have been developed to overcome the
inconsistencies of Jansen‟s method [Nedderman, 1992; Arnold, 1979], but these models are more
complex and the results are usually very close to Jansen‟s.
Loads on Inserts
An important aspect to consider when installing an insert is the force that the granular material above
is applying on its surface. If the insert is not supported adequately and cannot resist the load exerted,
failure is inevitable. Johanson carried out an experimental investigation on the loads exerted on
inverted cones of different sizes and positions. Typical results from that study are presented in Figure
B.2.
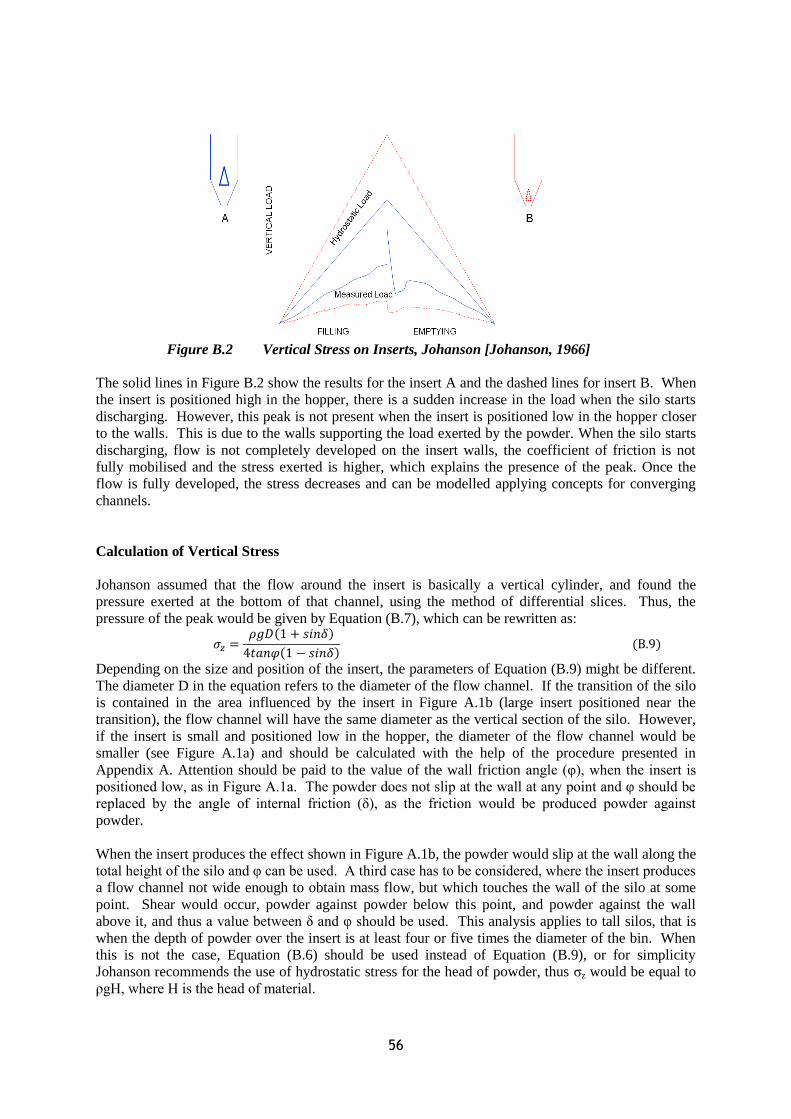
56
Figure B.2 Vertical Stress on Inserts, Johanson [Johanson, 1966]
The solid lines in Figure B.2 show the results for the insert A and the dashed lines for insert B. When
the insert is positioned high in the hopper, there is a sudden increase in the load when the silo starts
discharging. However, this peak is not present when the insert is positioned low in the hopper closer
to the walls. This is due to the walls supporting the load exerted by the powder. When the silo starts
discharging, flow is not completely developed on the insert walls, the coefficient of friction is not
fully mobilised and the stress exerted is higher, which explains the presence of the peak. Once the
flow is fully developed, the stress decreases and can be modelled applying concepts for converging
channels.
Calculation of Vertical Stress
Johanson assumed that the flow around the insert is basically a vertical cylinder, and found the
pressure exerted at the bottom of that channel, using the method of differential slices. Thus, the
pressure of the peak would be given by Equation (B.7), which can be rewritten as:
(B.9)
Depending on the size and position of the insert, the parameters of Equation (B.9) might be different.
The diameter D in the equation refers to the diameter of the flow channel. If the transition of the silo
is contained in the area influenced by the insert in Figure A.1b (large insert positioned near the
transition), the flow channel will have the same diameter as the vertical section of the silo. However,
if the insert is small and positioned low in the hopper, the diameter of the flow channel would be
smaller (see Figure A.1a) and should be calculated with the help of the procedure presented in
Appendix A. Attention should be paid to the value of the wall friction angle (υ), when the insert is
positioned low, as in Figure A.1a. The powder does not slip at the wall at any point and υ should be
replaced by the angle of internal friction (δ), as the friction would be produced powder against
powder.
When the insert produces the effect shown in Figure A.1b, the powder would slip at the wall along the
total height of the silo and υ can be used. A third case has to be considered, where the insert produces
a flow channel not wide enough to obtain mass flow, but which touches the wall of the silo at some
point. Shear would occur, powder against powder below this point, and powder against the wall
above it, and thus a value between δ and υ should be used. This analysis applies to tall silos, that is
when the depth of powder over the insert is at least four or five times the diameter of the bin. When
this is not the case, Equation (B.6) should be used instead of Equation (B.9), or for simplicity
Johanson recommends the use of hydrostatic stress for the head of powder, thus σz would be equal to
ρgH, where H is the head of material.

57
Calculation of Total Vertical Force
The total vertical force applied on the insert will be given by the vertical stress from Equation
(B.9) multiplied by the effective area of the insert. When the material is extremely free flowing, the
effective area will be a circle of radius r equal to the radius of the insert. However for less free
flowing materials, an arch would tend to form between the insert and the surrounding material, see
Figure B.3.
Figure B.3 Arching Effect Around the Insert, Johanson [Johanson, 1966]
Although the arch will probably fail, it causes the inserts to receive additional force. This effect is
obviously more notorious when the discharge starts. In Figure B.3, B represents the arching
dimension of the material, thus the effective area will be a circle of radius r plus half the arching
dimension.
LIST OF FIGURES IN APPENDICES
Figure A.1 Region Influenced by an Insert 51
Figure A.2 Approximate Critical W/R for Inserts and Hoppers with the Same Slope 52
Figure A.3 Approximate Angle ψ to Determine Limit of Flow Along Hopper Walls 53
Figure A.4 Proper Placement of Inserts 54
Figure B.1 Stresses Acting on a Differential Slice 54
Figure B.2 Vertical Stress on Inserts, Johanson 56
Figure B.3 Arching Effect Around the Insert 57
ANNEXES (COPY OF PUBLICATIONS)
58
REVIEW OF MODELS FOR PREDICTING THE DISCHARGE RATES
OF BULK PARTICULATES FROM SILOS AND BINS
K. Ariza-Zafra, R.J. Berry and M.S.A. Bradley
The Wolfson Centre for Bulk Solids Handling Technology,
University of Greenwich, Central Avenue,
Chatham Maritime, Kent ME4 4TB
Abstract – Various models for predicting discharge rates have been developed over the last four decades by many research workers (notably Nedderman, Carleton, Gu, Crewdson, Johanson, et al). In many cases these models offer comparable approaches to the prediction of discharge rates of bulk particulates from storage equipment when solely gravity is acting to initiate flow (since they invariably consider the use of mass-flow design equipment). The models that have been developed consider a wide range of bulk particulates (coarse, incompressible, fine, cohesive) and most contemporary works have incorporated validation against test programmes. Research currently underway at The Wolfson Centre for Bulk Solids Handling Technology, University of Greenwich, has considered the relative performance of these models with respect to a range of bulk properties and with particular focus upon the flexibility of the models to cater for different geometrical factors for vessels. 1. DISCHARGE RATE PREDICTION 1.1 Beverloo One of the first models that produced some level of success predicting the discharge rate of
bulk solids from bins was developed by Beverloo et al in 1961. He assumed that the flow
rate (W) was a function of the bulk density of the solids ( ), the orifice diameter (Do) and
the gravitational acceleration (g) and later found it was function of the particle diameter as
well; with this he derivated the following equation for the flow rate
25
)5.1(58.0 dDgW o (1)
However, this equation is only applicable for flat bottom silos with circular orifice and core
flow hoppers, for that reason some modifications have been made to allow this equation to be
used in a wider range of hopper configurations.
Beverloo‟s analysis has been combined with work previously undertaken by Rose and
Tanaka (1956) [1] and Fowler and Glastonbury (1959). With the help of the work by Rose
and Tanaka, the influence of the geometry of the converging section of a silo was introduced
to the Beverloo equation as they stated that the mass flow rate as a function of the hopper half
angle ( ) and the angle between the stagnant zone boundary and the horizontal ( d ) when
< 90 - d , then,
),( dB FWW (2)
59
),( dF = 1 for > 90 - d 35.0)(),( dd TanTanF for < 90 - d
d must be determined experimentally but 45° could be used in absence of data.
The work by Fowler and Glastonbury relates the mass flow rate to the shape of the orifice,
such that hopper shapes other than cylindrical can be evaluated. From non-circular orifices
probably the most important would be a oD x L slot orifice for which the modification would
yield
2/3)5.1)(5.1(03.1 dDdLgW o (3)
1.2 Johanson One of the first theoretical developments aiming to predict the discharge rate from bins was undertaken by Johanson [2] in the mid-sixties. In his work Johanson presents an equation for the maximum discharge rate for a bulk material as a function of the hopper shape, the opening size and the flow properties of the material. To derivate the discharge rate equation the material was assumed to be a frictional and cohesive granular solid that flows continuously without any significant density change. This material forms a continuous failing arch at the hopper outlet that is in dynamic equilibrium (the arch is caused to fail by the pressure in the flowing mass near the hopper opening which can be calculated). Johanson carried out an energy balance on the dynamic arch and related the forces acting on the arch to the unconfined yield strength fc of the material, obtaining the definition of actual flow factor ffa, critical flow factor ff and the dependency of fc on the major consolidating pressure, the following equation for the flow rate
(4)
Where m = 0 for a slotted opening, m = 1 for a circular opening. The pressure at the hopper outlet ( o ) can be calculated from
(5) To calculate the discharge rate first determine ff value for the hopper, then calculate o and finally determine ffa. This can be applied to flat bottom bins using the angle of approach in place of . 1.3 Brown and Richards In 1960 Brown and Richards [3] presented a piece of work that intended to predict the discharge rate of granules through different kinds of apertures. It is here, that the concept of the empty annulus is presented. This theory states that there is an annulus of width k/2 adjacent to the edge of the aperture, through which no flow takes place. The width of the annulus does not depend on either aperture size or shape. It was found that k was dependent
a
o
m
o
ff
ff
Tanm
gD
m
LmmDW
12)1(13
))1(()1(
ffm
Do
o
1
60
on particle size, decreasing from 1.7p to 0.7p as the size of the granules, where p is the mean projected area diameter; with this and using dimensional analysis they developed the following equations
For a circular orifice (6)
For a slot orifice (7)
Although these equations were presented before Beverloo‟s, it was not this work that made their authors well known among the bulk solids community. In 1970 Brown and Richards [4] presented a theory called THE MINIMUM ENERGY THEOREM which was one of the first theoretical developments for the prediction of discharge rate of bulk solids, this theory is still a common reference point for researchers round the world. Its development is based on a polar coordinates system (R, ) using an origin coincident with the apex of the converging section of the bin (actually it would coincide with the apex of a cone with the same half angle of the converging section but contained in the region (D-k) smaller than the outlet, based on the empty annulus concept), they carried out an energy balance and postulated that the gradient of T (total energy per unit mass of material) in the radial direction is zero on the free fall arch surface, which is a spherical surface of radius Ro spanning the orifice; with this they finally derivated the following expressions for the flow rate
For wedge hoppers (8)
For conical hoppers (9)
1.4 Carleton Carleton [5] carried out a force balance on the particles in the orifice region of a hopper, for that purpose, he stated that the forces acting on a particle as: equivalent inertial force due to the acceleration of the particle, gravity, fluid drag, inter-particle normal force and inter-particle shear force. To carry out the force balance, Carleton assumed that the bulk density is approximately constant and the flow is radial and continuous, from which an equation equivalent to the one proposed by Brown and Richards was obtained, as follows,
(10)
As the diameter of the particle decreases, the forces due to fluid-particle interaction become more significant and comparable with the gravitational forces, therefore this interaction should be quantified. To evaluate the fluid-drag force on the solids it was assumed that the particles were spherical and fell individually and unhindered by other particles, fluid density
2/5)(15
2kDogW s
2/3)(3
2kbgLW s
Sin
gDW o
2/5
8
sen
kDLgW o
2
2/32/12/1
2/3
2/52/12/1
24
cos1
sen
kDgW o

61
and viscosity values were independent of the presence of other particles, no bulk flow of fluid and that the fluid drag forces were the same as when the particles are moving at constant velocity. It is then postulated by Carleton, that the inertial forces and the fluid-drag forces are comparable only in the region where 2 < Re < 200, with Re being the Reynolds number for the particles. When Re > 200 internal forces are predominant and Eq (10) can be used, if Re < 2 the particles are so small that inertial forces can be neglected an the mass flow rate can calculated with the terminal velocity of the particles in the fluid. Thus, for 2 < Re < 200 the velocity of the particles can be obtained from the following equation and used to find the flow rate.
(11)
1.5 Crewdson The first theoretical approach to describe the effect of air-solid interaction when discharging bulk solids was made by Crewdson et al in 1977 [6]. Their case of study considered a fine cohesionless material discharging from a conical hopper, they assumed velocity of particles, voidage ( ) and stress ( ij ) to be functions of radial position only and worked based on the following hypothesis: “As the material moves through the hopper it is subjected to changing stress state and hence there will be a change in the voidage. Since the flow rates of air and powder are the same across all sections, the changing voidage will result in relative velocities which, from the Carman-Kozeny equation, will give a pressure gradient which is inversely proportional to the square of the particle diameter. The pressure gradient will therefore be very much greater for fine particles” Crewdson et al. [6]. Thus, they developed an expression to calculate the pressure gradient at any point in the hopper:
(12)
(13)
(14)
(15)
(16) Then to provide a model for flow rate they modified the Beverloo equation adding a term accounting for the force due to the interstitial pressure gradient, thus, evaluating Eq (12) at the orifice the flow rate could be calculated solving Eq (17)
(17)
gd
V
D
SinV ff
o
3/5
3/43/23/12 154
2
2
)cos1(2
)1(
ln
)1(
2
)1(
3
ln1)1(
)(
o
o
o
c
oo
oc
oo
oc
occ
ccc
d
K
RRc
b
a
R
R
Rac
baWc
dR
dP
25
21
1kdD
dR
dPgBW o
RR o
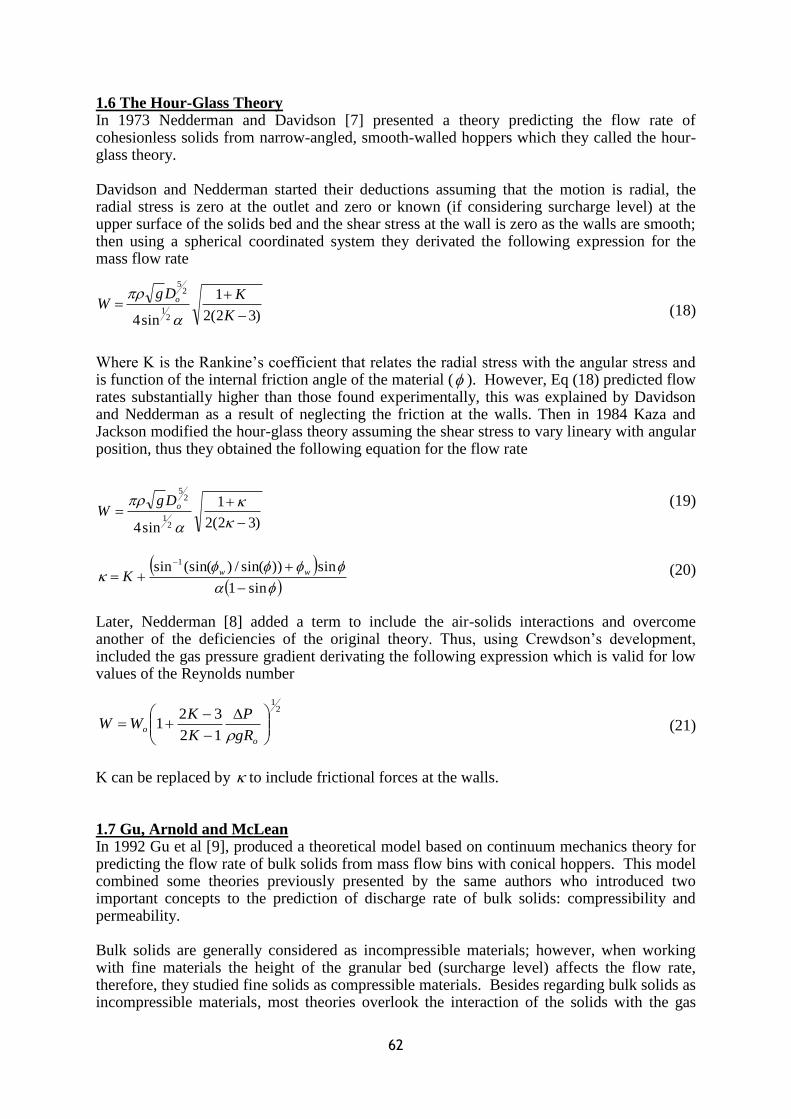
62
1.6 The Hour-Glass Theory In 1973 Nedderman and Davidson [7] presented a theory predicting the flow rate of cohesionless solids from narrow-angled, smooth-walled hoppers which they called the hour-glass theory. Davidson and Nedderman started their deductions assuming that the motion is radial, the radial stress is zero at the outlet and zero or known (if considering surcharge level) at the upper surface of the solids bed and the shear stress at the wall is zero as the walls are smooth; then using a spherical coordinated system they derivated the following expression for the mass flow rate
(18) Where K is the Rankine‟s coefficient that relates the radial stress with the angular stress and is function of the internal friction angle of the material ( ). However, Eq (18) predicted flow rates substantially higher than those found experimentally, this was explained by Davidson and Nedderman as a result of neglecting the friction at the walls. Then in 1984 Kaza and Jackson modified the hour-glass theory assuming the shear stress to vary lineary with angular position, thus they obtained the following equation for the flow rate
(19)
(20)
Later, Nedderman [8] added a term to include the air-solids interactions and overcome another of the deficiencies of the original theory. Thus, using Crewdson‟s development, included the gas pressure gradient derivating the following expression which is valid for low values of the Reynolds number
(21) K can be replaced by to include frictional forces at the walls. 1.7 Gu, Arnold and McLean In 1992 Gu et al [9], produced a theoretical model based on continuum mechanics theory for predicting the flow rate of bulk solids from mass flow bins with conical hoppers. This model combined some theories previously presented by the same authors who introduced two important concepts to the prediction of discharge rate of bulk solids: compressibility and permeability. Bulk solids are generally considered as incompressible materials; however, when working with fine materials the height of the granular bed (surcharge level) affects the flow rate, therefore, they studied fine solids as compressible materials. Besides regarding bulk solids as incompressible materials, most theories overlook the interaction of the solids with the gas
)32(2
1
sin4 21
25
K
KDgW o
)32(2
1
sin4 21
25
oDgW
sin1
sin))sin(/)(sin(sin 1
wwK
21
12
321
o
ogR
P
K
KWW
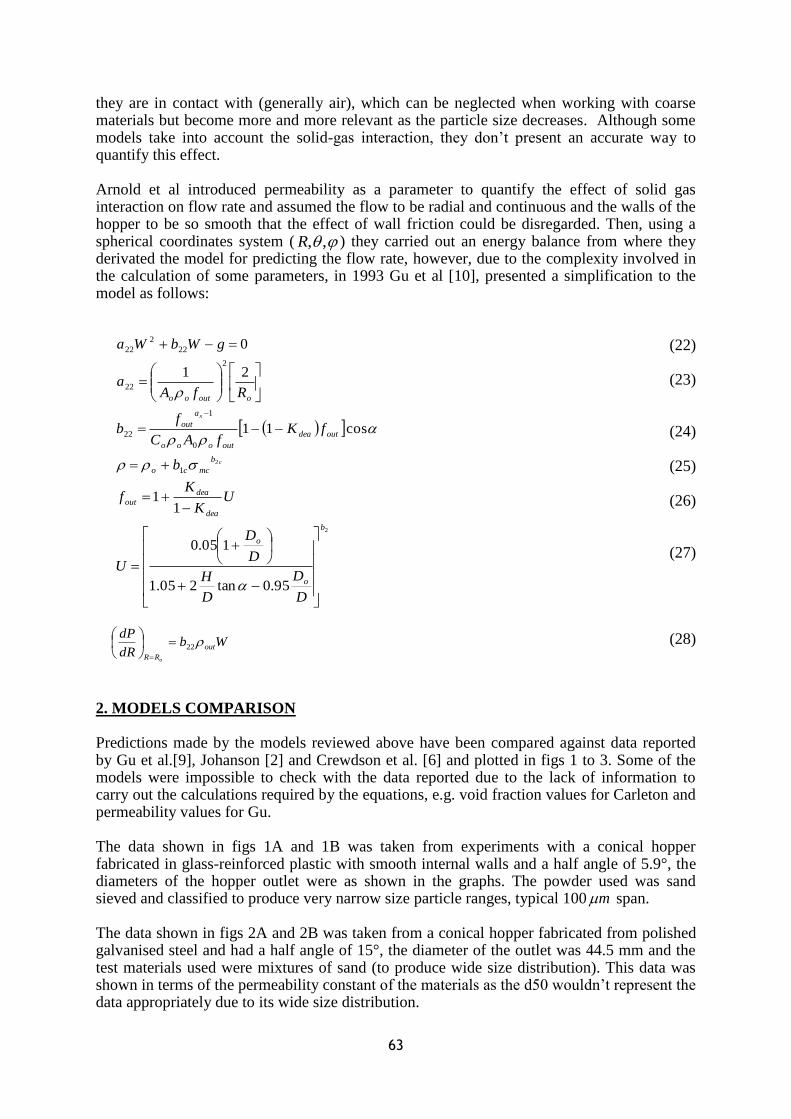
63
they are in contact with (generally air), which can be neglected when working with coarse materials but become more and more relevant as the particle size decreases. Although some models take into account the solid-gas interaction, they don‟t present an accurate way to quantify this effect. Arnold et al introduced permeability as a parameter to quantify the effect of solid gas interaction on flow rate and assumed the flow to be radial and continuous and the walls of the hopper to be so smooth that the effect of wall friction could be disregarded. Then, using a spherical coordinates system ( ,,R ) they carried out an energy balance from where they derivated the model for predicting the flow rate, however, due to the complexity involved in the calculation of some parameters, in 1993 Gu et al [10], presented a simplification to the model as follows:
(22)
(23)
(24)
(25)
(26)
(27)
(28)
2. MODELS COMPARISON Predictions made by the models reviewed above have been compared against data reported by Gu et al.[9], Johanson [2] and Crewdson et al. [6] and plotted in figs 1 to 3. Some of the models were impossible to check with the data reported due to the lack of information to carry out the calculations required by the equations, e.g. void fraction values for Carleton and permeability values for Gu. The data shown in figs 1A and 1B was taken from experiments with a conical hopper fabricated in glass-reinforced plastic with smooth internal walls and a half angle of 5.9°, the diameters of the hopper outlet were as shown in the graphs. The powder used was sand sieved and classified to produce very narrow size particle ranges, typical 100 m span. The data shown in figs 2A and 2B was taken from a conical hopper fabricated from polished galvanised steel and had a half angle of 15°, the diameter of the outlet was 44.5 mm and the test materials used were mixtures of sand (to produce wide size distribution). This data was shown in terms of the permeability constant of the materials as the d50 wouldn‟t represent the data appropriately due to its wide size distribution.
2
2
95.0tan205.1
105.0
11
cos11
21
0
1
0
1
22
2
22
22
2
22
b
o
o
dea
dea
out
b
mcco
outdea
outooo
a
out
ooutoo
D
D
D
H
D
D
U
UK
Kf
b
fKfAC
fb
RfAa
gWbWa
c
x
WbdR
dPout
RR o
22
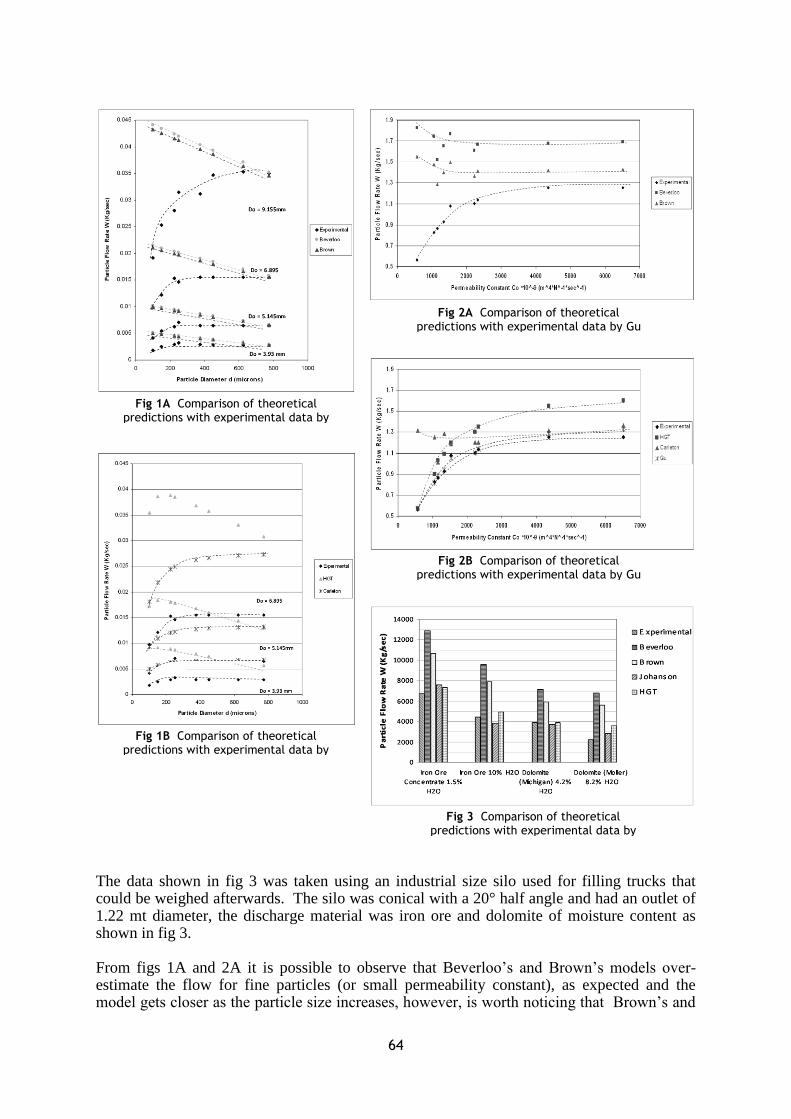
64
The data shown in fig 3 was taken using an industrial size silo used for filling trucks that could be weighed afterwards. The silo was conical with a 20° half angle and had an outlet of 1.22 mt diameter, the discharge material was iron ore and dolomite of moisture content as shown in fig 3. From figs 1A and 2A it is possible to observe that Beverloo‟s and Brown‟s models over-estimate the flow for fine particles (or small permeability constant), as expected and the model gets closer as the particle size increases, however, is worth noticing that Brown‟s and
Fig 1A Comparison of theoretical predictions with experimental data by
Crewdson
Fig 1B Comparison of theoretical predictions with experimental data by
Crewdson
Fig 2A Comparison of theoretical predictions with experimental data by Gu
et al.
Fig 2B Comparison of theoretical predictions with experimental data by Gu
et al.
Fig 3 Comparison of theoretical predictions with experimental data by
Johanson

65
Beverloo‟s predictions differ by 15% in fig 2A and just 2% in fig 1A, this is due to the fact that as the hopper becomes steeper the closer the dimensionless factor of these equations become (which is the only difference between them). It wasn‟t possible to apply Johanson‟s model to the data obtained by the others authors, however for the data that he obtained his model fitted reasonably well giving average error of 15%. The hour-glass theory (modified for wall friction) also produced a reasonable prediction giving an average error of 16%. The hour-glass theory didn‟t produce good predictions with the data from fig 1B and although the tendency of the model might be similar to that of the experimental results, the flows predicted were far larger than those found experimentally (between 100% and 200% for fig 1B). This is not surprising as the hopper was extremely narrow and thus the wall effects become very significant even if the walls are thought to be smooth, and it wasn‟t possible to include the wall effects in the model as there was no wall friction data available. From fig 1B it is possible to see that Carleton‟s model over-estimates the flow rate values, this is due to the same issue of vessel proportions as explained for the hour-glass theory. There is another reason that could explain these results and it is that Carleton assumed that the particles would flow individually and unhindered which would make the material internal friction “zero” – which is considered to be a significant flaw in the model. When looking at fig 2B it is possible to see that Carleton‟s predictions are far worse at low values of permeability constant and this is because this model is based on particle size and therefore it cannot be expected to produce good results where the particle distribution is wide for the test material. Probably the most complete model reviewed was the one presented by Gu et al. as it included factors that were neglected by other authors e.g. surcharge level. The effect of these factors might be insignificant when predicting flow rate of coarse materials but they make the difference when working with fine solids. As it can be seen from fig 2B the model proposed by Gu fits the experimental data better than any of the other models. Probably the only deficiency found in this model is the assumption of smooth walls as the wall friction is not included in the deduction of the equation for flow rate. Although the results presented in fig 2B are good and the model consistent, its evaluation against different data is recommended, because with the data obtained in the experiments reviewed it was impossible to know the properties required to apply the model. 3. CONCLUDING REMARKS
An experimental silo to facilitate the measurement of the discharge rates of bulk
solids is under construction at the Wolfson Centre. The rig includes a novel discharge
device that allows the discharge rate to be controlled by adjusting the void pressure
within the flowing bulk solid.
To evaluate the effectiveness of this device, it is proposed that a series of tests to
measure discharge rates of a range of bulk solids from compressible fines to free
flowing incompressible coarse will be undertaken.
A review of the current models for the prediction of bulk solid discharge rates has
been undertaken, with a view to developing a new model based on the control of the
void pressure.

66
4. ACKNOWLEDGEMENTS The authors like to thank to The British Coal Utilisation Research Association (BCURA) for providing the financial support for this project. 5. NOMENCLATURE
d - Angle of approach - Internal friction angle
o - Stress at the outlet - Voidage
w - Wall friction angle - Bulk density of the material
f - Fluid density (Generally air)
f - Fluid viscosity (Generally air) - Hopper half angle
xa - Exponent used to relate permeability to consolidation stress
- Constants in bulk density equation
Co – Permeability constant d – Particle diameter Do – Diameter of outlet or width of a slit
orifice
fc – Unconfined yield strength ff – Flow factor of the material ffa – Actual flow factor of the material g – Acceleration of gravity H – Surcharge Level k – Parameter in the empty annulus theory K - Rankine‟s coefficient Kdea – Dynamic deaeration coefficient L – Length of a slit orifice m – Parameter defined in Eq.(x) P – Gas pressure R – Distance from the apex of the hopper Ro - Distance from the apex to the outlet of
the hopper V – Velocity of the solids W – Mass flow rate
6. REFERENCES
1. H. Rose and T. Tanaka, Rate of Discharge of Granular Materials from Bins and Hoppers,
The Engineer, pp. 465-469, Oct. 23, 1959. 2. J.R. Johanson, Method of Calculating Rate of Discharge from Hoppers and Bins, Society
of Mining Engineers, pp. 69-80, March 1965. 3. R. Brown and J. Richards, Profile of Flow of Granules Through Apertures, Trans. Instn
Chem. Engrs, Vol 38, 1960. 4. R. Brown and J. Richards, Principles of Powder Mechanics, Pergamon, 1970 5. A. J. Carleton, The Effect of Fluid-Drag Forces on the Discharge of Free-Flowing Solids
from Hoppers, Powder Technology, Vol. 6, pp. 91-96, 1972 6. B. Crewdson, A. Ormond and R Nedderman, Air-Impeded Discharge of Fine Particles
From a Hopper, Powder Technology, Vol. 16, pp.197-207, 1977 7. J. Davidson and R. Nedderman, The Hour-Glass Theory of Hopper Flow, Trans. Instn
Chem. Engrs, Vol. 51, 1973. 8. R. Nedderman, Statics and Kinematics of Granular Materials, Cambridge University
Press, 1992. 9. Z. Gu, P. Arnold and A. McLean, Prediction of the Flow Rate of Bulk Solids from Mass
Flow Bins with Conical Hoppers, Powder Technology, Vol. 72, pp. 157-166, 1992. 10. Z. Gu, P. Arnold and A. McLean, A Simplified Model for Predicting the Particle Flow
Rate from Mass Flow Bins, Powder Technology, Vol. 72, pp. 157-166, 1992.
cc bb 21 ,

67
Study of Discharge Behaviour in a Silo Retrofitted with Flow-Promoting Inserts K. Ariza-Zafra
1, R. Berry
1, M. Bradley
1, J. Santana
1
1The Wolfson Centre - University of Greenwich Chatham
Introduction Research has shown that the use of static inserts inside bunkers provides a simple and cost-effective retro-fit method to improve discharge [i,ii]. They consume no energy and have little to go wrong, compared with mechanical flow assistance devices, yet have been effective in promoting flow from bins with materials which would simply not discharge reliably without the insert. The intention of the work presented, is to evaluate the improvement brought about by retrofitting two different inverted cones in a bin with a shallow hopper. Materials and Equipment The test were undertaken in a axis-symmetrical silo comprising three main parts, a mild steel cylindrical section, a stainless steel conical hopper and a tracer detection system. The cylindrical section was 500 mm in diameter and 1500 mm in length, the conical section has a 30° half angle and 50 mm diameter outlet. The test material employed was sub-400 micron olivine sand, bulk density 1950 kg/m3, 39° internal friction angle, 25° wall friction angle (stainless steel) and 29° wall friction angle (mild steel). The flow properties were measured using an automated annular shear tester (Brookfield Powder Flow Tester). Two inverted cone inserts were evaluated, both of them were made of polished mild steel with a 30° half angle. Insert I - Johanson Method [iii] 1. Select the slope angle θ2 of the insert
a. Flat plate when clean up is not required b. θ2 = π/4 + δ/2, 30 deg for most materials
2. Obtain the critical W/R and α values from charts [iii] 3. Make an outline drawing of the existing bin. Fig 1.a 4. Draw line AB with slope angle π/2 – α – θ2 from the horizontal. Fig 1.a 5. Draw line CD (critical W/R line) at angle a from the vertical. Where a = tan
θ1/(1+W/R). Fig 1.a 6. Draw line BE at slope angle θ2. Point E locates the bottom of the insert. Fig 1b
Insert II – Modified Method 1. Repeat procedure for insert I. Fig 1.a and 1.b 2. Increase slope angle of line AB by 20%. Fig 1.c 3. Draw line BE at slope angle θ2 making coincide the bottom of insert II with the
bottom of insert I. Fig 1.c
a b c
Fig. 1. Insert Design Procedure
Flow Pattern Identification System Tracers (14 mm stainless steel ball bearings) were positioned in the silo according to Figs 2 and 3. Level B is located at a depth of 1730mm, level C at a depth of 1500mm (transition of the bin), level D at a depth of 1200mm, level E at a depth of 900mm,
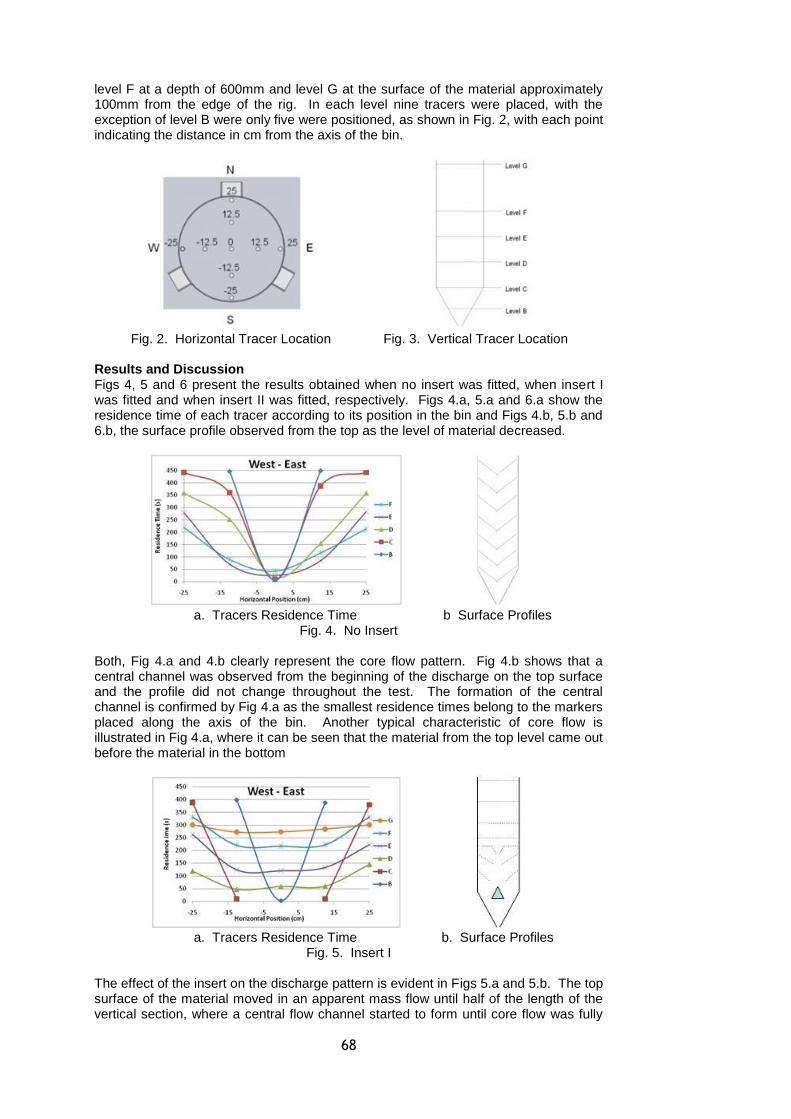
68
level F at a depth of 600mm and level G at the surface of the material approximately 100mm from the edge of the rig. In each level nine tracers were placed, with the exception of level B were only five were positioned, as shown in Fig. 2, with each point indicating the distance in cm from the axis of the bin.
Fig. 2. Horizontal Tracer Location Fig. 3. Vertical Tracer Location
Results and Discussion Figs 4, 5 and 6 present the results obtained when no insert was fitted, when insert I was fitted and when insert II was fitted, respectively. Figs 4.a, 5.a and 6.a show the residence time of each tracer according to its position in the bin and Figs 4.b, 5.b and 6.b, the surface profile observed from the top as the level of material decreased.
a. Tracers Residence Time b Surface Profiles
Fig. 4. No Insert Both, Fig 4.a and 4.b clearly represent the core flow pattern. Fig 4.b shows that a central channel was observed from the beginning of the discharge on the top surface and the profile did not change throughout the test. The formation of the central channel is confirmed by Fig 4.a as the smallest residence times belong to the markers placed along the axis of the bin. Another typical characteristic of core flow is illustrated in Fig 4.a, where it can be seen that the material from the top level came out before the material in the bottom
a. Tracers Residence Time b. Surface Profiles
Fig. 5. Insert I The effect of the insert on the discharge pattern is evident in Figs 5.a and 5.b. The top surface of the material moved in an apparent mass flow until half of the length of the vertical section, where a central flow channel started to form until core flow was fully
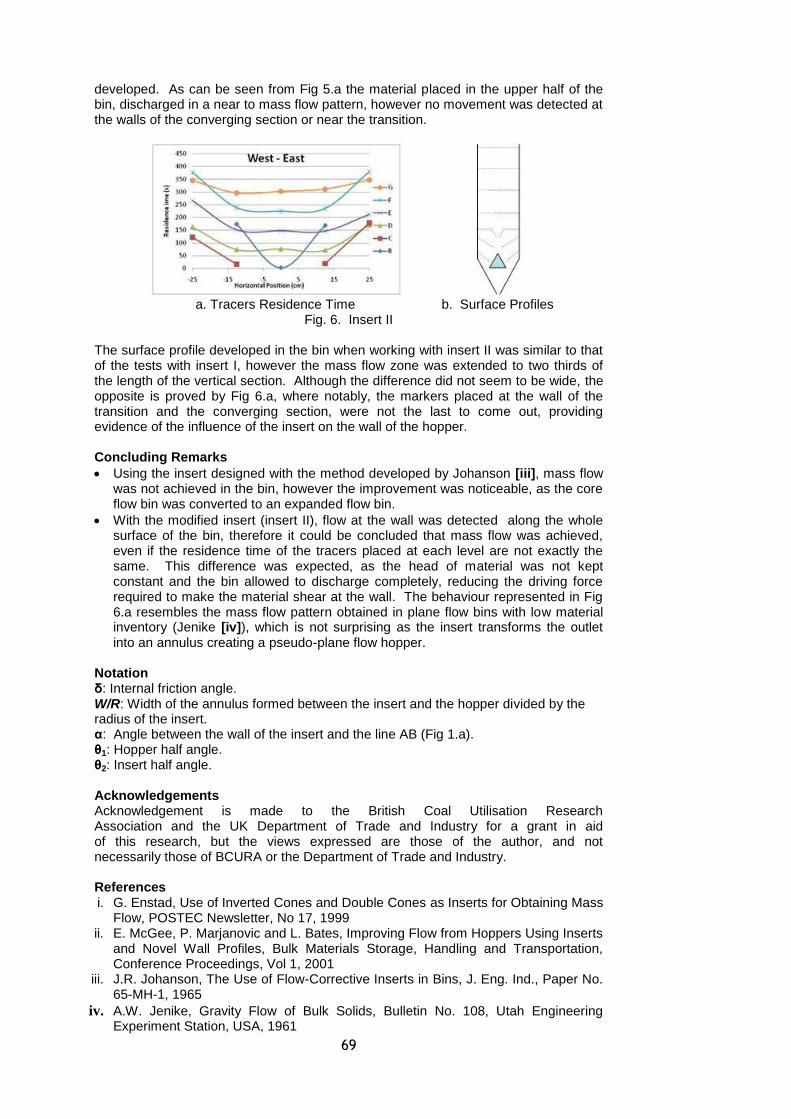
69
developed. As can be seen from Fig 5.a the material placed in the upper half of the bin, discharged in a near to mass flow pattern, however no movement was detected at the walls of the converging section or near the transition.
a. Tracers Residence Time b. Surface Profiles
Fig. 6. Insert II The surface profile developed in the bin when working with insert II was similar to that of the tests with insert I, however the mass flow zone was extended to two thirds of the length of the vertical section. Although the difference did not seem to be wide, the opposite is proved by Fig 6.a, where notably, the markers placed at the wall of the transition and the converging section, were not the last to come out, providing evidence of the influence of the insert on the wall of the hopper. Concluding Remarks
Using the insert designed with the method developed by Johanson [iii], mass flow was not achieved in the bin, however the improvement was noticeable, as the core flow bin was converted to an expanded flow bin.
With the modified insert (insert II), flow at the wall was detected along the whole surface of the bin, therefore it could be concluded that mass flow was achieved, even if the residence time of the tracers placed at each level are not exactly the same. This difference was expected, as the head of material was not kept constant and the bin allowed to discharge completely, reducing the driving force required to make the material shear at the wall. The behaviour represented in Fig 6.a resembles the mass flow pattern obtained in plane flow bins with low material inventory (Jenike [iv]), which is not surprising as the insert transforms the outlet into an annulus creating a pseudo-plane flow hopper.
Notation δ: Internal friction angle. W/R: Width of the annulus formed between the insert and the hopper divided by the radius of the insert. α: Angle between the wall of the insert and the line AB (Fig 1.a). θ1: Hopper half angle. θ2: Insert half angle. Acknowledgements Acknowledgement is made to the British Coal Utilisation Research Association and the UK Department of Trade and Industry for a grant in aid of this research, but the views expressed are those of the author, and not necessarily those of BCURA or the Department of Trade and Industry. References i. G. Enstad, Use of Inverted Cones and Double Cones as Inserts for Obtaining Mass
Flow, POSTEC Newsletter, No 17, 1999 ii. E. McGee, P. Marjanovic and L. Bates, Improving Flow from Hoppers Using Inserts
and Novel Wall Profiles, Bulk Materials Storage, Handling and Transportation, Conference Proceedings, Vol 1, 2001
iii. J.R. Johanson, The Use of Flow-Corrective Inserts in Bins, J. Eng. Ind., Paper No. 65-MH-1, 1965
iv. A.W. Jenike, Gravity Flow of Bulk Solids, Bulletin No. 108, Utah Engineering Experiment Station, USA, 1961
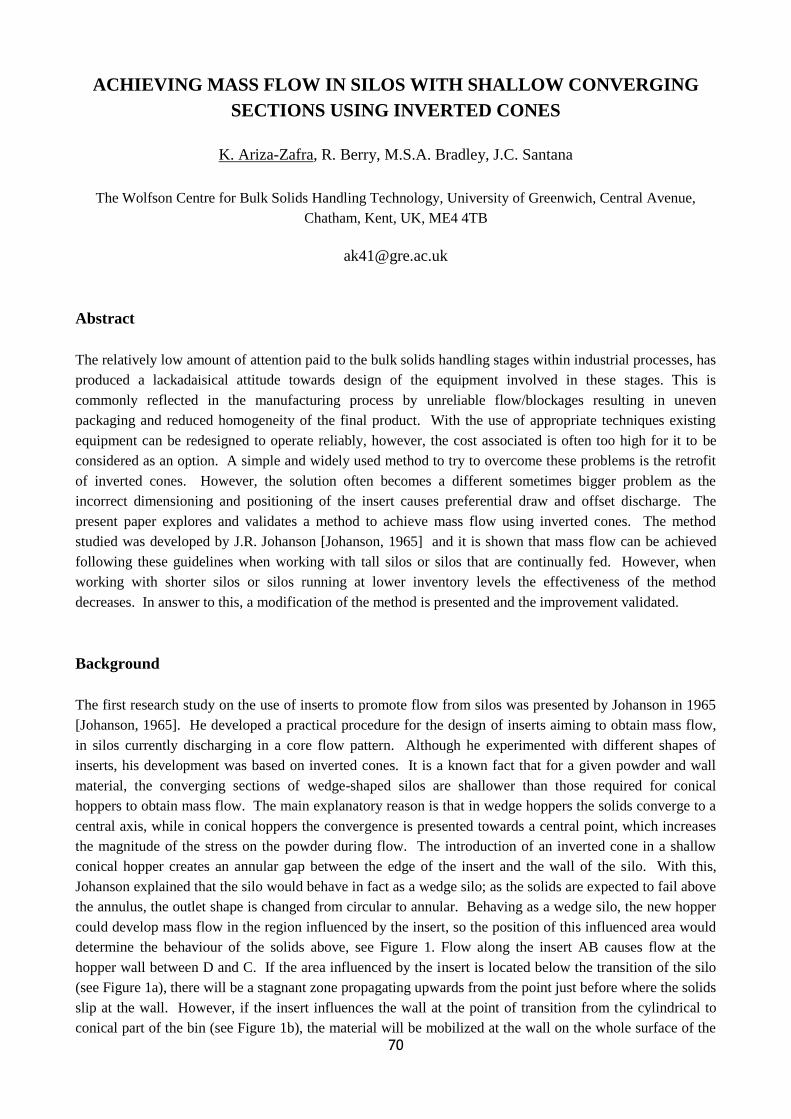
70
ACHIEVING MASS FLOW IN SILOS WITH SHALLOW CONVERGING
SECTIONS USING INVERTED CONES
K. Ariza-Zafra, R. Berry, M.S.A. Bradley, J.C. Santana
The Wolfson Centre for Bulk Solids Handling Technology, University of Greenwich, Central Avenue,
Chatham, Kent, UK, ME4 4TB
Abstract
The relatively low amount of attention paid to the bulk solids handling stages within industrial processes, has
produced a lackadaisical attitude towards design of the equipment involved in these stages. This is
commonly reflected in the manufacturing process by unreliable flow/blockages resulting in uneven
packaging and reduced homogeneity of the final product. With the use of appropriate techniques existing
equipment can be redesigned to operate reliably, however, the cost associated is often too high for it to be
considered as an option. A simple and widely used method to try to overcome these problems is the retrofit
of inverted cones. However, the solution often becomes a different sometimes bigger problem as the
incorrect dimensioning and positioning of the insert causes preferential draw and offset discharge. The
present paper explores and validates a method to achieve mass flow using inverted cones. The method
studied was developed by J.R. Johanson [Johanson, 1965] and it is shown that mass flow can be achieved
following these guidelines when working with tall silos or silos that are continually fed. However, when
working with shorter silos or silos running at lower inventory levels the effectiveness of the method
decreases. In answer to this, a modification of the method is presented and the improvement validated.
Background
The first research study on the use of inserts to promote flow from silos was presented by Johanson in 1965
[Johanson, 1965]. He developed a practical procedure for the design of inserts aiming to obtain mass flow,
in silos currently discharging in a core flow pattern. Although he experimented with different shapes of
inserts, his development was based on inverted cones. It is a known fact that for a given powder and wall
material, the converging sections of wedge-shaped silos are shallower than those required for conical
hoppers to obtain mass flow. The main explanatory reason is that in wedge hoppers the solids converge to a
central axis, while in conical hoppers the convergence is presented towards a central point, which increases
the magnitude of the stress on the powder during flow. The introduction of an inverted cone in a shallow
conical hopper creates an annular gap between the edge of the insert and the wall of the silo. With this,
Johanson explained that the silo would behave in fact as a wedge silo; as the solids are expected to fail above
the annulus, the outlet shape is changed from circular to annular. Behaving as a wedge silo, the new hopper
could develop mass flow in the region influenced by the insert, so the position of this influenced area would
determine the behaviour of the solids above, see Figure 1. Flow along the insert AB causes flow at the
hopper wall between D and C. If the area influenced by the insert is located below the transition of the silo
(see Figure 1a), there will be a stagnant zone propagating upwards from the point just before where the solids
slip at the wall. However, if the insert influences the wall at the point of transition from the cylindrical to
conical part of the bin (see Figure 1b), the material will be mobilized at the wall on the whole surface of the

71
cone and there will not be stagnant zones present. In addition to this, if the insert is too small, the lines AD
and BC will intersect before reaching the wall of the bin, which will be no longer influenced by the insert
and the desired effect will not be achieved.
Figure 1a Region Influenced by the Insert Below the
Transition of the Bin
Figure 1b Region Influenced by the Insert Above
the Transition of the Bin
Johanson looked at the placement of the insert to optimize the length of wall (CD) influenced by the insert
(determined from ratio W/R, annulus width / insert radius), and to calculate the location of the point (D) at
which flow starts on the hopper wall, determined by ψ (angle between a line AD and the wall of the insert,
indicating the trajectory of the principal stress). With the assumption of the insert converting the conical
hopper into a wedge, the stress field was approximated to the radial stress field proposed by Jenike for
wedge-shaped hoppers [Johanson, 1964; Nedderman, 1992]. With this, Johanson calculated a critical ratio
W/R (annulus width / insert radius) and presented the results in a graphical form, see Figure 2. In the same
way, for the localization of the point D, ψ was calculated and presented in terms of the effective angle of
internal friction of the bulk solid (δ), the half angle of the hopper (α2) and the half angle of the insert (α1), see
Figure 3.
Figure 2 Approximate critical W/R for inserts and
hoppers with the same slope; Johanson [Johanson,
1965]
Figure 3 Approximate angle ψ to determine limit of
flow along hopper walls; Johanson [Johanson, 1965]
With the information obtained above, Johanson developed the following design procedure to retrofit inverted
cones into existing silos performing in core flow pattern.
a. The first step consists of selecting the half angle (α2) of the insert. 30° is recommended for most
materials, however, when cleanout is not necessary, (i.e. materials which are not time-sensitive) a flat
A
B C
D
A
B C
D
Stagnant
Zone
Transition
A
B C
D
A
B C
D
Stagnant
Zone
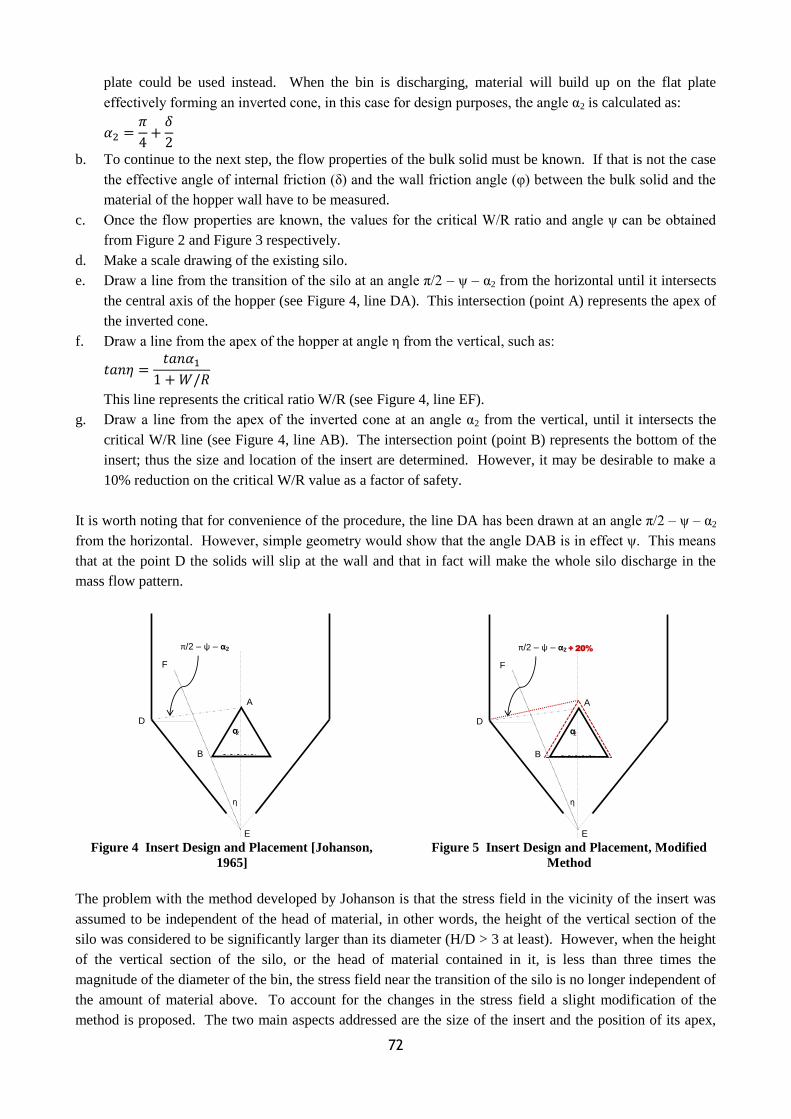
72
plate could be used instead. When the bin is discharging, material will build up on the flat plate
effectively forming an inverted cone, in this case for design purposes, the angle α2 is calculated as:
b. To continue to the next step, the flow properties of the bulk solid must be known. If that is not the case
the effective angle of internal friction (δ) and the wall friction angle (υ) between the bulk solid and the
material of the hopper wall have to be measured.
c. Once the flow properties are known, the values for the critical W/R ratio and angle ψ can be obtained
from Figure 2 and Figure 3 respectively.
d. Make a scale drawing of the existing silo.
e. Draw a line from the transition of the silo at an angle π/2 – ψ – α2 from the horizontal until it intersects
the central axis of the hopper (see Figure 4, line DA). This intersection (point A) represents the apex of
the inverted cone.
f. Draw a line from the apex of the hopper at angle η from the vertical, such as:
This line represents the critical ratio W/R (see Figure 4, line EF).
g. Draw a line from the apex of the inverted cone at an angle α2 from the vertical, until it intersects the
critical W/R line (see Figure 4, line AB). The intersection point (point B) represents the bottom of the
insert; thus the size and location of the insert are determined. However, it may be desirable to make a
10% reduction on the critical W/R value as a factor of safety.
It is worth noting that for convenience of the procedure, the line DA has been drawn at an angle π/2 – ψ – α2
from the horizontal. However, simple geometry would show that the angle DAB is in effect ψ. This means
that at the point D the solids will slip at the wall and that in fact will make the whole silo discharge in the
mass flow pattern.
Figure 4 Insert Design and Placement [Johanson,
1965]
Figure 5 Insert Design and Placement, Modified
Method
The problem with the method developed by Johanson is that the stress field in the vicinity of the insert was
assumed to be independent of the head of material, in other words, the height of the vertical section of the
silo was considered to be significantly larger than its diameter (H/D > 3 at least). However, when the height
of the vertical section of the silo, or the head of material contained in it, is less than three times the
magnitude of the diameter of the bin, the stress field near the transition of the silo is no longer independent of
the amount of material above. To account for the changes in the stress field a slight modification of the
method is proposed. The two main aspects addressed are the size of the insert and the position of its apex,
α2
B
F
E
η
D
π/2 – ψ – α2
A
α2
B
F
E
η
D
π/2 – ψ – α2
A
+ 20%
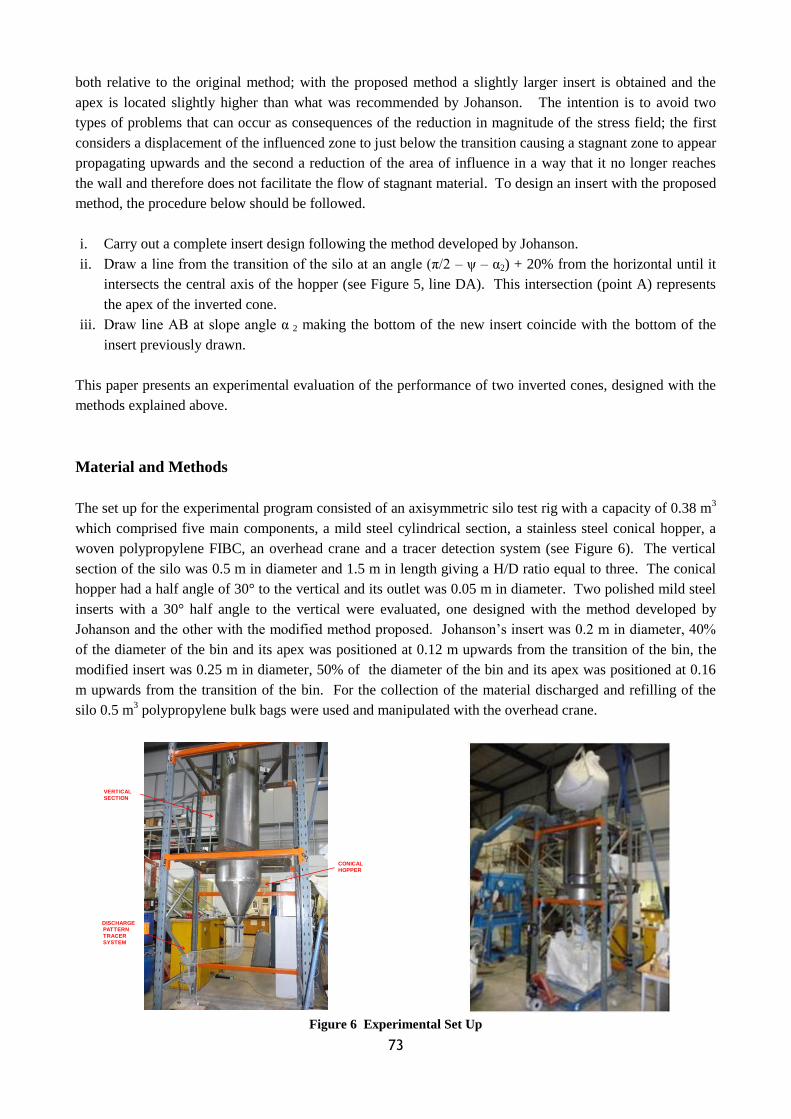
73
both relative to the original method; with the proposed method a slightly larger insert is obtained and the
apex is located slightly higher than what was recommended by Johanson. The intention is to avoid two
types of problems that can occur as consequences of the reduction in magnitude of the stress field; the first
considers a displacement of the influenced zone to just below the transition causing a stagnant zone to appear
propagating upwards and the second a reduction of the area of influence in a way that it no longer reaches
the wall and therefore does not facilitate the flow of stagnant material. To design an insert with the proposed
method, the procedure below should be followed.
i. Carry out a complete insert design following the method developed by Johanson.
ii. Draw a line from the transition of the silo at an angle (π/2 – ψ – α2) + 20% from the horizontal until it
intersects the central axis of the hopper (see Figure 5, line DA). This intersection (point A) represents
the apex of the inverted cone.
iii. Draw line AB at slope angle α 2 making the bottom of the new insert coincide with the bottom of the
insert previously drawn.
This paper presents an experimental evaluation of the performance of two inverted cones, designed with the
methods explained above.
Material and Methods
The set up for the experimental program consisted of an axisymmetric silo test rig with a capacity of 0.38 m3
which comprised five main components, a mild steel cylindrical section, a stainless steel conical hopper, a
woven polypropylene FIBC, an overhead crane and a tracer detection system (see Figure 6). The vertical
section of the silo was 0.5 m in diameter and 1.5 m in length giving a H/D ratio equal to three. The conical
hopper had a half angle of 30° to the vertical and its outlet was 0.05 m in diameter. Two polished mild steel
inserts with a 30° half angle to the vertical were evaluated, one designed with the method developed by
Johanson and the other with the modified method proposed. Johanson‟s insert was 0.2 m in diameter, 40%
of the diameter of the bin and its apex was positioned at 0.12 m upwards from the transition of the bin, the
modified insert was 0.25 m in diameter, 50% of the diameter of the bin and its apex was positioned at 0.16
m upwards from the transition of the bin. For the collection of the material discharged and refilling of the
silo 0.5 m3 polypropylene bulk bags were used and manipulated with the overhead crane.
Figure 6 Experimental Set Up
VERTICAL
SECTION
CONICAL
HOPPER
DISCHARGE
PATTERN
TRACER
SYSTEM
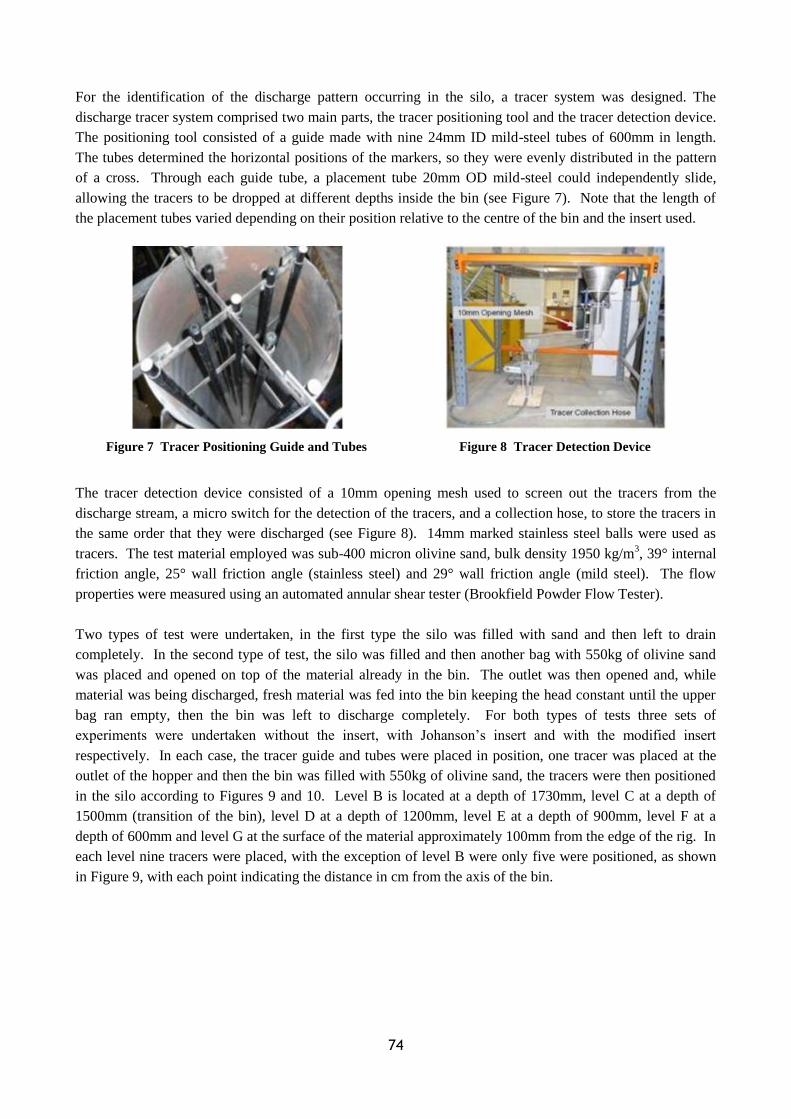
74
For the identification of the discharge pattern occurring in the silo, a tracer system was designed. The
discharge tracer system comprised two main parts, the tracer positioning tool and the tracer detection device.
The positioning tool consisted of a guide made with nine 24mm ID mild-steel tubes of 600mm in length.
The tubes determined the horizontal positions of the markers, so they were evenly distributed in the pattern
of a cross. Through each guide tube, a placement tube 20mm OD mild-steel could independently slide,
allowing the tracers to be dropped at different depths inside the bin (see Figure 7). Note that the length of
the placement tubes varied depending on their position relative to the centre of the bin and the insert used.
Figure 7 Tracer Positioning Guide and Tubes Figure 8 Tracer Detection Device
The tracer detection device consisted of a 10mm opening mesh used to screen out the tracers from the
discharge stream, a micro switch for the detection of the tracers, and a collection hose, to store the tracers in
the same order that they were discharged (see Figure 8). 14mm marked stainless steel balls were used as
tracers. The test material employed was sub-400 micron olivine sand, bulk density 1950 kg/m3, 39° internal
friction angle, 25° wall friction angle (stainless steel) and 29° wall friction angle (mild steel). The flow
properties were measured using an automated annular shear tester (Brookfield Powder Flow Tester).
Two types of test were undertaken, in the first type the silo was filled with sand and then left to drain
completely. In the second type of test, the silo was filled and then another bag with 550kg of olivine sand
was placed and opened on top of the material already in the bin. The outlet was then opened and, while
material was being discharged, fresh material was fed into the bin keeping the head constant until the upper
bag ran empty, then the bin was left to discharge completely. For both types of tests three sets of
experiments were undertaken without the insert, with Johanson‟s insert and with the modified insert
respectively. In each case, the tracer guide and tubes were placed in position, one tracer was placed at the
outlet of the hopper and then the bin was filled with 550kg of olivine sand, the tracers were then positioned
in the silo according to Figures 9 and 10. Level B is located at a depth of 1730mm, level C at a depth of
1500mm (transition of the bin), level D at a depth of 1200mm, level E at a depth of 900mm, level F at a
depth of 600mm and level G at the surface of the material approximately 100mm from the edge of the rig. In
each level nine tracers were placed, with the exception of level B were only five were positioned, as shown
in Figure 9, with each point indicating the distance in cm from the axis of the bin.
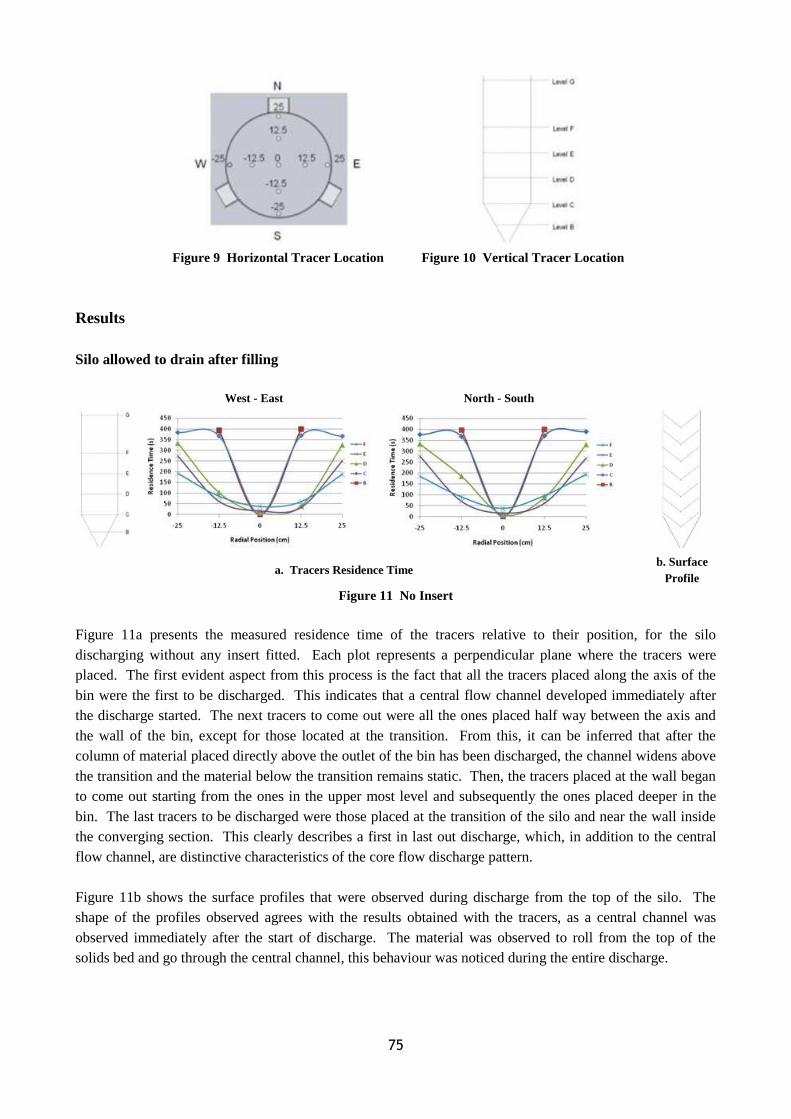
75
Figure 9 Horizontal Tracer Location Figure 10 Vertical Tracer Location
Results
Silo allowed to drain after filling
West - East North - South
a. Tracers Residence Time b. Surface
Profile
Figure 11 No Insert
Figure 11a presents the measured residence time of the tracers relative to their position, for the silo
discharging without any insert fitted. Each plot represents a perpendicular plane where the tracers were
placed. The first evident aspect from this process is the fact that all the tracers placed along the axis of the
bin were the first to be discharged. This indicates that a central flow channel developed immediately after
the discharge started. The next tracers to come out were all the ones placed half way between the axis and
the wall of the bin, except for those located at the transition. From this, it can be inferred that after the
column of material placed directly above the outlet of the bin has been discharged, the channel widens above
the transition and the material below the transition remains static. Then, the tracers placed at the wall began
to come out starting from the ones in the upper most level and subsequently the ones placed deeper in the
bin. The last tracers to be discharged were those placed at the transition of the silo and near the wall inside
the converging section. This clearly describes a first in last out discharge, which, in addition to the central
flow channel, are distinctive characteristics of the core flow discharge pattern.
Figure 11b shows the surface profiles that were observed during discharge from the top of the silo. The
shape of the profiles observed agrees with the results obtained with the tracers, as a central channel was
observed immediately after the start of discharge. The material was observed to roll from the top of the
solids bed and go through the central channel, this behaviour was noticed during the entire discharge.

76
West - East North - South
a. Tracers Residence Time b. Surface
Profile
Figure 12 Johanson’s Insert
The effect that installing Johanson‟s insert has on the discharge behaviour is evident in Figure 12a. The
tracers placed along the axis are not the ones to come out first. Instead it can be seen, that above the
transition, all the tracers positioned at a specific level have similar residence times and that those placed
deeper in the bin discharge first. This indicates a first in first out discharge, a characteristic of mass flow
pattern. However, the behaviour below the transition is quite different, the last tracers to come out are those
at the wall of the transition and the converging section, showing that the material in that zone remained
stagnant, therefore mass flow was not obtained. The lower part of the bin discharged in core flow pattern,
while the upper part discharged in a mass flow like pattern, this combination is known as expanded flow
pattern (or internal mass-flow). This occurs when the discharge channel in a core flow discharge widens to
the point that it intersects the wall of the bin, from that point upwards the material will slip at the wall and in
a local mass flow pattern. An interesting detail that contradicts the statement above can be observed in
Figure 12a. The tracers placed at the wall of level F came out after those of the level G. The explanation to
this can be found with the help of Figure 12b. When the discharge started, the top surface of the material
came down levelled and moving at the wall, suggesting that mass flow had been achieved. However, when
the top surface was near the middle point of the vertical section, a central channel started forming. At that
point, the material at the wall continued moving but at a lower speed until no further movement was
observed and core flow was fully developed. With this it can be inferred that the material stopped moving
before that the tracers of level F were discharged, then, the material at the top started rolling down the central
channel allowing the tracers at the wall of level G to be discharged first.
West - East North - South
a. Tracers Residence Time b. Surface
Profile
Figure 13 Modified Insert
A further change to the discharge pattern, shown in Figure 13a, is produced when the modified insert is
installed. The upper levels of tracers have similar discharge behaviour to the process using the smaller
insert. However, the tracers placed at the wall of the transition and converging section were not the last to be
discharged, instead, they came out at the early stages of the test, providing evidence that there were no

77
stagnant zones of material in the bin and therefore it can be said that mass flow was achieved. This
statement is valid only for a limited period of time during the test, because as it was observed from the top
(see Figure 13b) the material descended levelled for around three-quarters of the length of the vertical
section, where the central channel started forming and then the material stopped moving at the wall. This
explains, as seen with the smaller insert, the difference between the wall tracers of levels F and G. Although
the surface profiles and, the behaviour of the tracers in the upper part of the bin are very similar for both
inserts, it has to be noted that the mechanism differs considerably. In the case of Johanson‟s insert, the
material near the wall of the converging section never moved creating a barrier that hampers the discharge of
the material above. With the modified insert, the material at the wall in the converging section moved, as
shown by the residence time of the tracers, therefore the impeding barrier was not present at the early stages
of the test. However, when the inventory of material got lower, the vertical force, that helps the material
move at the wall, also reduced allowing the formation of the stagnant zone. This is a clear indication that the
head of material plays an important role in the performance of inverted cones when the H/D ratio is small
(typically < 3).
An additional aspect from Figure 13a deserves some attention, it can be seen that the tracers placed at the
wall of the converging section (level B) have a higher residence time than those placed at the wall on levels
C and D. First of all, it has to be clarified that level B was located lower than the base of the insert, which in
the end affected the relative speed of the tracers in two ways. The key to the difference in residence time lies
on the void space created below the insert. When the material passes through the annular gap between the
insert and the silo wall, it finds in that empty space a region of low stress into which it is easier to move and
then continue to the outlet. The second mechanism is a consequence of the first, because as some of the
material expands towards the empty space, the driving force acting on the material near the wall reduces,
making it more difficult for the powder to flow.
Silo with additional material fed during discharge
West - East North – South
Figure 14 No Insert
The flow behaviour of the silo, when a 0.5 tonne big bag is utilised to maintain a constant head of material in
the silo until the big bag empties and completely drains down, is shown in Figure 14. The process without
inserts illustrated in Figure 11 does not differ much from the process analysed above. However, it is worth
noting that the differences in the residence time of the tracers placed near the walls and those closer to the
centre of the bin are more exaggerated than before. This is due to the fact that the fresh material fed into the
bin from the big bag flows straight down the central flow channel and is therefore discharged before the
material near the wall, confirming the first in last out discharge.
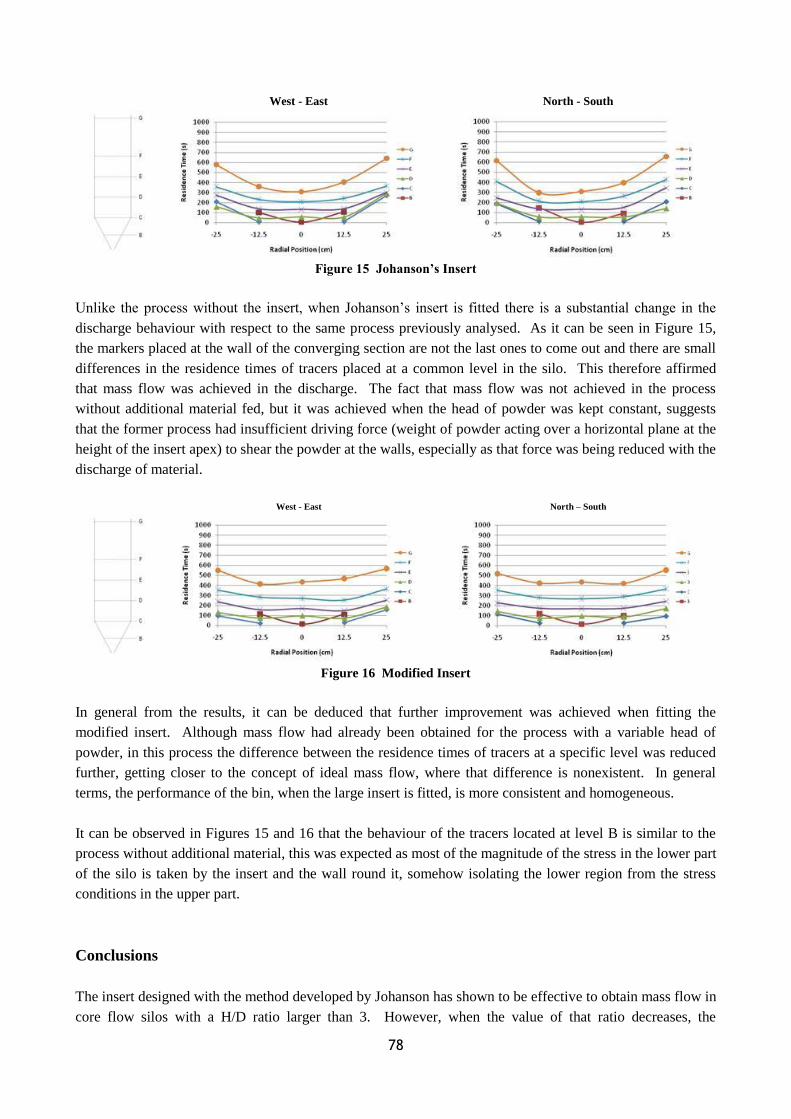
78
West - East North - South
Figure 15 Johanson’s Insert
Unlike the process without the insert, when Johanson‟s insert is fitted there is a substantial change in the
discharge behaviour with respect to the same process previously analysed. As it can be seen in Figure 15,
the markers placed at the wall of the converging section are not the last ones to come out and there are small
differences in the residence times of tracers placed at a common level in the silo. This therefore affirmed
that mass flow was achieved in the discharge. The fact that mass flow was not achieved in the process
without additional material fed, but it was achieved when the head of powder was kept constant, suggests
that the former process had insufficient driving force (weight of powder acting over a horizontal plane at the
height of the insert apex) to shear the powder at the walls, especially as that force was being reduced with the
discharge of material.
West - East North – South
Figure 16 Modified Insert
In general from the results, it can be deduced that further improvement was achieved when fitting the
modified insert. Although mass flow had already been obtained for the process with a variable head of
powder, in this process the difference between the residence times of tracers at a specific level was reduced
further, getting closer to the concept of ideal mass flow, where that difference is nonexistent. In general
terms, the performance of the bin, when the large insert is fitted, is more consistent and homogeneous.
It can be observed in Figures 15 and 16 that the behaviour of the tracers located at level B is similar to the
process without additional material, this was expected as most of the magnitude of the stress in the lower part
of the silo is taken by the insert and the wall round it, somehow isolating the lower region from the stress
conditions in the upper part.
Conclusions
The insert designed with the method developed by Johanson has shown to be effective to obtain mass flow in
core flow silos with a H/D ratio larger than 3. However, when the value of that ratio decreases, the
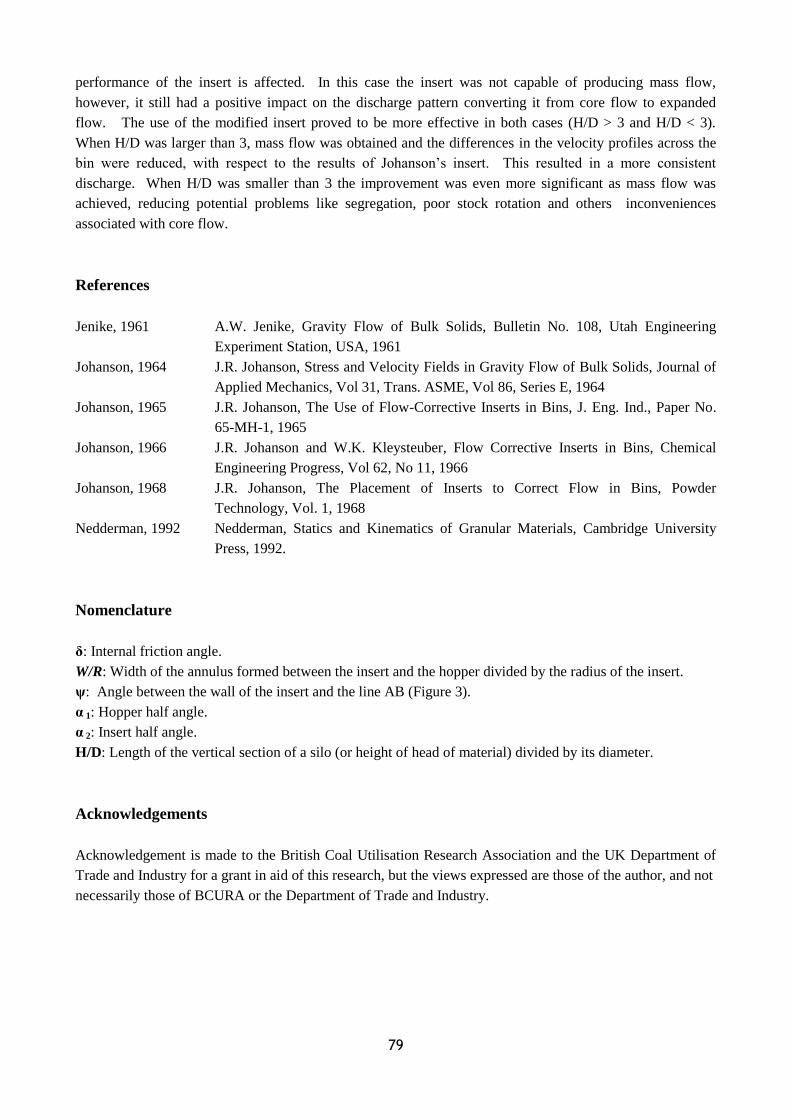
79
performance of the insert is affected. In this case the insert was not capable of producing mass flow,
however, it still had a positive impact on the discharge pattern converting it from core flow to expanded
flow. The use of the modified insert proved to be more effective in both cases (H/D > 3 and H/D < 3).
When H/D was larger than 3, mass flow was obtained and the differences in the velocity profiles across the
bin were reduced, with respect to the results of Johanson‟s insert. This resulted in a more consistent
discharge. When H/D was smaller than 3 the improvement was even more significant as mass flow was
achieved, reducing potential problems like segregation, poor stock rotation and others inconveniences
associated with core flow.
References
Jenike, 1961 A.W. Jenike, Gravity Flow of Bulk Solids, Bulletin No. 108, Utah Engineering
Experiment Station, USA, 1961
Johanson, 1964 J.R. Johanson, Stress and Velocity Fields in Gravity Flow of Bulk Solids, Journal of
Applied Mechanics, Vol 31, Trans. ASME, Vol 86, Series E, 1964
Johanson, 1965 J.R. Johanson, The Use of Flow-Corrective Inserts in Bins, J. Eng. Ind., Paper No.
65-MH-1, 1965
Johanson, 1966 J.R. Johanson and W.K. Kleysteuber, Flow Corrective Inserts in Bins, Chemical
Engineering Progress, Vol 62, No 11, 1966
Johanson, 1968 J.R. Johanson, The Placement of Inserts to Correct Flow in Bins, Powder
Technology, Vol. 1, 1968
Nedderman, 1992 Nedderman, Statics and Kinematics of Granular Materials, Cambridge University
Press, 1992.
Nomenclature
δ: Internal friction angle.
W/R: Width of the annulus formed between the insert and the hopper divided by the radius of the insert.
ψ: Angle between the wall of the insert and the line AB (Figure 3).
α 1: Hopper half angle.
α 2: Insert half angle.
H/D: Length of the vertical section of a silo (or height of head of material) divided by its diameter.
Acknowledgements
Acknowledgement is made to the British Coal Utilisation Research Association and the UK Department of
Trade and Industry for a grant in aid of this research, but the views expressed are those of the author, and not
necessarily those of BCURA or the Department of Trade and Industry.


