
Things that Happened Before You were Born
(The earth and SWMM were created)
a story by
Dr. Larry A. Roesner, Ph.D.,P.E.based (loosely*) on biblical quotes
and his own bigger than life experiences
*Actually very loosely
The earth and SWMM parallels
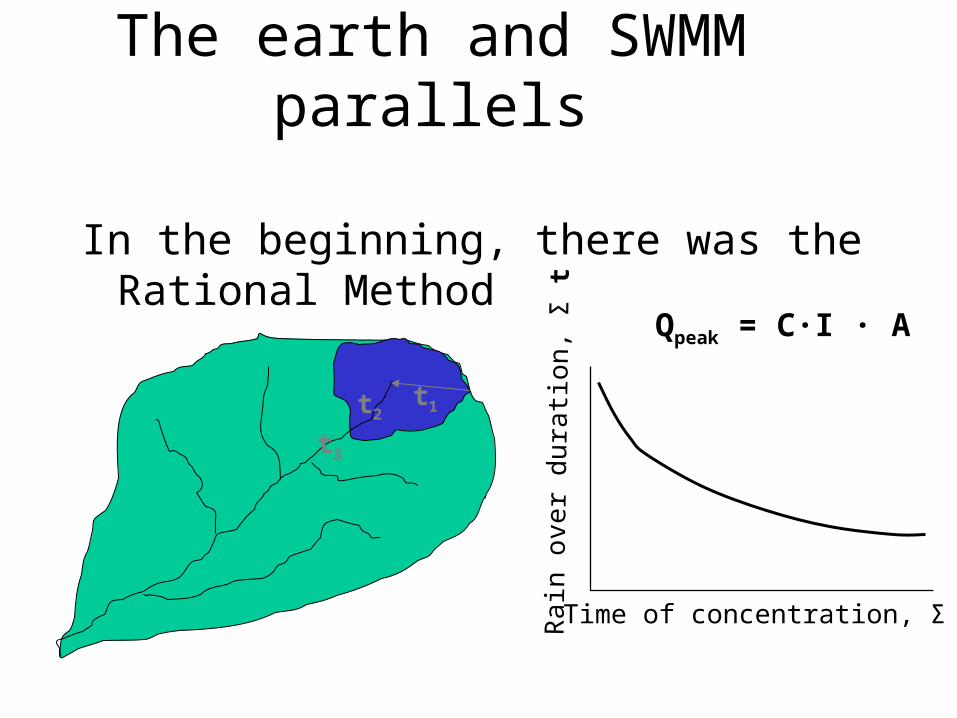
In the beginning, there was the Rational Method
t1t2
t3
Rai
n ov
er d
urat
ion,
Σ t
Time of concentration, Σ t
Qpeak = C·I · A
The earth and SWMM parallels
And darkness covered the drainage world And darkness covered the drainage world because of the limited applicability of thebecause of the limited applicability of theRational MethodRational Method

Then forward looking engineers said “let there be light”
And so, they created more rational modelsAnd so, they created more rational modelsSCS TR20 and TR55SCS TR20 and TR55HEC-1,2,3,4,5,6, and RASHEC-1,2,3,4,5,6, and RASSWMMSWMM
The earth and SWMM parallels

• SCS Method accounts for initial soil moisture and time varying C
• Runoff hydrographs can be computed
The earth and SWMM parallels
Runoff
Rai
nfal
l
Increasing Imperviousness

• HEC model produces runoff hydrograph from rainfall hyetograph using unit hydrograph technique (Who knows the Schneider
coefficient for a 30% pervious urban area? )
• Hydrologic routing produces channel flows
• Hec 2 computes steady state backwater through maximum discharge profile
The earth and SWMM The earth and SWMM parallelsparallels
• SWMM was to be the mother of all models
• It would trace runoff from its point of origin, through the stormwater system to and through the receiving waters, computing flows and water levels
• It would trace wet weather pollution from its point of origin to its final fate in the receiving waters
The earth and SWMM The earth and SWMM parallelsparallels
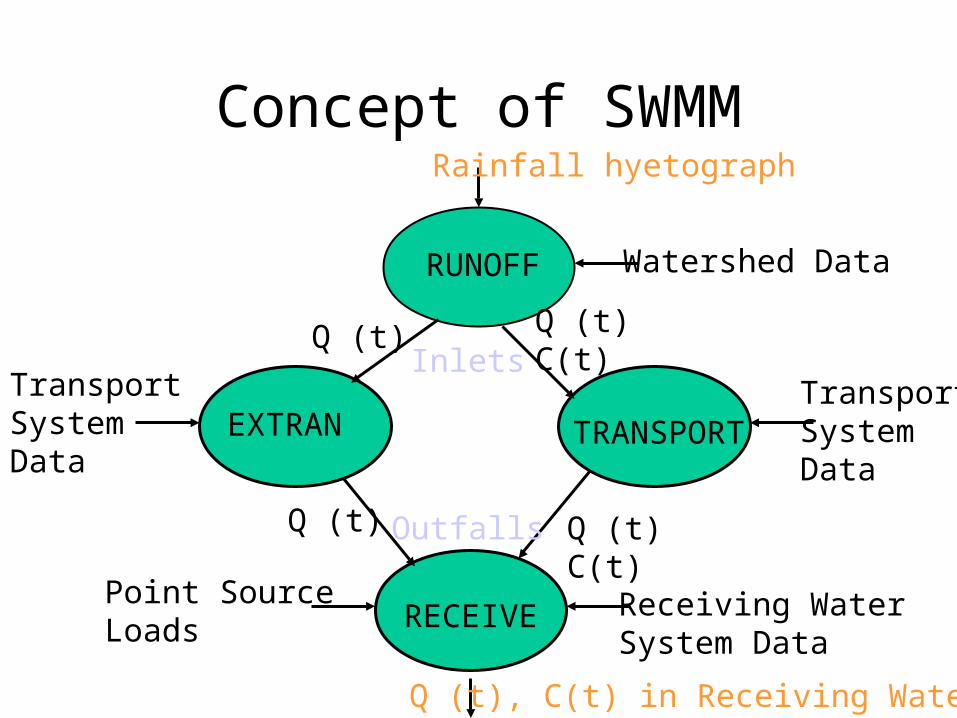
Concept of SWMM
RECEIVE
EXTRAN TRANSPORT
RUNOFF
Rainfall hyetograph
Watershed Data
Q (t) Q (t)C(t)
Q (t)C(t)
Q (t)
TransportSystemData
TransportSystemData
Receiving WaterSystem Data
Point SourceLoads
Inlets
Outfalls
Q (t), C(t) in Receiving Water
And so they rested,
And so it was, and (most) Civil Engineers saw the models and they were good.
for for 30yrs!!?30yrs!!?
The earth and SWMM parallels
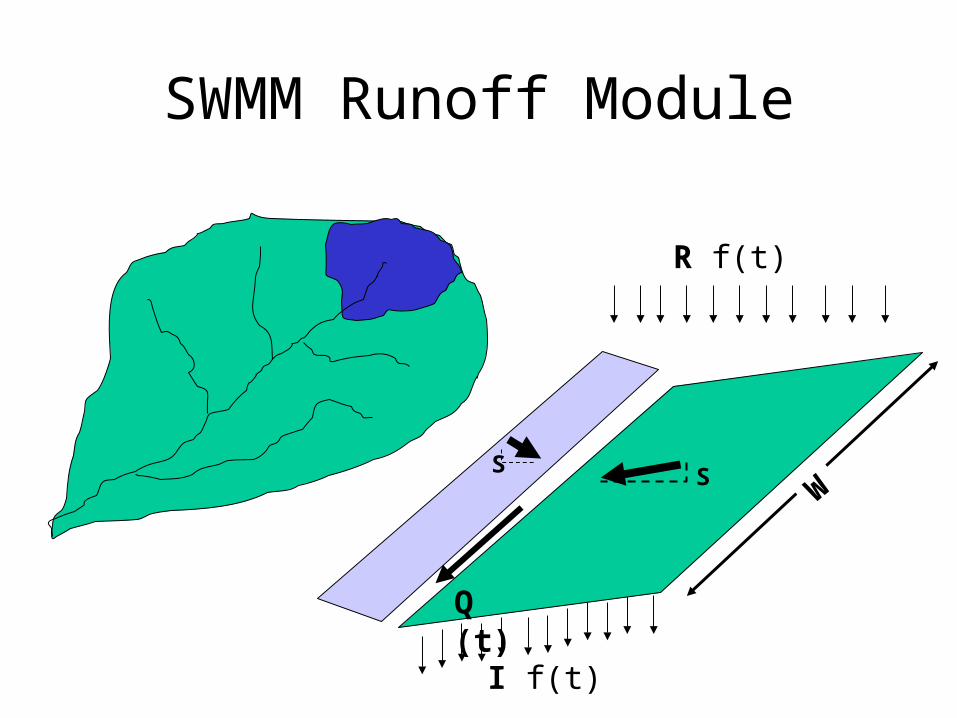
SWMM Runoff Module
I f(t)
S WS
R f(t)
Q (t)

SWMM Extran Module

INTRODUCTION TO SWMM AND MIKE SWMM
CE 580 Analysis of Urban Water Systems
Dr Larry Roesner,
Colorado State University
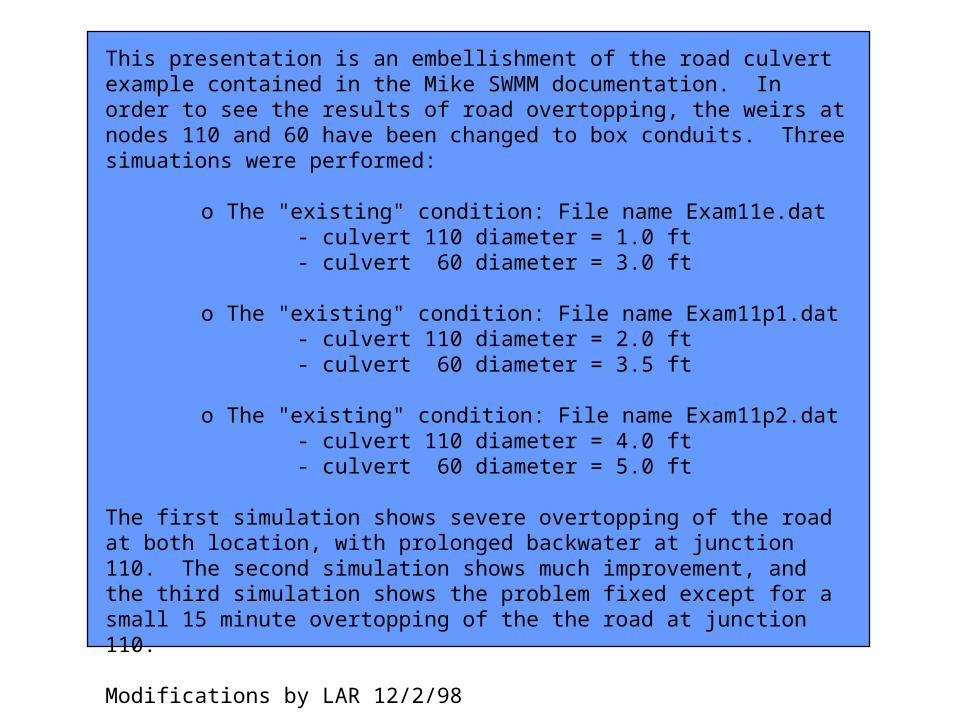
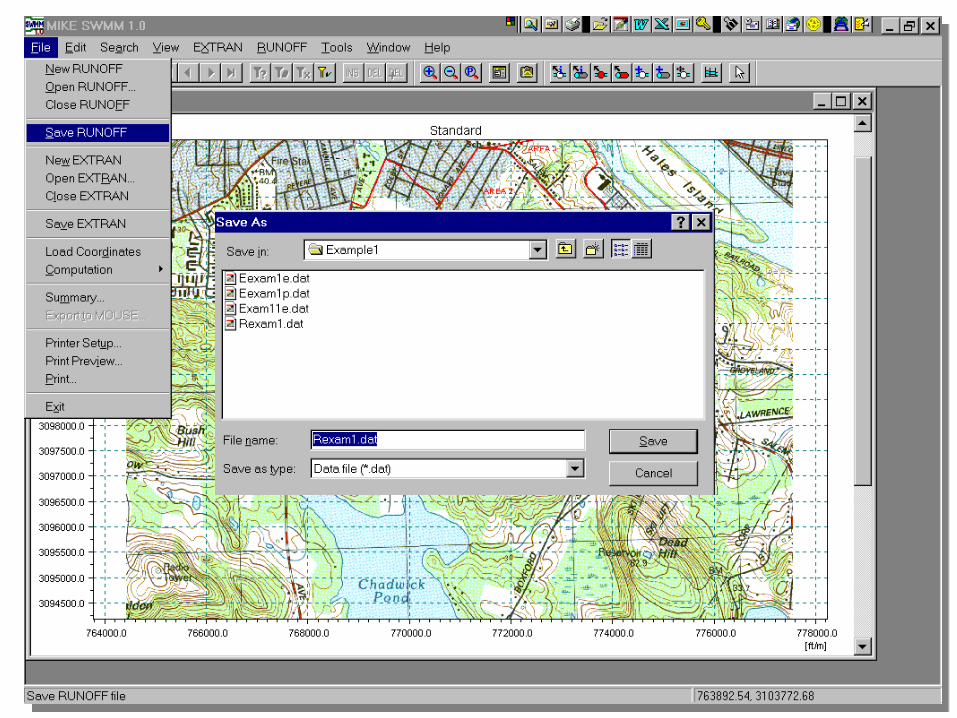
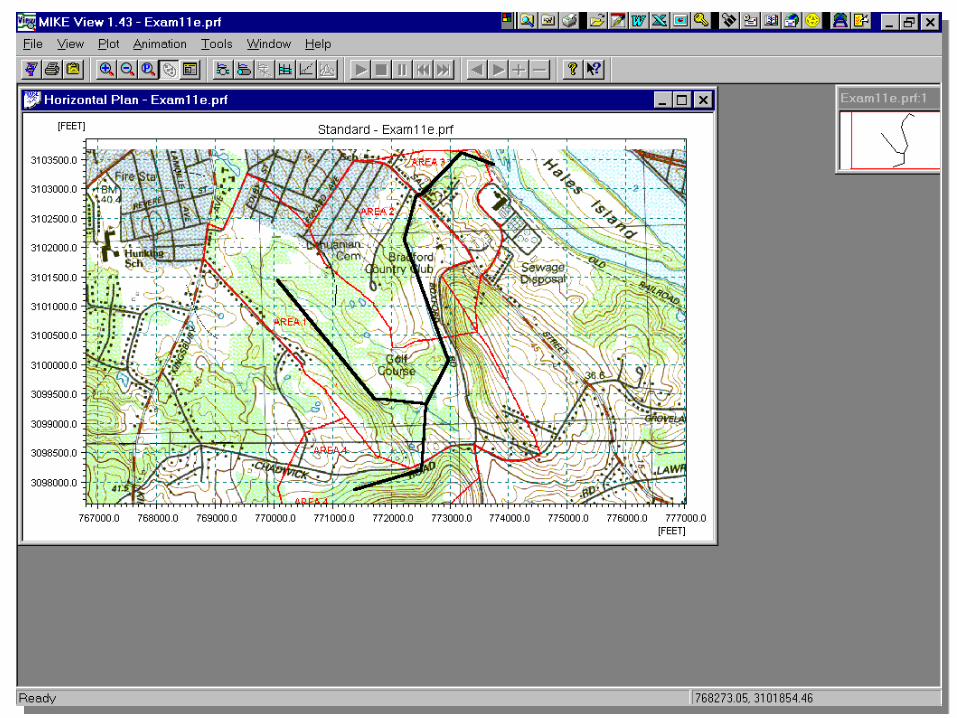
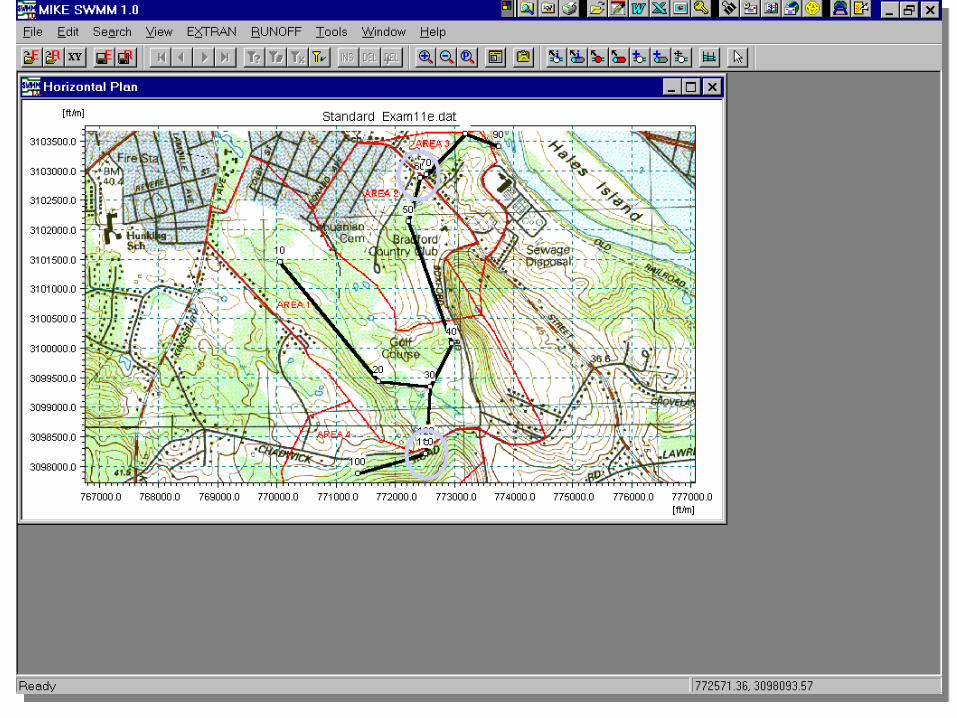
This presentation is an embellishment of the road culvert example contained in the Mike SWMM documentation. In order to see the results of road overtopping, the weirs at nodes 110 and 60 have been changed to box conduits. Three simuations were performed:
o The "existing" condition: File name Exam11e.dat- culvert 110 diameter = 1.0 ft- culvert 60 diameter = 3.0 ft
o The "existing" condition: File name Exam11p1.dat- culvert 110 diameter = 2.0 ft- culvert 60 diameter = 3.5 ft
o The "existing" condition: File name Exam11p2.dat- culvert 110 diameter = 4.0 ft- culvert 60 diameter = 5.0 ft
The first simulation shows severe overtopping of the road at both location, with prolonged backwater at junction 110. The second simulation shows much improvement, and the third simulation shows the problem fixed except for a small 15 minute overtopping of the the road at junction 110.
Modifications by LAR 12/2/98

Camp Dresser & Camp Dresser & McKeeMcKee
Danish Hydraulic InstituteDanish Hydraulic Institute
The power of two...

Danish Hydraulic Institute- a Consulting and Research Organization
• Objectives:– to develop and apply advanced methods and
technologies• within hydraulic and hydrological engineering
– to provide specialised consulting services– to contribute to the technological development
through• international research collaboration and through
• transfer of know-how and technology
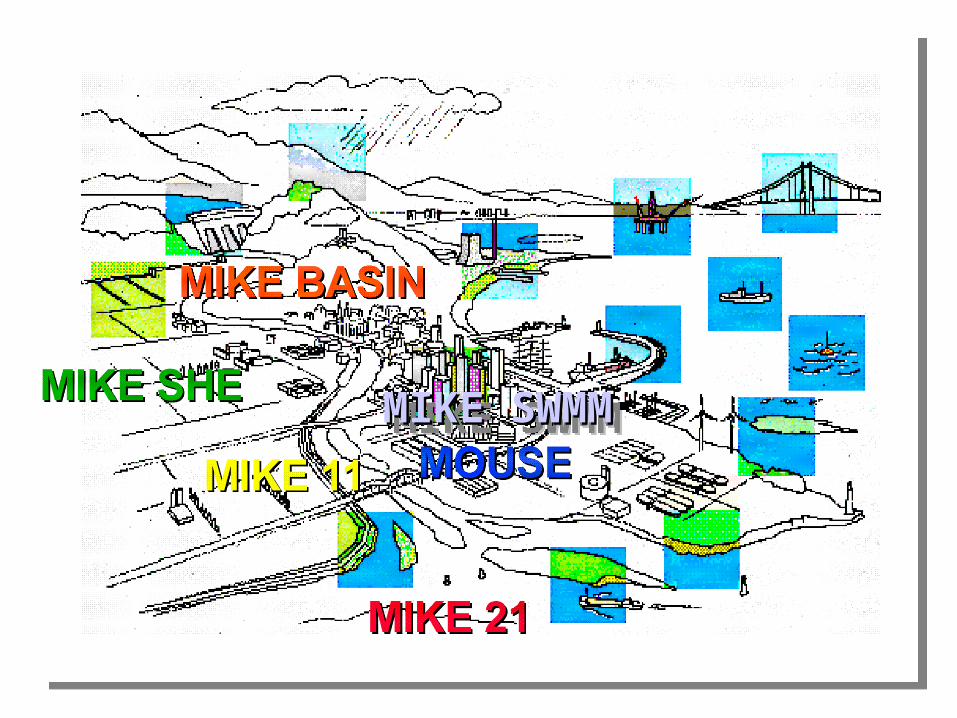
MIKE SWMMMIKE SWMMMIKE SWMMMIKE SWMM
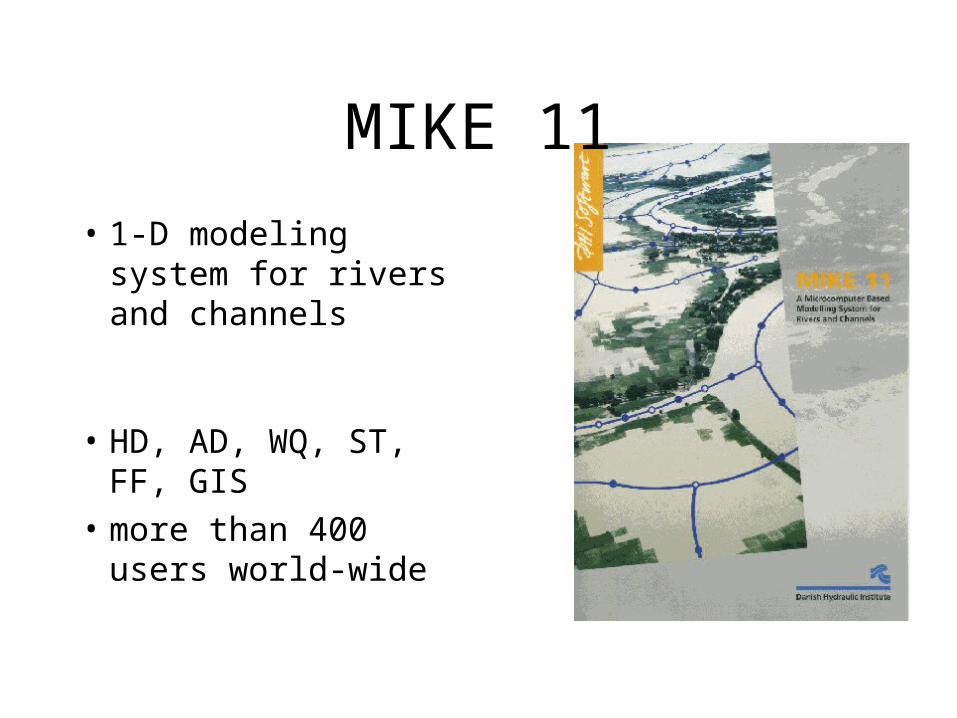
MIKE 11
• 1-D modeling system for rivers and channels
• HD, AD, WQ, ST, FF, GIS
• more than 400 users world-wide

MIKE 21
• a modelling system for estuaries, coastal waters and seas
• more than one hundred users in 35 countries

MIKE SHE
• an integrated hydrological modeling system
• 3-D Groundwater movement, unsaturated zone, Solute transport, dynamic link to MIKE 11
• some 50 users in 10 countries
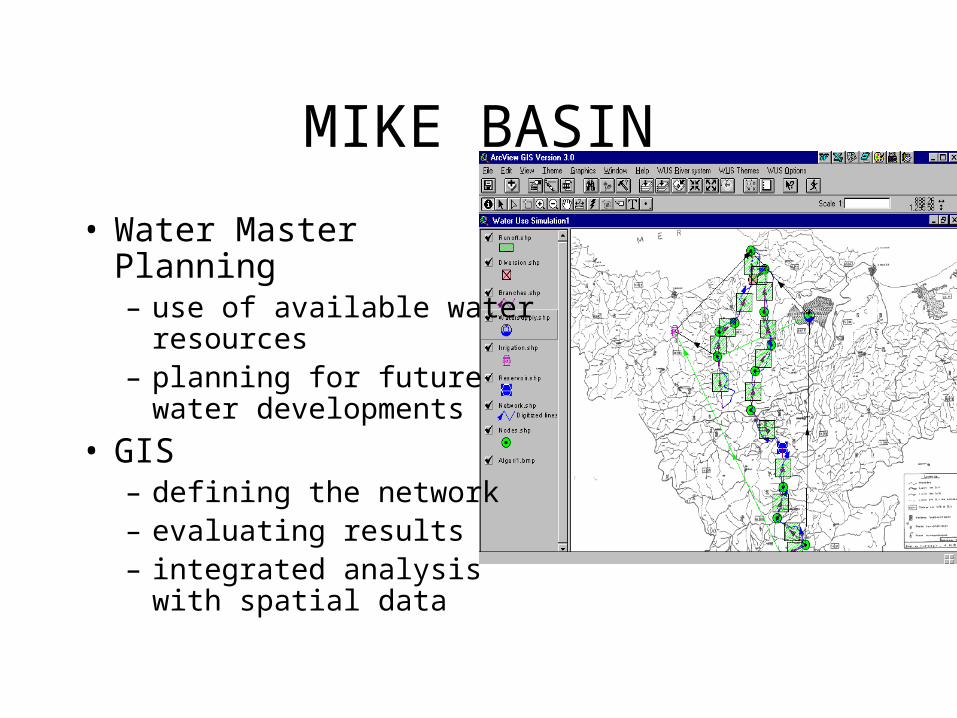
MIKE BASIN
• Water Master Planning – use of available water
resources– planning for future water
developments
• GIS– defining the network– evaluating results– integrated analysis with
spatial data

LITPACK
• an integrated modelling system for Littoral Processes And Coastline Kinetics
• more than 60 users in 20 countries


Top of Bank
Top of Overbank
Culvert
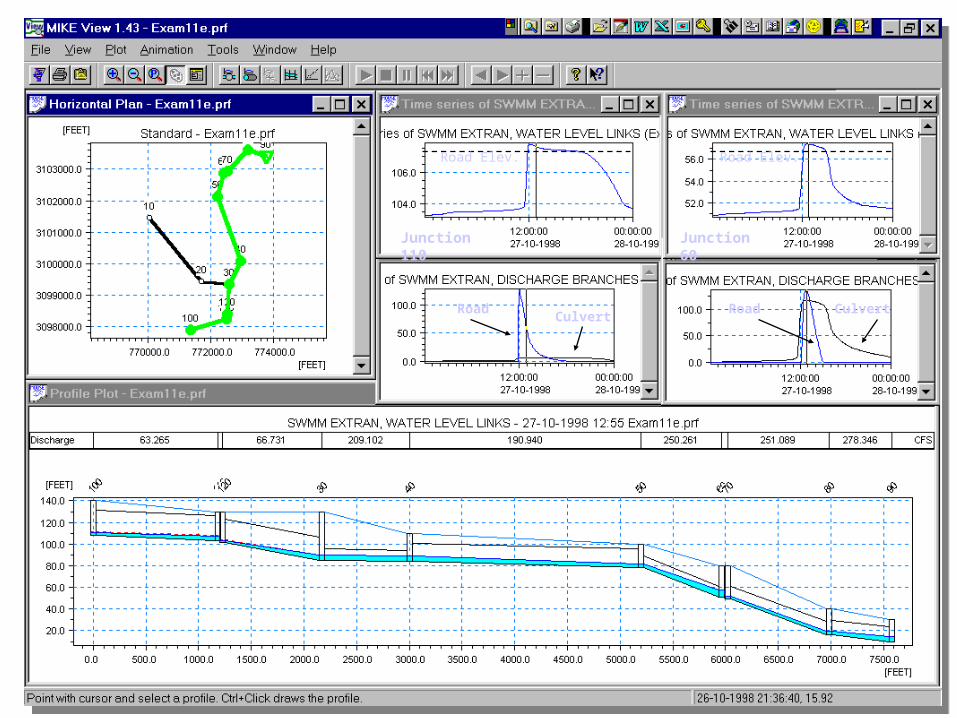
Junction 110 Junction 60
RoadCulvert
Road Culvert
Road Elev. Road Elev.

Junction 110
RoadCulvert
Road Elev.

Junction 110
RoadCulvert
Road Elev.

Junction 110
RoadCulvert
Road Elev.
Junction 110
RoadCulvert
RoadCulvert
Road Elev.Road Elev.
Junction 60
Modeling an Urban Development with MIKE-SWMM
Presented by: Melissa Figurski
CE 394K.2 Surface Water Hydrology
Term project, Spring 2001

Site Layout
24.17 acres
46.8% Impervious

Design ApproachesWho cares about the environment anyway…
Earth Day is every day…

MIKE-SWMM Evaluations
• Pre-development – Natural runoff
• Post-development– Sewer system pipe runoff– Grassy swale to detention pond runoff

Design Criteria, City of Austin
• Drainage Criteria Manual – detention ponds• “Ponds shall be designed to reduce post-development peak
rates of discharge to existing pre-development peak rates of discharge from the 2, 10, and 25 year storm events at each point of discharge from the project or development site.”
• Environmental Criteria Manual – runoff treatment volume• “one-half inch of runoff plus an additional one-tenth inch for
each ten percent increase of gross impervious cover over twenty percent within the drainage area to the control”

Design Storms for Austin, Texas
• Technical Paper 40
Used SCS Type-II Distribution
•2 year, 24-hour Storm•4.1 inches
•10 year, 24-hour Storm•6.7 inches
•25 year, 24-hour Storm•7.8 inches

Undeveloped Site 10-year storm

Site Layout
24.17 acres
46.8% Impervious

Developed Site – Obtaining Watershed Parameters
Does anyone know how to use this thing?!?!

Developed Site – Obtaining Watershed Parameters
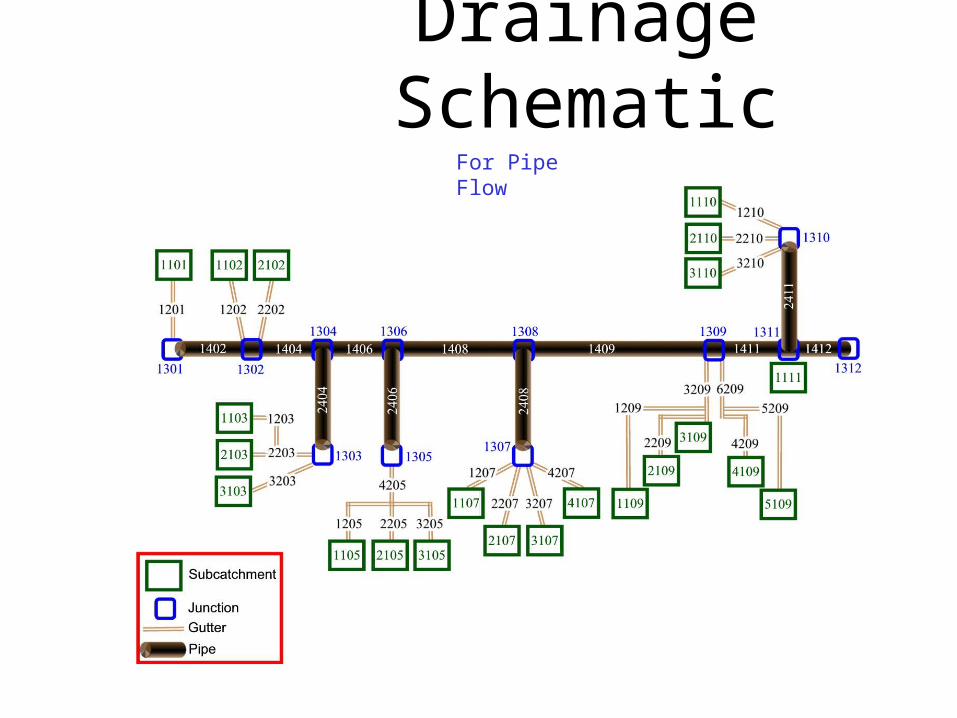
Drainage SchematicFor Pipe Flow

RUNOFF Block

EXTRAN Block
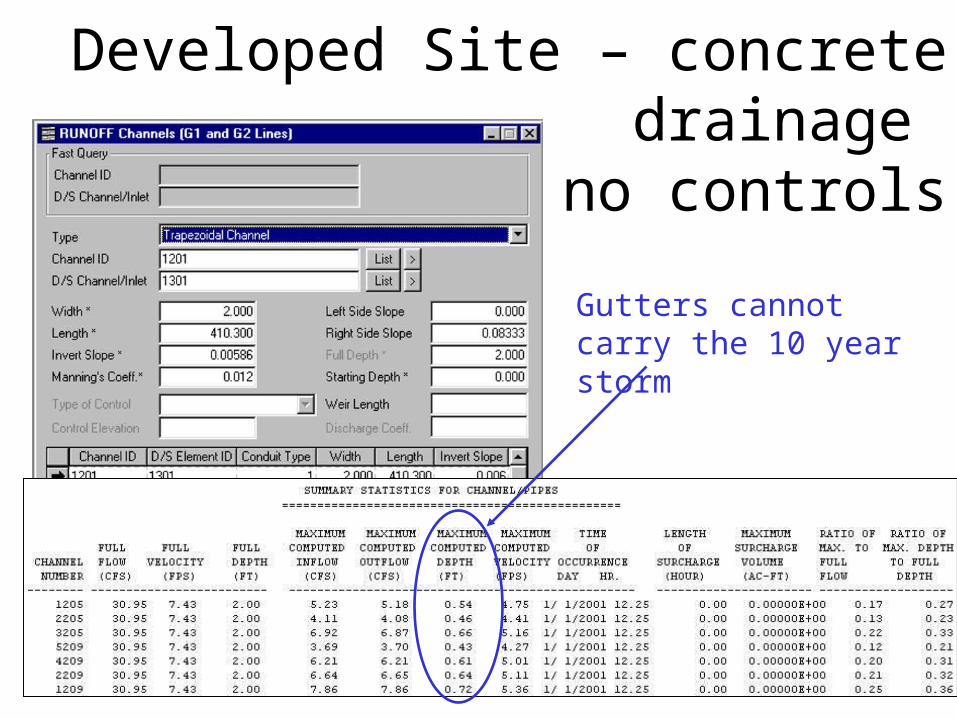
Developed Site – concrete drainage with no controls
Gutters cannot carry the 10 year storm

Developed Site – concrete drainage with no controls
146 cfs!!
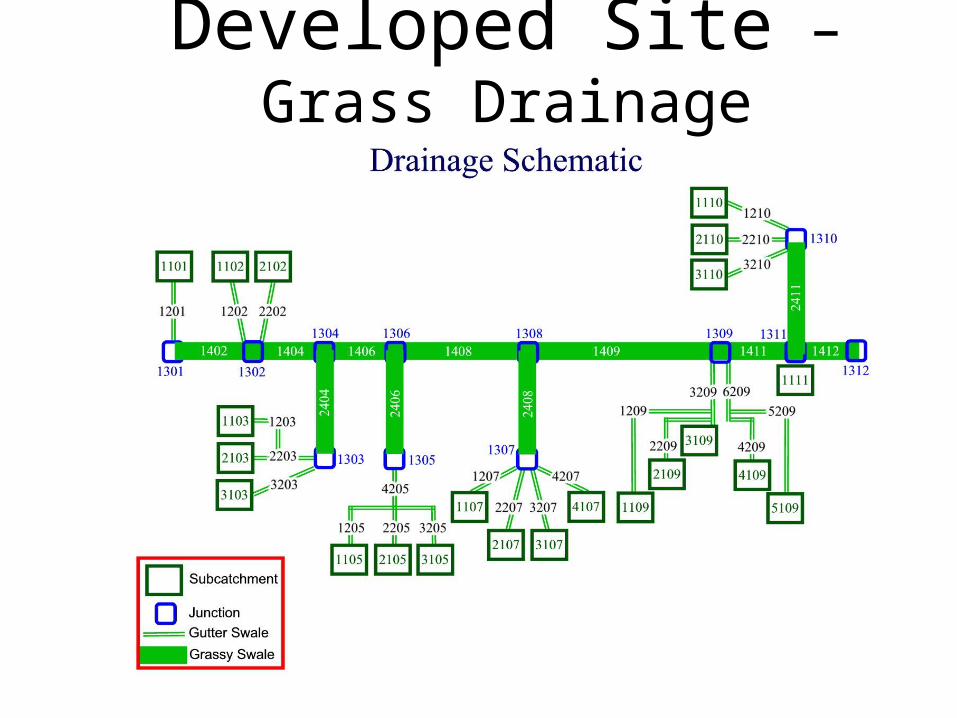
Developed Site – Grass Drainage
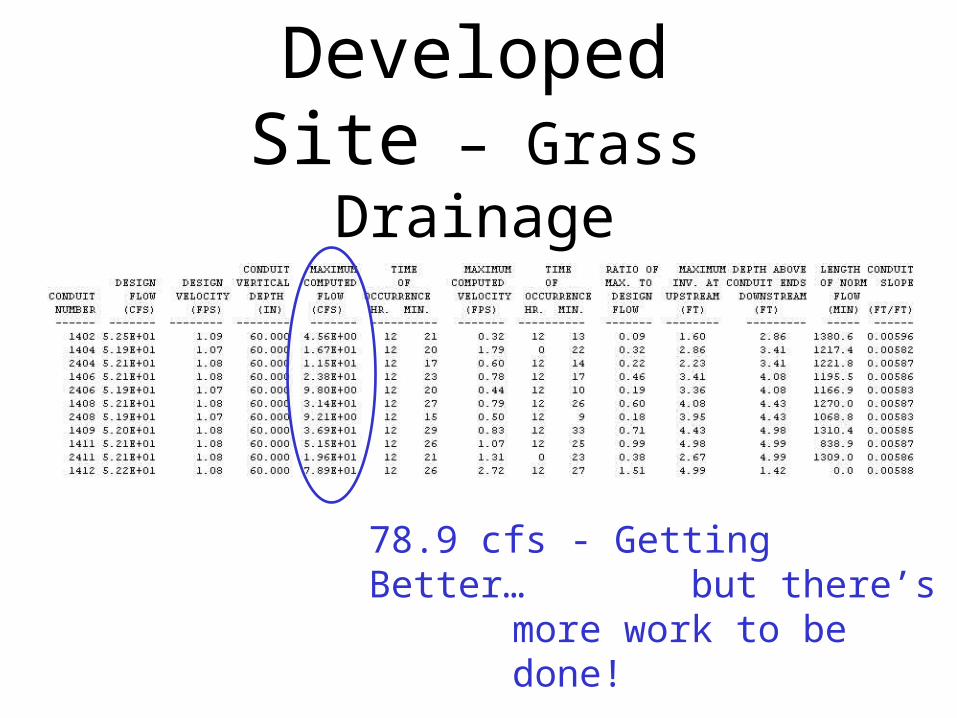
Developed Site – Grass Drainage
78.9 cfs - Getting Better… but there’s more work to be done!

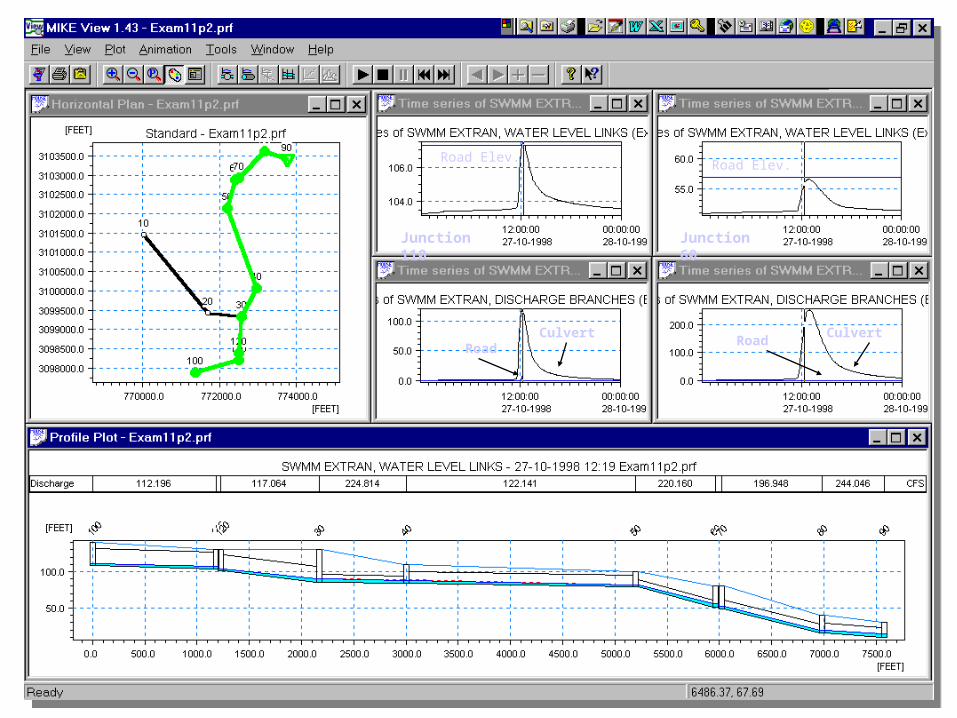
MIKE-VIEW

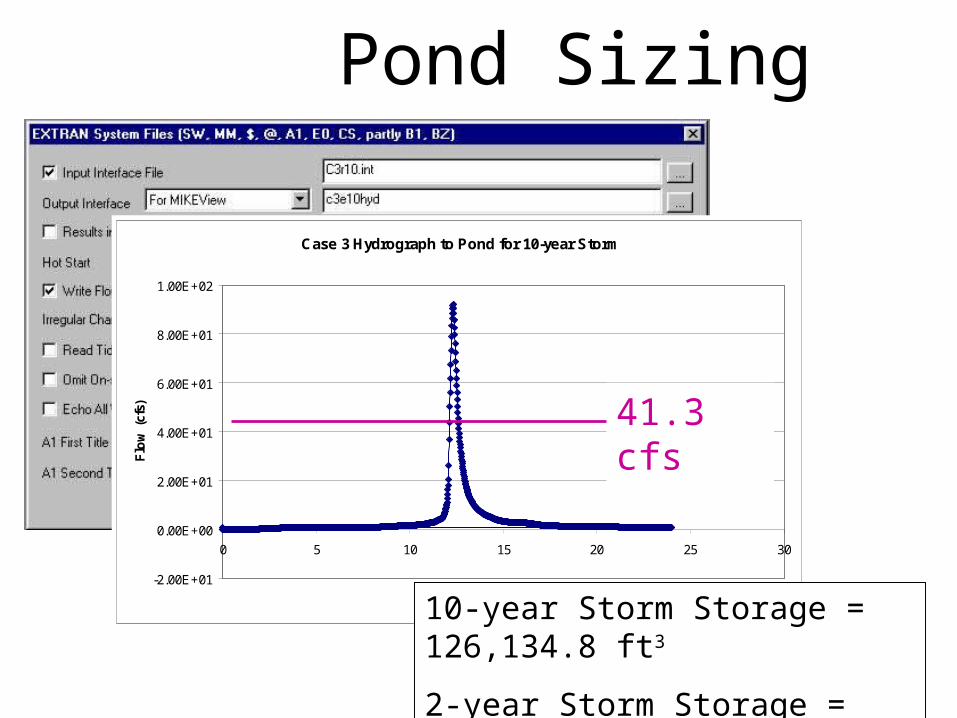
Pond Sizing

Pond Sizing
Sum Outflow Hydrographs
Pond Sizing
Case 3 Hydrograph to Pond for 10-year Storm
-2.00E+01
0.00E+00
2.00E+01
4.00E+01
6.00E+01
8.00E+01
1.00E+02
0 5 10 15 20 25 30
Time
Flo
w (
cfs) 41.3 cfs
10-year Storm Storage = 126,134.8 ft3
2-year Storm Storage = 77,582.38 ft3
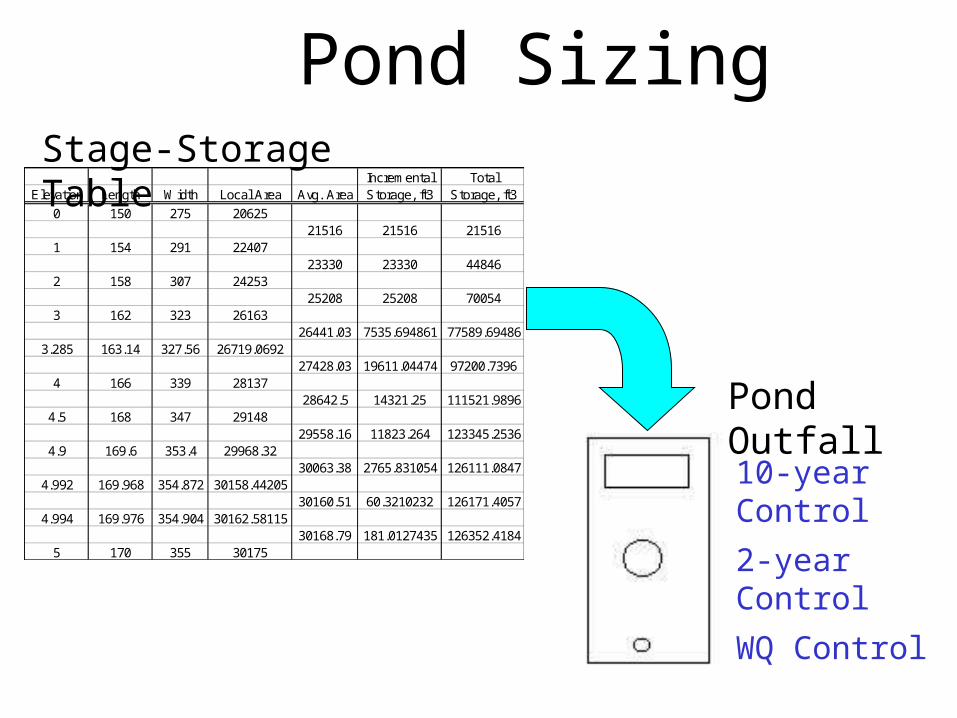
Pond SizingIncremental Total
Elevation Length Width Local Area Avg. Area Storage, ft3 Storage, ft3
0 150 275 2062521516 21516 21516
1 154 291 2240723330 23330 44846
2 158 307 2425325208 25208 70054
3 162 323 2616326441.03 7535.694861 77589.69486
3.285 163.14 327.56 26719.069227428.03 19611.04474 97200.7396
4 166 339 2813728642.5 14321.25 111521.9896
4.5 168 347 2914829558.16 11823.264 123345.2536
4.9 169.6 353.4 29968.3230063.38 2765.831054 126111.0847
4.992 169.968 354.872 30158.4420530160.51 60.3210232 126171.4057
4.994 169.976 354.904 30162.5811530168.79 181.0127435 126352.4184
5 170 355 30175
Stage-Storage Table
10-year Control
2-year Control
WQ Control
Pond Outfall
Almost There…
• Input Pond Stage/Storage Data into MIKE-SWMM
• Size Pond Outfall Structures for 2 and 10-year Storms
• Convince World to Use Swales


