
Thomas A. DanjczekPresidentSteel Manufacturers AssociationMay 16, 2013
TRI – Spring Membership Meeting
4-22-13
The Refractories Institute

Outline
•About the SMA
•Safety
•Set the Tone - Economy
•Set the Tone - Steel
•US Steel Imports
•Expanding Future US Steel Production
•Changes/Challenges Impacting Steel
•What’s Happening in Washington, DC
•Final Thoughts
TRI – Spring Meeting
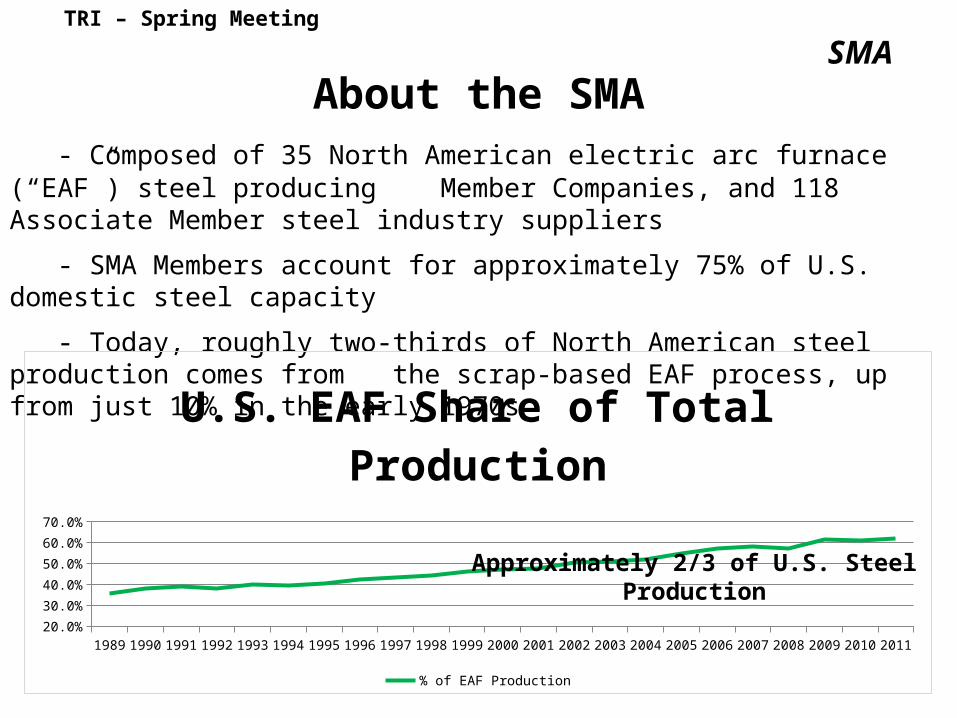
About the SMA- Composed of 35 North American electric arc furnace (“EAF”) steel producing Member Companies, and 118 Associate Member steel industry suppliers
- SMA Members account for approximately 75% of U.S. domestic steel capacity
- Today, roughly two-thirds of North American steel production comes from the scrap-based EAF process, up from just 10% in the early 1970s
TRI – Spring Meeting
SMA
1989 1990 1991 1992 1993 1994 1995 1996 1997 1998 1999 2000 2001 2002 2003 2004 2005 2006 2007 2008 2009 2010 201120.0%
25.0%
30.0%
35.0%
40.0%
45.0%
50.0%
55.0%
60.0%
65.0%
U.S. EAF Share of Total Production
% of EAF Production
Approximately 2/3 of U.S. Steel Production

TRI – Spring Meeting
Safety

SafetyTRI – Spring Meeting
TRI – Spring Meeting
Safety

Set the Tone - Economy
• GDP forecasts are “soft” – 3% first quarter 2013 jerked around by sentiment reaction
• Pace of U.S. growth in 2013 near stagnation; China 7.8% now
• Euro Zone is at negative growth first 2 months of 2013
• While U.S. unemployment rate declined, still above pre-recession levels
• Rising energy production and housing rebounding are bright spots (“race to gas”)
• Capital spending is a downside risk
• U.S. trade deficit is unsustainable
TRI – Spring Meeting

Global Economic Outlook
• Global GDP Forecasts– Global growth forecast for 2014 at 4.1%– Major uncertainties worldwide – Eurozone forecast for 2014 at 1.0%
• Global Outlook– USA
• Economy is growing at a slow pace with limitations created by weak exports and cautious business spending• Credit conditions are easing and demand for vehicles and houses are gaining momentum
– Asia• Japan’s economy continues to struggle with weak export market and declining industrial production• India’s GDP continues to grow, although problems remain with inflation and weak domestic and foreign
investment• China’s territorial disputes with neighboring Asian countries could result in severe economic disruptions, but
growth still projected at over 8%– Europe
• The Eurozone is in recession. France and Germany show modest growth but are slowing• A Eurozone breakup no longer seems imminent but serious concerns remain about Spain and Italy
IMF DataGDP Jan 23rd, 2013 2011 2012 2013 FORECAST
WORLD +3.9% +3.2 % +3.5 %
USA +1.8% +2.3 % +2.0 %
China +9.3% +7.8% +8.2%
Developing Asia +8.0% +6.6 % +7.1 %
Eurozone +1.4% (0.4) % (0.2) %
TRI – Spring Meeting

2001 2002 2003 2004 2005 2006 2007 2008 2009 2010 2011 20120.00
50,000.00
100,000.00
150,000.00
200,000.00
250,000.00
300,000.00
350,000.00
Source: US Census Bureau
Total US Trade Deficit with China(in million US$)
2012 US trade deficit with China was a record $315.1 billion, accounting for 43.3% of overall $727.9 billion US trade deficit.
2012 US steel imports from China were 1,505,751 metric tons, a 33.9% increase over 2011 levels, and a 92.8% increase over 2010 levels.
Mill
ion
US
$TRI – Spring Meeting

US GOOds
Set the Tone - Economy
Annual Deficit is the most significant barrier to U.S. economic recovery
UNSUSTAINABLE
TRI – Spring Meeting

Set the Tone - Steel
• Primary metal 4% growth YTD 2012 over 2011 in US
• U.S. capacity utilization approx. 74.4% in 2012
Y.T.D. capacity utilization approx.76.9% (w/reduced capacity)
• Scrap price volatility (75% of minimill costs)
TRI – Spring Meeting
Year World Steel Production
(million metric tonnes)
US Steel Production
(million metric tonnes)
US Steel Imports
(million metric tonnes)
2007 1,347.0 98.1 30.2
2008 1,341.2 91.4 29.0
2009 1,235.8 58.2 14.7
2010 1,428.7 80.5 21.7
2011 1,490.1 86.2 25.9
2012 1,517.9 88.6 30.4
Sources: census.gov, worldsteel.org

U.S. Current Operating Environment
• Capacity Utilization – 2013 Capacity Utilization figures reflect a change in the overall capacity
due to the closure of several facilities in 2012 and new facilities coming online
– Flat Roll Mills – After peaking in 2Q, production rates for 3Q and 4Q were relatively flat. 1Q looks to be flat as well.
– Pipe & Tube – Imported OCTG mostly from Asia, caused NAFTA production cuts in the 2nd half. Rig counts stable.
– Long Products – Automotive continued strong performance, but nonresidential construction feel again in 2012.
– Note: Tonnage down Y.T.D. 2013 through April 13 was 27.3 million tons, capacity utilization 76%; 7.7% decrease for Y.T.D. 2012 at 29.6 million tons, capacity at 79.7% 12
2010 2011 2012 W/E 4/13/13
70.4% 74.7% 74.4% 75.8%
TRI – Spring Meeting
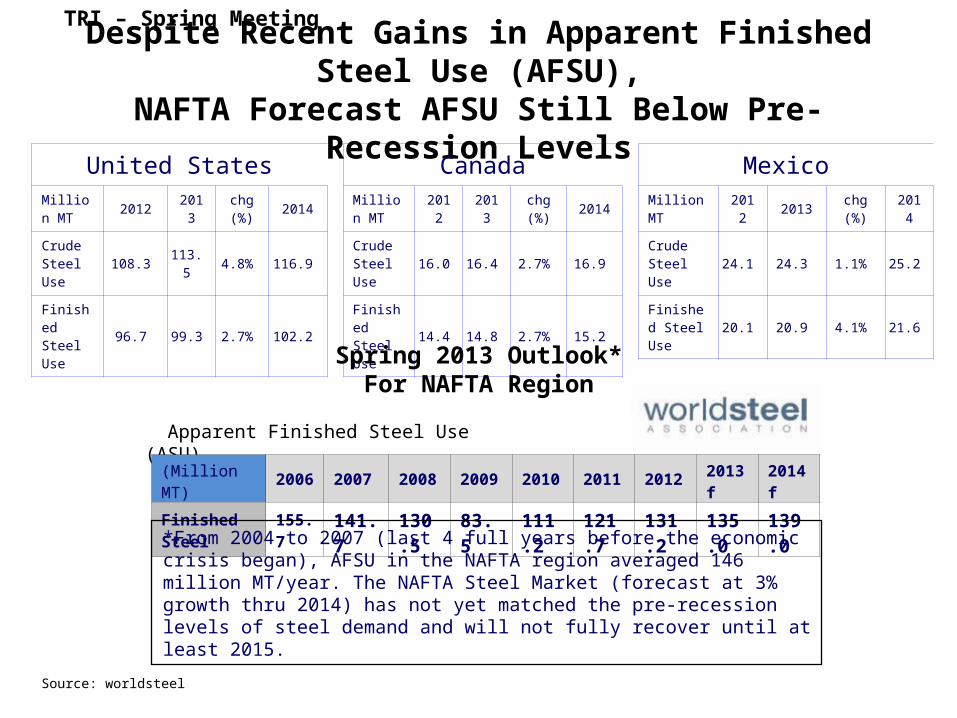
Despite Recent Gains in Apparent Finished Steel Use (AFSU),NAFTA Forecast AFSU Still Below Pre-Recession Levels
United StatesMillion MT 2012 2013 chg
(%) 2014
Crude Steel Use 108.3 113.5 4.8% 116.9
Finished Steel Use 96.7 99.3 2.7% 102.2
CanadaMillion MT 2012 2013 chg
(%) 2014
Crude Steel Use 16.0 16.4 2.7% 16.9
Finished Steel Use 14.4 14.8 2.7% 15.2
MexicoMillion MT 2012 2013 chg
(%) 2014
Crude Steel Use 24.1 24.3 1.1% 25.2
Finished Steel Use 20.1 20.9 4.1% 21.6
Spring 2013 Outlook*For NAFTA Region
Apparent Finished Steel Use (ASU)
(Million MT) 2006 2007 2008 2009 2010 2011 2012 2013f 2014f
Finished Steel 155.7 141.7 130.5 83.5 111.2
121.7 131.2 135.0 139.0
Source: worldsteel
*From 2004 to 2007 (last 4 full years before the economic crisis began), AFSU in the NAFTA region averaged 146 million MT/year. The NAFTA Steel Market (forecast at 3% growth thru 2014) has not yet matched the pre-recession levels of steel demand and will not fully recover until at least 2015.
TRI – Spring Meeting

2012 Steel Shipments by Market Classification
TRI – Spring Meeting
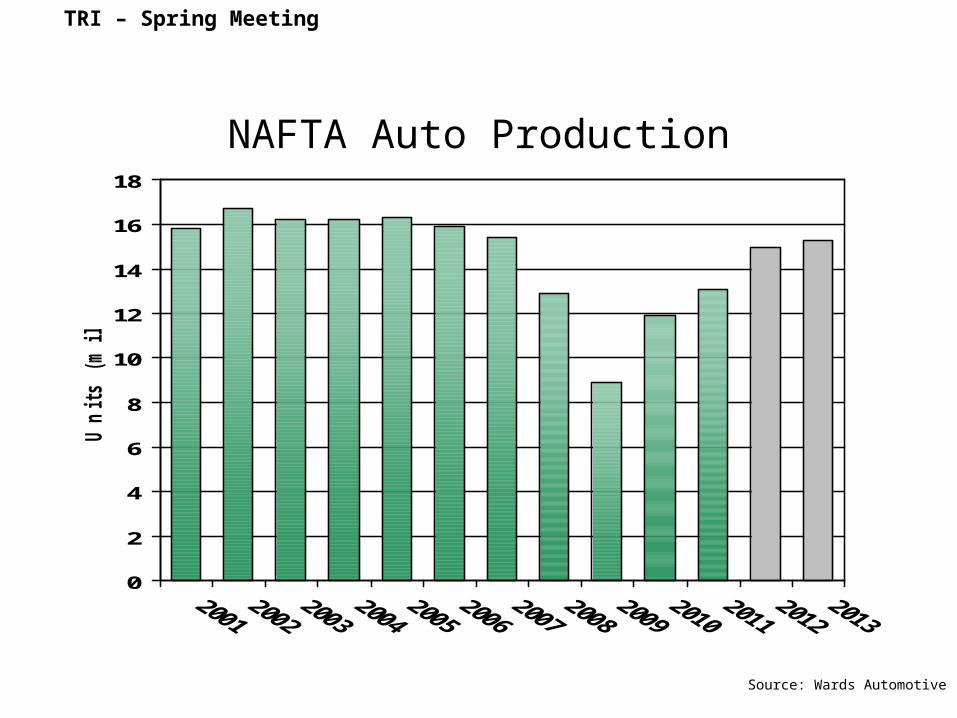
NAFTA Auto Production
Source: Wards Automotive
0
2
4
6
8
10
12
14
16
18
Units (m
illions)
TRI – Spring Meeting

Construction Activity*Non-building structures (e.g., infrastructure) not included
Source: McGraw-Hill (Dodge)
0
500,000
1,000,000
1,500,000
2,000,000
2,500,000
2007 2008 2009 2010 2011 2012 2013 2014 2015
Squa
re F
oota
ge (0
00)
Residential (1 & 2 family dwellings) Non-Residential
TRI – Spring Meeting

Energy Production
Source: Baker Hughes, U.S. Dept. of Energy
0
500
1,000
1,500
2,000
2,500
JA
N
AP
R
JU
L
OC
T
JA
N
AP
R
JU
L
OC
T
JA
N
AP
R
JU
L
OC
T
JA
N
AP
R
JU
L
OC
T
Ja
n
Ap
r
Ju
l
2008 2009 2010 2011 2012
RIG
CO
UN
T
$0.0
$2.0
$4.0
$6.0
$8.0
$10.0
$12.0
$ M
cf
Total RIGS
Verticle RIGS
Horizontal RIGS
Natural Gas Price at Wellhead
TRI – Spring Meeting
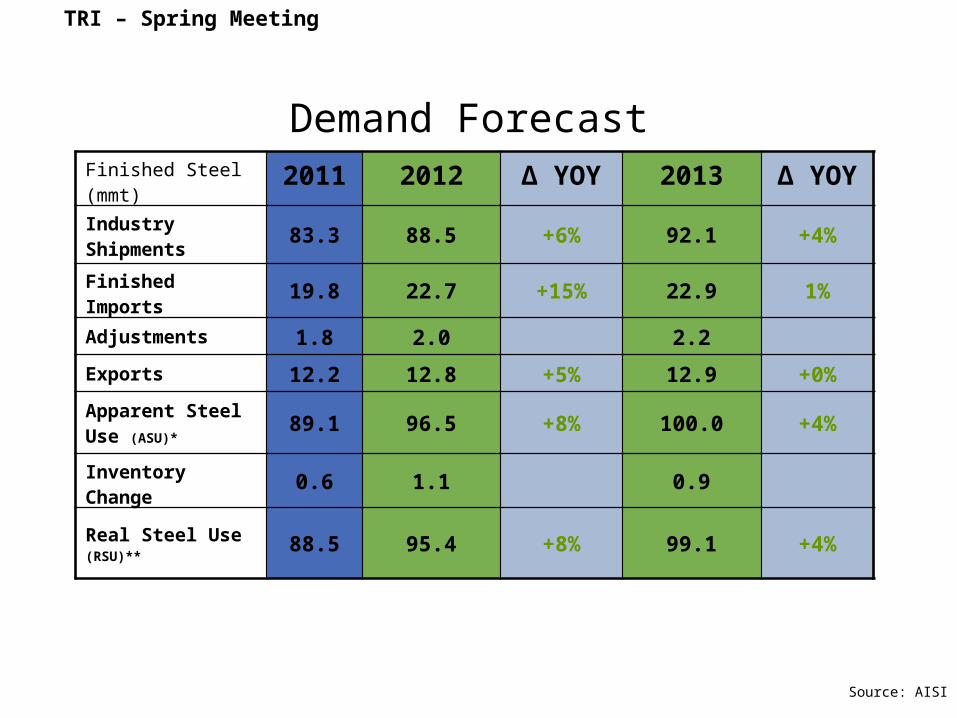
Source: AISI
Demand ForecastFinished Steel (mmt)
2011 2012 ∆ YOY 2013 ∆ YOY
Industry Shipments 83.3 88.5 +6% 92.1 +4%
Finished Imports 19.8 22.7 +15% 22.9 1%
Adjustments 1.8 2.0 2.2
Exports 12.2 12.8 +5% 12.9 +0%
Apparent Steel Use (ASU)*
89.1 96.5 +8% 100.0 +4%
Inventory Change 0.6 1.1 0.9
Real Steel Use (RSU)**
88.5 95.4 +8% 99.1 +4%
TRI – Spring Meeting

US Imports of Total Steel Products Up 17%
Source: U.S. Department of Commerce (Census Bureau)
2011 20120
5,000,000
10,000,000
15,000,000
20,000,000
25,000,000
30,000,000
35,000,000
40,000,000
28,515,276
33,474,583
Total Steel Imports (2011 vs 2012)Im
port
s (N
et
Ton
s)
TRI – Spring MeetingUS Steel Imports

Comparing 2012 to 2011 by product category:
• Semi-finished imports increased 14.2% to 6,772,056 metric tons;
• Flat product imports increased 16.4% to 9,550,032 metric tons;
• Pipe and tube imports increased 24.4% to 7,710,529 metric tons;
• Long product imports increased 14.6% to 5,191,504 metric tons;
• and stainless imports increased 13.5% to 1,143,515 metric tons.
TRI – Spring MeetingUS Steel Imports

Increase in Total Steel Imports is from Numerous Countries, Across the Globe
Source: U.S. Department of Commerce (Census Bureau)
0
1,000,000
2,000,000
3,000,000
4,000,000
5,000,000
Turkey Germany China Russia Japan South Korea Brazil
Impo
rts (N
T)
2011 vs. 2012 Total Steel Importsfrom Key Offshore Countries
2011 2012
+84% +24%
+34%
+74%
+30%
+30% +27%
TRI – Spring MeetingUS Steel Imports
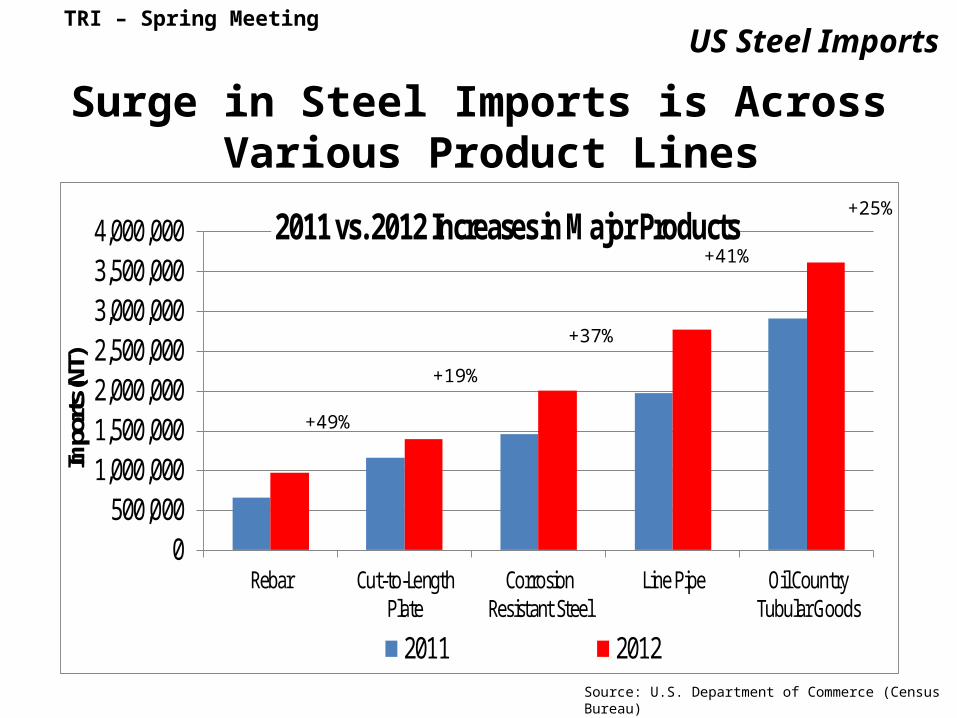
Surge in Steel Imports is Across Various Product Lines
Source: U.S. Department of Commerce (Census Bureau)
0500,000
1,000,0001,500,0002,000,0002,500,0003,000,0003,500,0004,000,000
Rebar Cut-to-LengthPlate
CorrosionResistant Steel
Line Pipe Oil CountryTubular Goods
Impo
rts (N
T)
2011 vs. 2012 Increases in Major Products
2011 2012
+49%
+19%
+37%
+41%
+25%
TRI – Spring MeetingUS Steel Imports

Factors in the Surge of Steel Imports
• Weakened global economy– Asian market downturn, large overcapacity of steel– European recession– U.S. market still weak
• Market interference by foreign governments:– Subsidies – Raw material export restrictions– Import restrictions on steel or steel containing products– Other interventions
TRI – Spring MeetingUS Steel Imports

• The US is a net importer of steel, yet domestic capacity is utilization only at appox 75%
• The US is the world’s largest exporter of scrap
• The US is a low cost steel producer
Expanding Future US Steel Production
The United States is unique among major steel producing nations:
TRI – Spring Meeting

• Is self-sufficient in steelmaking raw materials, especially scrap (2011 – generated 84mmt of scrap, but consumed only 55mmt)(~ 75%of production costs)
• Since 2002, imports 26.2% of steel consumption, while capacity utilization only appox 80%
• Has relatively low energy prices
• Has high productivity to offset wage rates
• Has the world’s largest capital market
TRI – Spring MeetingComparative Advantages in US
The United States:

• Need policies that encourage expanded domestic steel production to utilize domestic capacity
• Foreign export restrictions on steel scrap have many negative consequences
• Expanding US steel production through the conversion of scrap into steel would create high-paying jobs, increase GDP, reduce the trade deficit, and provide added tax revenues
• The expansion must occur without massive government investments, subsidies, and interventions; but needs to be based on comparative economics and market forces
• Significant amounts of imports should be replaced with domestically produced steel
TRI – Spring Meeting
Key Points
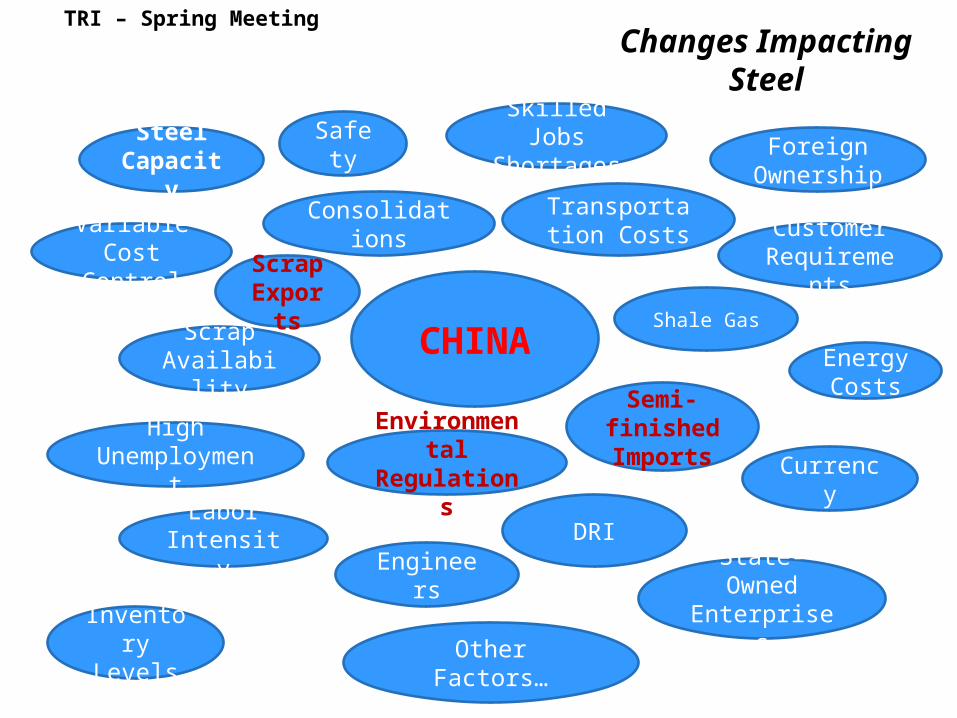
TRI – Spring MeetingChanges Impacting Steel
Steel Capacity
Variable Cost Control
Engineers
Scrap Availability
High Unemployment
Labor Intensity
Inventory Levels
CHINA
Safety
ConsolidationsCustomer
Requirements
Environmental Regulations
Foreign Ownership
Transportation Costs
Shale Gas
Energy Costs
Currency
State-Owned Enterprises
Other Factors…
Skilled Jobs Shortages
Semi-finished Imports
DRI
Scrap Exports

TRI – Spring Meeting
Challenges Impacting Steel
Scrap Exports
Restrictions
Import Penetration
SOEs
Capital
Scrap Price Volatility
China, China, China Gov’t Subsidies
Trained Workforce
Abundant Natural Gas is a
“Game Changer”
WTO Disputes
Health Care Costs
Tax Manipulation
& Reforms
Trade Restrictions
Another Recession
Indirect Steel %
Environmental Regulations
Global Steel Capacity Growth
Role of Developing World
Anti-Competitive
Behavior
Labor Regulations
Infrastructure Investment
Currency Undervaluation
EAF Growth

Political Climate/Tone
• Budget Issues – Impact?
• Bipartisanship versus Gridlock?
• Benefits of expanded US steel production?
What’s Happening in Washington?TRI – Spring Meeting
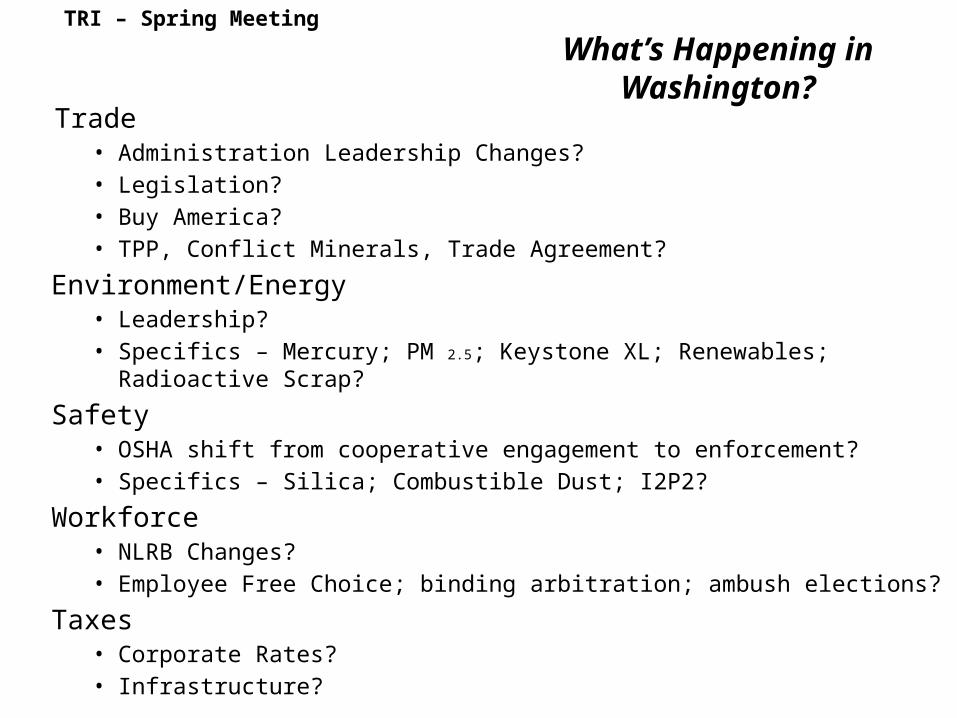
Trade• Administration Leadership Changes?• Legislation?• Buy America?• TPP, Conflict Minerals, Trade Agreement?
Environment/Energy• Leadership?• Specifics – Mercury; PM 2.5; Keystone XL; Renewables; Radioactive Scrap?
Safety• OSHA shift from cooperative engagement to enforcement?• Specifics – Silica; Combustible Dust; I2P2?
Workforce• NLRB Changes?• Employee Free Choice; binding arbitration; ambush elections?
Taxes• Corporate Rates?• Infrastructure?
What’s Happening in Washington?TRI – Spring Meeting

Final Thoughts
• Volatile and fragile times continue. There is a “steel cycle.”• U.S. is in a traffic jam, moving slightly forward, but don’t know other
consequences. Gridlock continues
• Uncertainty will continue.• Increasing steel capacity without regard to market forces or comparative
advantage is wrong
• Reasons for optimism in steel in North America:– Favorable gains with reemerging manufacturing base, including benefits of shale gas– Scrap-based, 75% of cost – local supply– Low cost on global basis (energy is positive, labor less than 10%, others have higher
transportation costs)– Relatively strong market and resiliency– Better & stronger company balance sheets
TRI – Spring Meeting


