
University of Birmingham
Digging Deep to Compete:McGowan, Danny
DOI:10.1111/joie.12157
License:Other (please specify with Rights Statement)
Document VersionPeer reviewed version
Citation for published version (Harvard):McGowan, D 2017, 'Digging Deep to Compete: Vertical Integration, Product Market Competition and Prices',Journal of Industrial Economics, vol. 65, no. 4, pp. 683-718. https://doi.org/10.1111/joie.12157
Link to publication on Research at Birmingham portal
Publisher Rights Statement:This is the peer reviewed version of the following article: McGowan, D. (2017), Digging Deep to Compete: Vertical Integration, ProductMarket Competition and Prices. J Ind Econ, 65: 683–718. doi:10.1111/joie.12157, which has been published in final form at10.1111/joie.12157 . This article may be used for non-commercial purposes in accordance with Wiley Terms and Conditions for Self-Archiving.
General rightsUnless a licence is specified above, all rights (including copyright and moral rights) in this document are retained by the authors and/or thecopyright holders. The express permission of the copyright holder must be obtained for any use of this material other than for purposespermitted by law.
•Users may freely distribute the URL that is used to identify this publication.•Users may download and/or print one copy of the publication from the University of Birmingham research portal for the purpose of privatestudy or non-commercial research.•User may use extracts from the document in line with the concept of ‘fair dealing’ under the Copyright, Designs and Patents Act 1988 (?)•Users may not further distribute the material nor use it for the purposes of commercial gain.
Where a licence is displayed above, please note the terms and conditions of the licence govern your use of this document.
When citing, please reference the published version.
Take down policyWhile the University of Birmingham exercises care and attention in making items available there are rare occasions when an item has beenuploaded in error or has been deemed to be commercially or otherwise sensitive.
If you believe that this is the case for this document, please contact [email protected] providing details and we will remove access tothe work immediately and investigate.
Download date: 01. Mar. 2020
brought to you by COREView metadata, citation and similar papers at core.ac.uk
provided by University of Birmingham Research Portal

DIGGING DEEP TO COMPETE: VERTICAL
INTEGRATION, PRODUCT MARKET COMPETITION
AND PRICES∗
DANNY MCGOWAN†
This article establishes a causal effect of product market competition on vertical integra-
tion. I exploit a hitherto unexplored natural experiment in the US coal mining indus-
try and a unique mine-level organizational data set. Following an exogenous increase in
product market competition the incidence of vertical integration fell by 33% within the
treatment group relative to the counterfactual. I find novel evidence that transition to
the lower degree of vertical integration is driven by competition reducing market prices by
32% which decreased the incentive to conduct vertical mergers. I discuss several possible
interpretations of these changes.
∗I am grateful to the editor, Andrew Sweeting, two anonymous referees, Pol Antras, Gregory Crawford,
Silke J Forbes, Luke Garrod, Jonathan Haskel, Roberto Hernan Gonzales, Ali Hortacsu, Richard Kneller,
Rocco Macchiavello, Giordano Mion, Konstantinos Serfes and participants at the ASSA Meetings, Interna-
tional Industrial Organization Conference, the European Association for Research in Industrial Economics,
Loughborough University, University of Nottingham and the Royal Economic Society for helpful comments
and suggestions.†Author’s affiliation: University of Nottingham. Email: [email protected]. Tel: +44
(0)155 846 7420.
1

I. INTRODUCTION
UNDERSTANDING THE BOUNDARIES OF THE FIRM typically focuses on internal
factors such as incentives or bargaining frictions between suppliers (e.g. Williamson [1975],
Grossman and Hart [1986]). Although transactions costs and asset ownership may help
determine the relationship between constituents in a supply chain, the impetus for verti-
cal integration can also come from elements of the external operating environment. One
such factor identified by several authors is competition (McLaren [2000], Thesmar and
Thoenig [2000], Aghion et al. [2006], Vroom [2006], Acemoglu et al. [2010], Conconi et al.
[2012], Legros and Newman [2013]). This focus is natural considering that over the past
few decades a number of economic forces have strengthened competition in product mar-
kets. Declining transport costs, falling tariffs and myriad episodes of trade liberalization
have increased international competition. Competition in domestic markets has intensi-
fied due to deregulation. At the same time, firms have tended to become less vertically
integrated as outsourcing and offshoring have become more prevalent. However, despite
the extensive theoretical literature there is little empirical evidence to support the claim
that competition affects vertical integration.
In this article, I investigate whether changes in product market competition affect
vertical integration using a natural experiment in the US coal mining industry. In this
industry mines rely on preparation plants for cleaning services that are essential before coal
can be shipped to power stations. To the best of my knowledge, this is the first article
to use a credible identification strategy to show that exposure to competition leads to
changes in vertical integration and to establish a clear causal mechanism driving changes
in firm boundaries. I also find novel evidence that competition matters for organizational
design through its effect on market prices.
The heart of my identification strategy is the Staggers Rail Act of 1980 (SRA) which
deregulated the railroad sector. Before 1980 railroads were forced to follow a regulated
pricing schedule established by the Interstate Commerce Commission (ICC) during the
2

1920s. This complex arrangement set freight rates above market clearing levels and denied
railroads the right to independently set rates. As a result, pre 1980 the cost of transporting
coal was high and power stations purchased from local mines to minimize procurement
costs. Eastern mines (Appalachia and Illinois basins) therefore competed with one another
to supply Eastern power stations whereas Western mines (Powder River Basin (PRB) and
Unita basins) served Western power stations.
Deregulation granted railroads freedom to independently set freight rates. As the
market rate was below the regulated rate this caused a large fall in transport costs. Low-
cost PRB coal therefore became competitive in the Eastern market leading to more intense
competition as Eastern mines began competing with PRB mines to supply Eastern power
stations. However, there was no change in competition in the Western market because the
less developed Western rail network and the proximity of the Unita basin to power stations
in the region meant that PRB coal did not become more competitive there. Moreover, due
to geological idiosyncrasies the marginal cost of production is much higher for Eastern and
Unita mines compared to PRB producers. Despite the fall in transport costs it therefore
remained uneconomic to ship Eastern coal to Western power stations. Likewise shipments
of Unita coal to Eastern power stations remained uneconomic. These features ensure that
neither Eastern nor Unita producers experienced improvements in market access.
In essence, I study a setting where upstream vertical integration is a function of com-
petition downstream. Pre-1980 the Eastern coal market was competitive in the sense
that mines lacked market power (Joskow [1987]). The major change post-1980 was that
more efficient suppliers entered the Eastern market and were likely to increasingly en-
ter in future. Despite the absence of market power, competition increased in the East as
PRB producers gained Eastern market share which put pressure on Eastern mines’ output
volumes. This set-up is somewhat different from existing theories of vertical integration
where elimination of market power plays an important role.
My identification strategy exploits the natural experiment using difference-in-difference
estimations applied to unique mine-level organizational data. To establish causality I
3
leverage two sources of exogenous variation. First, time series variation in product market
competition comes through railroad deregulation. Deregulation was triggered by an unex-
pected switch of the regulatory body’s attitude towards regulation and was exogenous with
respect to coal mines’ organizational design. Second, the geographical distance between
the Eastern and Unita basins means there are two separate, yet similar, coal markets.
I use this cross-sectional variation to construct treatment (Eastern) and control (Unita)
groups. The estimations then compare the cross-time evolution of vertical integration
within treated mines with that in observationally similar control mines. Identifying the
causal effect of product market competition also requires that the control group consti-
tutes a valid counterfactual. To this end, I demonstrate that the treatment and control
groups display parallel trends.
I obtain the following key findings. Product market competition causes a 33% decrease
in the probability that a treated mine is vertically integrated relative to the counterfac-
tual. The estimate is highly statistically significant and robust to a host of considerations.
Clearly, one would expect the reduction in vertical integration to be largest among mines
that lie in closest proximity to the PRB for whom competition is most fierce. The data
support this view. Moreover, the transition to a relatively lower degree of vertical inte-
gration derives from a reduction in the frequency of vertical mergers within the treatment
group.
Next, I examine the underlying transmission mechanism. Falling market prices in the
face of competition appear to be key. Using difference-in-difference estimations applied to
detailed information on monthly shipments from coal mines to electricity power stations I
find that, relative to the control group, the free-on-board (FOB) price per million British
thermal units (mBtu) fell by 32% in the Eastern market following the competitive shock.1
Moreover, power stations reduce the quantity of coal purchased from Eastern mines by
around 43% compared to the counterfactual. These effects are consistent with an inward
1Measuring prices in mBtu terms ensures that I compare the same good (a standardized quantity of heatcontent) across all shipments. The data also contain detailed quality information for each shipment. Thepanel structure also allows me to include month-year fixed effects to eliminate all time-varying confounds.
4
shift of the Eastern market demand curve as power stations substitute Eastern for PRB
coal. Overall, the estimates suggest that competition triggers changes in organizational
choices because it reduces market prices and the incentive to vertically integrate.
This article’s main purpose is not to discriminate between competing theoretical expla-
nations, but to establish a robust causal relationship and transmission mechanism between
product market competition and vertical integration. Nevertheless, I discuss possible in-
terpretations of these findings. The idea that shocks to market prices provoke widespread
organizational restructuring throughout an industry is central to nascent Organizational
Industrial Organization (OIO) theories (Conconi et al. [2012], Legros and Newman [2013],
Serfes [2015], Alfaro et al. [2016]). In these models vertical integration enhances output
but imposes higher non-contractible private effort costs on managers. At high prices, the
additional output translates into high revenue which offsets the high effort costs. But at
low prices the increase in revenue does not sufficiently compensate firms for the additional
costs they must bear. Hence, it could be that in more competitive environments firms
prefer non-integration because the market price is too low for integration to be profitable.
Perhaps the most closely related article to this one is that by Alfaro et al. [2016].
Using a large cross-country, cross-industry firm-level data set they find evidence that
vertical integration is positively related to market prices. In contrast, the question I study
is how shocks to market structure affect vertical integration. While I also find that prices
matter for organization, the results provide novel evidence that the effect of competition on
vertical integration is mediated through market prices. My economic laboratory also offers
important advantages. Focusing on a narrowly defined industry allows direct observation
of whether a firm is vertically integrated. Alfaro et al. [2016] rely on firm-level vertical
integration indexes which are computed based on the industry codes of the plants that
belong to a firm and aggregate input-output relationships. Vertical integration indexes
potentially contain measurement error where shipments between plants are low, leading
to attenuation bias in the average treatment effect. A second advantage of my set-up is
that shipments do take place between mines and the preparation plants they own whereas
5

in other industries integration is a device used to transfer intangible inputs rather than
facilitate shipments between plants (Atalay et al. [2014]).
Relatedly, the results are also consistent with a broad class of models in which vertical
integration requires fixed costs (McLaren [2000], Grossman and Helpman [2002], Antras
and Helpman [2004]). Elements of both explanations are operative in the coal mining in-
dustry. As I show below, vertical integration allows mines to increase output by scheduling
more production shifts. But integration also raises operating costs and incurs fixed costs.
Transition to the lower incidence of vertical integration might therefore reflect competition
reducing market prices such that the revenue gained from the additional output is insuf-
ficient to offset the integration costs. This argument is consistent with the reduction in
merger activity I observe among treated firms following the strengthening of competition.
However, the results also support any model in which vertical integration depends on the
level of quasi-rents and lower output prices erode those rents (Williamson [1975], Klein et
al. [1978], Baker et al. [2002]).2
Restructuring could also be driven by other economic forces. In the transaction-cost
paradigm, competition leads to fragmentation because an increase in the number of in-
put suppliers reduces ex post bargaining inefficiencies due to holdup threats (Williamson
[1975], Klein et al. [1978]). Alternatively, in more competitive environments firms may re-
structure by decentralizing decision making authority to managers with greater knowledge
of local operating conditions (Marin and Verdier [2003], Alonso et al. [2008], Guadalupe
and Wulf [2010]). Other reasons for fragmentation could be to reduce slack and increase
productivity by closing down the least productive parts of the production chain (Melitz
[2003]), or collinear energy shocks, macroeconomic factors and environmental legislation
that differentially affect the treatment and control groups. I explore these alternative
mechanisms but find little support for them in the data. A host of additional robustness
tests affirm the key results and exogeneity of treatment.
2Property rights models in the Grossman and Hart [1986] tradition could also explain the observed evidenceunder certain configurations of the parameters driving marginal costs.
6

My study bridges two literatures: organizational economics and market structure anal-
ysis in industrial organization. Bresnahan and Levin [2012] and Legros and Newman [2014]
recognize that uniting these distinct but complementary disciplines is a fruitful area for
research, and highlight the importance of empirical tests.
A small number of empirical studies have found associations between measures of com-
petition and vertical integration but emphasize non-price reasons for why these phenomena
are linked. For example, Balakrishnan and Wernerfelt [1986] highlight competition’s role
in enhancing market thickness which reduces bargaining frictions leading to less vertical
integration. Using a large data set of UK manufacturing firms Aghion et al. [2006] find a
non-monotonic relationship between competition and vertical integration and pinpoint the
role of transactions costs and property rights. Such effects are muted in the coal mining
industry where mines cannot relocate and investment incentives do not change through
time.
Finally, my article relates to the pioneering work of Joskow [1987,1990]. Whereas he
studies how physical asset specificity affects contract duration between mines and power
stations, I focus on vertical integration at a different point of the production chain. Joskow
[1987] presents evidence that power stations sign longer contracts with Western mines, in
part because they must make relationship-specific boiler investments depending on which
basin they source coal from. I find evidence consistent with Eastern power stations making
investments to allow them to burn PRB coal following the SRA and that this behavior
was motivated by the price advantages of PRB coal.
The rest of the article is structured as follows. Section II outlines the institutional
details and the economic laboratory. Section III describes the data. In Section IV I discuss
the empirical strategy and report econometric results. Section V deals with robustness
tests. Section VI concludes.
II. INSTITUTIONAL SETTING
This section provides an overview of the coal production chain, the contractual problems
7

vertical integration alleviates and background information on the legislative reforms that
underpin the identification strategy.
II(i). The US Coal Mining Industry and Production Chain
Figure 1 shows the areas where coal mines are located. In the east the Appalachia basin
stretches continuously from Pennsylvania in the north to Alabama in the south. The other
Eastern coal basin is the Illinois basin. In the West mines are located in two basins: the
Unita basin (Arizona, Colorado, New Mexico, Utah) and the Powder River Basin (situated
on the Montana-Wyoming border).3
[Insert Figure 1]
Coal production takes place either in underground or surface mines.4 The material
mines excavate is called run-of-mine (ROM) coal. This contains approximately 60% coal
ore with the remainder made up of contaminants such as rock, clay and mining equipment
that breaks off during excavation. The high non-ore content means that ROM coal must
undergo a series of cleaning procedures at a preparation plant before it can be shipped
to an electricity power station. Preparation plants are capital intensive facilities that use
various machinery to separate the coal ore from the contaminants and then break it into
uniform particle sizes that are suitable for burning.5 The processed coal ore is then loaded
onto unit trains, barges or trucks for delivery to a power station. Trains deliver 74% of
shipments, and are more common for long-distance shipments, whereas barges (6%) and
trucks (17%) are somewhat less important.
This part of the production chain is therefore very simple, comprising a single upstream
3I exclude lignite mines from the analysis on the grounds that lignite’s characteristics and productionmethods are not the same as for coal.
4The choice of mining process is a function of the stripping ratio: the number of tons of non-coal material(overburden) that must be removed in order to mine one ton of coal. Where stripping ratios are highsurface mining is uneconomical and underground methods are preferred.
5ROM coal is first washed to separate the ore from contaminants. Afterwards it is dried to remove excessmoisture and then broken. All coal must undergo cleaning before it can be sold (Buessing [2014]).
8

(mines) and downstream (preparation plants) industry.6 Importantly, coal cleaning mar-
kets are local in nature due to high transport costs. Owing to its high non-ore content,
ROM coal is bulky which makes it prohibitively expensive to ship long distances to a
preparation plant. Mines use trucks to haul ROM coal to preparation plants not further
than 10 miles away although the preference is for shorter journeys (Buessing [2014]). The
coal cleaning industry is therefore made up of a collection of heterogeneous local markets.
II(ii). The Costs and Benefits of Vertical Integration
Discussions with industry experts and evidence reported in industry journals indicates
that preparation plants source ROM coal from several local mines to diversify the risk of
disruptions to input supplies.7 Non-integrated mines therefore compete with one another
for cleaning time at local preparation plants. As a result, mines face uncertainty surround-
ing when their ROM coal will be cleaned which makes it harder to agree delivery schedules
with power stations. This uncertainty leads mines to schedule a sub-optimal number of
production shifts to avoid incurring costs related to hiring and laying off workers. Con-
tracting cannot solve these issues because preparation plants would remain exposed to
supply assurance concerns.8
Vertical integration helps alleviate these problems because it transfers decision making
authority to mines thereby providing them with secure access to preparation plant services.
Certainty surrounding cleaning time allows integrated mines to schedule more production
shifts resulting in higher output. However, there are clear costs involved as well. In
addition to the fixed cost of either buying or building a preparation plant, integration
requires greater managerial attention to schedule deliveries to preparation plants and
supervise the additional production shifts.
6There are very few observations of mines or preparation plants owned by power stations.7Accidents are common within mines and frequently lead to extended periods of production downtime asthe affected area is made safe. During this time deliveries to preparation plants are suspended.
8Preparation costs account for approximately 5% of the delivered price per ton of coal (Bhagwat [2009]).
9

[Insert Table I]
Supportive descriptive evidence is reported in Table I which reports the within-mine
responses of productivity and managerial input variables to changes in vertical integra-
tion. Column 1 shows that a mine which transitions from non-integration to vertically
integrated increases the number of production shifts by approximately 0.5 per day. Given
the average non-integrated mine has 0.5 daily production shifts, this is a large effect. Col-
umn 2 provides evidence that vertical integration is associated with significant improve-
ments in mines’ labor productivity: mines which integrate require 44% fewer employees
to produce one thousand tons of coal.9 Finally, columns 3 and 4 show that transition
to vertical integration leads to a substantial increase in managerial inputs, as proxied by
office workers and annual office hours worked, respectively. These are strong managerial
proxies as office workers are typically engaged in administering the mine’s internal affairs
and scheduling deliveries to preparation plants. The number of office workers and office
hours worked increase by approximately 189% and 176%, respectively. Integration deci-
sions therefore largely depend on whether the additional output (and revenue) brought by
vertical integration offsets the higher costs.
Despite the advantages of vertical integration only around 9% of mines are integrated.
This suggests the costs of vertical integration are high. Industry journals report that the
fixed costs of building or purchasing a preparation plant range between $12m and $18m.
Moreover, it is costly to employ managers. Fiscor [2010] reports that historical manage-
rial base salaries typically started at $100,000 per annum with additional bonus payments.
II(iii). Railroad Deregulation
Central to the identification strategy is an exogenous change in competition within the
coal mining industry triggered by railroad deregulation. Historically, US railroads were
9Non-integrated mines require 0.3 workers to extract 1,000 tons of coal versus 0.17 for vertically integratedmines.
10

subject to stringent regulations imposed by the ICC. To prevent operators from exercising
market power the ICC established a rate schedule during the 1920s that set high freight
rates and low rates for agricultural and passenger traffic.10 This complex set of regulations
prohibited railroads from independently setting rates. Moreover, because the regulated
freight rate was set above the market-clearing rate, pre-1980 the cost of shipping coal was
high and rail traffic primarily consisted of agricultural goods (Slack [2013]).
The ICC’s decision making body comprised a chairman and 10 commission members.
To instigate reforms the governing committee had to reach a majority decision. Chairmen
and members were directly appointed by the US President, although the President could
not remove them at will (Derthick and Quirk [1985]). Hence, new appointments could
only be made when a position became available.
Both the Ford and Carter administrations favored deregulation and chose to appoint
pro-deregulation ICC members when possible. Despite these efforts contemporary ob-
servers expected the ICC to maintain a tight regulatory focus as pro-regulation members
commanded a handsome majority. Unexpectedly, in April 1980 three ICC positions be-
came simultaneously available and President Carter appointed pro-deregulation members.
This altered the balance of power within the ICC and gave the pro-deregulation wing a
majority for the first time.
[Insert Figure 2]
The ICC quickly adopted a set of measures that were subsequently codified by Congress
in the Staggers Rail Act of 1980. The SRA allows railroads to independently set rates.
This led to a substantial decline in freight rates as the market rate railroads charged was
substantially below the regulated rate (MacDonald [1989]). Figure 2 clearly illustrates
the effect of the SRA on railroad freight rates (prices). On average, between 1980 and
10The 1906 Hepburn Act, the 1910 Mann-Elkins Act and the 1920 Transportation Act authorized the ICCto regulate rates, removing this authority from the states. In addition, the ICC’s mandate allowed itto oversee mergers and to regulate entry, abandonment of routes and investment decisions (Eakin et al.[2010], FRA [2011]).
11
1987 rates fell by 40% in real terms. Deregulation also triggered a substantial increase in
railroad productivity as unproductive firms exited and their market share was reallocated
to more productive survivors. Remaining incumbents capitalized on economies of scale
(Slack [2013]). Eakin et al. [2010] report that 80% of the post 1980 productivity gains
were passed on to shippers through lower freight rates.
II(iv). Treatment Exogeneity
To gain insights into the motives behind deregulation I screen a number of historical and
more recent accounts. The evidence indicates that the preferences of Presidents Ford
and Carter were the key driving force. Presidential backing for deregulation derived
from arguments articulated by economists showing that market-based solutions yielded
superior outcomes to regulation (McBride [1983], Slack [2013]). Derthick and Quirk [1985]
highlight that both Presidents’ views were partly shaped by contestability theory and
a view among economists that regulations were contributing to unjustifiable costs. For
example, regulated railroads were prevented from abandoning low-density and unprofitable
routes and were mandated to employ excess labor such as firemen. Deregulation was
considered to be a means of eliminating such inefficiencies and creating better incentives
to innovate and maintain the rail network (Winston [2005]). In short, the impetus behind
railroad deregulation were considerations that were unrelated to vertical integration within
coal mines or developments in the coal mining industry more generally.
III. DATA
I use three data sets in the empirical analysis: mine-level data on ownership structure,
information on shipments from mines to electricity power stations, and coal transport cost
data.
III(i). Organizational Data
12

The Mine Safety and Health Administration (MSHA) release annual mine-level data on
employment, production, hours worked, geographical location (latitude, longitude), owner
name, delegation status (independently operated, operating subsidiary, or contractor) and
union status. Each mine has a unique identifier that permits tracking through time and
data are available from 1972 to 1987. In total this provides an unbalanced panel containing
4,147 mines and 21,525 observations.
The MSHA release similar information for preparation plants and the data also con-
tain an identifier variable. I classify a mine as vertically integrated if there is an on-site
preparation plant (the mine and preparation plant identifiers match) or if the mine owns
a preparation plant within a 10 mile radius. The reason for this demarcation is that ROM
coal is hauled to preparation plants using trucks. Trucking rates, load size regulations,
and local public opinion make it costly to travel long distances (Buessing [2014]). Together
these factors place a geographic limit on the area from which preparation plants source
coal to not much more than a 10 mile radius, although Buessing [2014] notes that the
preference is over a shorter distance. Consistent with previous evidence 85% of mines in
the sample lie within 10 miles of the nearest preparation plant. The median distance is
5.7 miles.11
[Insert Table II]
Panel A of Table II tabulates the mine-level variables used in the econometric analysis.
On average, approximately 9% of mines are vertically integrated and 12% undergo vertical
reorganizations during the sample period. In total 418 mines vertically integrate (merger)
whereas 121 become non-integrated (divest). Approximately 28% of mines are unionized
while 33% belong to multi-plant firms (firms owning more than one mine). The average
level of labor productivity in the sample is 2.49 tons per worker hour and the average
11The findings are robust to excluding mines located further than 10 miles from the nearest preparationplant.
13

mine produces around 0.24 million tons of coal per annum. 47% of mines are delegated,
that is, operated either by a subsidiary or contractor rather than directly by the corporate
headquarters.
I also merge in a number of variables which capture elements of the external operating
environment. For example, to capture demand conditions I use the the generation capacity
of coal-fired power stations and the real (2009 US$) average price per mBtu of coal, oil and
gas in the mine’s state. These variables are taken from the Energy Information Authority
(EIA). Mine entry and exit rates within each mine’s market (defined as a 10 mile radius)
are included to capture other competitive forces. I proxy bargaining frictions using the
mine-to-preparation plant ratio (weighted by capacity) within the mine’s market. Higher
values correlate with more severe frictions as preparation plants have greater outside
options. There are 6.58 mines per preparation plant within the average mine’s market.
Finally, the data contain variables such as the year the mine first opened and seam
height in the mine to proxy extraction costs. State-level measures of proximity to the PRB
(estimated using a gravity model and discussed later), distance to the PRB and the ash
content of coal (%) are included. I also retrieve the GDP growth rate in the mine’s county
(BEA), the volume of bank lending in the county (Chicago Fed) and dummy variables
capturing whether the state a mine is located in has deregulated intra- and inter-state
bank branching (FDIC). There are no obvious trends in the control variables. For further
details on the variables and their construction see Online Appendix A.
Two important advantages of the coal mining laboratory are noteworthy. First, I can
directly observe vertical integration based on a preparation plant’s owner. This eliminates
attenuation bias arising through measurement error which is possible when firm-level ver-
tical integration indexes are constructed based on the goods a firm produces in each of its
plants and aggregate input-output relationships among those goods. A second advantage
is that vertically integrated mines ship ROM coal to the preparation plants they own.
In this setting integration is not simply a device used to facilitate transfers of intangible
14

knowledge capital (Atalay et al. [2014]).12
III(ii). Coal Shipments Data
Data on coal shipments from mines to power stations are taken from EIA Form 423.
This source collects fuel receipts and fuel quality for each shipment to a fossil-fuel power
station with a generating capacity of 50 megawatts (MW) or more. The data are highly
representative given these power stations account for 95% of coal-fired electricity capacity
and 96% of coal consumption. For each shipment I observe the power station that bought
the coal, the quantity of fuel delivered (both tons and mBtu), the ash and sulfur content
(measured in %) of the coal, the real FOB mine price per mBtu (in 2009 US$ values), coal
mine state of origin, and the type of mine that supplied the coal (surface or underground).
This information is available at a monthly frequency across the years 1972 to 1987. Panel B
of Table II shows the average price per mBtu is 3.65 (ln); the sulfur and ash content in the
mean shipment is 0.52% and 2.52%, respectively; 30% of shipments are from underground
mines.
I also calculate the total quantity of coal each power station purchases from each state
by aggregating the shipments data to the power station-state level. That is, for each
power station I calculate the total amount of coal purchased from mines in state s in each
month-year. The average power station buys 27.87 (ln) mBtu and 10.94 (ln) million tons
of coal.
III(iii). Transport Costs Data
12Reports in the annual US Preparation Plant Census, an industry journal published by Coal Age, showextensive shipments from mines to their locally owned preparation plants. Further evidence of tradeflows can be found in Fiscor [2013,2014] who reports that accidents that cause downtime at preparationplants disrupt production at owners’ mines and vice versa. Although these reports are for recent peri-ods, discussions with industry experts indicate the evidence applies to earlier years as well. Moreover,unreported regressions show that accidents within a mine reduce employment, a key factor of productionin preparation plants, in the owners’ local preparation plants reinforcing the evidence that mines relyupon their preparation plants for cleaning services.
15

Transport cost data is available through the EIA Coal Transportation Rate Database
(CTRD). Using this information I calculate the real delivered price per mBtu (FOB mine
price + transport costs) from each basin to the Eastern and Western markets. The CTRD
reports shipments from mines to power stations with a minimum generating capacity of 50
MW. For each shipment information is provided on the coal mine that supplied the coal,
the purchasing power station, the FOB mine price per mBtu, tons and mBtu shipped,
the year of the shipment, the state where the coal mine is located, the destination state,
transport mode (rail, barge, truck), transport costs, contract duration and contract type.13
These data are available for the period 1979 to 1987.
IV. EMPIRICAL STRATEGY AND RESULTS
IV(i). Identification Strategy
Key to the identification strategy is the effect of falling transport costs triggered by railroad
deregulation on the delivered price (mine price + transport costs) of coal. Before 1980
transport costs were high as railroad operators followed the 1920s rate schedule. It was
therefore expensive to ship coal over long distances and power stations relied on local
mines to minimize procurement costs. Consequently, Eastern (Western) mines competed
to supply Eastern (Western) power stations meaning there were two distinct coal markets
with no trade between them. The evidence in Panel A of Table III shows why this was
the case. An Eastern power station could source 1 mBtu from an Eastern mine for $6.74
but there are no shipments from other basins to Eastern power stations indicating the
delivered price was yet higher.14 There are no observations of shipments between Eastern
(Unita) mines and Western (Eastern) power stations indicating that it was not economic
13Contract type reports whether the contract is a fixed price, escalating price or other.14When I calculate a hypothetical pre-1980 delivered price of PRB coal to Eastern power stations using
data on PRB shipments to Western power stations and distance between the PRB and the averageEastern power station the value is $11.91 per mBtu. For Unita mines the value is even higher.
16

to ship coal between the separate markets.15
[Insert Table III]
Deregulation allowed railroad firms to independently set rates. As the market rate was
lower than the regulated rate this led to lower transport costs (Darmstadter [1997]). The
only effect of this change was to make PRB coal competitive in the Eastern market. Panel
A in Table III shows that post 1980 the delivered price per mBtu to an Eastern power
station fell to $1.90 and $1.94 from a PRB and Eastern mine, respectively. Eastern mines
therefore experienced an increase in competition from PRB suppliers.16 PRB coal became
competitive in the Eastern market because unlike other basins PRB coal is exceptionally
low cost to excavate due to the area’s geological idiosyncrasies which allow the use of more
efficient extraction methods.17 FOB mine prices are sufficiently low such that declining
transport costs made PRB coal a viable substitute to Eastern coal.
Despite the fall in transport costs there were no changes in the pattern of shipments
to other basins. The marginal cost of producing Eastern and Unita coal is higher relative
to PRB coal. Hence, the fall in transport costs did not make it economic to ship coal from
Eastern (Unita) mines to Western (Eastern) power stations: the delivered price remained
above power stations’ reservation price. Moreover, there was no change in the quantity
of PRB coal shipped to Western power stations because, 1) the less developed Western
rail network inhibited deliveries, and 2) Unita mines lie in close proximity to Western
power stations. Both factors meant that Unita mines could deliver 1 mBtu to Western
15Differences in mine-level prices across basins partly reflect differences in extraction costs due to geologicalidiosyncrasies. For example, PRB coal seams are uniquely thick and lie close to the surface resultingin low extraction costs and low prices. In contrast, Eastern seams are often thin and lie underground.While coal seams are thicker in the Unita basin they are not comparable to the PRB and the majorityare underground. Hence, while Unita basin prices are low they still far exceed PRB prices.
16Power stations’ boilers have to be customized to a certain degree depending on the characteristics of thecoal used. Table H.1 in the Appendix shows that Eastern power stations made investments to retrofittheir plants to take PRB coal. Profitability concerns appear to underlie these investments. Specifically,availability of cheap PRB coal allowed them to reduce input costs.
17The PRB has uniquely thick seams that lie close to the surface. Mines can use huge surface-miningequipment such as draglines and bucket excavators which are more technically efficient in extracting coalcompared to underground and even surface operations in the Unita and Eastern basins. Marginal costsand prices are therefore considerably lower in the PRB relative to other basins.
17

power stations more cheaply than PRB producers both pre and post 1980. The data in
Panel A of Table III confirms this. Further evidence that Unita mines did not experience
a change in competition post-1980 is provided in Panel B of Table III. Using t-tests I
compare the volume of shipments from the PRB to Western power stations between the
pre- and post-1980 periods. There is no significant change in the quantity of coal shipped
between periods irrespective of whether I measure quantity in tons or Btu shipped. PRB
shipments to the Western market were therefore stable through time and Unita mines did
not experience any changes in competition following deregulation.18
Hence, the only effect of railroad deregulation on the coal mining industry was an
increase in product market competition for Eastern mines following the entry of PRB
producers. Unita basin mines experienced no such competitive shock nor did they or
Eastern mines experience improvements in market access. Online Appendix Figure B.1
provides a succinct depiction of the identification strategy.
Isolating the organizational effects of product market competition relies on the follow-
ing difference-in-difference model
(1) viit = αi + βPostt + γEasti ∗ Postt + δXit + ϕt + εit,
where viit is a binary dependent variable equal to 1 if a mine is vertically integrated, 0
otherwise; Postt is a dummy variable equal to 1 for the years 1980 onward, 0 otherwise;
Easti is a dummy variable equal to 1 if a mine is located in either the Appalachia or
Illinois basin, 0 for Unita mines; Xit is a vector of controls; αi are mine fixed effects; ϕt
are year fixed effects although I also experiment with underground-year effects; εit is the
error term. PRB mines are excluded from most of the analysis because they receive a
positive demand shock which could potentially bias the implied counterfactual.19
18In unreported regressions there are no significant differences between Unita basin mines’ market sharein year t ∈ 1973, 1987 and the base year (1972), reinforcing the view that the control group did notexperience a change in competition across time.
19For example, given that PRB mines experience a positive demand shock post 1980 one would expect themto become more vertically integrated. Indeed, pre-treatment 12% of PRB mines were vertically integratedcompared to 14% post-treatment. Including them in the control group therefore risks contaminating the
18

Establishing causality rests on the SRA being exogenous with respect to firm bound-
aries. Meeting this criteria requires that Postt is uncorrelated with difficult-to-observe
omitted determinants of coal mines’ vertical structure contained in the error term of
equation (1). From the discussion in Section 3 it is clear that the SRA was introduced
for reasons unrelated to coal mines’ integration status or matters in the industry more
generally. Moreover, the SRA was not introduced due to coal mines’ organizational form.
Rather deregulation was an unanticipated shock triggered by Presidents’ desire to elimi-
nate railroad inefficiencies and create better incentives to maintain the rail network (Eakin
et al. [2010], Caves et al. [2010]). Both facts rule out the possibility that estimates of γ are
contaminated by endogeneity bias. Consistent with the absence of simultaneity bias, the
parallel trends and falsification tests reported below clearly demonstrate that anticipation
effects are not present.
While the SRA was an unanticipated shock there are a number of other shocks which
may have affected coal mines during the 1980s. For example, there was a major recession
which differed in its severity across regions, oil prices changed dramatically in response
to the oil crises and there were changes to environmental legislation and natural gas
generating capacity, a substitute fuel. I directly control for such forces by including them
as covariates in equation (1) and later test the robustness of my results to differential
shocks to these factors between the treatment and control group.
Following Bertrand et al. [2004] the standard errors are block bootstrapped at the
mine level to account for possible autocorrelation in ownership structure. However, the
results are no different when I cluster the standard errors at the mine, basin, or double
cluster at the mine and basin-year levels.20
IV(ii). Results
implied counterfactual as there will be some mines (the PRB ones) which will also react to the treatmentpost 1980. In turn this would bias the average treatment effect estimates.
20See Online Appendix Table C.1 for further details. Bertrand et al. [2004] highlight that block bootstrap-ping is appropriate in dealing with autocorrelation in the dependent variable in a difference-in-differenceframework.
19

The validity of difference-in-difference estimation also requires that the control group
represent a valid counterfactual. That is, in the absence of treatment organizational
design within the treatment group would have evolved in a similar fashion to that in the
control group. In other words, the treatment and control groups should have parallel
trends. To test this identifying assumption I estimate the equation
(2) viit = αi + Y eart + γtEasti ∗ Y eart + εit,
where αi are mine fixed effects; Y eart are year dummy variables; εit is the error term.
The coefficients γt indicate whether there were significant differences in the incidence of
vertical integration between the treatment and control groups in year t.
Figure 3 shows that the pre-treatment trends in vertical integration within the treat-
ment and control groups are indistinguishable, indicating that the control group represent
a valid counterfactual.21 However, there is a clear divergence in ownership structure post-
1980. From 1983 onward Eastern mines become significantly less vertically integrated.
Considering how abrupt this change is, one may question why did organizational form not
respond immediately to the SRA. The reason is that it took time for railroad firms to
instigate changes to their own operations and for the increase in competition to manifest
(Winston [2005]). The data in Figure 2 shows that freight prices began to fall from 1983.
Once these changes took effect, PRB producers began shipping coal to the Eastern market
and product market competition intensified.
[Insert Figure 3] [Insert Table IV]
It is also critical that both the treatment and control groups had similar opportunities
for vertical integration as otherwise any relationship may be mechanical.22 Column 1 in
21See Online Appendix Table B.1 for a summary of the treatment and control groups’ observable charac-teristics.
22For example, if all mines in the treatment group were already integrated before 1980 they would have nointegration possibilities and any relationship would be driven by developments within the control group.
20

Table IV shows that this was not the case. The incidence of vertical integration in the
two groups is very similar before 1980. However, the divergence in ownership structure
between the treatment and control groups post 1980 is again evident. The patterns in
columns 2 and 3 of Table IV also convey first evidence that the reduction in vertical
integration is driven by competition preventing treated mines from integrating.
Although the diagnostic tests constitute first informal evidence that increasing product
market competition leads to a reduction in vertical integration, they do not pin down a
precise estimate of the average treatment effect. I therefore turn to regression analysis. In
Table V I report the estimation results of the effect of competition on vertical integration
using equation (1). The results in column 1 of Table V condition only on mine and year
fixed effects. The Post coefficient is positive and statistically significant, indicating that
vertical integration increased within the control group through time. This reflects the
increase in demand for Western coal as coal-fired electricity capacity generation capacity
expanded in the region, shown in Figure 4. Following Legros and Newman [2013] one
would expect the higher demand to lead to higher market prices and an increase in the
incidence of vertical integration.23
The economic magnitude of the East-Post coefficient is equal to -0.11 in column 1 of
Table V. By way of comparison, the average incidence of vertical integration in the sample
is 9% indicating a large effect. The average treatment effect is also highly statistically
significant and translates into a 33% decrease in the probability of vertical integration
among treated mines relative to the counterfactual. Hence, more intense product market
competition causes a reduction in vertical integration.24
23A related possibility is that Western mines responded to competition from PRB producers by makinginvestments to improve efficiency and keep out PRB coal. Better organization of the production chainis one means through which they may achieve efficiency gains. In unreported regressions I use fixedeffects models to investigate whether the volume of PRB shipments to a Western state explain verticalintegration and labor productivity within Western mines. I find no significant associations in either case,reinforcing the view that Western mines were unaffected by the SRA.
24Considering the similarities in demand patterns shown in Figure 4 it seems plausible that absent theSRA Eastern mines would have tended to become more vertically integrated as demand from Easternpower stations increased through time. However, the increase in competition acted to lower the incidenceof vertical integration in the East compared to this counterfactual.
21

[Insert Figure 4] [Insert Table V]
Next, I introduce mine-level covariates into the regression model. The estimates in
column 2 of Table V continue to show a negative and statistically significant reduction in
vertical integration among treated mines following the competitive shock. The change in
competition is therefore essentially random at the mine level such that the entry of PRB
producers into the Eastern market does not systematically coincide with adjustments to
mine characteristics. Economically, some of the mine-level controls have quite important
effects. Unionized mines are approximately 11% less likely to be vertically integrated. The
point estimate on the multi-plant firm variable indicates that mines belonging to firms with
more than one mine are 8% more likely to be vertically integrated. Labor productivity is
positively associated with vertical integration but only at the 10% significance level.
To assess the importance of other market forces, the results in column 3 include controls
for demand-side forces. Vertical integration is also more likely in environments where
demand is high. Specifically, generation capacity is positively and significantly associated
with integration. I also find a relationship between prices and vertical integration status:
a one standard deviation increase in the price of coal is associated with a 4.8% increase in
the probability that a mine is vertically integrated. I include the oil and gas price in mine
i’s state as control variables to ensure that the average treatment effect of product market
competition is not simply capturing developments in the wider energy sector rather than a
change in competition within the Eastern coal market. For example, changes in substitute
fuel prices may lead power stations to switch from using coal to another fuel source or
vice versa. Although both the oil and gas price coefficients are positive and statistically
significant, the key finding remains robust to including these variables in the model.
The estimates in column 3 of Table V also condition on mine entry and exit rates to
capture other sources of competition. Vertical integration is positively related to entry
and negatively related to exit and both coefficients are statistically significant. The di-
rection of the effects are consistent with entering mines amplifying bargaining frictions by
22

increasing preparation plants’ outside options whereas exit has the reverse effect. Online
Appendix Table C.2 shows that the results are also robust to adding additional controls
for preparation plant entry and exit rates in the mine’s market.
To capture differential trends and developments that asymmetrically affect under-
ground relative to surface mines through time, I append equation (1) with underground-
year fixed effects. These eliminate any time-varying forces that differentially affect un-
derground and surface mines’ organization structure, such as the introduction of new
technologies. The results in Table V column 4 are robust to this change.
Could the average treatment effects be picking up anticipation effects? Another way
to test the exogeneity assumption is to generate placebo shocks. I therefore create a
dummy variable Post75 (equals 1 for the years 1975 to 1979, 0 otherwise) and interact it
with the East dummy variable. As competition did not change until after the SRA was
implemented, the null of zero effect on the East-Post75 interaction is true. This is the
case in column 5 where the placebo interaction coefficient is close to zero and statistically
insignificant. This reinforces the view that the shock to product market competition
was exogenous: Eastern mines did not begin to change their organizational design in
anticipation of the treatment.
A concern might be that mines in the East are older, have higher costs or lower recovery
rates. Such factors might generate a trend towards less vertical integration through time if
maintaining a steady supply of ROM coal to preparation plants is an important motive for
integration. To control for these effects I interact the Post dummy with a vector of mine
characteristics. In addition to the union, multi plant and labor productivity variables I
also use the mine’s opening year and seam height, both of which are time invariant, and
a triple interaction between age, seam height and the post dummy. The intuition behind
these variables is that mines that have been in use for a long time or have thin seams of
coal have higher operating costs or lower recovery rates. Despite including these additional
controls the results in column 6 of Table V show that competition remains an important
and statistically significant determinant of vertical integration.
23

Column 7 of Table V provides estimates based on a sample that also includes PRB
mines. The effect of competition on vertical integration remains unchanged from before.25
[Insert Table VI]
Central to the empirical strategy is the claim that the SRA triggered an increase
in product market competition within the coal mining industry. Here I present further
evidence that competition lies at the heart of the results.
Column 1 in Table VI presents estimates of equation (1) using mines’ output as the
dependent variable. The results show that following the increase in competition production
decreased significantly within treated mines relative to control mines. On average, output
contracted by 0.25 million tons in the average Eastern mine post-1980. This is equivalent
to a decrease of 48% of a standard deviation. In column 2 I find a significant reduction in
the number of hours worked within treated mines relative to the counterfactual following
the competitive shock. This equates to a decrease of 13% of a standard deviation. As
expected, in the more competitive environment treated mines reduced production and
employment as power stations began purchasing coal from PRB mines. Both findings are
consistent with a large increase in competition and help explain the magnitude of the
organizational average treatment effect.
Intuitively, one would expect heterogeneous treatment effects as mines that are closest
to the PRB would be be most severely affected by the increase in competition because
PRB producers can more easily access these markets. Accordingly, I use the following
model to study whether this was the case
(3)
viit = αi+β1Postt+β2Postt∗Invdistancei+β3Easti∗Postt∗Invdistancei+δXit+γt+εit
where all variables are defined as before except Invdistancei which is the inverse of the
25In unreported regressions I find that the competitive shock reduced the probability of horizontal mergersbetween Eastern mines by approximately 4%. This result is consistent with OIO models. However, thecoefficient estimate is statistically insignificant.
24

distance between mine i and Gillette, Wyoming (the rail terminal for PRB coal), measured
in thousands of miles.26 Consistent with a priori expectations, the triple interaction coef-
ficient in column 3 of Table VI shows that Eastern mines nearer to the PRB experienced
a larger reduction in the probability of vertical integration post 1980 compared to more
distant Eastern mines.
While distance to the PRB largely captures supply-side determinants of competition,
such as transport costs, it ignores the role of demand fundamentals in determining ship-
ments of PRB coal. I therefore construct a state-level proximity index which is based on
a gravity model outlined in detail in Appendix D. In this case proximity to the PRB is a
function of both distance and market size, measured as the coal-fired generating capacity
of power stations in mine i’s state. Next, I estimate equation (1) with the modification
that I use the proximity index rather than the Postt dummy variable to measure com-
petition. The identifying assumption is that proximity varies exogenously through time.
This seems reasonable because proximity to the PRB is a function of the exogenous shock
caused by the SRA and because power stations’ capacities are unlikely to be a function
of local mines’ organizational structure. The coefficient on the East-Proximity interaction
term is negative and significant in column 4 of Table VI. Hence, the largest reduction in
vertical integration is among Eastern mines that are most exposed to competition with
PRB producers.27
IV(iii). Prices
A possible explanation for why competition affects vertical integration is because compe-
tition leads to lower market prices (Baker et al. [2002], Legros and Newman [2013]). I
therefore test whether exposure to competition triggered reductions in the market price of
26Higher values of the inverse of distance indicate that a mine lies closer to the PRB. Intuitively we wouldtherefore expect β3 to be negative if the proximity hypothesis is correct.
27As a further validation exercise, I show that developments within the railroad sector are the key drivingforce behind the increase in competition. See Online Appendix E for further details.
25
Eastern coal. These tests also help affirm whether the intensity of competition increased
post 1980. If so I should be able to document a decrease in Eastern relative to Western
market prices.
Before reporting formal empirical tests, I provide descriptive evidence on the suggestive
patterns within the raw data. Figure 5 illustrates the evolution of market prices within the
treatment and control group across the sample period. Both series trend upward between
1972 and 1980. After 1980 the market price in the control group continues to increase.
However, this pattern is not mirrored within the treatment group. Soon after the SRA
was signed into law the Eastern market price peaks at $1.57 per mBtu and then begins to
fall steadily from 1983 onwards reaching a low of $1.19 per mBtu in 1987, suggesting that
the entry of PRB producers into the Eastern market coincided with a substantial fall in
Eastern prices.
To formally test the effect of product market competition on prices I use the shipments-
level data from EIA Form 423 and estimate the following equation
(4) priceipst = α+ γEasts ∗ Postt + δXipst + ϕp + ϕs + ϕt + εipst,
where priceipst is the price, measured in cents per mBtu, of shipment i to power station
p from mines in state s in month-year t (for example, March 1985). Easts is a dummy
variable equal to 1 if a shipment comes from an Eastern basin mine, 0 if from the Unita
basin. Xipst is a vector of shipment level covariates and ϕp and ϕs are power station
and origin state fixed effects, respectively. As information is provided on shipments by
month-year, I also include a set of month-year fixed effects, ϕt. These capture any time-
varying shocks that affect coal prices more generally, such as oil price shocks and energy
legislation. They also have the attractive property that the average treatment effect is
estimated based on variation in the reaction of the treatment and control groups to the
competitive shock within the same month-year of the data set.
[Insert Figure 5] [Insert Table VII]
26

The results of these tests are provided in Table VII. In column 1 I find that, relative
to the control group, Eastern market prices decrease significantly following the increase in
product market competition. The magnitude of the average treatment effect is economi-
cally large at -32%. The evidence in column 2 of Table VII shows that the key finding is
preserved once I control for demand and the characteristics of the coal in each shipment.
Prices are positively related to electricity generation capacity although the relationship is
only significant at the 10% level. Coal with a higher sulfur content tends to have a lower
price, reflecting power stations’ preference for low-sulfur coal to meet their environmental
obligations under the Clean Air Act. Shipments from underground mines tend to have
a higher price due to higher marginal costs within underground mines. Ash content is
insignificant at conventional levels.
If the observed price reductions are indeed driven by the entry of PRB suppliers into
the Eastern market, there should be a corresponding decrease in the quantity of coal power
stations buy from Eastern mines post-1980. To compute this test I estimate the equation
(5) qpst = αp + γEasts ∗ Postt + δXpst + ϕs + ϕt + εpst,
where all variables are defined as before. Quantity, qpst, is measured either in mBtu or
tons. The vector of control variables, Xpst contains the mean ash and sulfur content of
shipments from state s to power station p during month-year t, the share of shipments
from underground mines and coal-fired electricity generation capacity. αp, ϕs and ϕt are
power station, mine state and month-year effects, respectively.
The findings in columns 3 to 6 of Table VII show a significant reduction in the quan-
tity of coal purchased from Eastern mines post 1980. The East-Post interaction coefficient
estimate in column 3 indicates a 44% decrease in mBtu shipments relative to the counter-
factual. This result is robust to the inclusion of control variables in column 4. Although
I prefer to measure quantity in mBtu as this provides a homogenous quantity, the results
are very similar when quantity is measured in tons purchased in columns 5 and 6. To-
27

gether this evidence shows that following the increase in competition from PRB mines,
power stations reduced the quantity of Eastern coal they purchased leading to a decline in
Eastern prices. The evidence is consistent with power stations substituting Eastern coal
for PRB coal and an inwards shift of the Eastern market demand curve post 1980.
Could the reduction in prices be driven by changes in mines’ vertical integration sta-
tus? If competition causes firms to adopt more productive organizational structures prices
may fall because of reorganization rather than increased competition. To isolate this effect
I append the price regression with a variable that measures the share of mines that are ver-
tically integrated in each state-year and an interaction between this and the East dummy
variable. If the hypothesis is correct, including these control variables should render com-
petition insignificant. However, the results in column 7 of Table VII show that this is not
the case. The effect of competition remains negative and highly statistically significant
whereas both the vertical integration share and interaction term enter insignificantly.
Ultimately, what we are interested in is whether the reductions in price we observe
are directly related to mines’ vertical integration status. I therefore use an instrumental
variables strategy where the first-stage equation is
(6) Priceit = αi + ϕSRAt + δXit + γt + εit,
where Priceit is the price per mBtu in mine i’s state during year t (measured in natural
logrithms); SRAt is a dummy equal to 1 if the SRA is in force (1980 to 1987), 0 otherwise;
and all other variables are defined as before. The second-stage equation is
(7) viit = αi + βPriceit + δXit + γt + εit,
where Priceit is the instrumented price of coal in mine i’s state during year t calculated
using the first-stage estimates; and all other variables are as in equation (1). Intuitively,
what this test does is to leverage exogenous variation in prices induced by the SRA and
28

examine how these price shocks affect mines’ vertical integration status. Using a two-stage
approach mimics the precise mechanisms identified by OIO theories.
The results of this test are reported in column 8 of Table VII. The coal price co-
efficient is equal to 0.1580 and is statistically significant at the 1% level. Hence, the
reduction in prices caused by the competitive shock triggered changes in mines’ organiza-
tional structure. The evidence supports the previous findings and shows that the effect of
competition on vertical integration are mediated through market prices. The findings also
line up with Alfaro et al. [2016] who find that vertical integration is an increasing function
of prices. The diagnostic tests provide strong support for the relevance of the instrument:
the Kleibergen Paap F-statistic comfortably exceeds the informal critical value of 10 and
the unreported first stage t-statistic on the SRA variable is highly significant.
IV(iv). Sources of Vertical Reorganizations
Beyond the immediate organizational effects that arise from the competitive shock, it
is critical to document the source of these vertical reorganizations. I therefore conduct a
series of complementary tests to hone in on how the competitive shock triggered changes in
vertical integration. Column 1 in Table VIII shows a significant decrease in the probability
that mines in the treatment group merge with a preparation plant following the increase
in competition, relative to the counterfactual. In columns 2 and 3 of Table VIII I find
no significant relationship between competition and the probability that an Eastern mine
divests (switches to non-integration) or builds an on-site preparation plant, respectively.
Hence, the reduction in the incidence of vertical integration among Eastern mines stems
from a decrease in mergers with preparation plants.
[Insert Table VIII]
Overall, the evidence from Section 4 demonstrates that in an environment where com-
petition is strengthening, non-integration becomes the preferred organization structure.
29
The mechanism behind this transition is different from previous studies. In an industry
where vertical integration increases output but is more costly relative to non-integration,
market prices affect integration decisions. When prices are low the output gains trans-
late into low revenue which does not offset the integration costs. But when prices are
high integration becomes profitable. Competition therefore matters for organizational de-
sign because it reduces market prices which diminishes the incentive to conduct vertical
mergers. As competition intensifies market prices fall which makes vertical integration
unprofitable.
V. ROBUSTNESS TESTING
Perhaps the most serious identification concern is that the increase in product market
competition coincides with shocks to other factors that are not accounted for in equation
(1) and differentially affect the treatment and control groups. I would then misattribute
the average treatment effects to product market competition when in fact other forces are
responsible for the changes in equilibrium ownership structure.
A potential alternative explanation for the findings could be reductions in bargaining
frictions. For example, if transactions costs between mines and preparation plants fall
relatively more in the Eastern market than in the Unita basin post 1980, hold-up is less
likely and mines do not need to vertically integrate to solve bargaining frictions (McLaren
[2000], Hubbard [2001]). Because of the local nature of coal cleaning markets the data
contain a natural proxy for transactions costs: the capacity-weighted number of mines to
preparation plants within 10 miles of each mine (MP ratio). The intuition is that at higher
values bargaining frictions are more pronounced as preparation plants have more outside
options. I therefore control for transactions costs by including the MP ratio variable in
equation (1). Despite this change the East-Post interaction term remains statistically
significant in the results reported in column 1 of Table IX.28
28Further tests presented in Online Appendix Table F.1 show that market thickening does not explain thekey finding. Columns 1 and 2 of Table F.1 show that there was no differential change in the probabilityof a mine entering or exiting the data set across the treatment and control groups between periods.
30

[Insert Table IX]
Property rights models in the Grossman and Hart [1986] tradition argue that firm
boundaries are chosen to align asset ownership with investment incentives. There is little
evidence that upstream or downstream producers’ investment incentives changed through
time. However, the Clean Air Act of 1970 stipulated a reduction in particle emissions. One
aspect of coal cleaning is reducing ash content. Hence, the decrease in vertical integration
could be driven by the increasing importance of preparation plants’ investments. To rule
out this possibility I interact the Postt dummy variable with the ash content of coal in
the mine’s state and include this as a control in equation (1). The findings in column 2 of
Table IX are robust to this change.
Previous research has found that when confronted by greater competition firms del-
egate authority to improve efficiency arising from the informational advantages of lower
level managers with greater local market knowledge (McAfee and McMillan [1995], Bloom
et al. [2010]). Non-integration could be consistent with this tendency. I therefore control
for a mine’s delegation status in the estimating equation. This takes the value 1 if a mine
is operated by a subsidiary or contractor, 0 if by a corporate headquarters. Column 3 of
Table IX shows the effect of competition is robust to this change.
Heterogeneous firm models predict that more intense competition causes low produc-
tivity firms to exit (Melitz [2003]). A lower degree of vertical integration may therefore
reflect firms closing down inefficient parts of the value chain. To rule out this explanation
I use a balanced panel comprising only mines that are active during all years in the data
set, thereby ensuring the results are not driven by mines closing down. Despite throwing
away a large number of observations, the results in column 4 of Table IX are similar to
before and the average treatment effect remains negative and statistically significant.
Columns 3 and 4 repeat this exercise and find no significant effects for preparation plants. Hence, thechange in ownership structure was not simply driven by competition changing market thickness throughentry or exit. Columns 5 and 6 use information from the Truck Inventory and Use Survey to investigatewhether preparation plants began purchasing coal from more distant mines thereby increasing hold-upthreats. The data show this was not the case.
31
Recent theory and evidence indicates that vertical integration correlates with financial
development (Acemoglu et al. [2009], Macchiavello [2012]). As the sample period spans
a period of time when many states lifted restrictions on the geographical scope of bank
activities and legalized de novo branching statewide, I examine the robustness of my
findings to including financial-sector variables. First, in column 5 of Table IX I include the
total volume of bank lending within the mine’s county-year. Second, in column 6 I include
an interstate and intrastate deregulation dummy that capture time-varying changes in
whether a state permits interstate and intrastate branching respectively. In both cases
the effect of product market competition on vertical integration remains robust.
In column 7 of Table IX I estimate equation (1) using a probit model to ensure my
findings are not simply an artefact of the linear probability model. The average treatment
effect remains negative and statistically significant.
A further concern might be that there were differential shocks to coal demand between
the treatment and control group as power stations idled capacity and/or switched from
burning coal to another fuel or vice versa. Shifting demand patterns may therefore drive
the results if, for example, Eastern mines experience falling demand. I therefore focus
on how coal-fired electricity generation capacity changed through time in the Eastern
and Western market using a difference-in-difference estimator applied to power station-
level data reported on EIA Form 759. Column 1 in Online Appendix Table G.1 shows
no significant reduction in capacity between the treatment and control group post 1980.
In columns 2 and 3 I find no significant differences in the probability of power stations
entering and exiting between the two groups.
[Insert Table X]
Nevertheless, to alleviate concerns that confounding demand shocks drive the results I
interact the Easti dummy variable with coal-fired generation capacity in the mine’s state.
I then include this additional variable in the vertical integration and price regressions.
The results of these tests are reported in Table X. In both column 1 and column 2 the
32

interaction term remains insignificant and the main findings are unaffected.
The sample period is characterized by a period of turbulence in energy markets, an
acute recession which differed in severity across regions, new environmental mandates and
changes to coal demand induced by the rise of substitute fuels such as natural gas. If
these factors differentially affect the treatment and control groups they may confound the
average treatment effect estimates. I address these concerns in the remainder of Table X.
To rule out that cross-time changes in the price of substitute fuels, such as oil, provoke
changes in coal prices and mines’ organization I append equation (1) with an interaction
between the Easti dummy and the oil price variable. The results reported in columns 3
and 4 of Table X are robust to this change. Next, I deal with concerns that environmental
legislation drives the results. The Clean Air Act Amendments of 1977 required that all
power stations built after 1977 must be fitted with flue-gas desulfurization systems (scrub-
bers): a technology that reduces the sulfur content of power stations’ exhaust emissions.
A danger is that the introduction of scrubbers altered demand for coal depending on its
sulfur content. I therefore create a variable measuring the share of coal-fired generation
capacity with scrubbers to total capacity in each state-year and interact it with the Easti
dummy variable.29 Including this additional control variable has little effect on the main
findings in columns 5 and 6 of Table X. To rule out differential macroeconomic trends due
to the early 1980s recession I interact the Easti dummy variable with the annual GDP
growth rate in the mine’s county.30 The findings in columns 7 and 8 remain very similar
to before. In columns 9 and 10 of Table X I report estimates based on a specification that
considers possible differences in demand between the treatment and control group due to
changes in power stations’ natural gas demand. Again, the main findings are unchanged.31
An alternate explanation for the reduction in vertical integration could be that a
29The earliest year for which data on scrubber installations are reported is 1985. I therefore proxy scrubberusage using the ratio of power station generation capacity built after 1977 to total capacity.
30Owing to a lack of data on which county a power station is located in, the pricing regression usesstate-level GDP growth rate.
31Online Appendix Table G.2 shows that the effect of competition is not confounded by features of contracts(share of fixed price contracts and average duration) between mines and power stations (Kacker [2016]).
33

reduction in shipments from Eastern mines to preparation plants freed up scheduling time
which reduced the need for mines to be vertically integrated. To test this idea I calculate
the output of mines within each preparation plant’s local market and interact it with the
East dummy variable. Intuitively, mines face greater constraints on scheduling time where
output is high. Column 11 of Table X reports the estimates. The East-Post interaction
coefficient remains robust to this change.
VI. CONCLUSIONS
One contribution of this article is to provide first evidence of a causal relationship be-
tween product market competition and changes in vertical integration. Using a natural
experiment in the US coal mining industry, I find that following exposure to more intense
product market competition the probability of vertical integration fell by approximately
30% within the treatment group, relative to the counterfactual.
The second contribution is novel evidence on the underlying mechanism. Specifically,
product market competition matters for vertical integration because it changes market
prices and alters the returns to operating different organizational formats. I find that the
competitive shock caused a 32% reduction in market prices within the treatment group
compared to the counterfactual. Hence, as competition increases prices fall and the output
gains brought by vertical integration translate into low revenue which no longer offset the
costs of integrating. Consistent with this argument, the estimates show the transition to
a lower degree of vertical integration is driven by competition reducing the frequency of
vertical mergers. The transmission mechanism differs from existing explanations which
emphasize the role of competition in thickening the market and reducing bargaining fric-
tions between firms.
How might these results be interpreted? The evidence is consistent with a number of
economic theories. For example, recent OIO theories offer one possible explanation (Legros
and Newman [2013]). These models emphasize the role of product prices in influencing ver-
tical integration and imply that demand shocks can provoke merger and divestiture waves.
34

My findings could be viewed as consistent with product market competition shifting the
market demand curve inward and reducing market prices. As prices fall the marginal value
of output gains decrease and firms choose non-integration. Models in which there are dif-
ferences in the fixed costs of operating different organization structures could also explain
the results (Grossman and Helpman [2002], Antras and Helpman [2004]). Transactions
cost theories may also offer an interpretation of the evidence. In those models vertical
integration depends on the level of quasi-rents (Williamson [1975], Klein et al. [1978],
Baker et al. [2002]). Where rents are a function of market prices, increasing the intensity
of competition erodes rents leading non-integration to become the preferred equilibrium
ownership structure.
REFERENCES
Acemoglu, D.; Aghion, P.; Griffith, R. and Zilibotti, F., 2010, ’Vertical Integration and
Technology: Theory and Evidence’, Journal of the European Economic Association,
8, pp. 989-1033.
Acemoglu, D.; Johnson, S. and Mitton, T., 2009, ’Determinants of Vertical Integration:
Financial Development and Contracting Costs’, Journal of Finance, 64, pp. 1251-1290.
Aghion, P.; Griffith, R. and Howitt, P., 2006, ’Vertical Integration and Competition’,
American Economic Review Papers and Proceedings, 96, pp. 97-102.
Alfaro, L.; Conconi, P.; Fadinger, H. and Newman, A., 2016, ’Do Prices Determine Vertical
Integration?’, Review of Economic Studies, 83, pp. 855-888.
Alonso, R.; Dessein, W. and Matouschek, N., 2008, ’Centralization versus Decentral-
ization: An Application to Price Setting by a Multi-Market Firm’, Journal of the
European Economic Association, 6, pp. 457-467.
Antras, P. and Helpman, E., 2004, ’Global Sourcing’, Journal of Political Economy, 112,
pp. 552-580.
Asplund, M. and Nocke, V., 2006, ’Firm Turnover in Imperfectly Competitive Markets’,
Review of Economic Studies, 73, pp. 295-327.
35

Atalay, E.; Hortacsu, A. and Syverson, C., 2014, ’Vertical Integration and Input Flows’,
American Economic Review, 104, pp. 1120-1148.
Baker, G.; Gibbons, R. and Murphy, K., 2002, ’Relational Contracts and the Theory of
the Firm’, Quarterly Journal of Economics, 117, pp. 39-84.
Baker, G. and Hubbard, T., 2003, ’Make versus Buy in Trucking: Asset Ownership, Job
Design, and Information’, American Economic Review, 93, pp. 1328-1353.
Balakrishnan, S. and Wernerfelt, D., 1986, ’Technical Change, Competition and Vertical
Integration’, Strategic Management Journal, 7, pp. 347-359.
Bertrand, M.; Duflo, E. and Mullainnathan, S., 2004, ’How Much Should We Trust
Difference-in-Difference Estimates?’, Quarterly Journal of Economics, 119, pp. 249-
275.
Bhagwat, S., 2009, ’Estimation of Coal-Cleaning Costs: A Spreadsheet-Based Interactive
Software for use in the Estimation of Economically Recoverable Coal’, U.S. Geological
Survey Professional Paper 1625-F, pp. 1-13.
Bloom, N.; Sadun, R. and Van Reenen, J., 2010, ’Does Product Market Competition lead
Firms to Decentralize?’, American Economic Review Papers and Proceedings, 100, pp.
434-438.
Bresnahan, T. and Levin, J., 2012, ’Vertical Integration and Market Structure’, NBER
Working Paper No. 17889.
Buessing, M., 2014, Vertical Integration and Regulation in US Coal Production, Boston
University Working Paper.
Caves, D.; Christensen, L. and Swanson, J., 2010, ’The Staggers Act, 30 Years Later’,
CATO Institute Working Paper.
Conconi, P.; Legros, P. and Newman, A., 2012, ’Trade Liberalization and Organizational
Change’, Journal of International Economics, 86, pp. 197-208.
Darmstadter, J., 1997, ’Productivity Changes in U.S. Coal Mining’, Discussion Papers
Resources for the Future DP-97-40.
Derthick, M. and Quirk, P., 1985, The Politics of Deregulation (The Brookings Institution,
36

Washington, U.S.A.)
Eakin, B.; Bozzo, A.; Meitzen, M. and Schoech, P., 2010, ’Railroad Performance under
the Staggers Act’, CATO Institute Working Paper.
Fiscor, S., 2010, ’Coal Industry Careers Pay Well’, Coal Age, mimeo.
Fiscor, S., 2013, ’2013 US Prep Plant Census’, Coal Age, mimeo.
Fiscor, S., 2014, ’2014 US Prep Plant Census’, Coal Age, mimeo.
FRA, 2011, ’Impact of the Staggers Rail Act of 1980’, Federal Railroad Administration,
mimeo.
Grossman, G. and Helpman, E., 2002, ’Integration versus Outsourcing in Industry Equi-
librium’, Quarterly Journal of Economics, 117, pp. 85-120.
Grossman, S. and Hart, O., 1986, ’The Costs and Benefits of Ownership: A theory of
Vertical and Lateral Integration’, Journal of Political Economy, 94, pp. 691-719.
Guadalupe, M. and Wulf, J., 2010, ’The Flattening Firm and Product Market Compe-
tition: The Effect of Trade Liberalization on Corporate Hierarchies’, American Eco-
nomic Journal: Applied Economics, 2, pp. 105-127.
Hubbard, T., 2001, ’Contractual Form and Market Thickness in Trucking’, RAND Journal
of Economics, 32, pp. 369-386.
Joskow, P,, 1987, ’Contract Duration and Relationship-Specific Investments: Empirical
Evidence from Coal Markets’, American Economic Review, 77, pp. 168-185.
Joskow, P., 1990, ’The Performance of Long-Term Contracts: Further Evidence from Coal
Markets’, RAND Journal of Economics, 21, pp. 251-274.
Kacker, K, 2016, ’Regulation and Contract Design: The Impact of Relationship Specific
Investment’, Journal of Industrial Economics, forthcoming.
Klein, B.; Crawford, R. and Alchian, A., 1978, ’Vertical Integration, Appropriable Rents,
and the Competitive Contracting Process’, Journal of Law and Economics, 21, pp.
297-326.
Legros, P. and Newman, A., 2013, ’A Price Theory of Vertical and Lateral Integration’,
Quarterly Journal of Economics, 128, pp. 725-770.
37

Legros, P. and Newman, A., 2014, ’Contracts, Ownership, and Industrial Organization:
Past and Future’, Journal of Law, Economics, and Organization, 30, pp. 82-117.
Macchiavello, R., 2012, ’Financial Development and Vertical Integration: Theory and
Evidence’, Journal of the European Economic Association, 10, pp. 255-289.
MacDonald, J., 1989, ’Railroad Deregulation, Innovation, and Competition Effects of the
Staggers Act on Grain Transportation’, Journal of Law and Economics, 32, pp. 63-95.
Marin, D. and Verdier, T., 2003, ’Globalization and the New Enterprise’, Journal of the
European Economic Association, 1, pp. 337-344.
McAfee, R. and McMillan, J., 1995, ’Organizational Diseconomies of Scale’, Journal of
Economics and Management Strategy, 4, pp. 399-426.
McBride, M., 1983, ’Spatial Competition and Vertical Integration: Cement and Concrete
Revisited’, American Economic Review, 73, pp. 1011-1022.
McLaren, J., 2000, ’Globalization and Vertical Structure’, American Economic Review,
90, pp. 1239-1254.
Melitz, M., 2003, ’The Impact of Trade on Intra-Industry Reallocations and Aggregate
Industry Productivity’, Econometrica, 71, pp. 1695-1725.
Schoech, P. and Swanson, J., 2010, ’Patterns of Productivity Growth for U.S. Class I Rail-
roads: An Examination of Pre- and Post-Deregulation Determinants’, LRCA Working
Paper.
Serfes, K., 2015, ’A Price Theory of Vertical and Lateral Integration under Two-Sided
Productivity Heterogeneity’, Drexel University Working Paper.
Slack, B., 2013, Rail Deregulation in the United States (Routledge, New York, U.S.A.).
Thesmar, D. and Thoenig, M., 2000, ’Creative Destruction and Firm Organization Choice’,
Quarterly Journal of Economics, 115, pp. 1201-1237.
Vroom, G., 2006, ’Organizational Design and the Intensity of Rivalry’, Management Sci-
ence, 52, pp. 1689-1702.
Williamson, O., 1975, Markets and Hierarchies: Analysis of Antitrust Implications (New
York Free Press, New York, U.S.A.).
38

Winston, C., 2005, ’The Success of the Staggers Rail Act of 1980’, AEI-Brookings Joint
Center for Regulatory Studies Working Paper.
39

Tables
Table I: Organizational Characteristics
Dependent variable: Production Employees per Office Officeshifts thousand tons workers hours
viit 0.4983*** -0.4390*** 1.8890** 1.7581***(6.39) (-10.31) (2.33) (2.86)
Number of VI mines 1,875 1,875 1,875 1,875Number of NI mines 19,650 19,650 19,650 19,650R2 0.06 0.98 0.11 0.09Mine FE Yes Yes Yes YesYear FE Yes Yes Yes Yes
Notes: All data are taken from the MSHA mines information database except employees per thousandtons which comes from the MSHA mine-level database. Employees per thousand tons is the ratio of mineemployees to the number of tons of coal extracted (in thousands). Office workers is the number of workersemployeed in the mine’s on-site office. Office hours is the total annual number of hours worked by officeworkers at the mine. All dependent variables are measures in natural logarithms except production shifts.The estimating equation in all columns is yit = αi + βviit + γt + εit where yit is a dependent variable; viitis the vertical integration indicator; αi and γt are mine and year fixed effects, respectively; εit is the errorterm. *, **, and *** indicate statistical significance at the 10%, 5%, and 1% levels respectively.
40
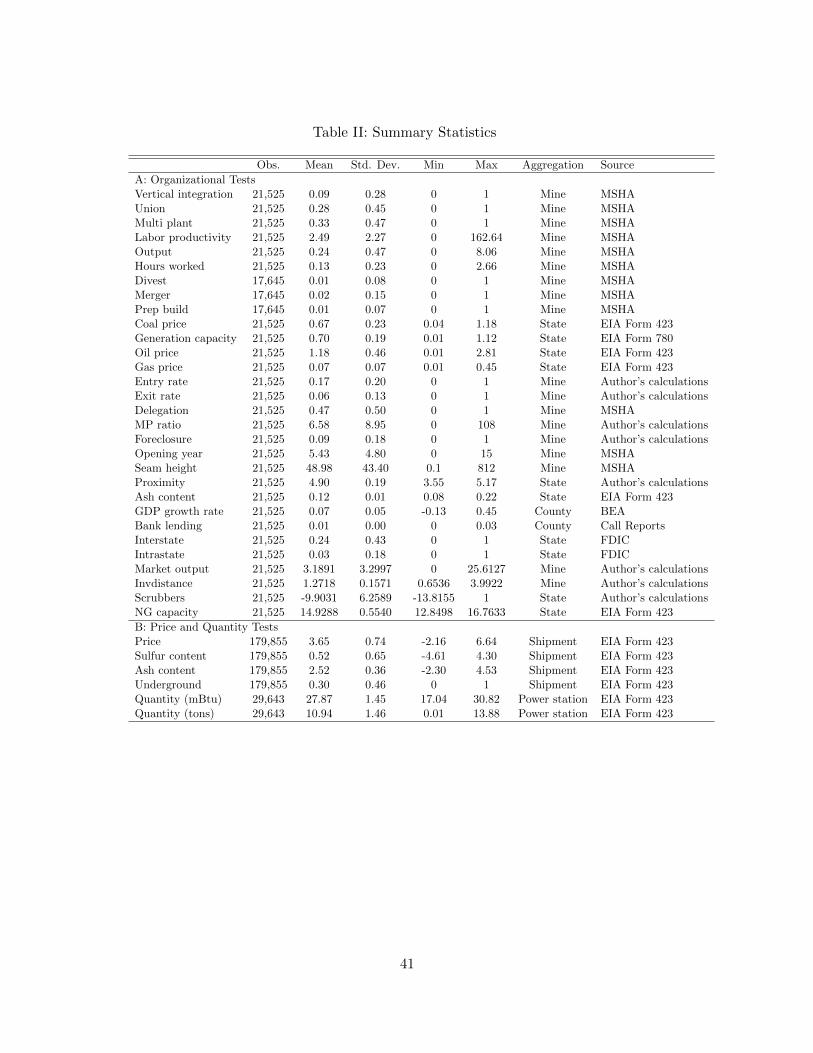
Table II: Summary Statistics
Obs. Mean Std. Dev. Min Max Aggregation Source
A: Organizational TestsVertical integration 21,525 0.09 0.28 0 1 Mine MSHAUnion 21,525 0.28 0.45 0 1 Mine MSHAMulti plant 21,525 0.33 0.47 0 1 Mine MSHALabor productivity 21,525 2.49 2.27 0 162.64 Mine MSHAOutput 21,525 0.24 0.47 0 8.06 Mine MSHAHours worked 21,525 0.13 0.23 0 2.66 Mine MSHADivest 17,645 0.01 0.08 0 1 Mine MSHAMerger 17,645 0.02 0.15 0 1 Mine MSHAPrep build 17,645 0.01 0.07 0 1 Mine MSHACoal price 21,525 0.67 0.23 0.04 1.18 State EIA Form 423Generation capacity 21,525 0.70 0.19 0.01 1.12 State EIA Form 780Oil price 21,525 1.18 0.46 0.01 2.81 State EIA Form 423Gas price 21,525 0.07 0.07 0.01 0.45 State EIA Form 423Entry rate 21,525 0.17 0.20 0 1 Mine Author’s calculationsExit rate 21,525 0.06 0.13 0 1 Mine Author’s calculationsDelegation 21,525 0.47 0.50 0 1 Mine MSHAMP ratio 21,525 6.58 8.95 0 108 Mine Author’s calculationsForeclosure 21,525 0.09 0.18 0 1 Mine Author’s calculationsOpening year 21,525 5.43 4.80 0 15 Mine MSHASeam height 21,525 48.98 43.40 0.1 812 Mine MSHAProximity 21,525 4.90 0.19 3.55 5.17 State Author’s calculationsAsh content 21,525 0.12 0.01 0.08 0.22 State EIA Form 423GDP growth rate 21,525 0.07 0.05 -0.13 0.45 County BEABank lending 21,525 0.01 0.00 0 0.03 County Call ReportsInterstate 21,525 0.24 0.43 0 1 State FDICIntrastate 21,525 0.03 0.18 0 1 State FDICMarket output 21,525 3.1891 3.2997 0 25.6127 Mine Author’s calculationsInvdistance 21,525 1.2718 0.1571 0.6536 3.9922 Mine Author’s calculationsScrubbers 21,525 -9.9031 6.2589 -13.8155 1 State Author’s calculationsNG capacity 21,525 14.9288 0.5540 12.8498 16.7633 State EIA Form 423
B: Price and Quantity TestsPrice 179,855 3.65 0.74 -2.16 6.64 Shipment EIA Form 423Sulfur content 179,855 0.52 0.65 -4.61 4.30 Shipment EIA Form 423Ash content 179,855 2.52 0.36 -2.30 4.53 Shipment EIA Form 423Underground 179,855 0.30 0.46 0 1 Shipment EIA Form 423Quantity (mBtu) 29,643 27.87 1.45 17.04 30.82 Power station EIA Form 423Quantity (tons) 29,643 10.94 1.46 0.01 13.88 Power station EIA Form 423
41

Table III: Delivered Prices and Shipments
Panel A: Delivered PricesOrigin : Destination Distance Pre 1980 Post 1980
PRB : East 1,200 1.90PRB : West 347 4.32 1.42East : East 336 6.74 1.94Unita : West 262 0.54 0.32
B: PRB Shipments to the WestVariable Pre 1980 Post 1980 Diff. t-statistic
Tons shipped 2.52 2.60 0.08 0.05(1.46) (0.37) (1.62)
Btu shipped 28.04 20.65 -7.39 -0.80(8.86) (2.09) (9.21)
Notes: This table uses data from the CTRD database. Panel A reports the average distance betweenmines and power plants according to mines’ location (Origin) and power plants’ location (Destination).Pre and Post 1980 denote the real 2009 $ delivered price per 1 mBtu. Panel B reports the results of at-test on the null of equality between pre and post 1980 PRB shipments to Western markets.
42

Table IV: Vertical Integration Incidence
1 2 3Pre-Staggers Post-Staggers Difference
Treatment group .0314 0.1063 0.0749Control group 0.0438 0.1877 0.1440Difference-in-difference -0.0691**
(-2.49)
Notes: This table uses the mine-level data set and reports the average incidence of vertical integrationwithin the treatment and control groups before and after the Staggers Rail Act was introduced in 1980.t-statistic reported in parentheses. ** indicates statistical significance at the 5% level.
43

Table V: Vertical Integration Results
1 2 3 4 5 6 7Dependent variable: viitPost 0.3208∗∗∗ 0.2834∗∗∗ 0.0544 0.0235 0.2080∗∗∗ -0.0279 -0.0100
(10.37) (7.90) (1.33) (0.44) (4.80) (-0.66) (-0.25)East * Post -0.1111∗∗∗ -0.1007∗∗∗ -0.0999∗∗∗ -0.0967∗∗∗ -0.0906∗∗∗ -0.0684∗∗∗ -0.0757∗∗∗
(-4.15) (-3.11) (-3.65) (-3.26) (-3.11) (-3.04) (-3.84)Union -0.1147∗∗∗ -0.1114∗∗∗ -0.0929∗∗∗ -0.0929∗∗∗ -0.1237∗∗∗ -0.0932∗∗∗
(-7.00) (-8.54) (-6.16) (-7.12) (-8.90) (-7.09)Multi plant 0.0840∗∗∗ 0.0849∗∗∗ 0.0826∗∗∗ 0.0826∗∗∗ -0.0249 0.0808∗∗∗
(5.59) (5.60) (5.05) (5.10) (-1.30) (4.78)Labor productivity 0.0032∗ 0.0025∗ 0.0014 0.0015 0.0039∗∗∗ 0.0013
(1.85) (1.66) (1.40) (1.16) (3.50) (1.62)Coal price 0.2583∗∗∗ 0.2123∗∗∗ 0.2135∗∗∗ 0.1172∗∗ 0.2304∗∗∗
(6.47) (4.61) (3.63) (2.52) (5.26)Generation capacity 0.1860∗∗∗ 0.1428∗∗∗ 0.1427∗∗∗ 0.1428∗∗∗ 0.1399∗∗
(3.38) (2.60) (2.65) (2.71) (2.49)Oil price 0.0004∗∗∗ 0.0004∗∗∗ 0.0004∗∗∗ 0.0004∗∗∗ 0.0004∗∗∗
(5.92) (5.73) (7.32) (6.56) (6.20)Gas price 0.1367∗∗∗ 0.0902∗∗ 0.0917∗∗ 0.0846∗∗ 0.0885∗∗
(3.66) (1.98) (2.26) (2.23) (2.16)Entry rate 0.0333∗∗∗ 0.0315∗∗∗ 0.0315∗∗∗ 0.0254∗∗∗ 0.0309∗∗∗
(4.00) (3.31) (3.99) (2.90) (3.74)Exit rate -0.0460∗∗ -0.0459∗∗ -0.0459∗∗ -0.0415∗∗∗ -0.0472∗∗
(-2.22) (-2.42) (-2.13) (-2.64) (-2.31)Post75 -0.1633∗∗∗
(-3.96)East * Post75 -0.0284
(-1.01)Union * Post 0.0545∗∗∗
(6.68)Multi plant * Post 0.1229∗∗∗
(15.55)Labor productivity * Post -0.0032∗∗
(-2.33)Opening year * Post 0.0100∗∗∗
(4.70)Seam height * Post 0.0007∗∗∗
(4.39)Age * Seam height * Post -0.0001∗∗∗
(-3.79)
Observations 21,525 21,525 21,525 21,525 21,525 21,525 21,685R2 0.13 0.15 0.16 0.18 0.18 0.20 0.18Mine FE Yes Yes Yes Yes Yes Yes YesYear FE Yes Yes Yes No No No NoUnderground * Year FE No No No Yes Yes Yes Yes
Notes: These tests rely on the mine-level data set. t-statistics are reported in parentheses. *, **, and ***indicate statistical significance at the 10%, 5%, and 1% levels respectively.
44

Table VI: Further Evidence
1 2 3 4Dependent variable: Output Hours worked viit viitPost 0.0702 0.0162 0.0028
(0.86) (0.64) (0.05)East * Post -0.2522∗∗∗ -0.0441∗∗∗
(-3.34) (-2.68)Post * Inv distance -0.0085
(-0.54)East * Post * Inv distance -0.0994∗∗
(-2.20)Proximity 0.3879∗∗∗
(3.86)East * Proximity -0.3149∗∗∗
(-3.22)
Observations 21,525 21,525 21,525 21,525R2 0.07 0.03 0.18 0.18Mine FE Yes Yes Yes YesUnderground * Year FE Yes Yes Yes YesControl variables Yes Yes Yes Yes
Notes: These tests rely on the mine-level data set. The control variables are identical to those used inTable V column 3. t-statistics are reported in parentheses. *, **, and *** indicate statistical significanceat the 10%, 5%, and 1% levels respectively.
45

Tab
leV
II:
Pri
cin
gan
dQ
uan
tity
Res
ult
s
12
34
56
78
Dep
enden
tva
riab
le:
Pri
ceP
rice
Quan
tity
Quan
tity
Quan
tity
Quanti
tyP
rice
vi it
(¢/m
Btu
)(¢
/mB
tu)
(mB
tu)
(mB
tu)
(ton
s)(t
ons)
(¢/m
Btu
)
Eas
t*
Pos
t-0
.323
7∗∗∗
-0.2
428∗∗∗
-0.4
470∗∗∗
-0.4
290∗∗∗
-0.4
741∗∗∗
-0.4
492∗∗∗
-0.2
437∗∗∗
(-8.
89)
(-4.
10)
(-2.
77)
(-2.
77)
(-2.
82)
(-2.
96)
(-3.
85)
Gen
erat
ion
capac
ity
0.14
63∗
0.15
370.
1889
0.12
90∗
(1.9
4)(0
.48)
(0.5
8)
(1.7
3)
Sulf
ur
conte
nt
-0.1
173∗∗∗
0.06
670.
0564
-0.1
173∗∗∗
(-4.
73)
(1.4
7)(1
.18)
(-3.
97)
Ash
conte
nt
-0.0
305
0.08
100.
177
6∗∗∗
-0.0
306
(-0.
77)
(1.3
1)(2
.75)
(-0.
79)
Under
grou
nd
0.03
14∗∗
0.00
51-0
.032
10.
0315∗
(2.1
6)(0
.09)
(-0.5
6)(1
.78)
VI
shar
e0.
0044
(0.0
4)E
ast
*V
Ish
are
-0.0
541
(-0.
25)
Pri
ce0.1
580∗∗∗
(20.4
4)
Obse
rvat
ions
179,
855
179,
855
29,6
4329
,643
29,6
4329
,643
179
,855
21,5
25
R2
0.87
0.87
0.77
0.77
0.77
0.77
0.87
0.1
6K
leib
erge
n-P
aap
F-s
tati
stic
--
--
--
-20
,339
Pow
erpla
nt
FE
Yes
Yes
Yes
Yes
Yes
Yes
Yes
No
Sta
teF
EY
esY
esY
esY
esY
esY
esY
esN
oM
onth
*Y
ear
FE
Yes
Yes
Yes
Yes
Yes
Yes
Yes
No
Min
eF
EN
oN
oN
oN
oN
oN
oN
oY
esU
nder
grou
nd
*Y
ear
FE
No
No
No
No
No
No
No
Yes
Note
s:T
he
test
sin
this
table
use
the
EIA
Form
423
data
base
exce
pt
colu
mn
8w
her
em
ine-
level
data
isuse
d.
Month
lysh
ipm
ent-
level
data
isuse
din
colu
mns
1,
2and
7.
Inco
lum
ns
3-6
ship
men
tsare
aggre
gate
dto
the
pow
erpla
nt-
ori
gin
state
level
.In
colu
mns
1,
2and
7su
lfur
and
ash
conte
nt
are
the
sulf
ur
(%)
and
ash
(%)
conte
nt
ina
ship
men
t.In
colu
mns
3-6
sulf
ur
and
ash
conte
nt
are
the
mea
nsu
lfur
(%)
and
ash
(%)
conte
nt
of
ship
men
tsfr
om
states
top
ower
pla
ntp
duri
ng
monthm
of
yea
rt.
Coal
pri
ceis
the
mark
etpri
ceof
coal
inth
em
ine’
sst
ate
(mea
sure
din
natu
ral
logari
thm
s).
The
unre
port
edco
ntr
ol
vari
able
suse
din
colu
mn
8are
iden
tica
lto
those
use
din
Table
5co
lum
n3.t-
stati
stic
sare
rep
ort
edin
pare
nth
eses
.*,
**,
and
***
indic
ate
stati
stic
al
signifi
cance
at
the
10%
,5%
,and
1%
level
sre
spec
tivel
y.
46

Table VIII: Ownership Adjustment Mechanisms
1 2 3Dependent variable: Merge Divest Prep build
Post 0.0744∗∗∗ 0.0314∗∗∗ 0.0159∗
(5.06) (3.28) (1.92)East * Post -0.0358∗∗∗ -0.0036 -0.0073
(-2.85) (-0.55) (-1.00)
Observations 17,645 17,645 17,645R2 0.10 0.02 0.01Mine FE Yes Yes YesUnderground * Year FE Yes Yes YesControl variables Yes Yes Yes
Notes: These tests rely on the mine-level data set. The number of observations is lower compared to TableV because at least two time periods are required to generate the dependent variable. A mine’s ownershipstatus must be known in t and t− 1 to be able to ascertain whether a merger, divestiture or preparationplant build has taken place. The control variables are identical to those used in Table V column 3. t-statistics are reported in parentheses. *, **, and *** indicate statistical significance at the 10%, 5%, and1% levels respectively.
47

Tab
leIX
:R
obu
stn
ess
Tes
ts
12
34
56
7D
epen
den
tva
riab
le:vi it
Pos
t0.
0198
0.02
990.
0199
0.33
09∗∗
0.01
74-0
.067
9∗-0
.009
6(0
.37)
(0.5
1)(0
.39)
(2.5
8)(0
.24)
(-1.
79)
(-0.
26)
Eas
t*
Pos
t-0
.095
3∗∗∗
-0.0
933∗∗∗
-0.0
954∗∗∗
-0.1
119∗∗∗
-0.0
963∗∗∗
-0.0
767∗∗∗
-0.0
306∗∗∗
(-3.
25)
(-3.
39)
(-3.
63)
(-3.
41)
(-3.
57)
(-3.2
0)(-
2.5
8)M
Pra
tio
-0.0
004
(-0.
14)
Ash
*P
ost
-0.0
013
(-0.
38)
Del
egat
ion
-0.0
005
(-0.
07)
Ban
kle
ndin
g0.
0003
0.0
010
(0.1
4)(0
.60)
Inte
rsta
teder
egula
tion
-0.0
187∗∗
(-2.
12)
Intr
asta
teder
egula
tion
0.0
570∗∗∗
(2.8
9)
N21
,525
21,5
2521
,525
2,84
821
,525
21,5
2521
,525
R2
0.18
0.18
0.18
0.25
0.18
0.18
-M
ine
FE
Yes
Yes
Yes
Yes
Yes
Yes
Yes
Under
grou
nd
*Y
ear
FE
Yes
Yes
Yes
Yes
Yes
Yes
Yes
Con
trol
vari
able
sY
esY
esY
esY
esY
esY
esY
es
Note
s:T
hes
ete
sts
rely
on
the
min
e-le
vel
data
set.t-
stati
stic
sare
rep
ort
edin
pare
nth
eses
.T
he
contr
ol
vari
able
sare
iden
tica
lto
those
use
din
Table
Vco
lum
n3.
*,
**,
and
***
indic
ate
stati
stic
al
signifi
cance
at
the
10%
,5%
,and
1%
level
sre
spec
tivel
y.
48

Tab
leX
:E
ner
gyan
dL
egis
lati
veS
hock
s
12
34
56
78
910
11
Dep
enden
tva
riab
le:
vi it
Pri
cevi it
Pri
cevi it
Pri
cevi it
Pri
cevi it
Pri
cevi it
Pos
t0.
0230
0.01
180.
0101
0.00
09
0.01
780.0
051
(0.3
7)(0
.21)
(0.1
9)(0
.02)
(0.3
7)(0
.10)
Eas
t*
Pos
t-0
.099
0∗∗
-0.2
549∗∗∗
-0.0
942∗∗∗
-0.2
840∗∗∗
-0.0
757∗∗∗
-0.2
164∗∗∗
-0.0
756∗∗∗
-0.2
205∗∗∗
-0.0
854∗∗∗
-0.3
010∗∗∗
-0.1
092∗∗∗
(-2.
39)
(-3.
75)
(-3.
58)
(-3.
29)
(-2.
58)
(-3.
10)
(-3.
21)
(-3.8
8)(-
2.9
8)(-
3.9
8)
(-3.3
9)
Coa
lge
ner
atin
gca
pac
ity
0.10
620.
1328∗∗
0.17
13∗∗∗
0.14
62∗
0.16
49∗∗∗
0.13
13∗
0.1
463∗∗∗
0.12
45∗
0.1
622∗∗∗
0.1
255∗
(0.2
5)(2
.06)
(2.7
0)(1
.84)
(2.7
5)(1
.69)
(3.4
4)(1
.89)
(3.1
3)(1
.76)
Oil
pri
ce0.
0004∗∗∗
0.00
010.
0004∗∗∗
-0.0
001
0.00
04∗∗∗
0.00
010.
0004∗∗∗
0.0
000
0.00
03∗∗∗
0.0
001
(6.0
1)(0
.42)
(5.5
9)(-
1.21
)(6
.22)
(0.4
2)(5
.61)
(0.2
0)(6
.13)
(0.5
2)
Eas
t*
Coa
lge
ner
atin
gca
pac
ity
0.04
390.
0030
(0.1
0)(0
.02)
Eas
t*
Oil
pri
ce-0
.000
90.
0002
(-1.
33)
(1.0
6)Scr
ubb
ers
0.00
40∗∗
-0.0
055∗∗
(2.1
6)(-
2.09
)E
ast
*Scr
ubb
ers
-0.0
033∗
0.01
00∗∗∗
(-1.
70)
(3.5
1)G
DP
grow
thra
te-0
.320
5-0
.0828
(-1.
58)
(-0.
21)
Eas
t*
GD
Pgr
owth
rate
0.29
890.9
206∗∗
(1.4
5)(2
.01)
NG
capac
ity
-0.0
428
-0.2
223
(-0.
91)
(-0.8
2)
Eas
t*
NG
capac
ity
0.00
98
0.3
395
(0.2
1)
(1.2
3)
Mar
ket
outp
ut
0.0
077
(0.5
8)
Eas
t*
Mar
ket
outp
ut
0.0
012
(0.0
9)
N21
,525
179,
855
21,5
2517
9,85
521
,525
179,
855
21,
525
179
,855
21,5
25179,8
55
21,5
25
R2
0.18
0.87
0.18
0.87
0.18
0.87
0.18
0.8
70.
180.8
70.1
8M
ine
FE
Yes
No
Yes
No
Yes
No
Yes
No
Yes
No
Yes
Under
grou
nd
*Y
ear
FE
Yes
No
Yes
No
Yes
No
Yes
No
Yes
No
Yes
Pow
erst
atio
nF
EN
oY
esN
oY
esN
oY
esN
oY
esN
oY
esN
oSta
teF
EN
oY
esN
oY
esN
oY
esN
oY
esN
oY
esN
oM
onth
*Y
ear
FE
No
Yes
No
Yes
No
Yes
No
Yes
No
Yes
No
Con
trol
vari
able
sY
esY
esY
esY
esY
esY
esY
esY
esY
esY
esY
es
Note
s:T
he
resu
lts
rep
ort
edin
colu
mns
1,
3,
5,
7,
9and
11
use
the
min
e-le
vel
data
set.
The
resu
lts
rep
ort
edin
colu
mns
2,
4,
6,
8and
10
use
the
EIA
Form
423
data
base
.t-
stati
stic
sare
rep
ort
edin
pare
nth
eses
.T
he
contr
ol
vari
able
sin
colu
mns
1,
3,
5,
7,
9and
11
are
iden
tica
lto
those
inV
colu
mn
3.
The
contr
ol
vari
able
sin
colu
mns
2,
4,
6,
8and
10
are
iden
tica
lto
those
inT
able
VII
colu
mn
2.
*,
**,
and
***
indic
ate
stati
stic
al
signifi
cance
at
the
10%
,5%
,and
1%
level
sre
spec
tivel
y.
49
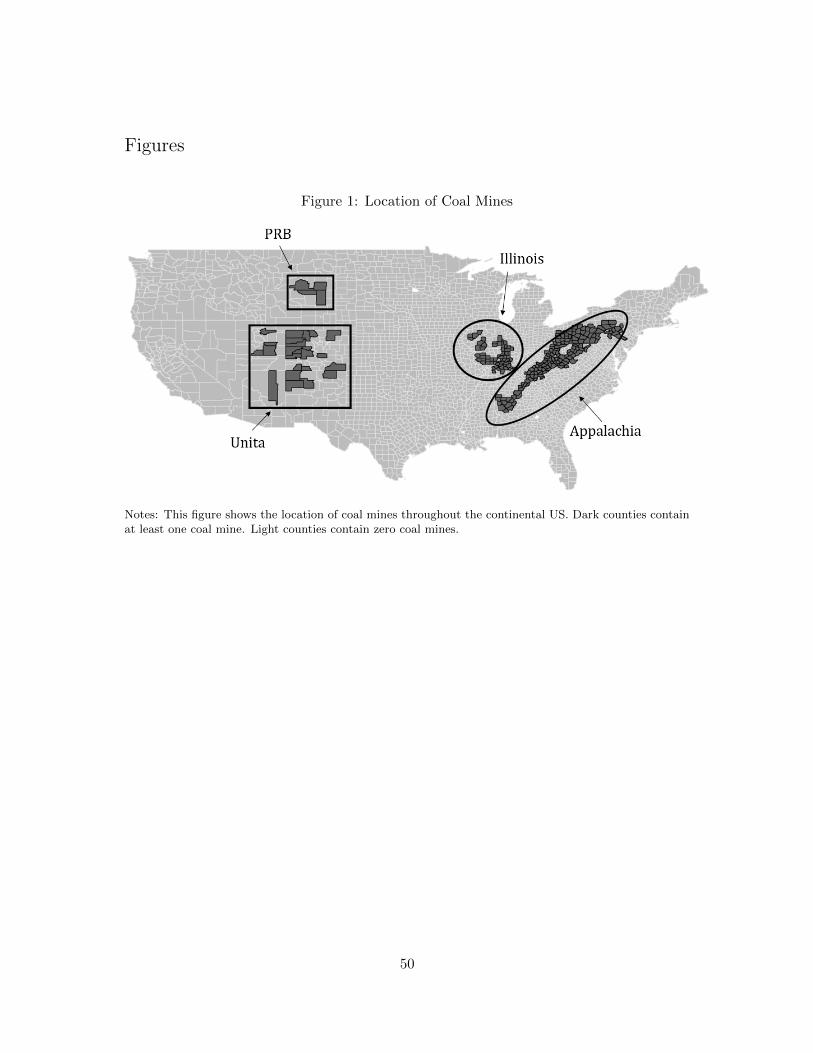
Figures
Figure 1: Location of Coal Mines
Notes: This figure shows the location of coal mines throughout the continental US. Dark counties containat least one coal mine. Light counties contain zero coal mines.
50

Figure 2: Prices and Productivity in the Railroad Sector
Notes: This figure shows the time-series evolution of railroad prices (freight rates), productivity, revenue,and volume of shipments between 1964 and 2004. The base year is 1981. Data are taken from RailroadFacts (published by the Association of American Railroads) reported by Slack [2013].
51

Figure 3: Parallel Trends Test
Notes: This figure presents graphical evidence on the parallel trends assumption. The excluded years are1972 and 1973. Blue dots denote the coefficient estimate on the East * Year interactions. 95% confidenceintervals are denoted by vertical lines.
52

Figure 4: Generation Capacity by Market
Notes: This figure shows total capacity (in megawatts) of coal-fired electricity power stations in the Eastand West during each year of the sample. Data are taken from EIA Form 759.
53

Figure 5: Market Prices
Notes: This figure plots average monthly prices (in 2009 US$’s) within the treatment and control groupbetween January 1972 and December 1987. The vertical line corresponds to October 1980 when theStaggers Rail Act was signed into law.
54


