
VEOLIA WATER TECHNOLOGIESUsing Infonet Mobility Solution Technology to
capture complete, accurate and live data
during maintenance and condition
assessment works
Veolia Water Network Services
>

It all starts with Safety

1. About Veolia
• Who is Veolia and what do we do
2. Key Concepts
• Understand the now
• Key Questions
3. Technology
4. Application of the technology
• The Client Challenge
• Contract overview
• Data exchange between Client and Contractor
• Evolution to Infonet Solution
5. Discussion
3
Contents of todays Presentation

About VeoliaWho we are & What we do?
4Veolia Network Services, Mark Trembath Pipeline February 2015

Brief History of the VeoliaVeolia Water Network Services is part of Veolia Water France who is a world leading construction specialist in water distribution networks and wastewater collection systems with over 90 years of experience in Australia and worldwide which enable us to be a one stop shop solution for management of underground sewer, drinking water and storm water assets.
Details of the size of our organisationVeolia is a 40 Billion dollar company employing 174,000 people in 50 countries.
In Australia and New Zealand, Veolia employs over 4,000 people.
Veolia supplies water, energy and waste services as part of our portfolio.
Globally in 2015, we supplied:
100 million residents provided with drinking water
71 million residents provided with wastewater treatment services;
54 million residents provided with waste-collection services;
11 million residents provided with heat
Local PresentVeolia Water Network Services operates from a large depot at Rocklea with over 45 field staff, 6 Project Engineers, 2 Project Managers and over 30 fleet vehicles/ operational equipment.
Who we are……………..
Veolia Water Network Services- Unity Water June 2015 5

Veolia Water Network Services
We provide tailor made and cost effective rehabilitation solutions as an alternative to traditional methods of pipe repair.
Provide trenchless services, including pipe bursting, pipe lining, repairs and manhole rehabilitation.
Civil Construction of new assetsWater mains
Sewer mains
Pump stations etc
Undertake development of maintenance strategies and implementation
Asset maintenance/ cleaning and repairs of Water, stormwater and sewer pipeline networks including valves and sewer doors etc
Civil assets such as reservoirs
M&E assets such as water and sewerage pump stations
Undertake condition assessment of Pipeline networks using
traditional CCTV inspections and
Australian first 3D Panoramo inspection
Leak Detection
Ecologics/ Pure Technologies
Rollout of Mobility solutions to undertake asset maintenance and inspection to be up loaded into Client GIS/ AMS
What we do?
Veolia Water Network Services- Unity Water June 2015 6

Key ConceptsUnderstand the now
7Veolia Network Services, Mark Trembath Pipeline February 2015
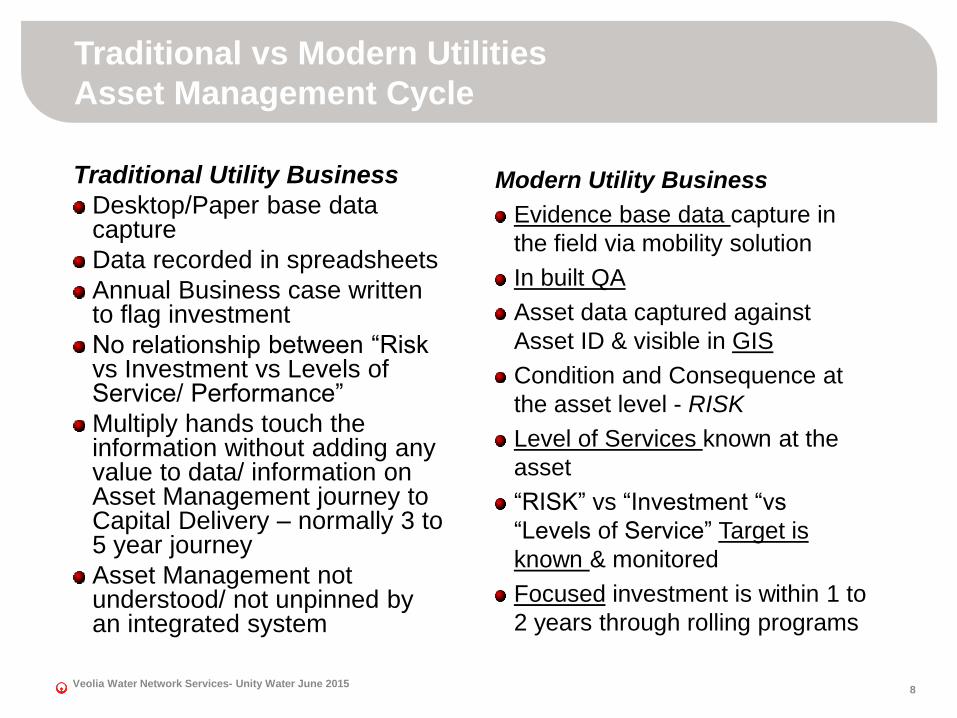
Traditional Utility Business
Desktop/Paper base data capture
Data recorded in spreadsheets
Annual Business case written to flag investment
No relationship between “Risk vs Investment vs Levels of Service/ Performance”
Multiply hands touch the information without adding any value to data/ information on Asset Management journey to Capital Delivery – normally 3 to 5 year journey
Asset Management not understood/ not unpinned by an integrated system
Traditional vs Modern Utilities
Asset Management Cycle
Veolia Water Network Services- Unity Water June 20158
Modern Utility Business
Evidence base data capture in
the field via mobility solution
In built QA
Asset data captured against
Asset ID & visible in GIS
Condition and Consequence at
the asset level - RISK
Level of Services known at the
asset
“RISK” vs “Investment “vs
“Levels of Service” Target is
known & monitored
Focused investment is within 1 to
2 years through rolling programs

Is the Maintenance/ Asset management strategy right? “we have always done it that way”
What is acceptable Risk vs Investment vs Level of Service? – “Are we investing in the right areas for the required level of service at the acceptable risk level?”
Data Capture – “What data do you really need?”
What is the data exchange between parties?
Who are our internal champions to go on this journey? ……Who are not?
What are the expectations of our stakeholder?
What technology can you use utilitise to achieve this?
Key Questions
Veolia Water Network Services- Unity Water June 2015 9

Technologies
10Veolia Network Services, Mark Trembath Pipeline February 2015

Data Storage, Management and Analysis
Operational Planning and Management
Strategic Network Planning – risk based approach
Scheduling
Mobility Solution
Condition Assessment
Locating Assets
GPS & GIS asset layer
Flexible data delivery
Dashboard reporting
Why INFONET – Total Asset Management Solution
Veolia Water Network Services- Unity Water June 2015 11

Application of the Technology
12Veolia Network Services, Mark Trembath Pipeline February 2015

Client managing numerous maintenance contractors to undertake planned maintenance activity
Traditional mobility solution was geared towards internal delivery model and was very expensive to rollout out to contractors
It was not easily scalable
Security was any issue
Could not capture the require asset condition data and associated photos
Not flexible and adaptable to the needs of the business
It was very expensive to rollout and required the client to supply tablets
Delivery Risk/ Issues
Significant data captured by contractors was paper based and data entered into spreadsheets
It was hard to manage the volume of data and invoice on work
Client was acting as Principal and thus hard to ensure safety processes were followed
The Client’s Challenge
TITRE PRÉSENTATION / SOUS TITRE / DATE 13

Veolia awarded the Sewer Cleaning, Inspection and Evaluation Contract – 5 year + 1+ 1+1
A performance based contract with significant data capture requirements linked to KPIs.
Delivery Risk/ Issues
Significant data captured required by Veolia to deliver back to Client
Evidence base payment on significant volume of data Photos of before and after
Asset condition data from inspection forms
CCTV footage etc
Veolia has to service both responsive and planned sewer maintenance, mobility solution to incorporate strong GIS and crew scheduling solution
Veolia to ensure safety processes were followed and recorded
Contract Overview
TITRE PRÉSENTATION / SOUS TITRE / DATE 14

Spreadsheet method handover of maintenance program each
Quarter
Two main spreadsheetsCCTV and Cleaning Package between 3500 to 4500 Jobs per Quarter
Pump Station, Screens and a Grit Cleaning between 13000 to 1600 Jobs per Quarter
Magically goes into INFONET & Geocode to GIS Object
Returned to client as CSV files and photos Vidoes etc
Three main CSV files with photo & CCTV FootageCCTV
Cleaning
Pump Station Screens etc
Data exchange between Client & Contractor
TITRE PRÉSENTATION / SOUS TITRE / DATE 15

Phase 1 – Rolled out semi paper based / smart phone solution underpinned by Infonet platform
Work/ Maps generated from Infonet and issued to crews
Smart phones used to capture photos of:Before and after
Paper based completed forms e.g asset data, Safety data etc
Email all photos to data entry person to capture in Infonet
Phase 2 – Rollout of Infonet Mobility Solution
Allows data captured in the field and streamed back to HQAll asset condition data
All photos before and after
All work order data
Allows full GIS support to the field crews
Phase 3 – Implementation of QA Tools
Evolution to Infonet Solution
TITRE PRÉSENTATION / SOUS TITRE / DATE 16
DISCUSSION
Veolia Water Network Services- Unity Water June 2015 17


