QUARTERLY ECONOMIC NEWSLETTER
EVE ONLINE
2nd Quarter 2010


QUARTERLY ECONOMIC NEWSLETTER
4

5
TABLE OF CONTENTS
Editorial 6
Demographics 8
Population 8
Ship Types in Use 10
Population Distribution 13
Price Level Changes 18
Mineral Price Index (MPI) 18
Primary Producer Price Index (PPPI) 23
Secondary Producer Price Index (SPPI) 25
Consumer Price Index (CPI) 26
Summary 27
Insurance changes 28
Market Snapshots 34
PUBLICATION INFORMATION
Editor
Dr. Eyjólfur Guðmundsson, CCP
Lead Economist
DISCLAIMER
This document is a part of the EVE-Online website. All user agreements and
licensing applies to this document as described in the terms of use agree-
ment. Numbers might not add up due to rounding.
6
June of 2010 will be long remembered in New Eden as the time when EVE pilots got Planetary In-
teraction, a concept which marked the beginning of a new era for EVE. In the time since its launch,
pilots have embraced this new feature by putting down more than 600,000 command centers and
millions of extractor pins.
Planetary Interaction adds yet more depth to EVE by catering to the needs of the industrialist/
trader. Even though only a month has passed since it came out, Planetary Interaction has already
had quite a significant impact on the EVE economy; hence, we expect PI will receive special men-
tion in coming QENs.
The second quarter of 2010 has been interesting for the EVE economy. Not only was Planetary
Interaction introduced to the game, there were also changes to mineral supplies through changes
in loot drops. In addition the insurance system was overhauled, causing a massive change in pilot
behavior. The insurance changes get a special chapter in this QEN.
These changes to EVE result in an anomaly in the economic cycle of EVE. Usually there is an
increase in prices just before – and during – the month of an expansion. However, in this case the
impact of the changes made to the insurance system and the loot drops resulted in a significant
price decrease for minerals and Tech I stuff. The overall result is a price deflation during an expan-
sion month – a phenomenon new to EVE.
EDITORIAL
7
Future prospects for the EVE economy are really optimistic. First of all, we have more pilots fly-
ing around in EVE than ever before. More pilots bring more activity and add to the experience for
other pilots, whether directly or indirectly. With the aforementioned changes, the market is still
adjusting to the new information, which gives the hardcore trader an opportunity to make some
additional ISK. We are therefore expecting Q3 to be especially interesting from an economic per-
spective, with further growth expected throughout the year with increased uncertainty while the
market stabilizes around new features and balancing changes. Who would ever have thought that
an economist would consider increased uncertainty to be good (fun) for an economy?
Enough of the small talk – let’s go out there and make some ISK!
„....the impact of the changes made to the insurance
system and the loot drops resulted in a significant price
decrease for minerals and Tech I stuff.“

8
POPULATION
The four races of EVE Online are the Amarr, Caldari, Gallente and Minmatar – each with 3 blood-
lines. Back in 2007 we reported on the share of each race when there were 433,000 characters
in EVE. (see QEN Q3 2007). Now, three years later, the number of characters has almost doubled,
with EVE currently sporting 712,000 characters. Additionally, there has been a significant change
in the percentage of each race. Amarr now has 18.3% of all characters, but had 15.6% back in 2007.
Of all characters in EVE today, 35.7% are Caldari, 25.7% are Gallente and 19.8% are Minmatar (the
2007 ratio was 37.8%, 26.7% and 19.8%, respectively). Hence, Amarr and Minmatar numbers have
increased while the Gallente and Caldari have a lower share than before. Changes to the character
attribute system, introduced with Apocrypha in March 2009, are the reason for the shift towards
the Amarr and Minmatar races. Since these races are now more balanced, players who select
them can more easily develop their characters’ attributes right from the beginning of their EVE
career. This is also reflected in the average age of characters by race. The Gallente and Caldari
characters are just under 2 years of age on average, while Minmatar characters are 1.8 years old.
Amarr characters tend to be the youngest, with an average age of 1.7 years at the end of Q2 2010.
Figure 1: Number of EVE accounts in Q2 2010. With well over 340,000 accounts and more than 712,000 characters, EVE is larger
than ever before.
In Q2 of 2010, EVE continued to grow. The current number of accounts is well over 340,000 and
with the launch of Tyrannis in June account numbers have continued to increase into Q3 of 2010.
EVE’s accounts, with the aforementioned total of 712,000 characters, have accumulated a total of
8.7 trillion skill points. The characters reside within 28 Non-Player Character (NPC) corporations
DEMOGRAPHICS
9
and 74,000 player-run corporations. The player-run corporations range in size from just one mem-
ber to about 1,500 members. Overall, just over 50% of all characters reside in player corporations
while the other half reside in NPC corporations. There are more Amarr and Minmatar characters in
NPC corporations than in player corporations, relatively speaking. In NPC corporations about 20%
of the characters are Amarr, while 17% of the characters in player corps are Amarr.
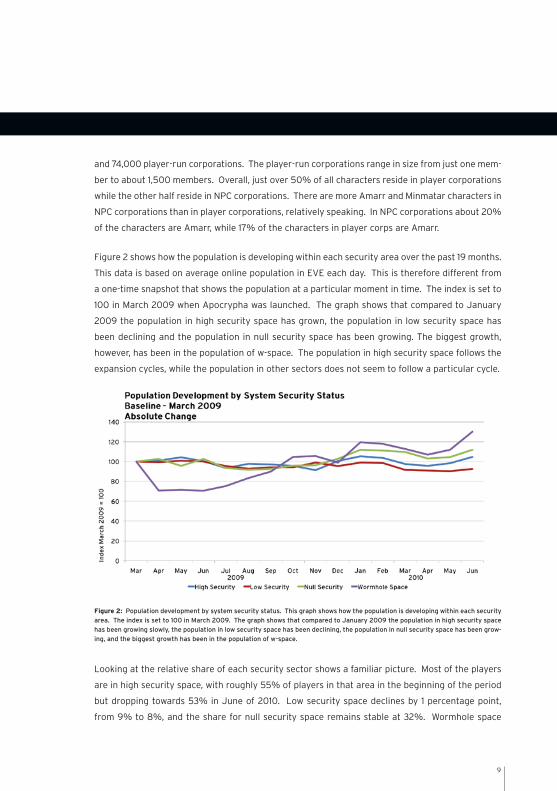
Figure 2 shows how the population is developing within each security area over the past 19 months.
This data is based on average online population in EVE each day. This is therefore different from
a one-time snapshot that shows the population at a particular moment in time. The index is set to
100 in March 2009 when Apocrypha was launched. The graph shows that compared to January
2009 the population in high security space has grown, the population in low security space has
been declining and the population in null security space has been growing. The biggest growth,
however, has been in the population of w-space. The population in high security space follows the
expansion cycles, while the population in other sectors does not seem to follow a particular cycle.
Figure 2: Population development by system security status. This graph shows how the population is developing within each security
area. The index is set to 100 in March 2009. The graph shows that compared to January 2009 the population in high security space
has been growing slowly, the population in low security space has been declining, the population in null security space has been grow-
ing, and the biggest growth has been in the population of w-space.
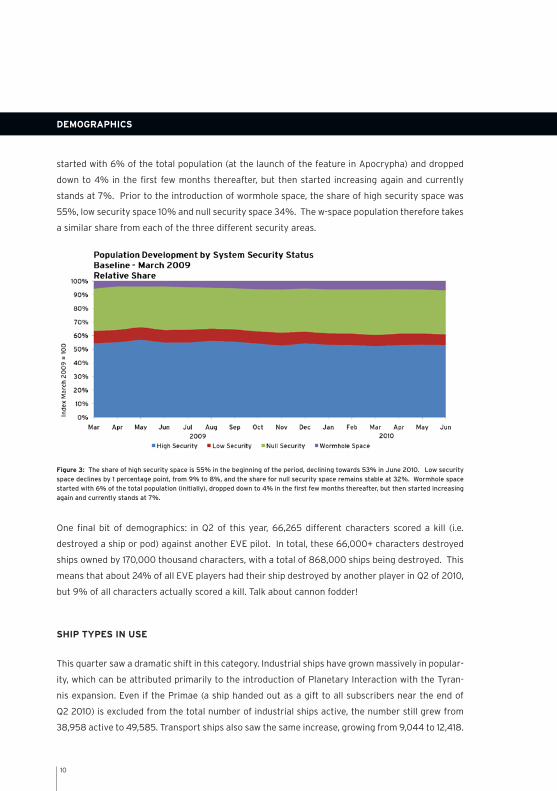
Looking at the relative share of each security sector shows a familiar picture. Most of the players
are in high security space, with roughly 55% of players in that area in the beginning of the period
but dropping towards 53% in June of 2010. Low security space declines by 1 percentage point,
from 9% to 8%, and the share for null security space remains stable at 32%. Wormhole space
10
started with 6% of the total population (at the launch of the feature in Apocrypha) and dropped
down to 4% in the first few months thereafter, but then started increasing again and currently
stands at 7%. Prior to the introduction of wormhole space, the share of high security space was
55%, low security space 10% and null security space 34%. The w-space population therefore takes
a similar share from each of the three different security areas.
Figure 3: The share of high security space is 55% in the beginning of the period, declining towards 53% in June 2010. Low security
space declines by 1 percentage point, from 9% to 8%, and the share for null security space remains stable at 32%. Wormhole space
started with 6% of the total population (initially), dropped down to 4% in the first few months thereafter, but then started increasing
again and currently stands at 7%.
One final bit of demographics: in Q2 of this year, 66,265 different characters scored a kill (i.e.
destroyed a ship or pod) against another EVE pilot. In total, these 66,000+ characters destroyed
ships owned by 170,000 thousand characters, with a total of 868,000 ships being destroyed. This
means that about 24% of all EVE players had their ship destroyed by another player in Q2 of 2010,
but 9% of all characters actually scored a kill. Talk about cannon fodder!
SHIP TYPES IN USE
This quarter saw a dramatic shift in this category. Industrial ships have grown massively in popular-
ity, which can be attributed primarily to the introduction of Planetary Interaction with the Tyran-
nis expansion. Even if the Primae (a ship handed out as a gift to all subscribers near the end of
Q2 2010) is excluded from the total number of industrial ships active, the number still grew from
38,958 active to 49,585. Transport ships also saw the same increase, growing from 9,044 to 12,418.
DEMOGRAPHICS
11
This growth in popularity has led to two industrial ships jumping into the top ten – the Bestower
and the Badger Mark II.
Ship type No. of Ships % of Total Change
1 Primae 16,607 2.32% New2 Hulk 16,472 2.30% -13 Drake 16,465 2.30% -14 Kestrel 11,415 1.59% -15 Rifter 10,932 1.52% -16 Retriever 9,031 1.26% -17 Bestower 8,496 1.18% 48 Badger Mark II 8,326 1.16% 79 Raven 7,646 1.07% -310 Hurricane 7,343 1.02% 2
Rookie ships, shuttles and capsules 284,341 39.66%Other 319,916 44.62%
Total 716,990
Table 1: The ten most flown ships at the end of Q2, 2010. The Primae has gained the top spot after being given out as a free gift to all
subscribers near the end of Q2. The most interesting change, though, is the increased popularity of industrial ships vs. combat ships
– a trend attributed to the introduction of Planetary Interaction in Tyrannis.
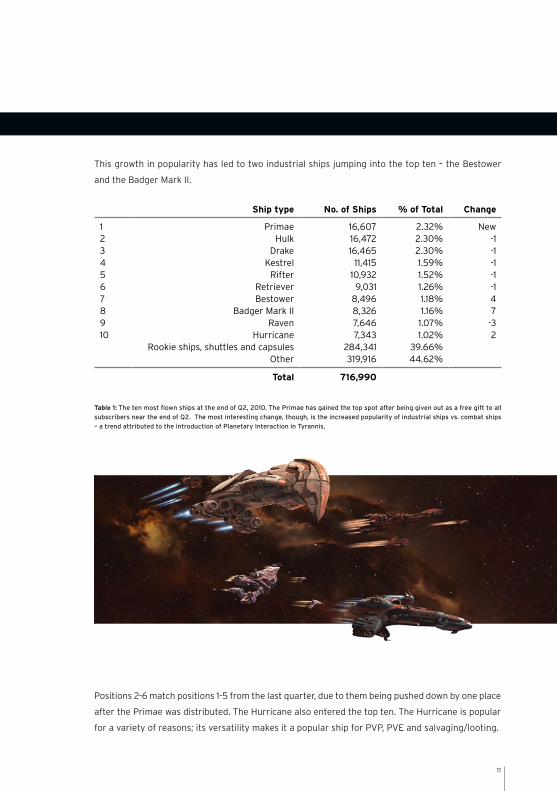
Positions 2-6 match positions 1-5 from the last quarter, due to them being pushed down by one place
after the Primae was distributed. The Hurricane also entered the top ten. The Hurricane is popular
for a variety of reasons; its versatility makes it a popular ship for PVP, PVE and salvaging/looting.
12
Electronic attack ships remain the least flown ship group, with only 261 being flown. The ship group
that saw the highest growth in use as a percentage gain since last quarter was supercarriers, grow-
ing 48.15% in a single quarter, from 650 to 963 ships, after having increased from 550 at the end
of Q4 2009. This can be attributed to balancing changes in the Dominion expansion in Q4 2009,
where their hit points were dramatically increased and a new type of drone (fighter bombers) ex-
clusive to the supercarrier group was introduced.
Ship group Q1, 2010 Q2, 2010 Growth
1 Supercarrier 650 963 48.15%2 Black Ops 260 364 40.00%3 Transport Ship 9,044 12,418 37.31%4 Strategic Cruiser 5,392 7,355 36.41%5 Industrial 38,958 49,585 27.28%
Table 2: The top 5 ship groups in terms of percentage growth in popularity in Q2 compared to Q1.
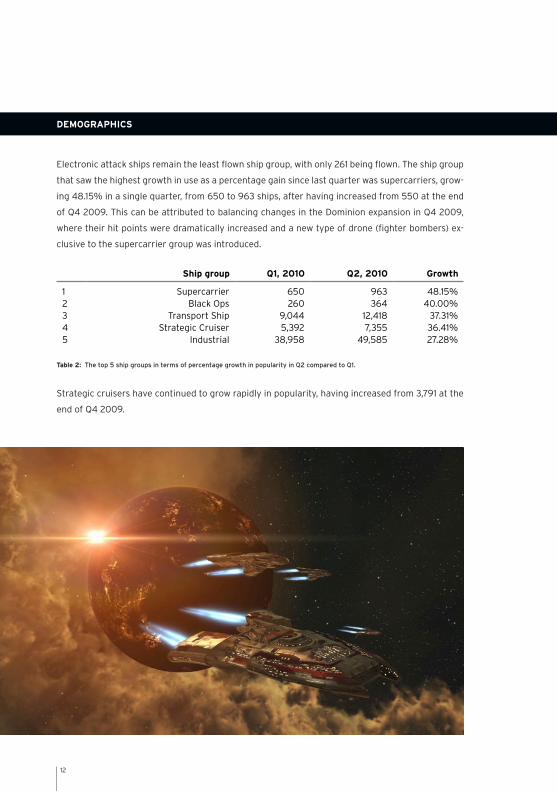
Strategic cruisers have continued to grow rapidly in popularity, having increased from 3,791 at the
end of Q4 2009.
DEMOGRAPHICS

13
POPULATION DISTRIBUTION
The last quarter has seen a slight yet significant shift in population distribution, with a higher pro-
portion of characters located outside of empire space.
As in previous editions of the QEN, we have divided EVE into eleven sectors. These sectors are the
four empires (with the minor empires of Ammatar and Khanid being included as part of the Amarr
Empire), wormhole space (unknown space), and null security space, which is divided into a further
six sectors. Null security space has been divided as follows:
North West South South East East North East
Geminate Deklein Delve Providence Great Wildlands Cobalt EdgeVale of the Silent Fade Querious Catch Curse Outer PassageTribute Pure Blind Period Basis Immensea Scalding Pass OasaVenal Cloud Ring Stain Tenerifis Wicked Creek Perrigen FallsBranch Outer Ring Esoteria Impass Insmother MalpaisTenal Syndicate Paragon Soul Feythabolis Detorid The Kalevala Expanse Fountain Cache Etherium Reach
The Spire
Table 3: The division of null security space into sub-categories. There are six subcategories defined covering 41 regions.
As can be seen in the following table, population distribution in empire has seen a further shift
towards Caldari space, with Gallente space actually declining in population compared to the last
quarter. With the exception of the southern sector, all null security sectors saw considerable
growth, particularly the northeast, also commonly known as the ‘drone regions.’
Sector SystemsPopulation
Q1 2010Population
Q2 2010 Change
Caldari 326 226,009 233,733 3.42%Amarr 913 150,841 153,958 2.07%Gallente 388 136,290 136,246 -0.03%Minmatar 280 97,450 99,980 2.60%West 500 15,241 16,238 6.54%North 513 14,051 15,962 13.60%East 564 13,991 15,526 10.97%Southeast 540 11,094 12,671 14.21%South 488 10,029 9,499 -5.28%Northeast 689 5,808 6,843 17.82%Unknown 2,499 12,174 15,808 29.85%
Table 4: Population distribution in EVE as of the end of Q1 2010 and Q2 2010 amongst the eleven previously defined sectors, and the
percentage change in population.

14
Both null security and wormhole space have seen significant increases in population as was shown
in Figure 2 above. Out of all sectors, wormhole space has had the largest increase in percentage
terms at 29.85%, now accounting for 2.21% of all active characters. Note that a previous para-
graph in this chapter cited a w-space population share of 7%. The reason for the difference lies in
different definitions of the figure. The 7% figure shows the average percentage of characters that
are actually logged in at any time, while the 2.21% shown here is the percentage of all characters,
whether they’re logged in or not. The difference suggests that characters in wormhole space are
there to be active, while empire space is full of market-checking alts and other characters with
little login time.
TypePopulation
Q1 2010Population
Q2 2010Q1
% of TotalQ2
% of Total Change
Empire 610,590 623,917 88.11% 87.08% -1.03%Null Security 70,214 76,739 10.13% 10.71% 0.58%Wormhole 12,174 15,808 1.76% 2.21% 0.45%
Table 5: The total population of empire, null security and wormhole space at the end of Q1 2010 compared to the end of Q2 2010.
Wormhole space has continued to see rapid growth throughout the last quarter.
The increase in population in null security space can be considered to be related to the changes
made in the Dominion expansion in Q4 2009, which drastically increased available resources in null
security systems where the infrastructure has been developed by the owning alliance.
SystemCharacters
Q1 2010Characters
Q2 2010 % ChangeRank
Change
Jita 28,996 31,199 7.60% -Rens 7,609 8,372 10.03% -Amarr 7,124 7,894 10.81% -Dodixie 5,838 6,189 6.01% -Arnon 3,319 3,732 12.44% 2Motsu 3,473 3,550 2.22% -Oursulaert 3,616 3,496 -3.32% -2Hek 3,144 3,437 9.32% -Perimeter 2,365 2,490 5.29% 1Akiainavas 2,534 2,384 -5.92% -1
Total in Top 10: 68,018 72,743 6.95%Total in All: 458,728 487,933 6.37%% in Top 10 Systems: 14.83% 14.91% 0.55%
Table 6: The 10 highest-population systems as of the end of Q2 2010 compared to Q1 2010. These numbers exclude characters with
either a capsule or rookie ship as their active ship.
DEMOGRAPHICS
15
Jita has continued to see growth at a rate faster than the rate of growth in characters, as have
Rens and Amarr, the primary Minmatar and Amarr trade hubs. Arnon saw the greatest growth in
percentage terms, growing by 12.44% compared to Q1 2010. The Arnon system is where the Blood-
Stained Stars epic mission arc begins (you can read more about epic mission arcs at the following
address: http://wiki.eveonline.com/en/wiki/Epic_Mission_Arcs).
A slight shift was noted from other systems towards the highest-population systems, with 14.91%
of all characters matching our criteria (characters on active accounts not occupying either a rookie
ship or capsule) in the top ten, compared to 14.83% at the end of Q1 2010. However, the top 1% of
populated systems saw a slight decrease, containing 170,012 or 34.84% of all characters, compared
to 36.29% last quarter. The top 10% of populated systems contained 78.92% of the population,
representing a similar structure as in real life, where population tends to gravitate towards urban
areas (in the case of EVE, areas of high population density).
16
THE MONETARY SYSTEM
ISK in EVE circulates between players and from players to NPCs and vice versa. When an NPC agent
sells goods to players ISK goes out of circulation (this is called a sink), but when a player sells goods
to an NPC’s agent more ISK is pumped into the EVE economy, increasing the money supply (this
is known as a faucet).
The largest faucet in EVE by far is bounty prizes. Each month players receive about 20 trillion ISK
in bounties for hunting rats. Agent mission rewards and time bonus rewards in June stacked up
to 3.3 trillion ISK. Another large faucet is insurance, but its scope dropped significantly with the
Tyrannis launch on May 26. Tyrannis introduced changes to the insurance system that made the
insurance valuation more dynamic. This meant the insurance system became less beneficial, which
led to a 70.6% drop in June insurance payouts.
While the ISK faucet diminished, so did the sink. NPC commodities represent a large part of the
sink and on June 17, trade with structures and planetary commodities was made completely player-
driven. This caused a significant proportion of the ISK outflow decrease, which was somewhat
offset by the new NPC products entering the market via Planetary Interaction.
It is safe to say that players have shown Planetary Interaction a great deal of interest from the very
moment they could create their own colonies on June 8. There are over 60,000 planets across the
EVE universe, and in mid-June around 30,000 of them had already been affected by Planetary In-
teraction. More than 630,000 command centers were bought in June. When monitoring the NPC-
traded planetary items and the planetary export/import tax, we see that PI is having a significant
impact on the EVE ISK supply.
DEMOGRAPHICS

17
Figure 4: The above graph shows the development of sinks and faucets during the course of May. The first 2 days of May saw very
large sinks as players hoarded NPC trade goods related to PI; for example, the trade value of silicate glass alone on May 1 was around
2.6 trillion ISK. The average sink per day then balanced out, with around 300 billion ISK going out of EVE each day, except for the
spike after the Tyrannis launch due to players buying PI commodities. The May 26 dip in faucets is due to the Tyrannis expansion
downtime (as the faucets are, of course, activity-based), and the reason the sinks didn’t drop concurrently was a large increase in
NPC commodity consumption.
The total ISK in EVE by the end of June was approximately 400 trillion ISK, but the growth of the
money supply in Q2 slowed down compared to the 10.4% Q1 increase. In April the money supply
increased by about 13 trillion ISK, but in June the increase was only 2.3 trillion ISK. The money sup-
ply in Q2 increased by 6.1%, which is significantly less than in Q1 and indicates EVE’s money supply
is gaining more stability.
18
All price indices for EVE are calculated as Laspeyres indices, in which the base is updated monthly
based on total trade value of individual items in the previous month. Within each index there is a
variety of items, ranging from eight items for the Mineral Price Index to over 4,000 for the Con-
sumer Price Index.
MINERAL PRICE INDEx (MPI)
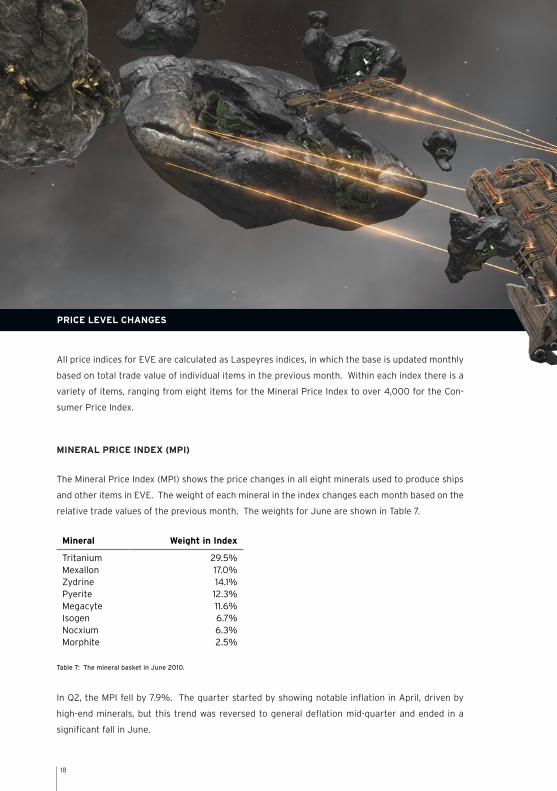
The Mineral Price Index (MPI) shows the price changes in all eight minerals used to produce ships
and other items in EVE. The weight of each mineral in the index changes each month based on the
relative trade values of the previous month. The weights for June are shown in Table 7.
Mineral Weight in Index
Tritanium 29.5%Mexallon 17.0%Zydrine 14.1%Pyerite 12.3%Megacyte 11.6%Isogen 6.7%Nocxium 6.3%Morphite 2.5%
Table 7: The mineral basket in June 2010.
In Q2, the MPI fell by 7.9%. The quarter started by showing notable inflation in April, driven by
high-end minerals, but this trend was reversed to general deflation mid-quarter and ended in a
significant fall in June.
PRICE LEVEL CHANGES

19
Figure 5: The Mineral Price Index fell by 7.9% in Q2. The fall is primarily caused by changes to insurance payouts, which removed an
artificial price floor on the mineral basket.
We split minerals into two categories: low-end minerals and high-end minerals. The low-end miner-
als contain Tritanium, Pyerite, Mexallon and Isogen, while the high-end category includes Nocxium,
Zydrine, Megacyte and Morphite.
20
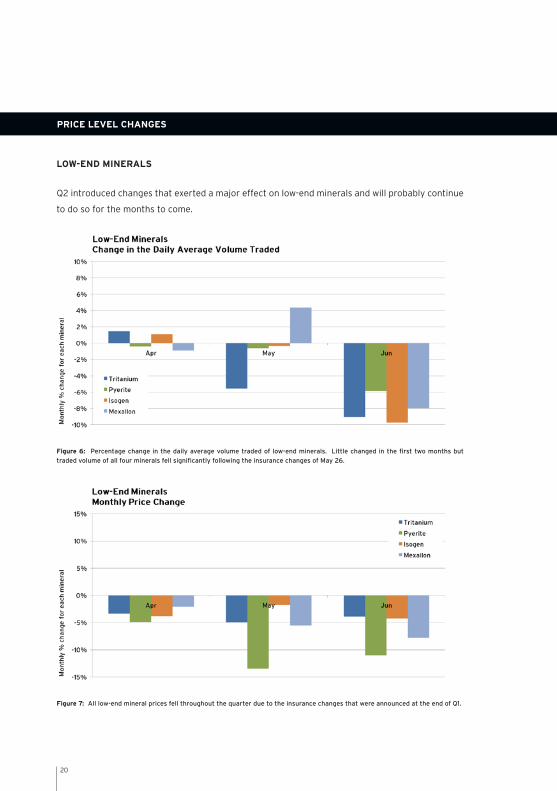
LOW-END MINERALS
Q2 introduced changes that exerted a major effect on low-end minerals and will probably continue
to do so for the months to come.
Figure 6: Percentage change in the daily average volume traded of low-end minerals. Little changed in the first two months but
traded volume of all four minerals fell significantly following the insurance changes of May 26.
Figure 7: All low-end mineral prices fell throughout the quarter due to the insurance changes that were announced at the end of Q1.
PRICE LEVEL CHANGES

21
On March 30 a dev blog was published in which a change to the insurance system was announced.
The change was to make insurance payouts dynamic, based on the market prices of the materials
required to produce each ship. The purpose of the change was to remove the floor on ship prices
by making self-destruction unprofitable. This would in turn mean a certain fall in mineral prices,
because insurance had been keeping those prices up since October 2009.
This had little effect on traded volume in April and May, although production of Tech I ships fell by
around 8% in April and remained at that level through May. In June, however, after the implemen-
tation of the change, Tech I production fell by 13.5% and traded volume fell a little more than that,
as the prices of Tech I ships started to fall.
The prices of all low-end minerals fell throughout Q2, both before and after the change, which was
implemented on May 26. The fall was fairly even for the low-end minerals except for Pyerite which
fell considerably more, having risen extraordinarily in Q4 2009 and Q1 2010. The rise in Pyerite
prices in those two quarters happened because the mineral became the new bottleneck in the
mineral supply, once the asteroid changes had widened the old bottleneck, which was Tritanium.
This QEN offers a more detailed discussion of the insurance issue in a special chapter on the subject.

22
HIGH-END MINERALS
High-end minerals were the subject of considerable supply and demand changes in Q2, which is
reflected in large price changes this quarter.
Figure 8: Daily average volume traded was fairly stable in Q2, except for Nocxium which was the subject of heavy speculative trading.
Figure 9: The price of high-end minerals rose sharply in April following a dev blog announcing changes to 3 different mineral sources.
Nocxium was less affected in April than the other minerals but instead its price jumped by 34% in May.
PRICE LEVEL CHANGES

23
The dev blog that announced the aforementioned change to insurance payouts also announced
other changes. Meta 0 loot drops were to be reduced, changes in null security asteroids were to
encourage more mining of low-end minerals and, possibly most importantly, drone compounds
were to be changed, both their drop quantities and their reprocessing yield. Since drone com-
pounds were known for being a particularly rich source of Zydrine, there was a good deal of player
speculation on whether the net effect of the insurance and drone compound changes would be a
drop or a rise in Zydrine prices.
Since Q4 2009 and through Q1 2010, Zydrine, Megacyte and Morphite had been falling significantly,
due to increased supply after the release of Dominion. In April, after the dev blog, the prices of
these minerals rose rather sharply as players started to predict the new equilibrium. Nocxium
prices rose a little that month, though not to the same degree. The month after, however, saw a
34% jump in Nocxium prices. At the same time, the volume of traded Nocxium jumped by 21.5%,
while Nocxium used for ship construction only increased by 7.9%, which indicates the extent of
speculative trading.
In June, after the implementation of the changes, Zydrine, Megacyte and Morphite prices fell con-
siderably, i.e. by 16%, 11% and 15% respectively, as the speculatively established equilibrium of
April got adjusted to a new reality.
PRIMARY PRODUCER PRICE INDEx (PPPI)
The Primary Producer Price Index consists of manufacturing items used for the production of
other manufacturing items at the secondary stage. Manufacturing items used for the production
of final consumer goods are excluded. The index includes such item groups as drone compounds,
moon materials, and items used in invention.
24
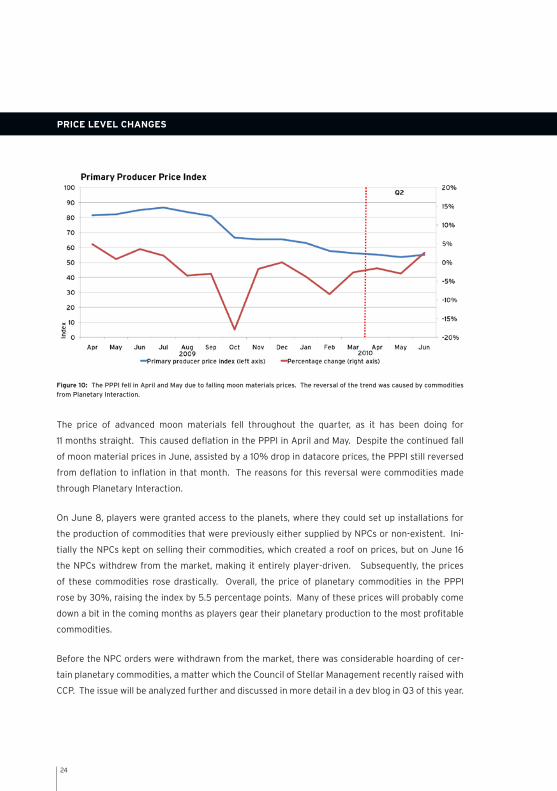
Figure 10: The PPPI fell in April and May due to falling moon materials prices. The reversal of the trend was caused by commodities
from Planetary Interaction.
The price of advanced moon materials fell throughout the quarter, as it has been doing for
11 months straight. This caused deflation in the PPPI in April and May. Despite the continued fall
of moon material prices in June, assisted by a 10% drop in datacore prices, the PPPI still reversed
from deflation to inflation in that month. The reasons for this reversal were commodities made
through Planetary Interaction.
On June 8, players were granted access to the planets, where they could set up installations for
the production of commodities that were previously either supplied by NPCs or non-existent. Ini-
tially the NPCs kept on selling their commodities, which created a roof on prices, but on June 16
the NPCs withdrew from the market, making it entirely player-driven. Subsequently, the prices
of these commodities rose drastically. Overall, the price of planetary commodities in the PPPI
rose by 30%, raising the index by 5.5 percentage points. Many of these prices will probably come
down a bit in the coming months as players gear their planetary production to the most profitable
commodities.
Before the NPC orders were withdrawn from the market, there was considerable hoarding of cer-
tain planetary commodities, a matter which the Council of Stellar Management recently raised with
CCP. The issue will be analyzed further and discussed in more detail in a dev blog in Q3 of this year.
PRICE LEVEL CHANGES
25
SECONDARY PRODUCER PRICE INDEx (SPPI)
The Secondary Producer Price Index contains production materials and other production items
that are used in the manufacturing of consumer goods, i.e. goods included in the Consumer Price
Index.
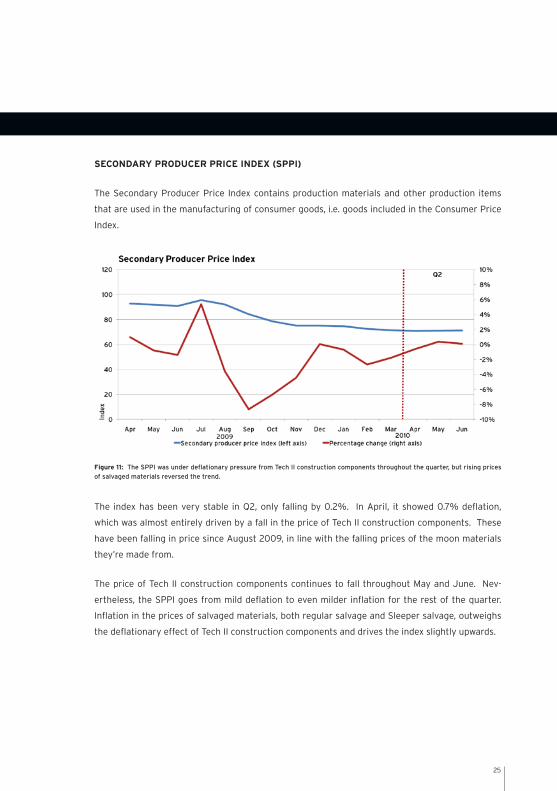
Figure 11: The SPPI was under deflationary pressure from Tech II construction components throughout the quarter, but rising prices
of salvaged materials reversed the trend.
The index has been very stable in Q2, only falling by 0.2%. In April, it showed 0.7% deflation,
which was almost entirely driven by a fall in the price of Tech II construction components. These
have been falling in price since August 2009, in line with the falling prices of the moon materials
they’re made from.
The price of Tech II construction components continues to fall throughout May and June. Nev-
ertheless, the SPPI goes from mild deflation to even milder inflation for the rest of the quarter.
Inflation in the prices of salvaged materials, both regular salvage and Sleeper salvage, outweighs
the deflationary effect of Tech II construction components and drives the index slightly upwards.

26
CONSUMER PRICE INDEx (CPI)
The Consumer Price Index measures the overall price changes of consumer products. This is not
limited to consumables such as fuel, ammunition or PLEXes, but also includes assets such as ships,
modules, implants and starbase structures. In summary, anything that is not primarily used to
produce other goods is included in the index, which contains over 4000 individual items.
Figure 12: Falling Tech I and Tech II ship prices caused deflation in the CPI in Q2, while rising PLEX prices at the beginning of the
quarter countered that pressure.
In the course of Q2, the CPI fell by 2.1%, mostly in the latter part of the quarter. There was actually
mild inflation in April, when a rise in PLEX prices outweighed the deflationary effect of other items.
PLEX prices continued to rise in May but started falling again in June. Implant prices also grew in
Q2, probably due to reduced mission running, which is the main source of implants.
The deflation of the quarter mainly stems from Tech II items and ice products, categories that often
are a large driver behind changes in the index. However, in June, Tech I ships fell in price by 5.3%,
which is unusual but logical in the wake of the introduction of dynamic insurance payouts, which
removed the price floor on ships. This price floor had held Tech I battleship prices steady since
October 2009, but from now on they‘re free to fall. This has led to a drop in mineral prices, so
Tech I ship prices will almost certainly fall further in the coming months.
PRICE LEVEL CHANGES
27
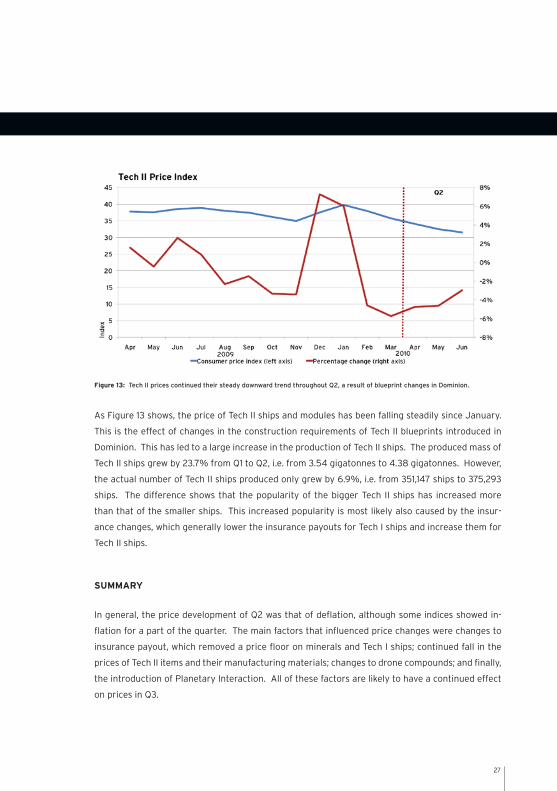
Figure 13: Tech II prices continued their steady downward trend throughout Q2, a result of blueprint changes in Dominion.
As Figure 13 shows, the price of Tech II ships and modules has been falling steadily since January.
This is the effect of changes in the construction requirements of Tech II blueprints introduced in
Dominion. This has led to a large increase in the production of Tech II ships. The produced mass of
Tech II ships grew by 23.7% from Q1 to Q2, i.e. from 3.54 gigatonnes to 4.38 gigatonnes. However,
the actual number of Tech II ships produced only grew by 6.9%, i.e. from 351,147 ships to 375,293
ships. The difference shows that the popularity of the bigger Tech II ships has increased more
than that of the smaller ships. This increased popularity is most likely also caused by the insur-
ance changes, which generally lower the insurance payouts for Tech I ships and increase them for
Tech II ships.
SUMMARY
In general, the price development of Q2 was that of deflation, although some indices showed in-
flation for a part of the quarter. The main factors that influenced price changes were changes to
insurance payout, which removed a price floor on minerals and Tech I ships; continued fall in the
prices of Tech II items and their manufacturing materials; changes to drone compounds; and finally,
the introduction of Planetary Interaction. All of these factors are likely to have a continued effect
on prices in Q3.
28
On May 26 changes were made to the insurance system, making the insurance values more dy-
namic. Insurance payouts of all ships will from now on be reviewed and revalued periodically based
on the cost of the materials required for their production.
The old system was based on fixed figures that were set at EVE‘s launch. These were supposed to
reflect the values of the insured ships, but this was bound to change sooner or later in an economy
as dynamic as EVE‘s. In retrospect, it‘s rather surprising that the old insurance values survived
for a full 7 years.
The main trigger for the insurance change was a change in the reseeding and respawning of as-
teroids that was introduced in June 2009. The change mostly affected Tritanium because it had
become a bottleneck in the mineral supply . Whereas before the scarcity had put a relatively high
price on Tritanium, the asteroid changes made it plentiful. As a result, the price of Tritanium fell by
a third before stabilizing in October of 2009.
The reason for the stabilization was insurance. The greatly lowered Tritanium prices drove down
ship prices to the point where it became profitable to construct ships for the purpose of insuring
them and then self-destructing them. Thus the fixed insurance payouts created a floor on the
price of ships, which in turn created a floor on the price of the basket of minerals required for ship
production, although prices of the minerals could still change relative to each other.
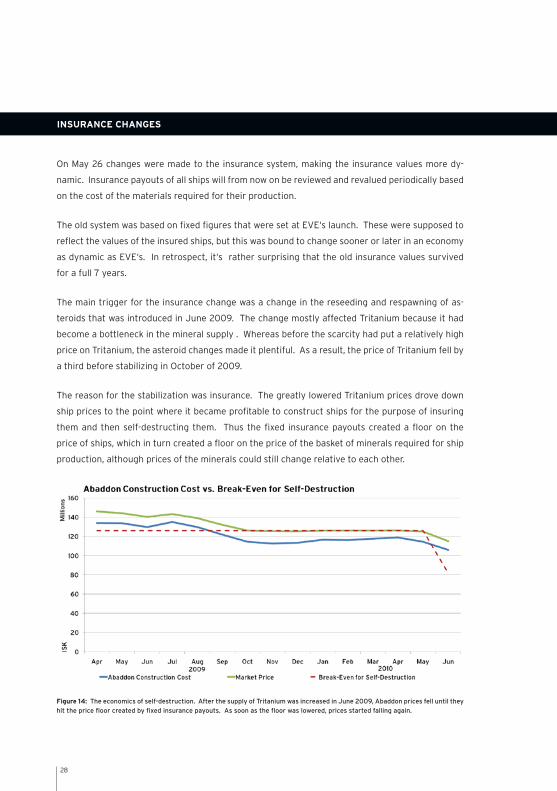
Figure 14: The economics of self-destruction. After the supply of Tritanium was increased in June 2009, Abaddon prices fell until they
hit the price floor created by fixed insurance payouts. As soon as the floor was lowered, prices started falling again.
INSURANCE CHANGES
29
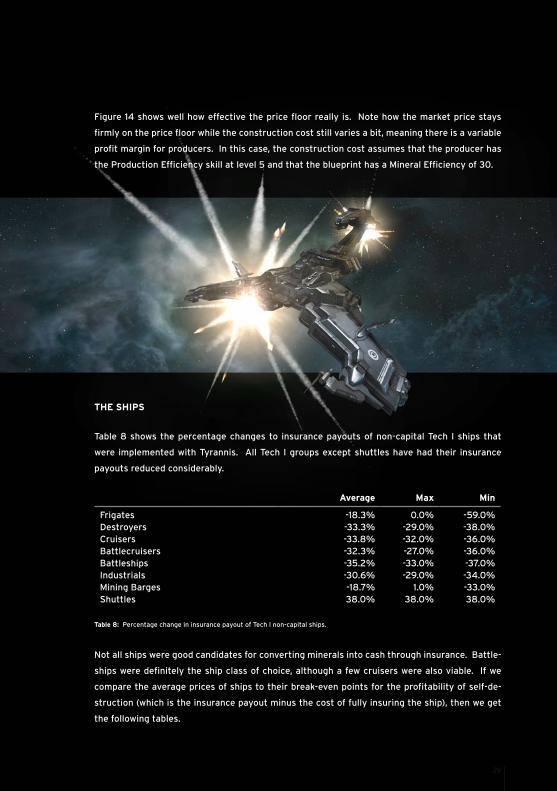
THE SHIPS
Table 8 shows the percentage changes to insurance payouts of non-capital Tech I ships that
were implemented with Tyrannis. All Tech I groups except shuttles have had their insurance
payouts reduced considerably.
Average Max Min
Frigates -18.3% 0.0% -59.0%Destroyers -33.3% -29.0% -38.0%Cruisers -33.8% -32.0% -36.0%Battlecruisers -32.3% -27.0% -36.0%Battleships -35.2% -33.0% -37.0%Industrials -30.6% -29.0% -34.0%Mining Barges -18.7% 1.0% -33.0%Shuttles 38.0% 38.0% 38.0%
Table 8: Percentage change in insurance payout of Tech I non-capital ships.
Not all ships were good candidates for converting minerals into cash through insurance. Battle-
ships were definitely the ship class of choice, although a few cruisers were also viable. If we
compare the average prices of ships to their break-even points for the profitability of self-de-
struction (which is the insurance payout minus the cost of fully insuring the ship), then we get
the following tables.
Figure 14 shows well how effective the price floor really is. Note how the market price stays
firmly on the price floor while the construction cost still varies a bit, meaning there is a variable
profit margin for producers. In this case, the construction cost assumes that the producer has
the Production Efficiency skill at level 5 and that the blueprint has a Mineral Efficiency of 30.
30
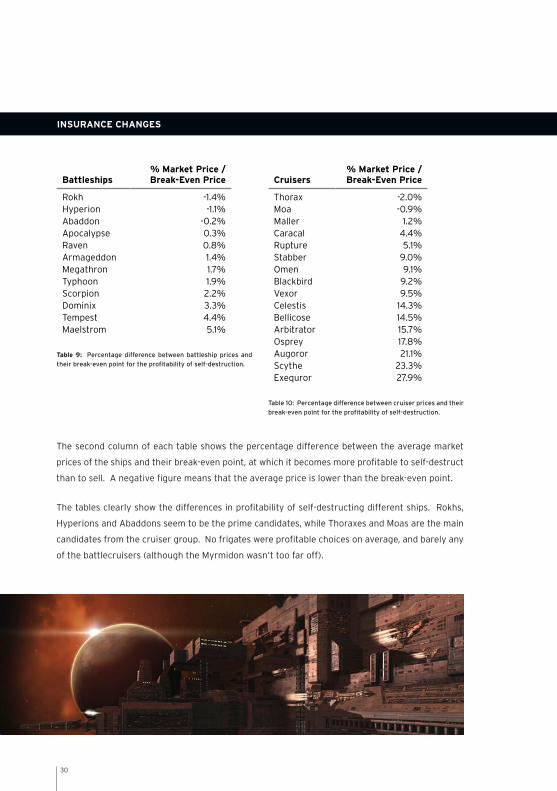
Battleships% Market Price / Break-Even Price
Rokh -1.4%Hyperion -1.1%Abaddon -0.2%Apocalypse 0.3%Raven 0.8%Armageddon 1.4%Megathron 1.7%Typhoon 1.9%Scorpion 2.2%Dominix 3.3%Tempest 4.4%Maelstrom 5.1%
Table 9: Percentage difference between battleship prices and
their break-even point for the profitability of self-destruction.
Cruisers% Market Price / Break-Even Price
Thorax -2.0%Moa -0.9%Maller 1.2%Caracal 4.4%Rupture 5.1%Stabber 9.0%Omen 9.1%Blackbird 9.2%Vexor 9.5%Celestis 14.3%Bellicose 14.5%Arbitrator 15.7%Osprey 17.8%Augoror 21.1%Scythe 23.3%Exequror 27.9%
Table 10: Percentage difference between cruiser prices and their
break-even point for the profitability of self-destruction.
INSURANCE CHANGES
The second column of each table shows the percentage difference between the average market
prices of the ships and their break-even point, at which it becomes more profitable to self-destruct
than to sell. A negative figure means that the average price is lower than the break-even point.
The tables clearly show the differences in profitability of self-destructing different ships. Rokhs,
Hyperions and Abaddons seem to be the prime candidates, while Thoraxes and Moas are the main
candidates from the cruiser group. No frigates were profitable choices on average, and barely any
of the battlecruisers (although the Myrmidon wasn‘t too far off).

31
THE MAGNITUDE
In most economies, self-destruction to claim the insurance payout would be illegal. In New Eden it
is not. It‘s simply pilots using their good common sense to make sound economic decisions. The
following graph shows the extent of self-destruction.
Figure 15: The number of self-destructed ships per day was stable at about 1,400 ships before and immediately after the asteroid
changes. In October, falling Tritanium prices had made self-destruction profitable, which increased the daily figure to 2,500 ships. The
number fell a little in the spring but spiked again before the implementation of the insurance changes. A bigger spike emerged after
the insurance changes, as players got rid of stockpiles in anticipation of further cuts to insurance payouts.
Prior to October 2009 over 1,400 ships were being self-destructed per day. This was in a period
when ship prices hadn‘t hit the price floor imposed by insurance. However, the prices were close
enough to the floor for some, because there are advantages to self-destructing for a slightly lower
price than you could get by selling the ship on the market. Self-destructing gets you the money
instantly, while it might take you weeks or more to sell the ship. Then there‘s the hassle of keeping
your sell order up to date and competitive. Getting the ship to a viable market hub may also take
time and always includes an element of risk.
In October, ship prices reached the aforementioned price floor and the number of self-destructed
ships began to rise until it peaked in January and February, with over 2,500 ships being self-
destructed per day.

32
Of course, these figures only show ships destroyed through the self-destruction mechanism. Not
included are ships that are intentionally destroyed by the owner through other means, such as get-
ting other players or CONCORD to do it.
There was no increase in self-destruction following the release of the March 30 dev blog which
announced the change. The average number of self-destructions at that point was actually a bit
lower than at the beginning of the year, or around 2,150 ships per day. May 8 saw the beginning of
a spike that raised the average to just under 2,600 ships per day, where players made use of the
last days of the old insurance payouts. The spike lasted until the insurance changes were released
on May 26.
After implementation, the figure dropped to just over 1,600 ships per day. However, on June 2,
self-destruction of ships spiked to new heights, with the average reaching over 3,000 ships per
day. This was probably caused when pilots, realizing that the removal of the old price floor could
lead to an even greater reduction in insurance payouts, rushed to cash in their stockpiled ships and
minerals. This spike lasted until June 18, when it fell abrubtly to an average of over 1,400 ships per
day, the same level that it was at before the asteroid changes in June 2009.
From the beginning of June 2009 to the end of June 2010, 777,455 ships were self-destructed. A
total of 159,124 characters self-destructed at least one ship in that period. Of those, 7,453 ships, or
nearly 1% of the total, were destroyed by the same character, and that character didn‘t even start
until mid-January 2010.
THE EFFECT ON MINERAL PRICES
As already mentioned, changes to asteroid reseeding and respawning in June 2009 increased sup-
ply of minerals. This change removed the Tritanium bottleneck in the supply of minerals, thereby
drastically reducing its price. When the price had fallen sufficiently to make self-destruction profit-
able, the price floor on the mineral basket started to push the prices of other minerals up, as these
minerals became new bottlenecks.
INSURANCE CHANGES

33
Figure 16: Mineral prices since the asteroid changes in 2009. Increased supply of Tritanium caused prices to start falling in June, until
they leveled off in October. This, coupled with increased supply of Megacyte and Zydrine through scannable asteroid fields, caused
Pyerite prices to rise massively, due to the increased demand for Pyerite in conjunction with increased supply of other minerals. Once
the higher prices of Pyerite caused more players to begin providing it, demand for Noxcium rose sharply.
Figure 16 shows how the price of Tritanium fell from June 2009 to October 2009. Insurance then
started pressing the price of Pyerite upwards as it became a new bottleneck. This effect was
augmented by the increased supply of Megacyte and Zydrine with the release of Dominion in De-
cember. Pyerite prices therefore rose massively, then started to fall again in April. This, in turn,
caused Nocxium to rise instead.
Under the new system of dynamic insurance payouts, mineral prices can now fall freely even
though they are still interdependent, due to the ratios in which they are needed for production.
The fall has already started, with all minerals except Nocxium falling in price from May to June. The
fall ranges from 3.9% for Tritanium to 16.1% for Zydrine.
How far down the prices will go is anyone‘s guess and there has been much speculation, including
doomsday prophecies about minerals becoming worthless. The one thing that‘s certain is that
minerals will reach a new equilibrium at some point, an equilibrium not based on out-of-date insur-
ance payouts but instead on the actual value of the products they make up.

34
Figure 17: The Nanite repair paste is a thick and heavy liquid used to repair damaged ship modules on the fly. The paste recently be-
came player-produced when Tyrannis was deployed. In this quarter alone, the volume traded increased by 44% while the price dropped
by 77% at the same time. This suggests a lot of speculative trading, since player production hadn’t really taken off in May, and there
is no apparent reason for this sudden increase in the usage of Nanite repair paste.
Figure 18: During expansions PLEXes have been very popular and the Tyrannis expansion showed no change in that trend. In Q2, PLEX
prices rose by 9% compared to Q1, and in June there was both a record amount of PLEXes traded for the whole month (71,475 units)
as well as a record in daily PLEX usage (2,010 PLEXes used, on June 25). The PLEX trade volume seems to have leveled out at around
70,000 units sold per month in the last 4 months.
MARKET SNAPSHOTS

35
Figure 19: With the launch of Tyrannis, players could start extracting material from more than 65,000 planets. Water is now produced
through processing Aqueous Liquid and since players have started interacting with planets the market for planetary materials has
been more lively. In Q2 the price of water has more than doubled and the volume traded increased by 62% over the amount in Q1.
Figure 20: Enriched Uranium is also a planetary material but it requires two tiers of processors to create this refined commodity,
compared to one tier for Water. On June 17th NPCs stopped trading PI materials, but prior to that players were speculating, and in May
alone the volume traded rose by 57% while prices remained fixed. The following month the speculators might have gained somewhat
as prices rose by 55%, which shows that the fixed NPC price of Enriched Uranium was somewhat undervalued. With every expansion
there are always a number of goods that players speculate with; though it’s not always the case, this time the players got it right.
36
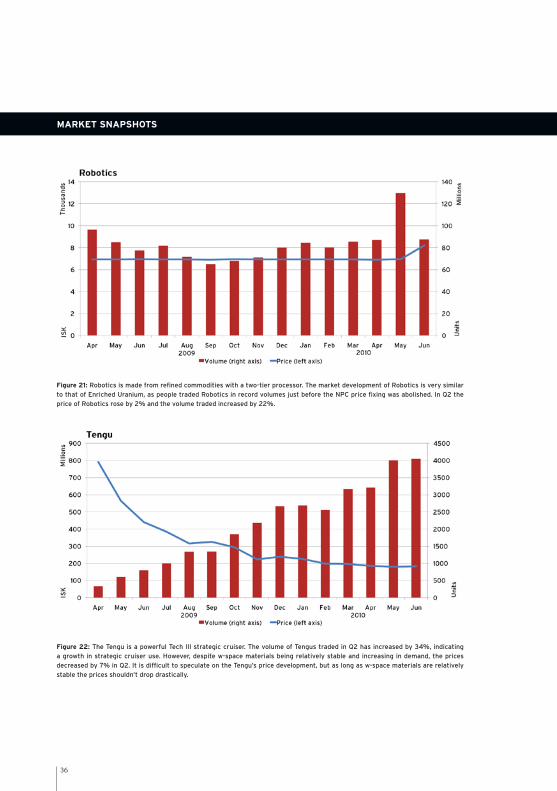
Figure 21: Robotics is made from refined commodities with a two-tier processor. The market development of Robotics is very similar
to that of Enriched Uranium, as people traded Robotics in record volumes just before the NPC price fixing was abolished. In Q2 the
price of Robotics rose by 2% and the volume traded increased by 22%.
Figure 22: The Tengu is a powerful Tech III strategic cruiser. The volume of Tengus traded in Q2 has increased by 34%, indicating
a growth in strategic cruiser use. However, despite w-space materials being relatively stable and increasing in demand, the prices
decreased by 7% in Q2. It is difficult to speculate on the Tengu’s price development, but as long as w-space materials are relatively
stable the prices shouldn’t drop drastically.
MARKET SNAPSHOTS

37
Figure 23: The Raven has been one of the most popular ships in EVE for a long time but the demand seems to have decreased, with the
Raven going from being the 6th most popular ship in Q1 2010 to the 9th most popular in Q2 2010. The price of Raven decreased in Q2
by 7.8%, thereof by 7.5% in June alone. This decrease is due to the price decrease of all minerals in June, as the price floor tumbled
when the insurance system was changed.
Figure 24: The Kronos is the Gallente Marauder. Like some other Tech II ships, the Kronos has been decreasing in price quite signifi-
cantly (50% since September 2009). The reason for this is that advanced moon materials have decreased by 50%, due to the Tech II
blueprint changes, at the same time leading to an almost identical decrease in Tech II construction components. In Q2 the price goes
down by 13.4%, while the volume traded increases by just 1%. The future price development of the Kronos is very much tied in with
the price of advanced moon materials and in the last quarter those prices dropped by 17%. Unless the advanced moon materials prices
start increasing, the price of the Kronos will continue to drop.

38
Figure 25: The Badger industrial is the main cargo hauler for the Caldari State and is perfectly equipped for transporting large cargo.
There has clearly been a positive growth in industrials being flown and at the same time the volume traded has increased by 25% in
the last 2 months. This development is attributed to increased transportation needs due to Planetary Interaction.
Figure 26: As many players have turned their attention to industrial ships, their need for expanded cargoholds has increased; trade in
this commodity has increased by 11% in the last 2 months. This is very much in line with industrials’ growth in the ‘ships being flown’
category, as industrial use has seen a 27% increase since last quarter. The price in Q2 decreased by 11.5% compared to Q1, which
relates to a drop in the price of production materials such as Morphite and Crystalline Carbonide Armor Plate.
MARKET SNAPSHOTS
39
PUBLICATION INFORMATION
Editor:
Dr. Eyjólfur Guðmundsson, CCP
Research team:
Brynjólfur Erlingsson
Freyr Tómasson
John Turbefield
Kjartan Þór Halldórsson
Graphic design and layout:
Helgi Vilberg Helgason
Þormóður Aðalbjörnsson
Brieve Lyon
Text editing:
Gauti Friðriksson

40
© 2010 CCP hf. All rights reserved. Reproduction without the written permission of the pub-
lisher is expressly forbidden. EVE, EVE Online, CCP logo are registered trademarks of CCP hf.


