united utilities draft water resources management plan 2019
TRANSCRIPT
United Utilities Draft Water Resources Management Plan 2019
United Utilities Final Water Resources Management Plan 2019
© United Utilities Water Limited 2019 Page 1 of 191
Contents Summary of our plan .............................................................................................................................. 3
1 Introduction ....................................................................................................................... 15
2 Customer and stakeholder involvement ........................................................................... 25
3 Our water supply system ................................................................................................... 39
4 Our baseline position ........................................................................................................ 50
5 Identifying future options ................................................................................................. 93
6 Strategic choices for our region ...................................................................................... 107
7 Preferred plan ................................................................................................................. 132
8 Water trading adaptive pathway .................................................................................... 146
9 Testing our plans ............................................................................................................. 163
10 Assurance and board engagement .................................................................................. 167
11 Conclusions ...................................................................................................................... 170
Appendix A – List of technical reports ................................................................................................ 173
Appendix B – References .................................................................................................................... 174
Appendix C – Glossary ......................................................................................................................... 176
Appendix D – Alternative plans consulted upon ................................................................................ 183
United Utilities Final Water Resources Management Plan 2019
© United Utilities Water Limited 2019 Page 2 of 191
United Utilities Final Water Resources Management Plan 2019
© United Utilities Water Limited 2019 Page 3 of 191
Summary of our plan We are committed to delivering reliable, safe, clean and resilient water supplies to over seven
million customers, around three million households and around 200,000 businesses (non-household
customers) in the North West of England, at a fair price. This document is our final Water Resources
Management Plan 2019 (FWRMP19), which has been developed following consultation on our draft
Water Resources Management Plan, held in spring 2018. This plan defines our strategy to achieve a
long-term, best value and sustainable plan for water supplies in the North West. It ensures that we
have an adequate supply to meet demand over the 25 years from 2020 to 2045. We have put
processes in place to ensure Board assurance of this plan, including a statement to the Drinking
Water Inspectorate that drinking water quality is fully protected under this plan. Below are the key
points contained within our final Water Resources Management Plan that take into account the
results of the consultation.
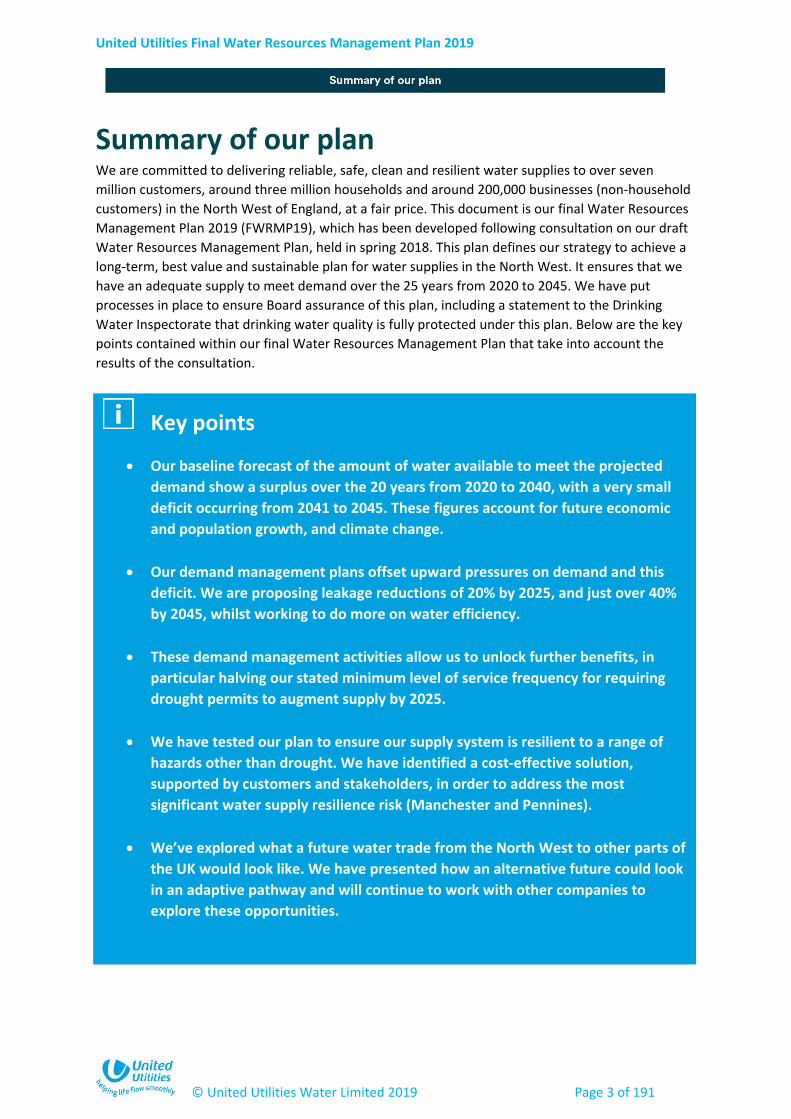
Key points
Our baseline forecast of the amount of water available to meet the projected
demand show a surplus over the 20 years from 2020 to 2040, with a very small
deficit occurring from 2041 to 2045. These figures account for future economic
and population growth, and climate change.
Our demand management plans offset upward pressures on demand and this
deficit. We are proposing leakage reductions of 20% by 2025, and just over 40%
by 2045, whilst working to do more on water efficiency.
These demand management activities allow us to unlock further benefits, in
particular halving our stated minimum level of service frequency for requiring
drought permits to augment supply by 2025.
We have tested our plan to ensure our supply system is resilient to a range of
hazards other than drought. We have identified a cost-effective solution,
supported by customers and stakeholders, in order to address the most
significant water supply resilience risk (Manchester and Pennines).
We’ve explored what a future water trade from the North West to other parts of
the UK would look like. We have presented how an alternative future could look
in an adaptive pathway and will continue to work with other companies to
explore these opportunities.

United Utilities Final Water Resources Management Plan 2019
© United Utilities Water Limited 2019 Page 4 of 191
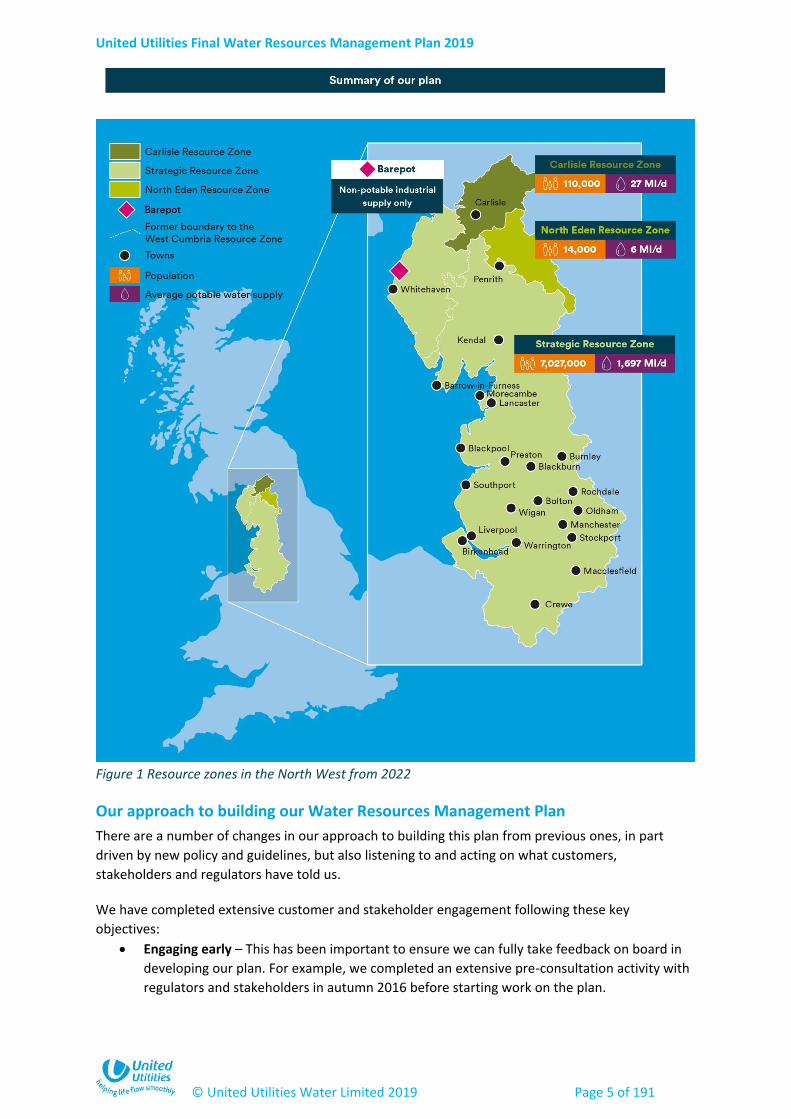
Legacy of the 2015 Water Resources Management Plan
We produce a new Water Resources Management Plan (WRMP) every five years. In our last plan,
published in 2015 and covering the period 2015-2040, we identified a future supply shortfall in our
West Cumbria Resource Zone1. The Thirlmere Transfer scheme was selected to meet this shortfall by
using some of the water available in our neighbouring Integrated Resource Zone. We are in the
process of building a new water treatment works and a pipeline from Thirlmere Reservoir into West
Cumbria. The scheme is currently expected to be completed by 2022. Once finished, West Cumbria
will be in one of the UK’s largest water resource zones. To protect the environment prior to delivery
of this solution, a range of interim measures were also identified in the plan to keep abstraction and
impacts on the environment to a minimum. Further detail on West Cumbria can be found in our
Final WRMP19 Technical Report - West Cumbria legacy.
We are continuing to deliver the outcomes of the previous plan and in developing this Water
Resources Management Plan 2019 we reflect how our supply system will look once these are
complete. Therefore, as a long-term 25-year strategic view, this plan now reflects the merging of the
previous West Cumbria and Integrated Resource Zones. We are now calling this the Strategic
Resource Zone to draw distinction with the previous zones. For the first time, we've also included a
new, smaller resource zone called Barepot to reflect non-potable supplies (those not to drinking
water standard) to commercial customers in West Cumbria. Whilst we have other non-potable or
commercial supplies, those at Barepot lack connectivity into an existing resource zone. The water
resource zones assessed in this final Water Resources Management Plan 2019 are shown in Figure 1.
1 A water resource zone is an area within which water sources can be shared effectively. Customers within a resource zone
should experience broadly the same risk of supply failure from a resource shortfall and therefore the same level of service.
United Utilities Final Water Resources Management Plan 2019
© United Utilities Water Limited 2019 Page 5 of 191
Figure 1 Resource zones in the North West from 2022
Our approach to building our Water Resources Management Plan
There are a number of changes in our approach to building this plan from previous ones, in part
driven by new policy and guidelines, but also listening to and acting on what customers,
stakeholders and regulators have told us.
We have completed extensive customer and stakeholder engagement following these key
objectives:
Engaging early – This has been important to ensure we can fully take feedback on board in
developing our plan. For example, we completed an extensive pre-consultation activity with
regulators and stakeholders in autumn 2016 before starting work on the plan.
United Utilities Final Water Resources Management Plan 2019
© United Utilities Water Limited 2019 Page 6 of 191
Engaging widely – We have sought collaboration and feedback on our plan as it evolves,
through the consultation on the draft plan through to the final plan. This engagement has
been as wide ranging as practically possible using different routes to discuss development of
our plans. We have engaged the commercial markets to identify new and innovative
potential third party solutions, as detailed in Section 5 of our plan.
Using different or innovative approaches –
o In engaging with customers in particular, we have sought to understand preferences
and views based on a variety of research methods to support our decisions.
o We have used a range of interactive techniques, including a ‘build your own plan’
tool to improve awareness on the choices that people are making.
Our plan is designed to meet the aspirations and requirements set out by Defra as defined in its
Guiding principles for water resources planning. These guiding principles outline the key policy
priorities the government expects Water Resources Management Plans to address, which we discuss
in turn below:
Government policy
We take into account local authority plans for growth to meet government economic and
housing development ambitions.
We ensure that our plan continues to meet drinking water quality standards now and in the
long-term, whilst ensuring that there is no deterioration in the quality of the water which is
supplied. This is in line with the latest Drinking Water Inspectorate guidance2 to water
companies.
We have followed the latest regulatory guidelines and Defra Direction3 in developing the
plan.
Our plan also now accounts for the Government’s 25 Year Environment Plan4, and our future
infrastructure planning processes will embed ‘environmental net gain’ principles.
Take a long term, strategic approach to protecting and enhancing resilient water supplies
We have used new methods from recent industry research to test the plan under a wide
range of possible future scenarios. We are one of a number of leading water companies
implementing these techniques in this planning round.
We have developed sophisticated new techniques to test the response of our water supply
system to more severe and different patterns of drought than we have seen historically, and
used the latest industry climate change approaches.
Our approach helps us to see how plans might perform beyond the 25-year planning horizon
out into the 2080s to ensure they are robust.
Our approach has been designed to test the ‘value’ of different solutions beyond meeting
the supply-demand balance, but also to include performance related to resilience and the
2 Drinking Water Inspectorate long term planning for the quality of drinking water supplies, September 2017:
http://www.dwi.gov.uk/stakeholders/guidance-and-codes-of-practice/ltpg.pdf 3 The Water Resources Management Plan (England) Direction 2017. 4 'A Green Future: Our 25 Year Plan to Improve the Environment': https://www.gov.uk/government/publications/25-year-
environment-plan
United Utilities Final Water Resources Management Plan 2019
© United Utilities Water Limited 2019 Page 7 of 191
environment. This allows us to define the long-term ‘best-value’ (or cost effective) plan
rather than just a traditional ‘least-cost’.
For the first time, our plan looks at how resilient we are to a host of non-drought hazards to
water supply, including flooding, freeze-thaw5, contamination, asset failure and power
failure. We also ensure no deterioration in resilience or water quality in our assessment of
future water trading.
Consider every option to meet future public water supply needs
We have collaborated closely with customers, regulators, stakeholders and other third
parties to co-create a plan, considering multiple options to meet future public water supply
needs. This has included engagement with commercial markets to investigate different and
innovative third party solutions, as detailed in Section 5.
In collaboration6 with other water companies, we considered water trading as a pathway7 in
our draft plan and we worked with all neighbouring water companies to understand cross-
boundary or joint options. Our final plan does not include water trading as part of the
preferred plan. This is because other companies did not include a trade as part of their
preferred plans. However, we present how such an alternative future could look in an
adaptive pathway and we recommend that such opportunities continue to be explored.
Recently, a Water Resources North group has been inaugurated to further promote
collaborative working on water resources between organisations in the North of England in
future. We have also proposed the establishment of a Water Resources West group to
facilitate a co-ordinated approach across the River Severn catchments to water trading that
may contribute to enhancing national water resource resilience.
Competitive markets and innovation underpin this plan, from contractor and supplier
selection through to delivery of Water Resources Management Plan options. Our preferred
plan includes a contribution from third-party options to help us reduce the demand for
water.
Protect and enhance our environment, acting collaboratively
Our plan seeks to ensure that we avoid deterioration of the condition of catchments and
waterbodies under the terms of the Water Framework Directive in particular. Assessment of
the impacts and benefits of the plan to the environment is fundamental to its development;
we strive to enhance the environment through the delivery of our plan. Where risks are
identified as part of our long-term plans, we will complete further investigation in the future
to explore these and mitigate any impacts.
We have worked with the environmental regulators to identify and account for sustainability
changes via the Water Industry National Environment Programme (WINEP), which sets out
measures needed to protect and improve the environment. We’ve identified the need for
further investigations from 2020 onwards, and will continue to work with regulators and
stakeholders (such as Rivers Trusts) to protect against deterioration and, where possible,
reverse it.
5 Freeze-thaw events relate to peak demands caused by rapidly increasing leakage levels. These normally occur during the
winter months, when changes in temperature can cause the ground to freeze and then thaw relatively quickly. This can
result in pipes or mains cracking or bursting. 6 This is sometimes referred to as co-creation. 7 Essentially, this is a plan within a plan, to show what our strategy for water resources in the North West might look like
with or without a future water trading export from the region.
United Utilities Final Water Resources Management Plan 2019
© United Utilities Water Limited 2019 Page 8 of 191
Promote efficient water use and reduce leakage
We have considered options that seek to reduce demand and have fully assessed them as
part of our options identification and appraisal. We’ve explored innovative solutions as part
of developing our plan.
We have explored the costs and benefits of different demand management solutions, and
engaged with customers and stakeholders on future potential plans. This has informed our
future strategy.
We have explored how we can engage with customers differently to communicate water
efficiency messages and are currently trialling new approaches to encourage customers to
install water meters.
Demand and consumption are forecast to reduce through the 25-year planning horizon, as in
our previous plan. Our proposed leakage reduction activities will further support this by
delivering 20% leakage reduction by 2025 and just over 40% reduction by 2045 and we will
seek to outperform targets where possible.
There is inherent uncertainty in future forecasts around future economic and population
growth, including the impact of the UK’s decision to leave the European Union. We have
therefore accounted for plausible uncertainty in our target headroom8 allocation and
demand scenarios, and will track trends as part of the Annual Water Resources Management
Plan review process.
Starting position – what our forecasts said
In preparing this Water Resources Management Plan, we have assessed our supply-demand balance
using the latest data, tools and methods. This includes the latest population and local authority
growth forecasts, and accounts for the potential impacts of climate change. The outcomes of the
assessment show that we have only a small deficit in the Strategic Resource Zone in the last five
years of the planning horizon (2041-2045). This is a really positive result as it provides an
opportunity for us to explore how we can improve and provide a better service for both customers
and the environment in our plan whilst at the same time addressing this projected shortfall by
reducing the demand for water.
8 Target headroom is the threshold of minimum acceptable headroom, which would trigger the need for total water
management options to increase water available for use or decrease demand.
From our 2015 plan, we forecast a surplus in all resource zones except West
Cumbria, where we identified a future supply shortfall
We are in the process of addressing this shortfall, with a new water treatment
works and a pipeline from Thirlmere Reservoir into West Cumbria. This will
create a new Strategic Resource Zone, which has been assessed in this plan
In this 2019 plan, we forecast a surplus over the 20 years from 2020 to 2040,
with a very small deficit from 2041 to 2045. As well as addressing this deficit,
our plan focuses on several other key proposals for the future such as demand
reductions, levels of service, water supply resilience and the potential for
water trading.

United Utilities Final Water Resources Management Plan 2019
© United Utilities Water Limited 2019 Page 9 of 191
Through our analysis we looked at the risk of drought impacts on our water supply system, and how
often we would have to implement emergency drought orders. Our current performance in this area
is better than the Defra reference level of service (which is no more than 1 in 200 years on average,
or 0.5% annual average risk). However, we recognise the consequences of drought are still of
concern to customers and other stakeholders and so have accounted for this in our plans (see
below).
Our testing of freeze-thaw (peak demand) resilience demonstrated that our system is resilient to
repeats of historic freeze-thaw events and can cope with peak demands higher than those
previously experienced.
Through our water supply resilience risk assessment process we have also identified other resilience
needs across our Strategic, Carlisle and North Eden Resource Zones. These risks can broadly be
grouped into three categories of resilience risk: at our water treatment works, regional aqueduct
system, and trunk mains. The dominant hazards are contamination of raw water and asset failure.
We recognise the significance of these risks and have started to make improvements in this area,
with around £200 million being spent on targeted resilience improvements by 2020.
What are our proposed plans for the period 2020-2045?
Drought resilience
What are we proposing? – As we are already resilient to extreme droughts, there is no stand out reason to specifically invest to improve this position further. However, we’ll seek to improve resilience where possible as part of our other activities. In particular, our enhanced leakage reduction programme will result in improvements to drought resilience as a supplementary benefit of those plans. The water trading adaptive pathway shows how we’d protect drought resilience should those proposals be progressed in future.
Why are we proposing this? – Our assessments show a good level of resilience to severe and extreme droughts relative to other hazards, and there is little evidence that customers would support further investment in this area to make the system more resilient. However, customers frequently state having reliable water supplies as a priority and do not want to see deterioration in service levels under potential future water trading or other proposals.
In this 2019 plan, we have tested our system to droughts that are more severe or
extreme than historically experienced. This work demonstrates that we already have
a resilient system that is able to withstand at least a 1 in 200 year event (that has
0.5% annual average risk). This shows we have a good level of resilience to drought in
our region which correlates with Defra’s reference level of service for emergency
drought orders (standpipes, rota-cuts and bowsers).

United Utilities Final Water Resources Management Plan 2019
© United Utilities Water Limited 2019 Page 10 of 191
Enhanced demand management and leakage
What are we proposing? – Whilst our leakage is already below the sustainable economic
level and we proposed a 7% reduction below baseline by 2025 in our draft plan, we’ve
further enhanced the ambition of our leakage reductions in this final plan following
consultation. We are now proposing leakage reductions of 20% by 2025, bringing forward
some of our planned leakage reduction activities to exceed the challenge set by Ofwat to
water companies of a 15% reduction by 2025. We have also set out a longer term path to
reduce leakage by just over 40% by 2045. We anticipate that technology and innovation will
change the economics of leakage management over time and make such reductions more
affordable than they are currently. By making reductions in stages we can review
improvements in efficiency through future water resource management plans and revisit
longer term forecasts (which are more uncertain than shorter term forecasts), thereby
helping to manage affordability and ensure cost-effectiveness. Figure 2 summarises the
proposed leakage reduction profile from 2020-2045. The associated bill impact in the 2020-
2025 investment period (AMP7) is expected to be no greater than 196 pence increase per
annum for every household.
Figure 2 Forecast total leakage reductions from 2020-2045 (please note that numbers may not sum
precisely, due to rounding)
Why are we proposing this? – There are a number of drivers for reducing leakage even
further. Customers are willing to pay more for demand reduction compared to new water
resource options, and reducing leakage by 20% in AMP7 is cost-beneficial when customer
valuation is considered. There are environmental benefits associated with reducing leakage,
In our 2015 plan, regional leakage was not forecast to reduce over the 25-year
planning period, resulting in a flat target level of 463 Ml/d. We have outperformed
this existing target to a varying extent each year, depending on factors such as the
weather. Therefore, we have a lower baseline position of 448 Ml/d for this plan,
based on 3-year average performance. We plan to further reduce leakage from this
baseline position by 20% by 2025, and just over 40% from this level by 2045.
United Utilities Final Water Resources Management Plan 2019
© United Utilities Water Limited 2019 Page 11 of 191
as well as social benefits such as improvements in the perception of the industry to the
general public (which could, for example, become a barrier to further water efficiency
improvements). Reducing leakage is a strategic government priority and there is a political
driver to support reducing leakage. Customers strongly support reductions in leakage and
stakeholder feedback from consultation on our draft plan was almost unanimous in wanting
us to be more stretching in relation to our leakage targets. Leakage reductions below the
baseline level also prevent a very small deficit in the baseline supply-demand balance
forecast between 2041 and 2045 in the Strategic Resource Zone in the final plan, and further
enhancements may in some cases prevent the potential need to develop new supply options
under other future scenarios. Despite all this, affordability is a key consideration for
customers, so investment in this area still needs to be balanced with other water and
wastewater service areas over time.
Levels of service – frequency of drought permits or orders9
What are we proposing? – To retain the level of service for the frequency of temporary use bans (also known as hosepipe bans) at no more than once every 20 years on average (5% annual average risk). However, we propose moving the frequency of drought permits/orders to a better level: no more than once every 40 years (2.5% annual average risk) on average as part of this plan.
Why are we proposing this? – Whilst our drought resilience is high, we recognise that the consequences of drought are still of concern to stakeholders. This is because drought permits and orders have the potential to have socio-economic (e.g. tourism) or environmental impacts, which was a key theme raised during pre-consultation. Whilst customers did typically see existing levels to be acceptable, they placed some value on service improvements in this area. This can be achieved following the proposed leakage reduction activities by 2025.
9 These are temporary permits to allow us to take more water from the environment during drought than would normally
be allowed under our licence conditions.
Our 2015 plan retained the existing levels of service, but committed to explore the
potential for improvement in the next plan. In our 2019 plan, we propose improving
the minimum stated level of service for drought permits and orders (to augment
supplies during drought). This will reduce the stated level of service from 1 in 20
years to 1 in 40 years on average (or from 5% to 2.5% annual average risk) by 2025.
United Utilities Final Water Resources Management Plan 2019
© United Utilities Water Limited 2019 Page 12 of 191
National water trading
What are we proposing? – We have explored the potential to make the best use of markets for water resources. We’ve done this specifically with a proposed water export from Lake Vyrnwy to the South East of England. Following consultation, it remains our preference to continue working towards making water available for export. However, potential importing companies have not selected imports from the North West in their preferred plans in the first 25 years of the planning horizon (which defines our ‘needs’ in this plan, even though we have completed scenario testing out to the 2080s). Therefore, to align our plan with others, the export is not part of our formal preferred plan. However, we remain committed to working with potential future trading partners so that an export can be made available when it is needed. Our strategy to facilitate a future trade has been retained separately within an ‘adaptive pathway’, which could form a future preferred plan if water trading was subsequently required in future. The pathway sets out how customers and the environment are protected under a future export.
Why are we proposing this? – The North West has been identified as a potential water donor region in a recent national study lead by Water UK to meet sizeable, long-term water resources pressures elsewhere in the country. The National Infrastructure Commission also highlights the role that strategic transfers should play in securing resilient supplies10. We believe that pursuing a water trade of this nature is in the best interests of customers in the North West and across the country as a whole, and we are expected to explore this by regulators and government. Customers have indicated broad support for water trading, although like stakeholders they wish to see existing levels of service protected and expect that there will be benefits for the North West.
Water supply resilience to hazards other than drought
10 Preparing for a drier future: England’s water infrastructure needs, National Infrastructure Commission, April 2018.
In the last planning round, the potential to export water from our region from Lake
Vyrnwy was identified as an option in other water company plans. For this 2019 plan,
we have continued to explore the potential for this specific trade or export in more
detail. Whilst water trading has not been selected in other water companies’
preferred plans during the 25-year planning horizon, we recognise that it would have
benefits for customers in both importing and exporting areas. We will therefore
continue working collaboratively with other companies and the regulators towards
the next Water Resources Management Plan in 2024 to examine these options in
more detail. We present our strategy to facilitate a potential future trade as a
pathway in this plan. This shows how we would ensure there is no deterioration to
the service we provide to our own customers, or the environment.
Our assessment of water supply resilience to hazards other than drought is new for
this 2019 plan. From our resilience assessments, we identify a key risk to supplies in
the Manchester and Pennines area. Our plan is to address this risk by replacing
degrading aqueduct tunnels with new tunnels.

United Utilities Final Water Resources Management Plan 2019
© United Utilities Water Limited 2019 Page 13 of 191
What are we proposing? – Through our risk assessment process we have identified our largest resilience risks for priority investment. During the 2015-2020 period we are already investing around £200 million in targeted resilience improvements. Based on the impacts that customers experience during supply failures exceeding 12 hours duration, we have an ambition to ensure these events occur less frequently than at present. This is expected to take up to 20 years of future investment. Future investment will be targeted on addressing risks associated with our regional aqueduct system and some of our most vulnerable treatment works and major supply mains.
To achieve our target level of resilience we are likely to need additional redundancy (spare capability and connectivity) for the largest risks, however this is a long term aspiration. In the more immediate future we will manage these risks to customer supplies through improved reliability and enhanced response and recovery capabilities. This will be coupled with targeted investment on the very largest risks to one of our aqueducts supplying water to Manchester and areas of the Pennines. We will undertake works to replace tunnel sections of this aqueduct, built in the 1940s and 50s, with new tunnels. Construction works are expected to start on the highest risk tunnel section in 2018, with completion of all tunnel sections expected by 2028.
Why are we proposing this? – We have evidence from inspections of our major aqueduct which supplies Manchester and the Pennines that indicates that degradation of the tunnel sections is increasing risk to water supplies. This conclusion is supported by independent third-party assurance of our risk assessment. Customer and stakeholder engagement has indicated strong support for investment to reduce this risk, and the resulting solution presented in this final plan.
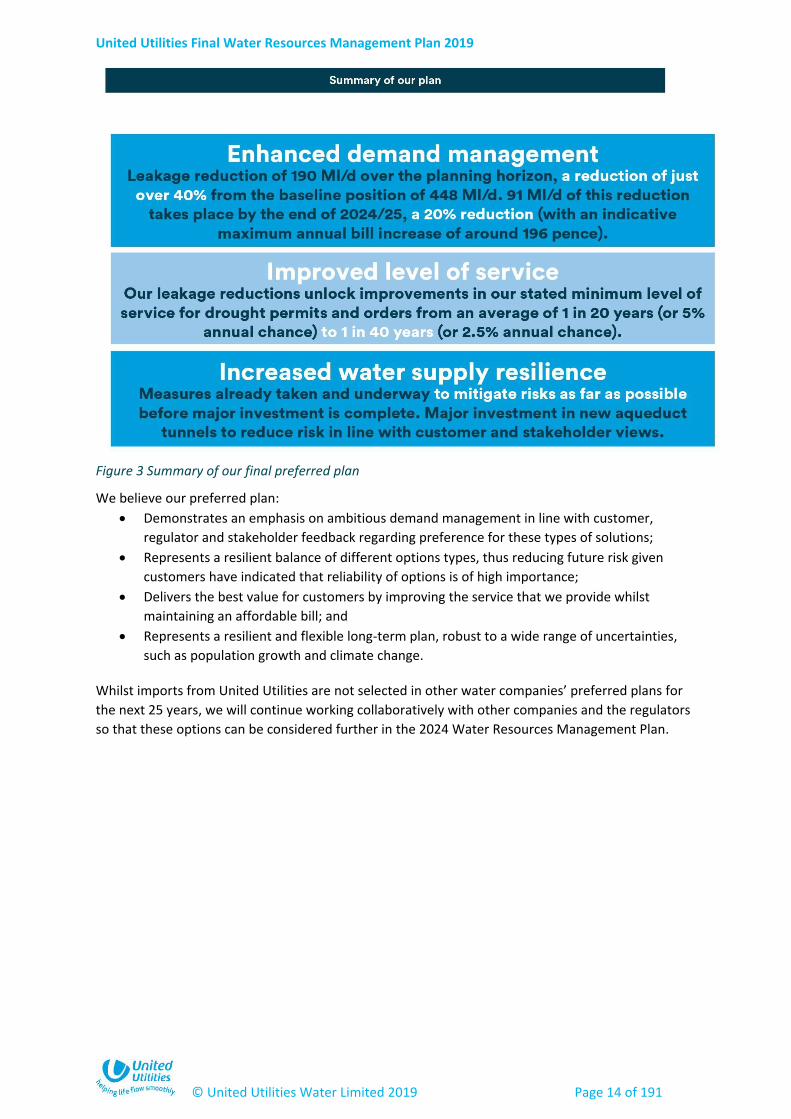
Summary of our preferred plan
Our baseline supply-demand balance assessments show that we maintain a surplus in all four of our
resource zones, other than a very small deficit in the Strategic Resource Zone towards the end of the
planning horizon (2041-2045). This will be addressed by reducing the demand for water and our
proposed programme of leakage reduction activity.
Our plan continues to promote water efficiency and reduce per capita consumption. As part of our
plan we will continue to encourage customers to take up free water meters, using our ongoing
customer engagement and research insights to allow effective communication and remove
disincentives to meter uptake. Our forecasts show meter penetration reaching around 75% by the
end of the planning horizon. We will continue to target annual savings of 1 litre per property per day
through the planning horizon as part of our water efficiency programme.
We have also considered the opportunity to make some ‘strategic choices’ to protect and, where
possible, benefit customers and the environment. In combination our strategic choices form our
preferred plan, which is summarised in Figure 3.
United Utilities Final Water Resources Management Plan 2019
© United Utilities Water Limited 2019 Page 14 of 191
Figure 3 Summary of our final preferred plan
We believe our preferred plan:
Demonstrates an emphasis on ambitious demand management in line with customer,
regulator and stakeholder feedback regarding preference for these types of solutions;
Represents a resilient balance of different options types, thus reducing future risk given
customers have indicated that reliability of options is of high importance;
Delivers the best value for customers by improving the service that we provide whilst
maintaining an affordable bill; and
Represents a resilient and flexible long-term plan, robust to a wide range of uncertainties,
such as population growth and climate change.
Whilst imports from United Utilities are not selected in other water companies’ preferred plans for
the next 25 years, we will continue working collaboratively with other companies and the regulators
so that these options can be considered further in the 2024 Water Resources Management Plan.

United Utilities Final Water Resources Management Plan 2019
© United Utilities Water Limited 2019 Page 15 of 191
1 Introduction
1.1 Background
United Utilities Water Ltd is the main licensed water company for North West England. We provide
water and wastewater services to over seven million customers, around three million households
and around 200,000 businesses (non-household customers) across the region. We are committed to
sustainably providing high quality, safe, clean and reliable drinking water to customers.
Given the criticality of ensuring sufficient water supply to meet demand to society, development of a
Water Resources Management Plan is a statutory requirement. This final Water Resources
Management Plan sets out our proposed strategy for water resources and demand management to
ensure that there are adequate water supplies for customers and that the environment is protected.
It describes our assessment of the future supply and demand over the period from 2020 to 2045
(with testing of our plans beyond this period). We also detail the preferred plan we have selected,
taking account of water supply resilience and enhanced demand management, and separately,
explore how a future water trade could work should this be required in future.
We consulted on our draft plan in spring 2018, giving customers, regulators and stakeholders the
opportunity to comment on how we have built our plan and further contribute to its development.
We have taken this feedback into account in the development of this final plan. This Water
Resources Management Plan will feed into our five yearly Ofwat ‘Price Review’ and PR19 Company
Business Plan for the period 2020-2025; as such they have been developed in an integrated manner.
The Water Resources Management Plan is also complemented by our Final Drought Plan 201811,
11 unitedutilities.com/corporate/about-us/our-future-plans/water-resources/drought-plan/
Key points
This is our final Water Resources Management Plan 2019. It has been
produced according to the latest methods, regulatory guidelines, and Defra
guiding principles.
The development of the plan has been influenced by some significant national
themes, such as water trading and water supply resilience.
To drive the most cost-effective solutions we’ve embraced innovation,
whether this be in the way we have identified options, or in our planning
methods to define the best plan.
This document contains a summary of the technical work to develop the plan.
Further detail is available in technical appendices published on our website
alongside this document.
Following public consultation we’ve made various changes to our plans for
this version, which are summarised in this section.
United Utilities Final Water Resources Management Plan 2019
© United Utilities Water Limited 2019 Page 16 of 191
which sets out the short-term operational steps we will take as a drought progresses, and we have
ensured that the links between these plans are accounted for.
1.2 Improvements from our Water Resources Management Plan 2015
In preparing this Water Resources Management Plan there are some key changes from our 2015
plan:
We have updated our planning process to meet the latest methods, guidelines, and Defra
guiding principles. We’ve used sophisticated new techniques to allow us to explore a much
wider range of scenarios and uncertainties than in previous plans (summarised in Sections
1.3.4 and 7.2);
We have used earlier, more extensive, and more innovative customer engagement (see
detail in Section 2), alongside increased stakeholder and regulatory engagement. The
customer research is integral to this plan and the PR19 company business plan;
As well as a single supply demand balance view, this plan includes strategic choices and a
focus on risk, choices and potential future plans (Section 6);
We have put processes in place to ensure Board assurance of the Water Resources
Management Plan, including a statement to the Drinking Water Inspectorate that drinking
water quality is fully protected under our plans (Section 10);
We consider water supply resilience to look at ‘shocks’ to the supply system (Section 4.7).
This includes the impacts of other hazards (for example flooding, contamination or a freeze-
thaw event);
This plan has an increased focus on identifying third party, supply and demand options
(Section 5); and
In collaboration with other water companies, we have considered the potential for making
water available for export. Although potential importing companies have not selected
imports from the North West in their preferred plans, and therefore the export does not
form part of our formal preferred plan, our strategy to facilitate a future trade has been
retained within an adaptive pathway (Sections 6.5 and 8). We remain committed to working
with potential future trading partners so that an export can be made available when it is
needed.
1.3 Our approach to water resources planning
1.3.1 Listening to customers, stakeholders and regulators
In this document we investigate what makes the best plan for customers and how we can best serve
the needs of the North West. To do this we really need to understand the views of customers,
regulators, and other stakeholders. We talk about this in further detail in Section 2. In particular we
have sought to engage early, engage widely, and use different or innovative approaches (described
further later in this section) to engagement where beneficial to do so.
In autumn 2016, we completed an extensive pre-consultation exercise on the development of this
plan with regulators and stakeholders, which has informed its development. We have also sought to
discuss the Water Resources Management Plan in other forums, for example, through our
engagement activities on the Drought Plan or as part of engaging with local authorities as part of our
normal liaison activities. We established a Technical Stakeholder Group for the first time for this
United Utilities Final Water Resources Management Plan 2019
© United Utilities Water Limited 2019 Page 17 of 191
2019 Water Resources Management Plan, which has been informative to developing the plan. We
thank the volunteers on this group for their contributions.
We have discussed progression of the plan with regulators throughout the development of the plan,
as well as during pre-consultation. We have held bi-monthly meetings with the Environment Agency,
supported by ‘special interest sessions’ on key topics, and also regularly engaged with Natural
Resources Wales, Natural England and Ofwat. We have also discussed our approach with the
Drinking Water Inspectorate.
Consultation on our draft plan ran for 12 weeks, from 2 March 2018 to 25 May 2018. During the
consultation period, we held three successful consultation events in order to discuss the plan
directly with interested parties. The events attracted 26 delegates from 20 different organisations
including the Environment Agency (EA), local authorities and councils, recreational groups,
conservation and wildlife trusts, local businesses and public service organisations. We received 25
formal consultation responses on our draft plan, as well as an array of informal feedback from the
consultation events and other customer and stakeholder interactions. We thank all respondents for
their feedback, and have taken these into account in the development of this final plan (see Section
2.6).
1.3.2 Key influences and themes for this plan
In developing this Water Resources Management Plan we account for government priorities, as
outlined in particular within the Defra Guiding principles for water resources planning (referred to as
the ‘guiding principles’). We are meeting the government priorities by:
Ensuring we are compliant with relevant legislation and have suitably assured the plan;
Ensuring that future growth and economic development can be accommodated;
Taking a long term, strategic approach to protecting and enhancing resilient water supplies;
Considering every option to meet future public water supply needs;
Acting collaboratively to protect and enhance our environment;
Promoting efficient water use and leakage reduction; and
Ensuring our plans continue to meet drinking-water quality standards and that customers
continue to receive a wholesome, safe supply of water.
The government is currently working on proposals to reform the abstraction licensing system,
known as abstraction reform. We don’t expect abstraction reform to be implemented until after
2020 and as indicated in the guidance we have made no allowance for changes in this plan.
As some of our sources are located in Wales we are carefully considering the priorities of the Welsh
Government, in particular focusing on the well-being goals of the Well-being of Future Generations
(Wales) Act 2015 and the objective for the sustainable management of natural resources (SMNR)
established in the Environment (Wales) Act 2016. The Strategic Environmental Assessment of our
preferred plan has indicated that it is unlikely to have any significant impact on the achievement of
the well-being goals or the objective for SMNR. This is because the construction and operation of the
associated preferred options would not have any significant environmental effects in Wales, a
reflection of their location and lack of hydrological connectivity with Welsh water bodies. We will
continue to explore the impact on these goals and objectives as any potential future water trades
become more defined, supported by stakeholder engagement and research.
United Utilities Final Water Resources Management Plan 2019
© United Utilities Water Limited 2019 Page 18 of 191
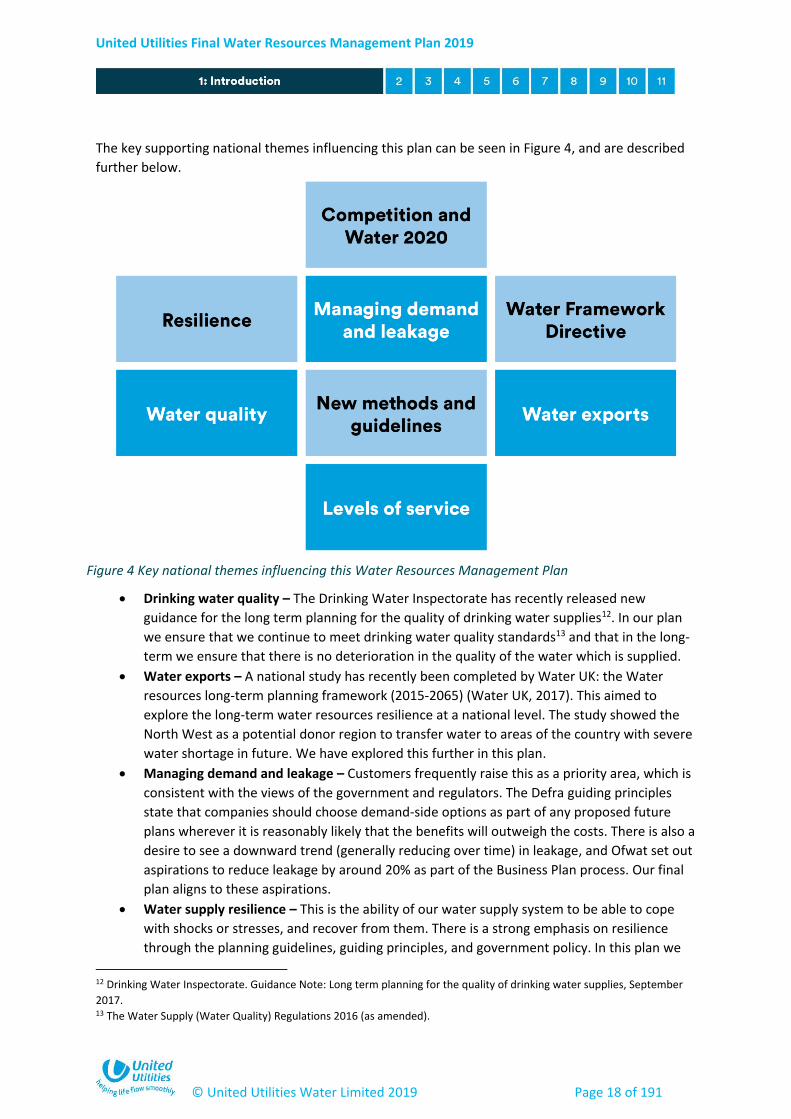
The key supporting national themes influencing this plan can be seen in Figure 4, and are described
further below.
Drinking water quality – The Drinking Water Inspectorate has recently released new
guidance for the long term planning for the quality of drinking water supplies12. In our plan
we ensure that we continue to meet drinking water quality standards13 and that in the long-
term we ensure that there is no deterioration in the quality of the water which is supplied.
Water exports – A national study has recently been completed by Water UK: the Water
resources long-term planning framework (2015-2065) (Water UK, 2017). This aimed to
explore the long-term water resources resilience at a national level. The study showed the
North West as a potential donor region to transfer water to areas of the country with severe
water shortage in future. We have explored this further in this plan.
Managing demand and leakage – Customers frequently raise this as a priority area, which is
consistent with the views of the government and regulators. The Defra guiding principles
state that companies should choose demand-side options as part of any proposed future
plans wherever it is reasonably likely that the benefits will outweigh the costs. There is also a
desire to see a downward trend (generally reducing over time) in leakage, and Ofwat set out
aspirations to reduce leakage by around 20% as part of the Business Plan process. Our final
plan aligns to these aspirations.
Water supply resilience – This is the ability of our water supply system to be able to cope
with shocks or stresses, and recover from them. There is a strong emphasis on resilience
through the planning guidelines, guiding principles, and government policy. In this plan we
12 Drinking Water Inspectorate. Guidance Note: Long term planning for the quality of drinking water supplies, September
2017. 13 The Water Supply (Water Quality) Regulations 2016 (as amended).
Figure 4 Key national themes influencing this Water Resources Management Plan
United Utilities Final Water Resources Management Plan 2019
© United Utilities Water Limited 2019 Page 19 of 191
use new methods and further incorporate appropriate parts of our wider business planning
to assess our resilience effectively.
Water Framework Directive – The Environment Agency has carried out a review of
waterbodies currently seen as ‘at risk of deterioration in future’, and issued new guidance
on how this should be assessed in Water Resources Management Plans. We have ensured
that our plans do not result in the deterioration of these waterbodies and that we support
Water Framework Directive objectives.
New methods and guidelines – There are new regulatory planning guidelines14 and guiding
principles that we have taken into account in building this plan. There are also enhanced
industry methods15 that we have adopted to identify the best-value long-term plan.
Levels of service – In our last plan we committed to explore further the potential to reduce
the frequency of drought permits (powers to take more water from the environment during
drought). Alongside this we have explored different levels of service to understand the
resilience of our supply system, and this detail is included in our plan.
Competition and Ofwat ‘Water 2020’ – The Water 2020 framework has been introduced by
Ofwat to promote efficiency so that industry challenges can be met at an affordable price for
customers. Of particular relevance is the promotion of efficiency and innovation. For water
resources it recognises that in order to meet future national water resources challenges
there are potentially significant savings for customers resulting from consideration of water
trading and third party options. Ofwat have outlined steps to promote competition in this
area, including the need for companies to publish market information and a bid assessment
framework16 for water resources options. However, in this plan we have already taken steps
in this direction with a view to identifying all possible options and driving innovation by
initiating a market engagement process as part of this Water Resources Management Plan
2019.
1.3.3 Applying the latest industry methods
In preparing for this plan we have consulted the Environment Agency and Natural Resources Wales
and followed their Water Resources Planning Guideline, along with the complementary supporting
documents (for example, on water resource zone integrity, drought plan links, and climate change).
We have adopted the current national best practice methods in the management of our water
resources and in preparation of this Water Resources Management Plan. In doing so, we have
followed key new reports such as the UKWIR decision making framework (UKWIR, 2016), UKWIR risk
based planning guidance (UKWIR, 2016) and WRMP19 Methods – Population, Household Property
and Occupancy Forecasting (UKWIR, 2015).
The UKWIR methodologies outline a framework of planning methods, from which to choose the
most appropriate based on the risks and complexity associated with the planning problem. This
allows companies to choose the most sophisticated methods where they drive the greatest benefit
to the process. In this plan we have chosen new and advanced methods, as outlined in the next
14 Environment Agency and Natural Resources Wales - Water Resources Planning Guideline – July 2018 (referred to as the
planning guidance, or guidelines). 15 Developed as part of UKWIR (UK Water Industry Research). We actively participate on steering or working groups as part
of this organisation. 16 The purpose of the bid assessment framework is to support a future bidding market for water resources, demand
management, and leakage services that Ofwat are seeking to develop. The market information is required to support the
development and operation of this market.

United Utilities Final Water Resources Management Plan 2019
© United Utilities Water Limited 2019 Page 20 of 191
section, in particular to support the assessment of water trading against a backdrop of future climate
change uncertainty. Our assessment of risk against the planning framework is described further in
Section 3.7.
1.3.4 Innovation in developing our plan
We have sought to innovate throughout the development of our plan. This allows us to develop the
most cost effective long-term, sustainable plan for our region. This section gives some key examples
of where we have applied innovation in developing the plan (noting that this list is not exhaustive).
Third party engagement to identify potential solutions
As part of the plan we have requested bids from third parties for both new water resources
provision and demand management options. The process involved issuing a Prior Information Notice
(PIN) to businesses, organisations and individuals to identify as many third party options as possible,
both within and outside our region, for consideration in the plan. In total, an additional 66 options
from third parties were included alongside our own options. This not only allowed us to identify a
wider range of potential supply-demand options, but also identified potentially innovative solutions
(for instance technologies that focus on detecting plumbing losses and supply pipe leaks) that we
could use in collaboration with third parties. This is particularly the case on options to manage
demand, and we have used the outputs of this activity to define a plan that delivers a more cost
effective demand management programme over the planning horizon.
Customer engagement
We’ve innovated in our customer research by testing new survey and research techniques to inform
the choices in our plan. As part of developing the plan, we developed an interactive web tool that
allowed customers to ‘build their own plan’ based on a hypothetical supply-demand problem. For
the first time, we have also explored risk and resilience further with customers, using techniques to
bring to life what it would mean to be without water in order to get customers’ views on the value
and investment they would support in this area.
‘Stochastic hydrology’ and climate change
In this Water Resources Management Plan we are using sophisticated ‘stochastic weather’17 to test
the response of our supply system to more severe and different patterns of drought than we have
seen historically. This also complements and supports the application of new options appraisal or
decision-making methods described below. The work, completed with our framework partners
Atkins, involved creating 17,400 years of stochastic flow data for 25 catchments. We have also
combined this work with that of Thames Water in order to further assess the coincidence of drought
in different areas of the country18.
As we found in our climate change work in the last Water Resources Management Plan, handling
large numbers of scenarios or large hydrological datasets can be challenging. To support our
assessment of different droughts and climate change, our work with Atkins has developed a rapid
17 A method to create alternative weather patterns that are realistic, but have not been recorded historically. 18 This builds on strategic work on long-term water resources resilience completed by Water UK.
United Utilities Final Water Resources Management Plan 2019
© United Utilities Water Limited 2019 Page 21 of 191
assessment or emulator model of our system19 to allow testing of large numbers of scenarios,
drawing on Cloud computing technology20, and overcoming this constraint.
Options appraisal and decision-making
We are one of a number of leading companies applying new water resources management planning
methods in this planning round. We have been working with our framework partners Atkins to apply
cutting edge, innovative techniques to support development of our plan, using approaches from a
new framework of methods published by UKWIR21. Our chosen approach uses ‘Robust Decision
Making (RDM)’ principles, and is tailored to the challenges faced in our region.
The Defra guiding principles outline the concept of developing a long-term ‘best-value’ plan (also
referred to in the planning guidelines as ‘cost effective’) rather than just ‘lowest-cost’. Our new
approaches support the traditional supply and demand balance approaches to help define the best-
value plan in a number of ways. They:
Test potential plans under a wide range of weather conditions and better understand the
risks of particular events occurring;
Allow us to test the plan under a wide range of possible futures (e.g. different climate and
demand), including beyond the 25-year planning horizon out into the 2080s to see how
different potential plans perform; and
Test the performance of our plans to a range of key performance metrics22 related to key
aspects of interest and ‘value’ to customers and stakeholders on water resources.
The technical work underpinning this work breaks new ground for Water Resources Management
Plans. For example, the screening of drought risk in combination with multiple climate change
scenarios involved processing the equivalent of several billion days’ worth of simulated data, which
hasn’t been applied elsewhere on such a scale.
1.4 Level of service: balancing customer and environment needs
The fundamental aim of our water resources and demand strategy is to strike the right balance
between potentially competing requirements of supply reliability, affordability, and environmental
protection. In doing so, we have listened to the views of customers, regulators and other
stakeholders, as described in Section 2.
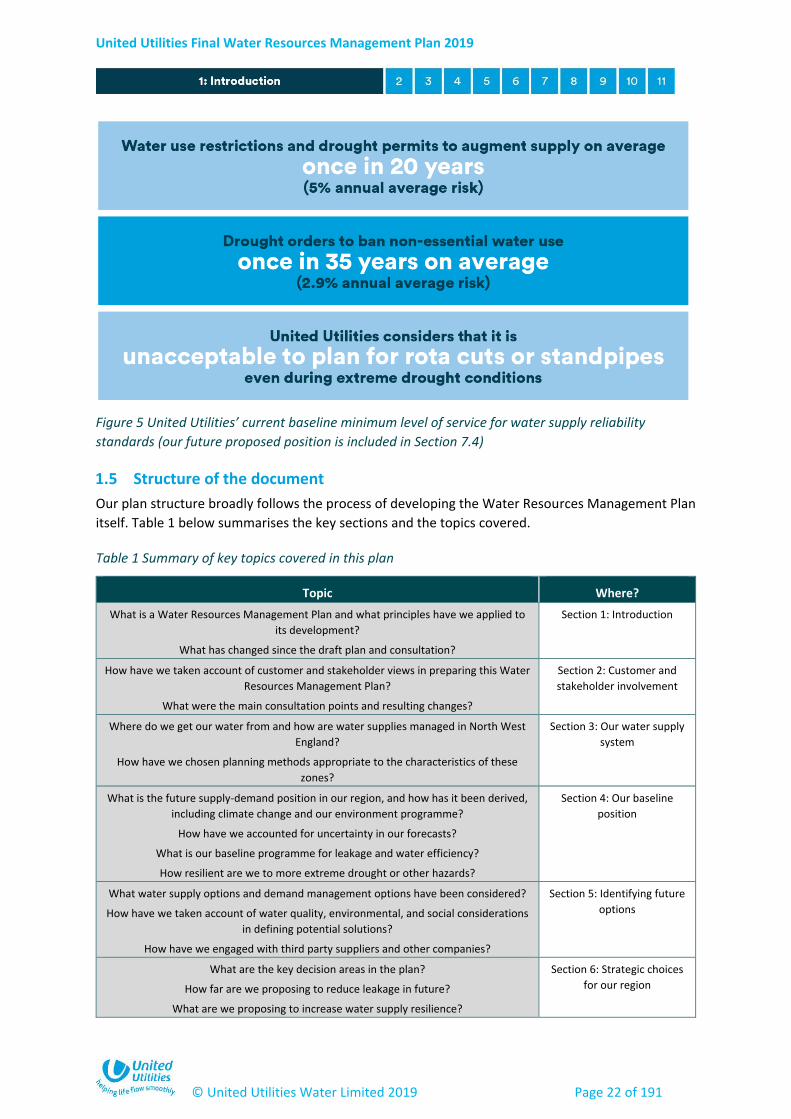
Following customer experience of the 1995/96 drought, we adopted an improved level of service for
water supply (Figure 5), and this remains our baseline for developing this plan. This improved level of
service was effective from the year 2000 onwards. Since this change, there has been one hosepipe
ban implemented in 2010, whilst no drought permits or orders were implemented. However, in this
plan we are considering further improvements to our levels of service, and these are presented as
strategic choices in Section 6.
19 The modelling package is called Pywr. 20 Cloud computing is the practice of using a network of remote servers to store, manage, and process data, rather than a
local server or a personal computer. 21 UKWIR decision making framework (UKWIR, 2016) and UKWIR risk based planning guidance (UKWIR, 2016). We were an
active steering group member of these projects. 22 Traditionally, Water Resources Management Plans are focused on supply-demand balance assessments, but these
techniques recognise there are a wide range of other factors of interest when determining a water resources strategy.
United Utilities Final Water Resources Management Plan 2019
© United Utilities Water Limited 2019 Page 22 of 191
Figure 5 United Utilities’ current baseline minimum level of service for water supply reliability
standards (our future proposed position is included in Section 7.4)
1.5 Structure of the document
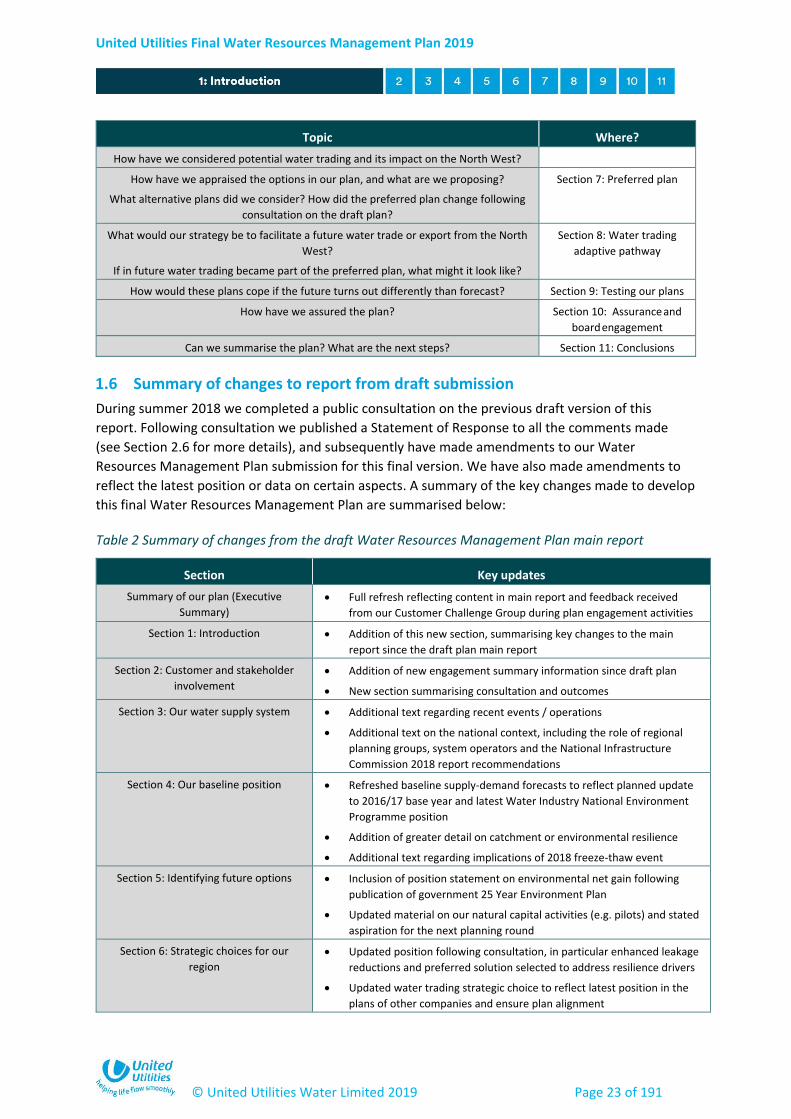
Our plan structure broadly follows the process of developing the Water Resources Management Plan
itself. Table 1 below summarises the key sections and the topics covered.
Table 1 Summary of key topics covered in this plan
Topic Where?
What is a Water Resources Management Plan and what principles have we applied to
its development?
What has changed since the draft plan and consultation?
Section 1: Introduction
How have we taken account of customer and stakeholder views in preparing this Water
Resources Management Plan?
What were the main consultation points and resulting changes?
Section 2: Customer and
stakeholder involvement
Where do we get our water from and how are water supplies managed in North West
England?
How have we chosen planning methods appropriate to the characteristics of these
zones?
Section 3: Our water supply
system
What is the future supply-demand position in our region, and how has it been derived,
including climate change and our environment programme?
How have we accounted for uncertainty in our forecasts?
What is our baseline programme for leakage and water efficiency?
How resilient are we to more extreme drought or other hazards?
Section 4: Our baseline
position
What water supply options and demand management options have been considered?
How have we taken account of water quality, environmental, and social considerations
in defining potential solutions?
How have we engaged with third party suppliers and other companies?
Section 5: Identifying future
options
What are the key decision areas in the plan?
How far are we proposing to reduce leakage in future?
What are we proposing to increase water supply resilience?
Section 6: Strategic choices
for our region
United Utilities Final Water Resources Management Plan 2019
© United Utilities Water Limited 2019 Page 23 of 191
Topic Where?
How have we considered potential water trading and its impact on the North West?
How have we appraised the options in our plan, and what are we proposing?
What alternative plans did we consider? How did the preferred plan change following
consultation on the draft plan?
Section 7: Preferred plan
What would our strategy be to facilitate a future water trade or export from the North
West?
If in future water trading became part of the preferred plan, what might it look like?
Section 8: Water trading
adaptive pathway
How would these plans cope if the future turns out differently than forecast? Section 9: Testing our plans
How have we assured the plan? Section 10: Assurance and
board engagement
Can we summarise the plan? What are the next steps? Section 11: Conclusions
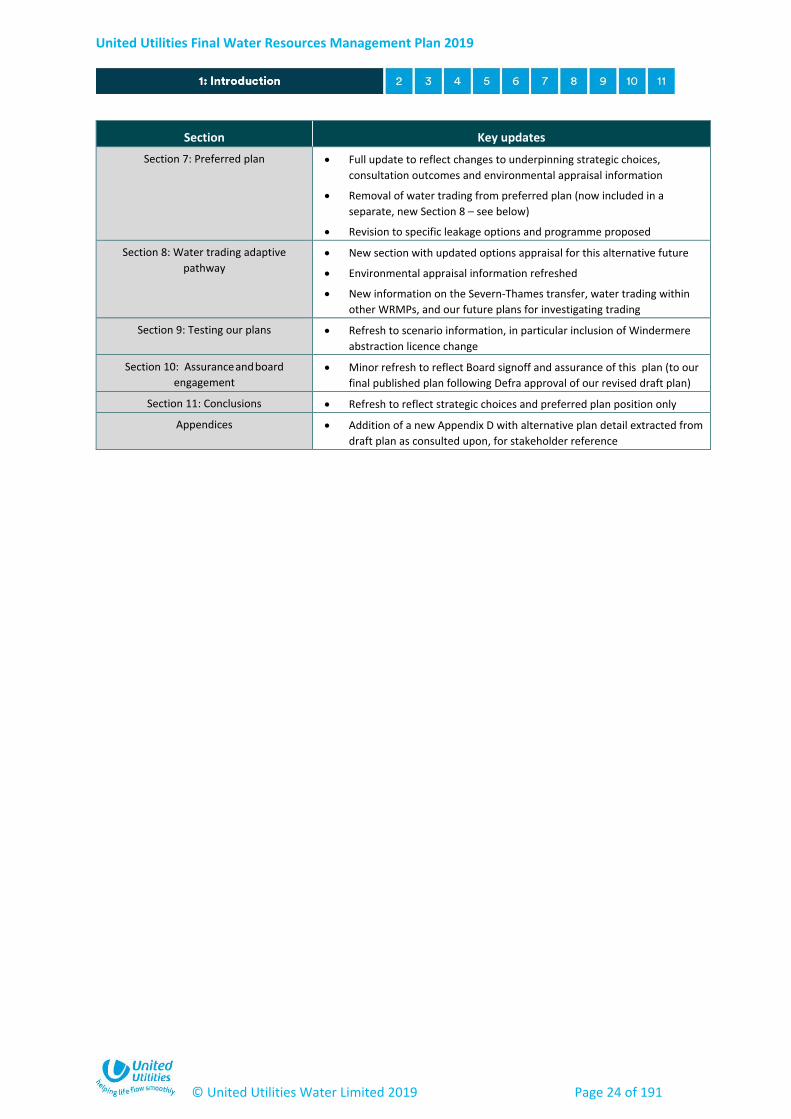
1.6 Summary of changes to report from draft submission
During summer 2018 we completed a public consultation on the previous draft version of this
report. Following consultation we published a Statement of Response to all the comments made
(see Section 2.6 for more details), and subsequently have made amendments to our Water
Resources Management Plan submission for this final version. We have also made amendments to
reflect the latest position or data on certain aspects. A summary of the key changes made to develop
this final Water Resources Management Plan are summarised below:
Table 2 Summary of changes from the draft Water Resources Management Plan main report
Section Key updates
Summary of our plan (Executive
Summary)
Full refresh reflecting content in main report and feedback received
from our Customer Challenge Group during plan engagement activities
Section 1: Introduction Addition of this new section, summarising key changes to the main
report since the draft plan main report
Section 2: Customer and stakeholder
involvement
Addition of new engagement summary information since draft plan
New section summarising consultation and outcomes
Section 3: Our water supply system Additional text regarding recent events / operations
Additional text on the national context, including the role of regional
planning groups, system operators and the National Infrastructure
Commission 2018 report recommendations
Section 4: Our baseline position Refreshed baseline supply-demand forecasts to reflect planned update
to 2016/17 base year and latest Water Industry National Environment
Programme position
Addition of greater detail on catchment or environmental resilience
Additional text regarding implications of 2018 freeze-thaw event
Section 5: Identifying future options Inclusion of position statement on environmental net gain following
publication of government 25 Year Environment Plan
Updated material on our natural capital activities (e.g. pilots) and stated
aspiration for the next planning round
Section 6: Strategic choices for our
region
Updated position following consultation, in particular enhanced leakage
reductions and preferred solution selected to address resilience drivers
Updated water trading strategic choice to reflect latest position in the
plans of other companies and ensure plan alignment
United Utilities Final Water Resources Management Plan 2019
© United Utilities Water Limited 2019 Page 24 of 191
Section Key updates
Section 7: Preferred plan Full update to reflect changes to underpinning strategic choices,
consultation outcomes and environmental appraisal information
Removal of water trading from preferred plan (now included in a
separate, new Section 8 – see below)
Revision to specific leakage options and programme proposed
Section 8: Water trading adaptive
pathway
New section with updated options appraisal for this alternative future
Environmental appraisal information refreshed
New information on the Severn-Thames transfer, water trading within
other WRMPs, and our future plans for investigating trading
Section 9: Testing our plans Refresh to scenario information, in particular inclusion of Windermere
abstraction licence change
Section 10: Assurance and board
engagement
Minor refresh to reflect Board signoff and assurance of this plan (to our
final published plan following Defra approval of our revised draft plan)
Section 11: Conclusions Refresh to reflect strategic choices and preferred plan position only
Appendices Addition of a new Appendix D with alternative plan detail extracted from
draft plan as consulted upon, for stakeholder reference
United Utilities Final Water Resources Management Plan 2019
© United Utilities Water Limited 2019 Page 25 of 191
2 Customer and stakeholder involvement
2.1 Overview
We value the views of all customers in our region, and wish to provide the service they expect whilst
maintaining affordable bills. We also recognise that our plans and activities are of particular interest to
specific organisations or individuals, and seek to take into account the views of stakeholders when
developing our plans.
With this in mind, in developing this Water Resources Management Plan we have gone even further than
previous plans to engage and collaborate with others. We started this activity much earlier in the planning
process to maximise the benefit of this dialogue and to ensure we can take customer, stakeholder and
regulator feedback fully on-board in developing this Water Resources Management Plan. For example, we
commenced our stakeholder pre-consultation process in autumn 2016.
Given the strategic influences and choices for our plan, and noting the Defra guiding principles, we have
also completed a larger and more diverse customer research and engagement programme for this Water
Resources Management Plan compared with our 2015 plan. This has taken us beyond more traditional
survey methods such as ‘willingness to pay’ surveys, using a range of qualitative and quantitative
engagement techniques including a detailed analysis of our business as usual data. This allows us to build
up consensus and evidence from a range of sources, and ensures that results are not the product of any
single method or survey. Innovative approaches, such as an interactive online tool23 to allow customers to
23 Known as a programme choice experiment.
Key points
In line with Defra’s guiding principles we set out to gain a broad and in-depth view of
customer and stakeholder views.
We engaged both stakeholders and customers from the beginning of the planning
process, including through an extensive pre-consultation process. We have ensured
that the views and opinions captured are reflected in how we have shaped our plan.
We’ve used new innovations to engage with customers more effectively, such as
online interactive experiments and ‘immersive’ research methods.
Prior to running customer research, we’ve engaged our YourVoice panel to seek
feedback and inform our approach to make it is as effective as possible.
We have liaised closely with regulators to ensure the plan is produced according to all
published guidelines.
We contacted over 700 stakeholders as part of our public consultation on the draft
plan, engaging in a range of ways in addition to holding public events. The resulting
responses, along with further customer engagement, has informed this final report.
United Utilities Final Water Resources Management Plan 2019
© United Utilities Water Limited 2019 Page 26 of 191
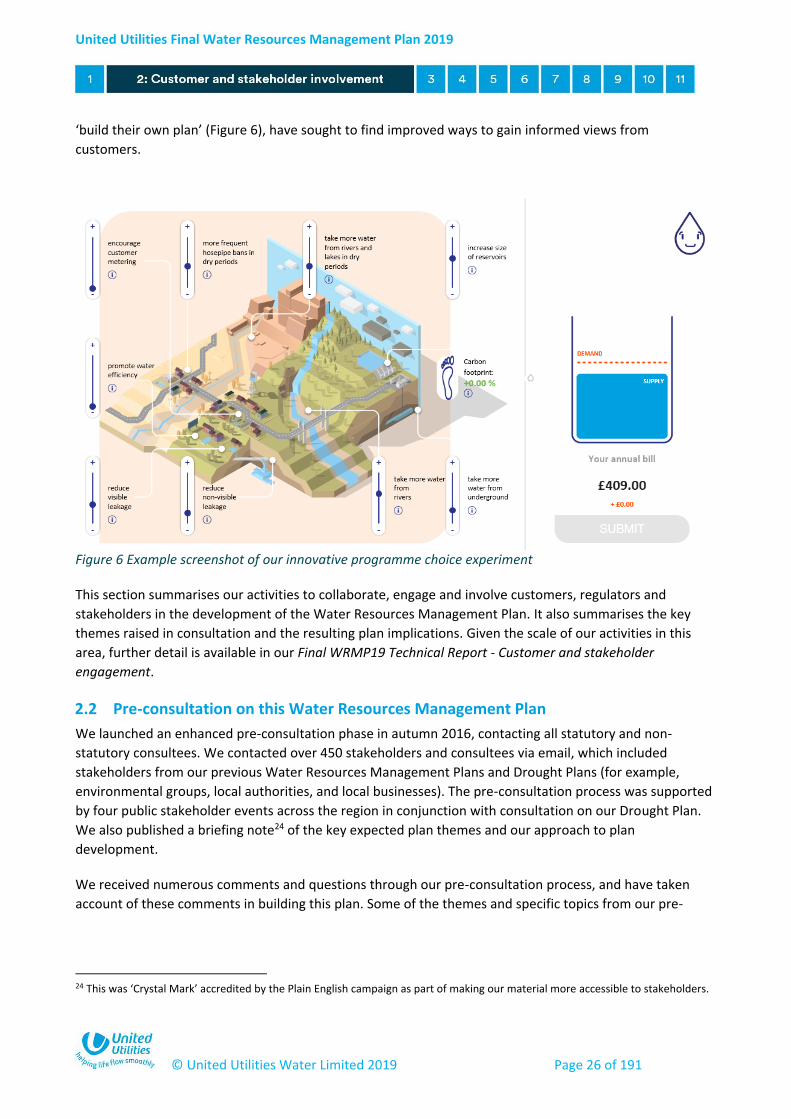
‘build their own plan’ (Figure 6), have sought to find improved ways to gain informed views from
customers.
Figure 6 Example screenshot of our innovative programme choice experiment
This section summarises our activities to collaborate, engage and involve customers, regulators and
stakeholders in the development of the Water Resources Management Plan. It also summarises the key
themes raised in consultation and the resulting plan implications. Given the scale of our activities in this
area, further detail is available in our Final WRMP19 Technical Report - Customer and stakeholder
engagement.
2.2 Pre-consultation on this Water Resources Management Plan
We launched an enhanced pre-consultation phase in autumn 2016, contacting all statutory and non-
statutory consultees. We contacted over 450 stakeholders and consultees via email, which included
stakeholders from our previous Water Resources Management Plans and Drought Plans (for example,
environmental groups, local authorities, and local businesses). The pre-consultation process was supported
by four public stakeholder events across the region in conjunction with consultation on our Drought Plan.
We also published a briefing note24 of the key expected plan themes and our approach to plan
development.
We received numerous comments and questions through our pre-consultation process, and have taken
account of these comments in building this plan. Some of the themes and specific topics from our pre-
24 This was ‘Crystal Mark’ accredited by the Plain English campaign as part of making our material more accessible to stakeholders.
United Utilities Final Water Resources Management Plan 2019
© United Utilities Water Limited 2019 Page 27 of 191
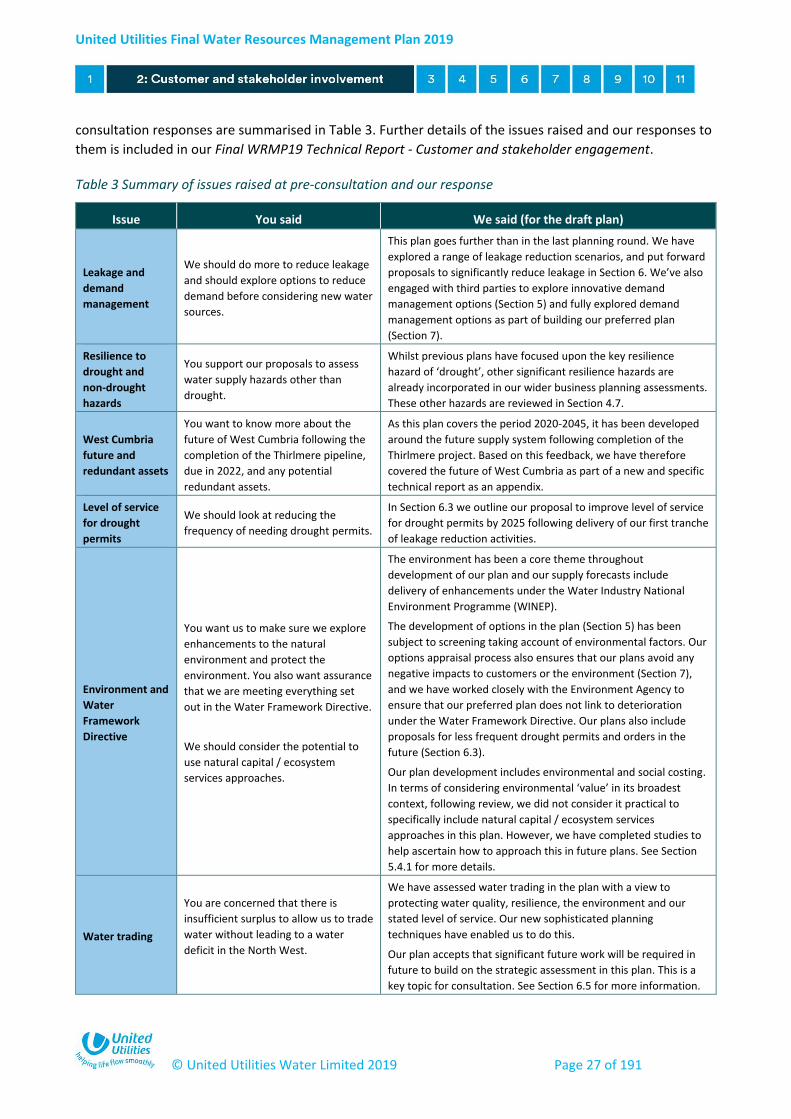
consultation responses are summarised in Table 3. Further details of the issues raised and our responses to
them is included in our Final WRMP19 Technical Report - Customer and stakeholder engagement.
Table 3 Summary of issues raised at pre-consultation and our response
Issue You said We said (for the draft plan)
Leakage and
demand
management
We should do more to reduce leakage
and should explore options to reduce
demand before considering new water
sources.
This plan goes further than in the last planning round. We have
explored a range of leakage reduction scenarios, and put forward
proposals to significantly reduce leakage in Section 6. We’ve also
engaged with third parties to explore innovative demand
management options (Section 5) and fully explored demand
management options as part of building our preferred plan
(Section 7).
Resilience to
drought and
non-drought
hazards
You support our proposals to assess
water supply hazards other than
drought.
Whilst previous plans have focused upon the key resilience
hazard of ‘drought’, other significant resilience hazards are
already incorporated in our wider business planning assessments.
These other hazards are reviewed in Section 4.7.
West Cumbria
future and
redundant assets
You want to know more about the
future of West Cumbria following the
completion of the Thirlmere pipeline,
due in 2022, and any potential
redundant assets.
As this plan covers the period 2020-2045, it has been developed
around the future supply system following completion of the
Thirlmere project. Based on this feedback, we have therefore
covered the future of West Cumbria as part of a new and specific
technical report as an appendix.
Level of service
for drought
permits
We should look at reducing the
frequency of needing drought permits.
In Section 6.3 we outline our proposal to improve level of service
for drought permits by 2025 following delivery of our first tranche
of leakage reduction activities.
Environment and
Water
Framework
Directive
You want us to make sure we explore
enhancements to the natural
environment and protect the
environment. You also want assurance
that we are meeting everything set
out in the Water Framework Directive.
We should consider the potential to
use natural capital / ecosystem
services approaches.
The environment has been a core theme throughout
development of our plan and our supply forecasts include
delivery of enhancements under the Water Industry National
Environment Programme (WINEP).
The development of options in the plan (Section 5) has been
subject to screening taking account of environmental factors. Our
options appraisal process also ensures that our plans avoid any
negative impacts to customers or the environment (Section 7),
and we have worked closely with the Environment Agency to
ensure that our preferred plan does not link to deterioration
under the Water Framework Directive. Our plans also include
proposals for less frequent drought permits and orders in the
future (Section 6.3).
Our plan development includes environmental and social costing.
In terms of considering environmental ‘value’ in its broadest
context, following review, we did not consider it practical to
specifically include natural capital / ecosystem services
approaches in this plan. However, we have completed studies to
help ascertain how to approach this in future plans. See Section
5.4.1 for more details.
Water trading
You are concerned that there is
insufficient surplus to allow us to trade
water without leading to a water
deficit in the North West.
We have assessed water trading in the plan with a view to
protecting water quality, resilience, the environment and our
stated level of service. Our new sophisticated planning
techniques have enabled us to do this.
Our plan accepts that significant future work will be required in
future to build on the strategic assessment in this plan. This is a
key topic for consultation. See Section 6.5 for more information.

United Utilities Final Water Resources Management Plan 2019
© United Utilities Water Limited 2019 Page 28 of 191
Issue You said We said (for the draft plan)
You also want assurance that any
potential water trading would not
have any detrimental effects on the
North West region.
Abstraction from
Windermere
You have concerns with the current
approach to abstraction from
Windermere.
We reviewed the operation of abstraction from Windermere in
the Drought Plan, and the Water Resources Management Plan is
consistent with the outcomes of the Drought Plan process. We
have commissioned a review to assess the impact of our
abstraction licence in relation to recreational users, commercial
interests and the environment, and this is due to complete in
summer 2019 Any implications of this review on the Water
Resources Management Plan process will be considered when we
have the results of the study. (NB. Since this response, the joint
review of the Windermere abstraction licence has been
completed; the output was shared with the Environment Agency
and other stakeholders at an event in June 2019. The review has
concluded that the current abstraction regime has no significant
impact on Windermere or the River Leven, and therefore we will
not be seeking any changes to the abstraction licence.)
As part of pre-consultation, we also asked for volunteers for a Technical Stakeholder Group to further
inform and participate in development of the draft Water Resources Management Plan (complementing
other stakeholder engagement activities). The aim was to develop a small ‘working group’, and the group
met on two occasions during 2017 prior to submission of the draft Water Resources Management Plan. We
thank the contribution of the Technical Stakeholder Group on plan development. More detail on the
activities of this group may be found in our Final WRMP19 Technical Report - Customer and stakeholder
engagement.
2.3 YourVoice
We have an established Customer Challenge Group (CCG) known as, ‘YourVoice Customer and Stakeholder
panel’. They are a group of independent representatives from different sectors, backgrounds and areas of
expertise. The expertise embodied in the panel ranges from Citizens’ Advice, to the Confederation of British
Industry; from environmental organisations to public health; and from flood and coastal defence
organisations to consumer interests. They help us to reflect on what type of consumer representation is
needed and how this relates to the company’s existing governance arrangement. To ensure that our
stakeholder engagement and customer research was appropriate it was discussed with YourVoice at
various stages. As an independent body the YourVoice panel aims to ensure that customers are at the heart
of our business planning engagement.
2.4 Regulator liaison
We have engaged with regulators from early in the planning process and have maintained extensive
engagement throughout the process. We shared detailed internal methodologies with the Environment
Agency in advance of plan development during spring-summer 2016. We have ensured that feedback from
this process, along with that from other stakeholders, has been taken into account when developing this
plan. Regulators were consulted during our pre-consultation period to discuss methods and approaches to
reduce the risk of change later in the planning process. This was supported by submission of an overarching
United Utilities Final Water Resources Management Plan 2019
© United Utilities Water Limited 2019 Page 29 of 191
method statement at pre-consultation in autumn 2016 to the Environment Agency, Natural Resources
Wales and Ofwat.
We have engaged with the Environment Agency, Natural Resources Wales, Natural England, the Drinking
Water Inspectorate and Ofwat through the process of developing the Water Resources Management Plan
to inform them of our progress and chosen approach. For the Environment Agency, Natural Resources
Wales and Natural England in particular, this has also been supported by holding bi-monthly Water
Resources Management Plan liaison meetings and a number of ‘special interest’ sessions on specific
technical topics such as climate change, water trading and water supply modelling. The environmental
regulators were also engaged as part of scoping our Strategic Environmental Assessment and Habitats
Regulations Assessment processes.
Given the potential impacts of Water Resources Management Plan solutions on water quality, we discussed
the development of the plan at liaison meetings with the Drinking Water Inspectorate and we will continue
to engage with them as we progress any proposed plans to ensure drinking water quality is protected. We
have aligned our plan to comply with the latest guidance: Long term planning guidance for the quality of
drinking water supplies (Drinking Water Inspectorate, 2017).
2.5 Overview of all stakeholder and customer engagement activities
Through our extensive engagement process we have a wealth of responses from numerous events and
activities. An overview of our customer and stakeholder engagement activities is shown in the timeline
below (Figure 7 and Figure 8), along with a summary of the key messages from these interactions in Table
4. This is not an exhaustive summary of all of our engagement activities, but reflects salient areas of
feedback relevant to the choices in this plan. Engagement with third parties regarding potential supply-
demand options, exports or solutions is also covered in Section 5.
We have also sought to inform and engage stakeholders on the Water Resources Management Plan or
related topics as part of our ‘business as usual’ activities. For example, updates on plan development have
been provided to local authorities as part of our normal engagement on local growth and development.
We’ve also used existing customer data, a process known as ‘data mining’, to investigate customer views
and strength of opinion in certain areas. In some cases, this has shown that outside of drought, some water
resources issues such water use restrictions feature little in customer interactions, demonstrating the need
for specific customer engagement in this area as part of developing the plan.
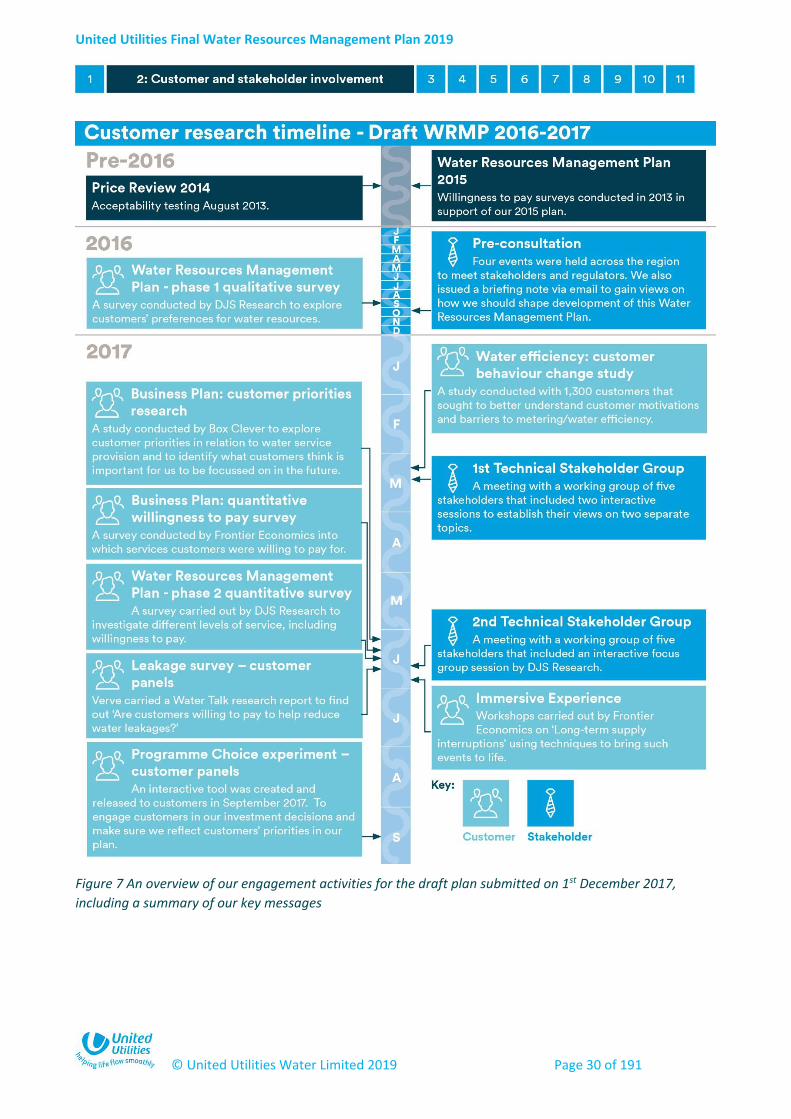
United Utilities Final Water Resources Management Plan 2019
© United Utilities Water Limited 2019 Page 30 of 191
Figure 7 An overview of our engagement activities for the draft plan submitted on 1st December 2017,
including a summary of our key messages
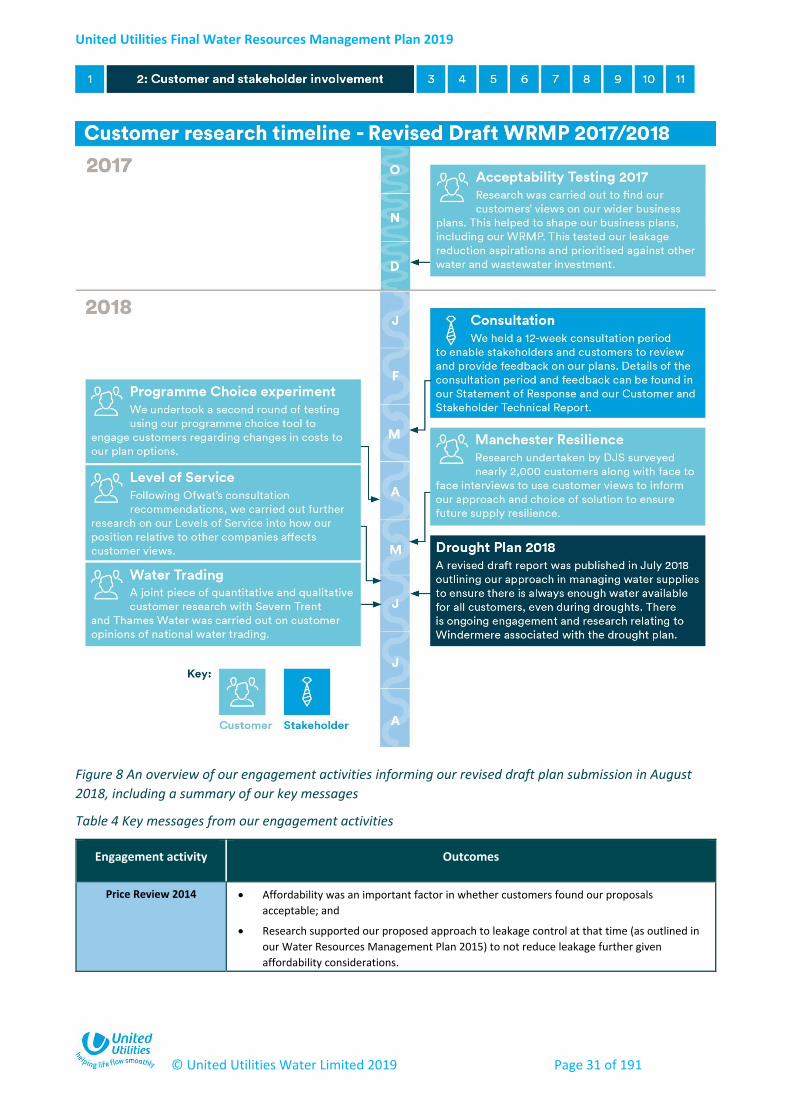
United Utilities Final Water Resources Management Plan 2019
© United Utilities Water Limited 2019 Page 31 of 191
Figure 8 An overview of our engagement activities informing our revised draft plan submission in August
2018, including a summary of our key messages
Table 4 Key messages from our engagement activities
Engagement activity Outcomes
Price Review 2014 Affordability was an important factor in whether customers found our proposals
acceptable; and
Research supported our proposed approach to leakage control at that time (as outlined in
our Water Resources Management Plan 2015) to not reduce leakage further given
affordability considerations.
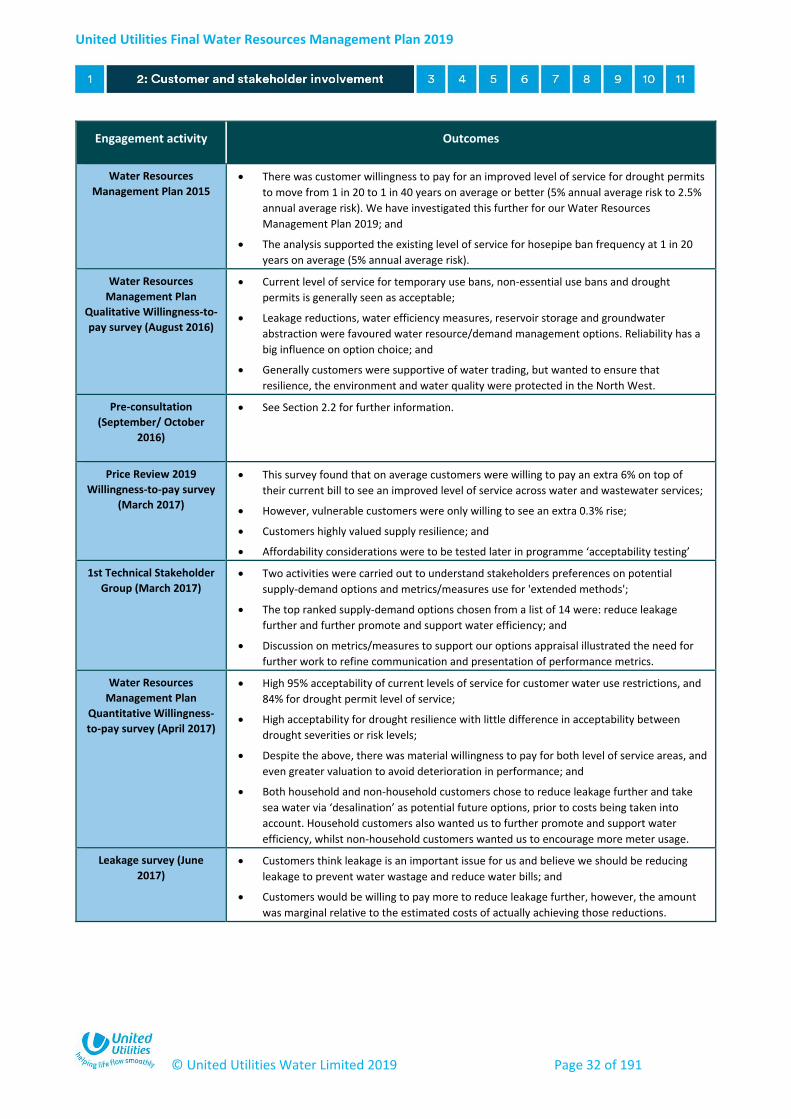
United Utilities Final Water Resources Management Plan 2019
© United Utilities Water Limited 2019 Page 32 of 191
Engagement activity Outcomes
Water Resources
Management Plan 2015 There was customer willingness to pay for an improved level of service for drought permits
to move from 1 in 20 to 1 in 40 years on average or better (5% annual average risk to 2.5%
annual average risk). We have investigated this further for our Water Resources
Management Plan 2019; and
The analysis supported the existing level of service for hosepipe ban frequency at 1 in 20
years on average (5% annual average risk).
Water Resources
Management Plan
Qualitative Willingness-to-
pay survey (August 2016)
Current level of service for temporary use bans, non-essential use bans and drought
permits is generally seen as acceptable;
Leakage reductions, water efficiency measures, reservoir storage and groundwater
abstraction were favoured water resource/demand management options. Reliability has a
big influence on option choice; and
Generally customers were supportive of water trading, but wanted to ensure that
resilience, the environment and water quality were protected in the North West.
Pre-consultation
(September/ October
2016)
See Section 2.2 for further information.
Price Review 2019
Willingness-to-pay survey
(March 2017)
This survey found that on average customers were willing to pay an extra 6% on top of
their current bill to see an improved level of service across water and wastewater services;
However, vulnerable customers were only willing to see an extra 0.3% rise;
Customers highly valued supply resilience; and
Affordability considerations were to be tested later in programme ‘acceptability testing’
1st Technical Stakeholder
Group (March 2017) Two activities were carried out to understand stakeholders preferences on potential
supply-demand options and metrics/measures use for 'extended methods';
The top ranked supply-demand options chosen from a list of 14 were: reduce leakage
further and further promote and support water efficiency; and
Discussion on metrics/measures to support our options appraisal illustrated the need for
further work to refine communication and presentation of performance metrics.
Water Resources
Management Plan
Quantitative Willingness-
to-pay survey (April 2017)
High 95% acceptability of current levels of service for customer water use restrictions, and
84% for drought permit level of service;
High acceptability for drought resilience with little difference in acceptability between
drought severities or risk levels;
Despite the above, there was material willingness to pay for both level of service areas, and
even greater valuation to avoid deterioration in performance; and
Both household and non-household customers chose to reduce leakage further and take
sea water via ‘desalination’ as potential future options, prior to costs being taken into
account. Household customers also wanted us to further promote and support water
efficiency, whilst non-household customers wanted us to encourage more meter usage.
Leakage survey (June
2017) Customers think leakage is an important issue for us and believe we should be reducing
leakage to prevent water wastage and reduce water bills; and
Customers would be willing to pay more to reduce leakage further, however, the amount
was marginal relative to the estimated costs of actually achieving those reductions.

United Utilities Final Water Resources Management Plan 2019
© United Utilities Water Limited 2019 Page 33 of 191
Engagement activity Outcomes
2nd Technical Stakeholder
Group (July 2017) The current level of service on temporary use bans was considered acceptable, whilst
drought permit service levels of once every 40 years (2.5% annual average risk) and 60
years (1.7% annual average risk) on average were considered most acceptable;
Of the water resource options proposed, stakeholders favoured reducing leakage further
and encouraging customers to use meters;
Stakeholders least favoured taking more water from rivers, desalination, storing water in
new reservoirs, increasing existing reservoirs, transferring water from other regions and
more frequent drought permits; and
Stakeholders selected the highest leakage reductions from choices offered, feeling the
indicative bill impacts to be justifiable on the grounds of environmental benefit.
Drought Plan engagement
2016/2017
(Text represents period to
November 2017)
We presented four drought triggers for each of the four resource zones;
Extensive feedback was sought from stakeholders through the process relevant to the
development of this plan; and
We engaged with stakeholders and regulators to seek agreement on the operation of our
strategic pumped sources – this Water Resources Management Plan is consistent with the
outcome of those discussions. The Final Drought Plan 2018, influenced by these
discussions, has since been published.
Immersive Customer
Research (July 2017) The long-term supply interruptions workshop found that customers deemed a long-term
interruption intolerable; and
Supply resilience was considered highly important – for long-term supply interruptions (of
3-14 days) customers placed a value of £290 per day to avoid such an event.
Programme Choice
(September 2017)
Within the first two weeks we received 866 responses;
Customers were willing to pay enough on their bills to reduce leakage by 44 Ml/d;
Customers were keener on reservoir and boreholes options, and less so on abstraction
from rivers;
The average choice for temporary use ban level of service was a frequency of once every 13
years on average (7.7% annual average risk), showing acceptability of our current level of
service (once every 20 years on average or 5% annual average risk); and
Marginally less frequent drought permits were preferred at once every 24 years on average
(4.2% annual average risk).
Data mining Throughout the year we collect existing customer data to investigate customer views in
certain areas. The most pertinent data to the Water Resources Management Plan relates to
leakage, supply interruptions (collected between April 2014 and January 2017) and the
2010 hosepipe ban. In general:
o Outside of drought, some water resources issues such as water use
restrictions feature little in customer interactions (by their inherent nature,
these occur less frequently than other areas of customer contact),
demonstrating the need for specific customer engagement in this area as part
of developing the plan.
o Customers regularly contact us to report a variety of leaks and problems
associated with defective fittings and meters. Unplanned water supply
interruptions accounted for 38% of the contacts received during the April
2014 to January 2017 period, reinforcing the value that customers place on
resilience.
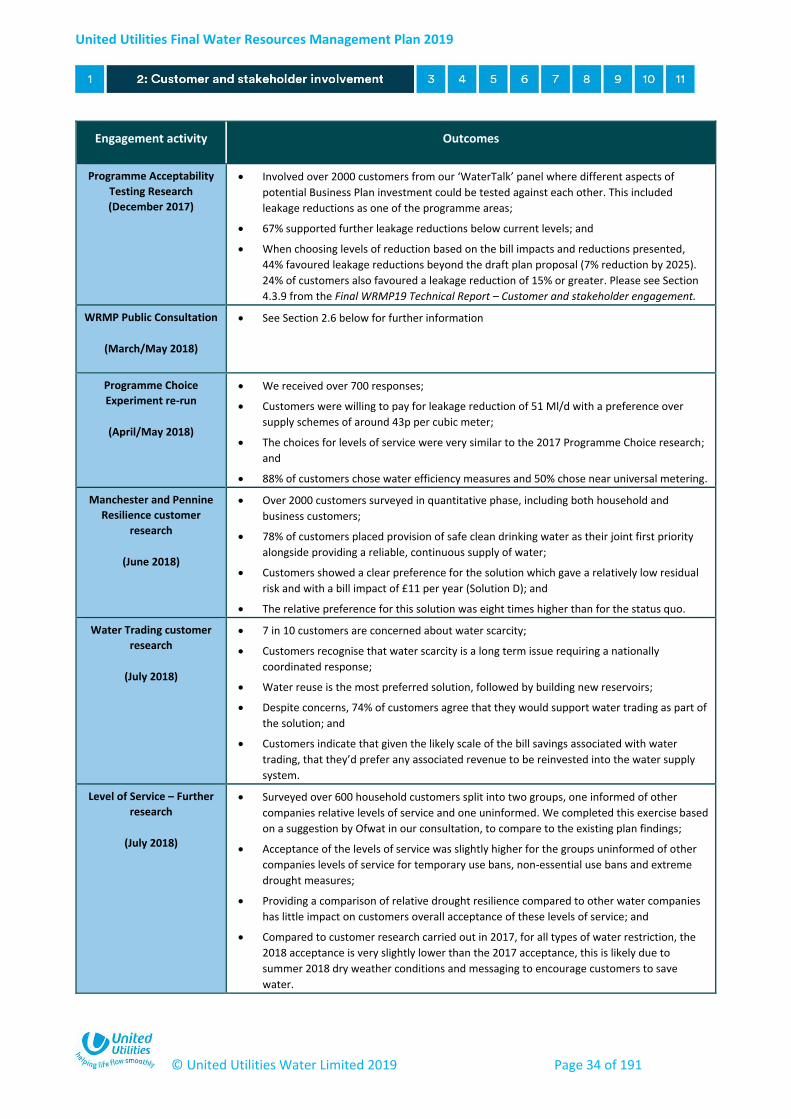
United Utilities Final Water Resources Management Plan 2019
© United Utilities Water Limited 2019 Page 34 of 191
Engagement activity Outcomes
Programme Acceptability
Testing Research
(December 2017)
Involved over 2000 customers from our ‘WaterTalk’ panel where different aspects of
potential Business Plan investment could be tested against each other. This included
leakage reductions as one of the programme areas;
67% supported further leakage reductions below current levels; and
When choosing levels of reduction based on the bill impacts and reductions presented,
44% favoured leakage reductions beyond the draft plan proposal (7% reduction by 2025).
24% of customers also favoured a leakage reduction of 15% or greater. Please see Section
4.3.9 from the Final WRMP19 Technical Report – Customer and stakeholder engagement.
WRMP Public Consultation
(March/May 2018)
See Section 2.6 below for further information
Programme Choice
Experiment re-run
(April/May 2018)
We received over 700 responses;
Customers were willing to pay for leakage reduction of 51 Ml/d with a preference over
supply schemes of around 43p per cubic meter;
The choices for levels of service were very similar to the 2017 Programme Choice research;
and
88% of customers chose water efficiency measures and 50% chose near universal metering.
Manchester and Pennine
Resilience customer
research
(June 2018)
Over 2000 customers surveyed in quantitative phase, including both household and
business customers;
78% of customers placed provision of safe clean drinking water as their joint first priority
alongside providing a reliable, continuous supply of water;
Customers showed a clear preference for the solution which gave a relatively low residual
risk and with a bill impact of £11 per year (Solution D); and
The relative preference for this solution was eight times higher than for the status quo.
Water Trading customer
research
(July 2018)
7 in 10 customers are concerned about water scarcity;
Customers recognise that water scarcity is a long term issue requiring a nationally
coordinated response;
Water reuse is the most preferred solution, followed by building new reservoirs;
Despite concerns, 74% of customers agree that they would support water trading as part of
the solution; and
Customers indicate that given the likely scale of the bill savings associated with water
trading, that they’d prefer any associated revenue to be reinvested into the water supply
system.
Level of Service – Further
research
(July 2018)
Surveyed over 600 household customers split into two groups, one informed of other
companies relative levels of service and one uninformed. We completed this exercise based
on a suggestion by Ofwat in our consultation, to compare to the existing plan findings;
Acceptance of the levels of service was slightly higher for the groups uninformed of other
companies levels of service for temporary use bans, non-essential use bans and extreme
drought measures;
Providing a comparison of relative drought resilience compared to other water companies
has little impact on customers overall acceptance of these levels of service; and
Compared to customer research carried out in 2017, for all types of water restriction, the
2018 acceptance is very slightly lower than the 2017 acceptance, this is likely due to
summer 2018 dry weather conditions and messaging to encourage customers to save
water.

United Utilities Final Water Resources Management Plan 2019
© United Utilities Water Limited 2019 Page 35 of 191
We have taken feedback on-board throughout the development of our plan. In particular, customer and stakeholder feedback has helped to guide our strategic choices and help to explore the proposals in each one.
The strategic choices, which we discuss further in Section 6, are listed below:
Enhancing leakage reduction;
Improved level of service for drought permits and orders to augment supply;
Improved resilience to non-drought hazards; and
Exploring national water trading.
In each case we summarise the reason for each of our choices and how this maps back to relevant
customer, stakeholder and regulator feedback. These strategic choices are combined to form our preferred
plan, which is discussed in Section 7.
2.6 Consultation on the draft version of this plan
On 2 March 2018 we published our draft Water Resources Management Plan for consultation. We emailed
around 700 statutory and non-statutory stakeholders alongside publishing on our website. We also used
social media platforms such as LinkedIn and Twitter to promote plan consultation, with our social media
approach reaching an audience of over 68,000 and our water resources website receiving over 2000
visitors. We held three consultation events across the North West region to talk through the key elements
of our plan with interested parties and to help inform their formal responses to our consultation. These
events were attended by 26 delegates from 20 different organisations. These activities supported ongoing
‘business as usual’ engagement with stakeholders and regulators within which consultation was also
promoted and there was opportunity to discuss the plan.
We received 25 formal consultation responses, which raised over 200 points that we have responded to in
our Statement of Response, and subsequently made changes to this report (Section 1.6) or the supporting
Technical Reports. The Statement of Response has been published on our website along with this
document. A short summary based on the key themes during consultation can be found in Table 5 below,
noting comprehensive coverage is included in the Statement of Response itself.
Table 5 Summary of salient consultation themes and our position
Key Issues You said We did
Leakage and demand management
There was support for our plans to reduce leakage, but consultees felt we should go further / be more ambitious.
We should explore options to reduce demand before considering new water sources.
We have continued to explore new and innovative options to reduce leakage, building upon our already extensive options identification process. We have also completed further customer engagement on leakage reductions.
Based on this, and customer, stakeholder and regulator feedback on balance, we have increased our leakage aspirations (Section 6.2) and revised our programme of options (Section 7.4.2).
Our final plan now sets out an ambitious leakage target of 20% by 2025, and over 40% by the end of the planning period in 2045.
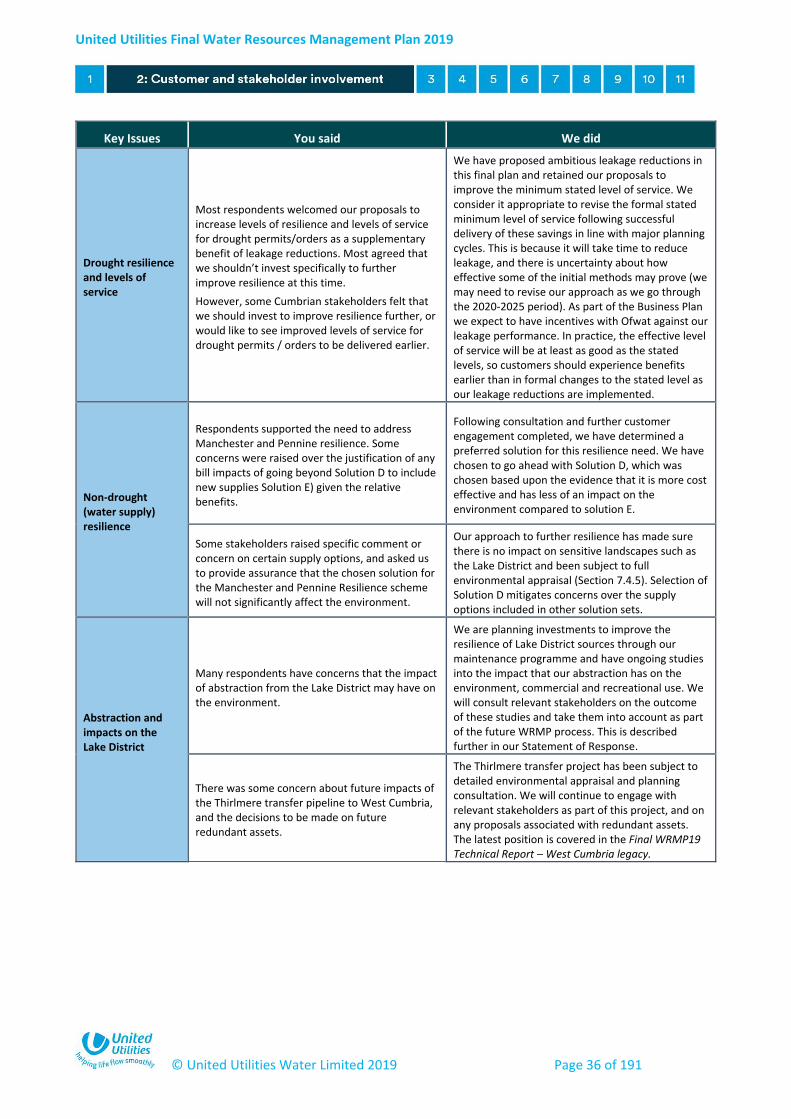
United Utilities Final Water Resources Management Plan 2019
© United Utilities Water Limited 2019 Page 36 of 191
Key Issues You said We did
Drought resilience and levels of service
Most respondents welcomed our proposals to increase levels of resilience and levels of service for drought permits/orders as a supplementary benefit of leakage reductions. Most agreed that we shouldn’t invest specifically to further improve resilience at this time.
However, some Cumbrian stakeholders felt that we should invest to improve resilience further, or would like to see improved levels of service for drought permits / orders to be delivered earlier.
We have proposed ambitious leakage reductions in this final plan and retained our proposals to improve the minimum stated level of service. We consider it appropriate to revise the formal stated minimum level of service following successful delivery of these savings in line with major planning cycles. This is because it will take time to reduce leakage, and there is uncertainty about how effective some of the initial methods may prove (we may need to revise our approach as we go through the 2020-2025 period). As part of the Business Plan we expect to have incentives with Ofwat against our leakage performance. In practice, the effective level of service will be at least as good as the stated levels, so customers should experience benefits earlier than in formal changes to the stated level as our leakage reductions are implemented.
Non-drought (water supply) resilience
Respondents supported the need to address Manchester and Pennine resilience. Some concerns were raised over the justification of any bill impacts of going beyond Solution D to include new supplies Solution E) given the relative benefits.
Following consultation and further customer engagement completed, we have determined a preferred solution for this resilience need. We have chosen to go ahead with Solution D, which was chosen based upon the evidence that it is more cost effective and has less of an impact on the environment compared to solution E.
Some stakeholders raised specific comment or concern on certain supply options, and asked us to provide assurance that the chosen solution for the Manchester and Pennine Resilience scheme will not significantly affect the environment.
Our approach to further resilience has made sure there is no impact on sensitive landscapes such as the Lake District and been subject to full environmental appraisal (Section 7.4.5). Selection of Solution D mitigates concerns over the supply options included in other solution sets.
Abstraction and impacts on the Lake District
Many respondents have concerns that the impact of abstraction from the Lake District may have on the environment.
We are planning investments to improve the resilience of Lake District sources through our maintenance programme and have ongoing studies into the impact that our abstraction has on the environment, commercial and recreational use. We will consult relevant stakeholders on the outcome of these studies and take them into account as part of the future WRMP process. This is described further in our Statement of Response.
There was some concern about future impacts of the Thirlmere transfer pipeline to West Cumbria, and the decisions to be made on future redundant assets.
The Thirlmere transfer project has been subject to detailed environmental appraisal and planning consultation. We will continue to engage with relevant stakeholders as part of this project, and on any proposals associated with redundant assets. The latest position is covered in the Final WRMP19 Technical Report – West Cumbria legacy.
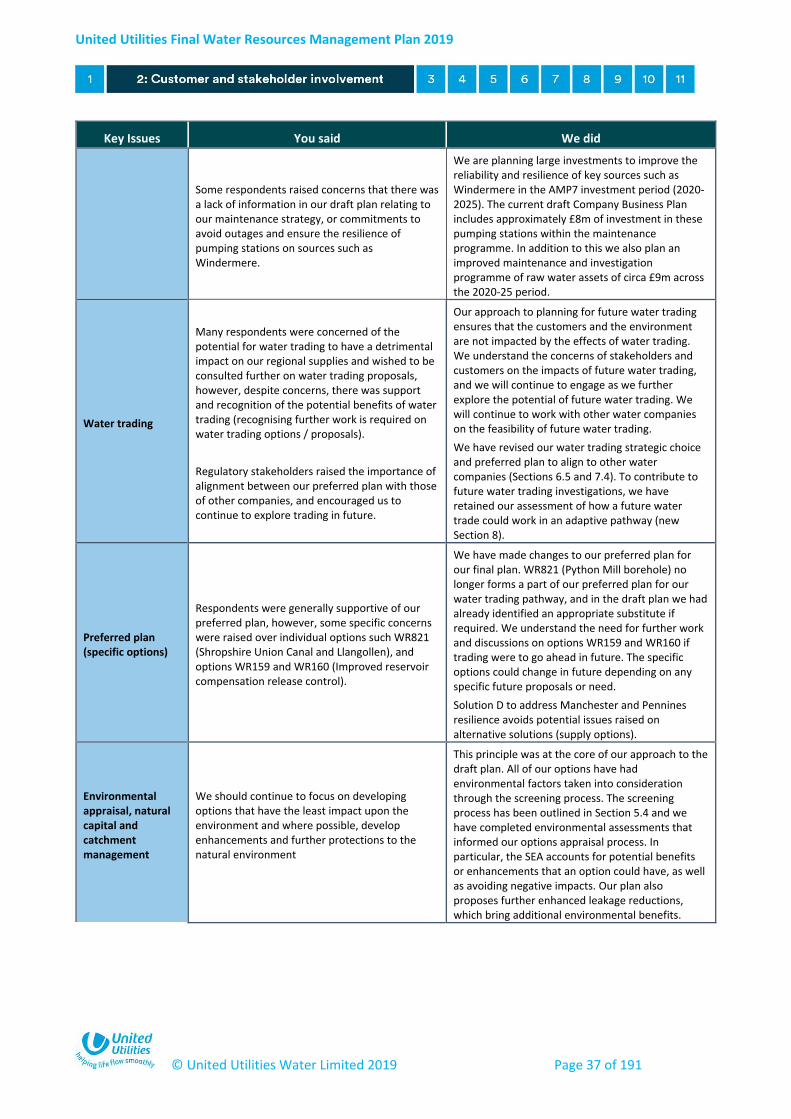
United Utilities Final Water Resources Management Plan 2019
© United Utilities Water Limited 2019 Page 37 of 191
Key Issues You said We did
Some respondents raised concerns that there was a lack of information in our draft plan relating to our maintenance strategy, or commitments to avoid outages and ensure the resilience of pumping stations on sources such as Windermere.
We are planning large investments to improve the reliability and resilience of key sources such as Windermere in the AMP7 investment period (2020-2025). The current draft Company Business Plan includes approximately £8m of investment in these pumping stations within the maintenance programme. In addition to this we also plan an improved maintenance and investigation programme of raw water assets of circa £9m across the 2020-25 period.
Water trading
Many respondents were concerned of the potential for water trading to have a detrimental impact on our regional supplies and wished to be consulted further on water trading proposals, however, despite concerns, there was support and recognition of the potential benefits of water trading (recognising further work is required on water trading options / proposals).
Regulatory stakeholders raised the importance of alignment between our preferred plan with those of other companies, and encouraged us to continue to explore trading in future.
Our approach to planning for future water trading ensures that the customers and the environment are not impacted by the effects of water trading. We understand the concerns of stakeholders and customers on the impacts of future water trading, and we will continue to engage as we further explore the potential of future water trading. We will continue to work with other water companies on the feasibility of future water trading.
We have revised our water trading strategic choice and preferred plan to align to other water companies (Sections 6.5 and 7.4). To contribute to future water trading investigations, we have retained our assessment of how a future water trade could work in an adaptive pathway (new Section 8).
Preferred plan (specific options)
Respondents were generally supportive of our preferred plan, however, some specific concerns were raised over individual options such WR821 (Shropshire Union Canal and Llangollen), and options WR159 and WR160 (Improved reservoir compensation release control).
We have made changes to our preferred plan for our final plan. WR821 (Python Mill borehole) no longer forms a part of our preferred plan for our water trading pathway, and in the draft plan we had already identified an appropriate substitute if required. We understand the need for further work and discussions on options WR159 and WR160 if trading were to go ahead in future. The specific options could change in future depending on any specific future proposals or need.
Solution D to address Manchester and Pennines resilience avoids potential issues raised on alternative solutions (supply options).
Environmental appraisal, natural capital and catchment management
We should continue to focus on developing options that have the least impact upon the environment and where possible, develop enhancements and further protections to the natural environment
This principle was at the core of our approach to the draft plan. All of our options have had environmental factors taken into consideration through the screening process. The screening process has been outlined in Section 5.4 and we have completed environmental assessments that informed our options appraisal process. In particular, the SEA accounts for potential benefits or enhancements that an option could have, as well as avoiding negative impacts. Our plan also proposes further enhanced leakage reductions, which bring additional environmental benefits.
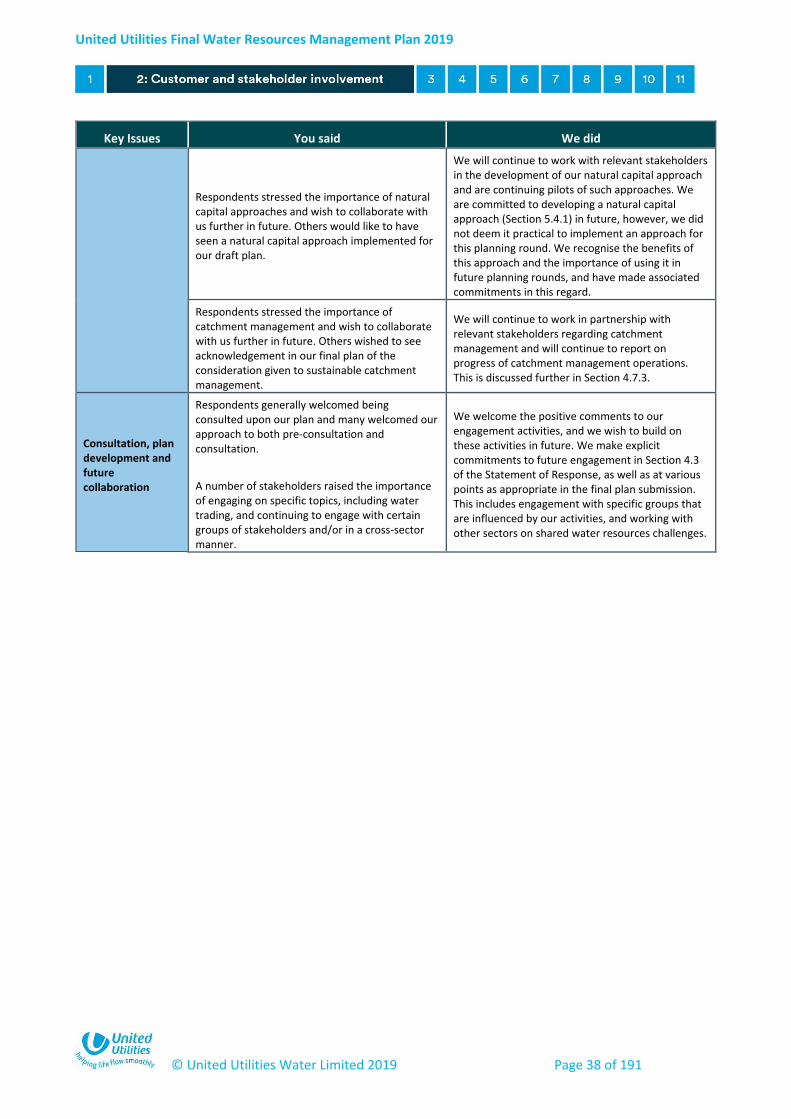
United Utilities Final Water Resources Management Plan 2019
© United Utilities Water Limited 2019 Page 38 of 191
Key Issues You said We did
Respondents stressed the importance of natural capital approaches and wish to collaborate with us further in future. Others would like to have seen a natural capital approach implemented for our draft plan.
We will continue to work with relevant stakeholders in the development of our natural capital approach and are continuing pilots of such approaches. We are committed to developing a natural capital approach (Section 5.4.1) in future, however, we did not deem it practical to implement an approach for this planning round. We recognise the benefits of this approach and the importance of using it in future planning rounds, and have made associated commitments in this regard.
Respondents stressed the importance of catchment management and wish to collaborate with us further in future. Others wished to see acknowledgement in our final plan of the consideration given to sustainable catchment management.
We will continue to work in partnership with relevant stakeholders regarding catchment management and will continue to report on progress of catchment management operations. This is discussed further in Section 4.7.3.
Consultation, plan development and future collaboration
Respondents generally welcomed being consulted upon our plan and many welcomed our approach to both pre-consultation and consultation.
A number of stakeholders raised the importance of engaging on specific topics, including water trading, and continuing to engage with certain groups of stakeholders and/or in a cross-sector manner.
We welcome the positive comments to our engagement activities, and we wish to build on these activities in future. We make explicit commitments to future engagement in Section 4.3 of the Statement of Response, as well as at various points as appropriate in the final plan submission. This includes engagement with specific groups that are influenced by our activities, and working with other sectors on shared water resources challenges.
United Utilities Final Water Resources Management Plan 2019
© United Utilities Water Limited 2019 Page 39 of 191
3 Our water supply system
3.1 Water supply in North West England
We currently supply water to a population of 7.1 million across Cumbria, Lancashire, Greater Manchester,
Merseyside, most of Cheshire and a small area of Derbyshire. We own and operate over 100 water supply
reservoirs, various river and stream intakes, as well as lake abstractions and numerous groundwater
sources. More than 90% of the water supplied by us comes from rivers and reservoirs, with the remainder
from groundwater. This contrasts with the
general trend in England, where on average
only 60% is supplied from rivers and
reservoirs. Abstracted water is treated at
water treatment works before being supplied
to customers through an extensive network
of large diameter trunk mains and water
mains. In a normal year we currently supply
around 1,730 Ml/d of drinking water, but we
would expect this to be higher in a dry year.
3.2 Our water resource zones
Our water resource zones have been
reviewed in accordance with the
Environment Agency’s ‘Guidance for ensuring
water resource zone integrity’ (2016) and
have been concluded to be ‘fit for purpose’.
In our Water Resources Management Plan
2015 we assessed four water resource zones,
and identified a future deficit in the West
What is a water resource
zone?
A water resource zone is an area within which
water sources can be shared effectively.
Customers within a resource zone should
experience broadly the same risk of supply failure
from a resource shortfall (i.e. dry weather or
drought). Dry weather or drought is a system
‘stress’.
In Section 4.7 our water supply resilience
assessment examines system shocks, which are
often short-term isolated incidents (for example,
a freeze-thaw event during winter or asset
failure). In such assessments, sub-zonal scales of
assessment are typically more relevant.
Key points
We supply water to over 7 million people in four water resource zones and reflect
the future completion of the Thirlmere Transfer scheme in this plan.
Currently, we have a few relatively small transfers of water between our area and
surrounding companies.
The assessment methods we are using align to the complexity of each resource zone
and the strategic questions they face.
Our representation of water resources management in this plan is consistent with
our Final Drought Plan 2018; this includes the outcomes of recent discussions with
stakeholders on the operation of our strategic pumped sources.
United Utilities Final Water Resources Management Plan 2019
© United Utilities Water Limited 2019 Page 40 of 191
Cumbria Resource Zone. The Thirlmere Transfer scheme was selected to meet the deficit by using some of
the surplus water available in our Integrated Resource Zone. We will build a new water treatment works
and a pipeline between West Cumbria and Thirlmere Reservoir, one of our largest sources. Once finished,
West Cumbria will be in one of the UK’s largest water resource zones. At the time of developing this final
plan, we expect the scheme to be completed by the end of March 2022.
Therefore, as a long-term 25-year strategic view, this plan now reflects the merging of the previous West
Cumbria and Integrated Resource Zones. We are now calling this the Strategic Resource Zone to draw
distinction with the previous zones. As well as the change in resource zone boundary, the name also
reflects the functionality of the zone, where key strategic sources are balanced to manage supply to
customers. In this plan, we also include a new resource zone for Barepot. This is geographically within the
Strategic Resource Zone, but has been delineated as a separate zone as it comprises a non-potable supply
to industrial customers at Barepot in West Cumbria. The zone is supplied by a surface water abstraction
from the River Derwent at Barepot, Workington. Whilst we have other non-potable or commercial supplies,
those at Barepot lack connectivity into an existing resource zone.
With the exception of Barepot, the only sources not supported directly or indirectly from the rest of the
regional supply system covered by the Strategic Resource Zone are in the far north of our region in the
Carlisle Resource Zone and the North Eden Resource Zone. Key details about our water resource zones are
included in Figure 9 below.
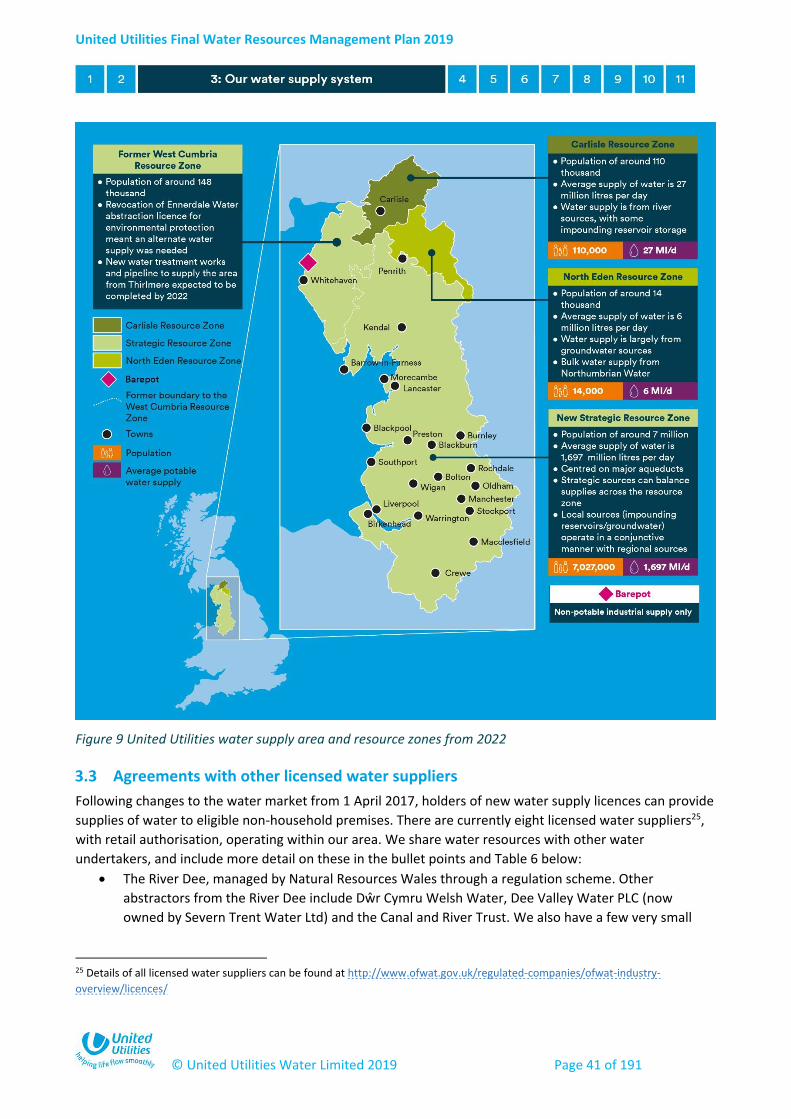
United Utilities Final Water Resources Management Plan 2019
© United Utilities Water Limited 2019 Page 41 of 191
Figure 9 United Utilities water supply area and resource zones from 2022
3.3 Agreements with other licensed water suppliers
Following changes to the water market from 1 April 2017, holders of new water supply licences can provide
supplies of water to eligible non-household premises. There are currently eight licensed water suppliers25,
with retail authorisation, operating within our area. We share water resources with other water
undertakers, and include more detail on these in the bullet points and Table 6 below:
The River Dee, managed by Natural Resources Wales through a regulation scheme. Other
abstractors from the River Dee include Dŵr Cymru Welsh Water, Dee Valley Water PLC (now
owned by Severn Trent Water Ltd) and the Canal and River Trust. We also have a few very small
25 Details of all licensed water suppliers can be found at http://www.ofwat.gov.uk/regulated-companies/ofwat-industry-
overview/licences/

United Utilities Final Water Resources Management Plan 2019
© United Utilities Water Limited 2019 Page 42 of 191
bulk supplies with Dee Valley Water PLC and Severn Trent Water Ltd, including imports and exports
from both companies;
Lake Vyrnwy is owned by Severn Trent Water Ltd, regulated by the Environment Agency with
Severn Trent Water to manage the River Severn regulation system. Other abstractors from the
River Severn include Severn Trent Water, South Staffordshire Water and Bristol Water;
Burnhope reservoir supplies Northumbrian Water Ltd, who also provide a small import of water
from this source into our supply area around Alston; and
Leep Water Networks Ltd (formerly Peel Water Networks Ltd) also operates as a water and
sewerage undertaker26 to the MediaCityUK development in Greater Manchester and the Liverpool
International Business Park.
Table 6 Summary of import and export arrangements with other companies
Water undertaker Resource
Zone Amount Information
Imports
Dee Valley Water PLC Strategic <0.1 Ml/d Crewe by Farndon
Northumbrian Water Ltd North Eden 1.3 Ml/d Supply from Burnhope reservoir
Severn Trent Water Ltd Strategic <0.1 Ml/d Mow Cop
Exports
Dee Valley Water PLC Strategic 1.2 Ml/d Gredington
Dŵr Cymru Welsh Water Strategic 28 Ml/d Raw water (Heronbridge)
Leep Water Networks Ltd
(formerly Peel Water
Networks Ltd)
Strategic 0.3-
0.7 Ml/d
The agreement is for us to supply up to 1.6 Ml/d, however current
supply is around 0.3 Ml/d, and we forecast this to increase to around
0.7 Ml/d across our planning horizon (MediaCityUK)
An additional agreement allows for us to supply up to 2.16Ml/d to
Liverpool International Business Park, however current supply is only
around 0.08Ml/d and this is forecast to remain at the same level
across our planning horizon (LIBP)
Our assumptions for both of Leep’s Resource Zones (MediaCityUK and
LIBP) are consistent with the forecasts in Leep’s own WRMP
Northumbrian Water Ltd Carlisle <0.1 Ml/d Reaygarth
Severn Trent Water Ltd Strategic <0.1 Ml/d Biddulph, Congleton and Kidsgrove
Severn Trent Water Ltd Strategic ~0.3 Ml/d Llanforda (previously, used by exception for contingency purposes)
26 Via New Appointments and Variations (NAVs), which is where one company replaces another as the appointee for a specific
geographic area. At the time of writing, there are three NAVs operating in our region, including Leep Water Networks Ltd (formerly
Peel Water Networks Ltd) at the MediaCityUK development in Greater Manchester and the Liverpool International Business Park.
The other two NAVs are for wastewater services only. There is a register of all NAVs on the Ofwat website here:
https://www.ofwat.gov.uk/publication/register-of-new-appointments-and-variations-granted-to-date/
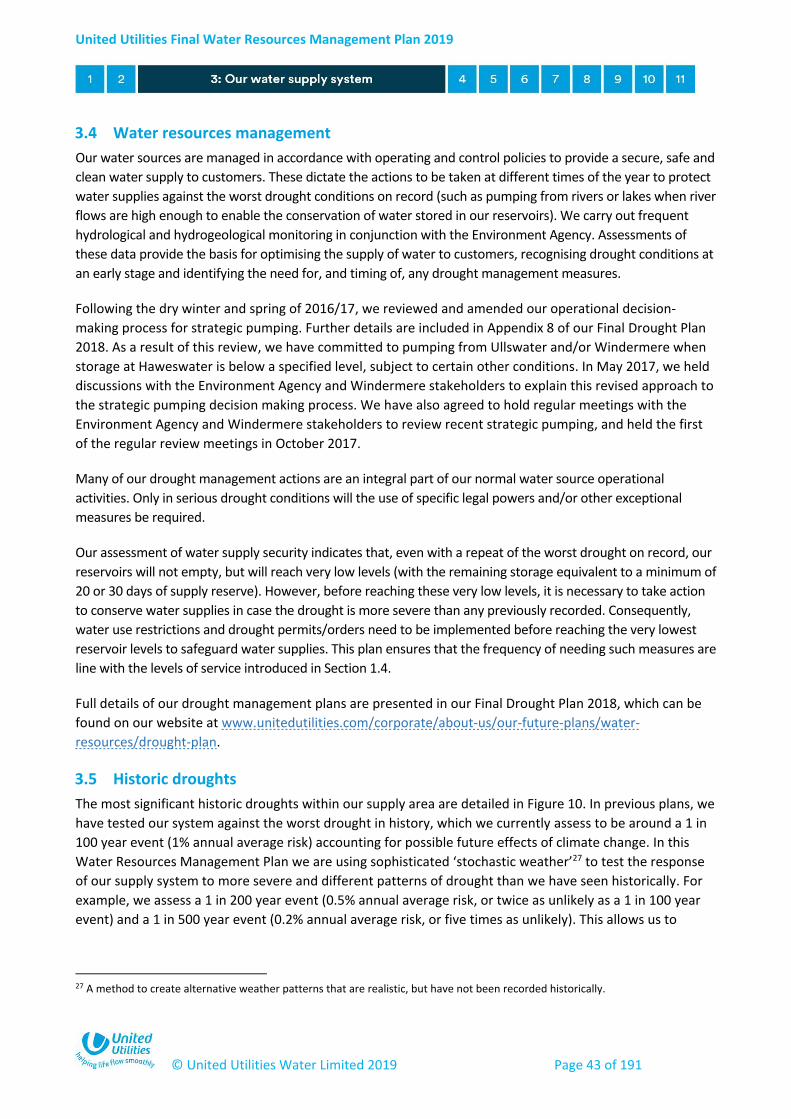
United Utilities Final Water Resources Management Plan 2019
© United Utilities Water Limited 2019 Page 43 of 191
3.4 Water resources management
Our water sources are managed in accordance with operating and control policies to provide a secure, safe and
clean water supply to customers. These dictate the actions to be taken at different times of the year to protect
water supplies against the worst drought conditions on record (such as pumping from rivers or lakes when river
flows are high enough to enable the conservation of water stored in our reservoirs). We carry out frequent
hydrological and hydrogeological monitoring in conjunction with the Environment Agency. Assessments of
these data provide the basis for optimising the supply of water to customers, recognising drought conditions at
an early stage and identifying the need for, and timing of, any drought management measures.
Following the dry winter and spring of 2016/17, we reviewed and amended our operational decision-
making process for strategic pumping. Further details are included in Appendix 8 of our Final Drought Plan
2018. As a result of this review, we have committed to pumping from Ullswater and/or Windermere when
storage at Haweswater is below a specified level, subject to certain other conditions. In May 2017, we held
discussions with the Environment Agency and Windermere stakeholders to explain this revised approach to
the strategic pumping decision making process. We have also agreed to hold regular meetings with the
Environment Agency and Windermere stakeholders to review recent strategic pumping, and held the first
of the regular review meetings in October 2017.
Many of our drought management actions are an integral part of our normal water source operational
activities. Only in serious drought conditions will the use of specific legal powers and/or other exceptional
measures be required.
Our assessment of water supply security indicates that, even with a repeat of the worst drought on record, our
reservoirs will not empty, but will reach very low levels (with the remaining storage equivalent to a minimum of
20 or 30 days of supply reserve). However, before reaching these very low levels, it is necessary to take action
to conserve water supplies in case the drought is more severe than any previously recorded. Consequently,
water use restrictions and drought permits/orders need to be implemented before reaching the very lowest
reservoir levels to safeguard water supplies. This plan ensures that the frequency of needing such measures are
line with the levels of service introduced in Section 1.4.
Full details of our drought management plans are presented in our Final Drought Plan 2018, which can be
found on our website at www.unitedutilities.com/corporate/about-us/our-future-plans/water-
resources/drought-plan.
3.5 Historic droughts
The most significant historic droughts within our supply area are detailed in Figure 10. In previous plans, we
have tested our system against the worst drought in history, which we currently assess to be around a 1 in
100 year event (1% annual average risk) accounting for possible future effects of climate change. In this
Water Resources Management Plan we are using sophisticated ‘stochastic weather’27 to test the response
of our supply system to more severe and different patterns of drought than we have seen historically. For
example, we assess a 1 in 200 year event (0.5% annual average risk, or twice as unlikely as a 1 in 100 year
event) and a 1 in 500 year event (0.2% annual average risk, or five times as unlikely). This allows us to
27 A method to create alternative weather patterns that are realistic, but have not been recorded historically.
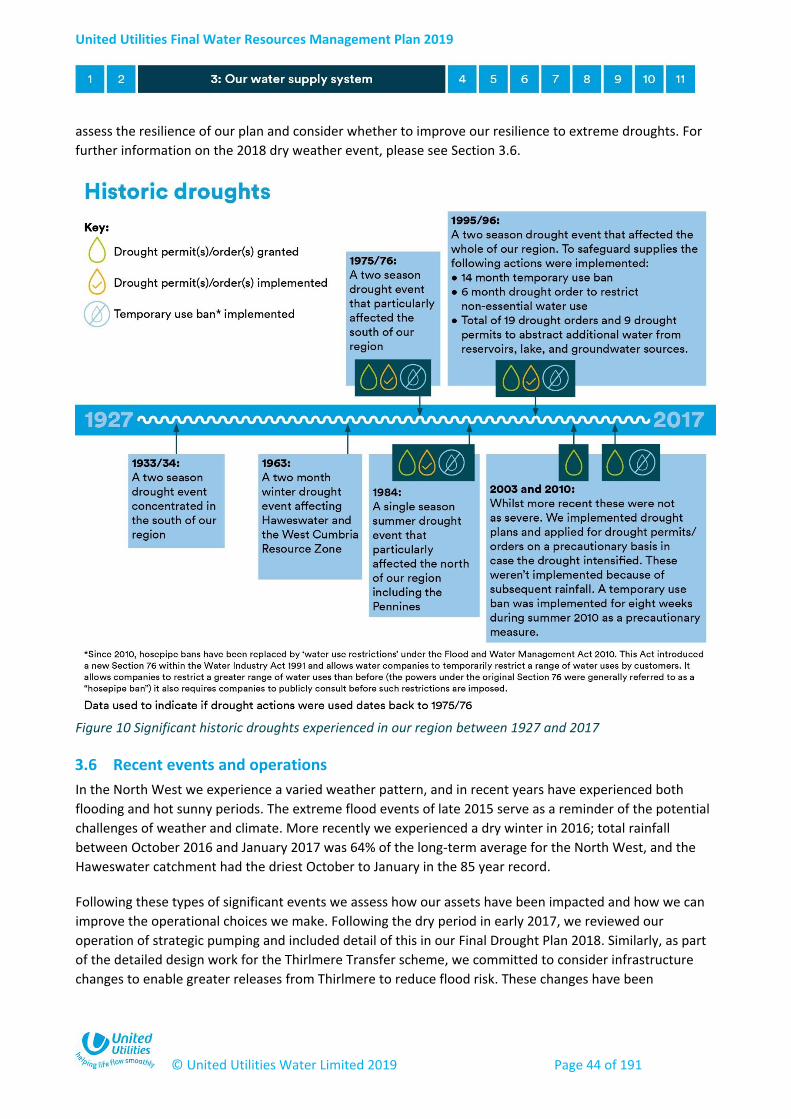
United Utilities Final Water Resources Management Plan 2019
© United Utilities Water Limited 2019 Page 44 of 191
assess the resilience of our plan and consider whether to improve our resilience to extreme droughts. For
further information on the 2018 dry weather event, please see Section 3.6.
Figure 10 Significant historic droughts experienced in our region between 1927 and 2017
3.6 Recent events and operations
In the North West we experience a varied weather pattern, and in recent years have experienced both
flooding and hot sunny periods. The extreme flood events of late 2015 serve as a reminder of the potential
challenges of weather and climate. More recently we experienced a dry winter in 2016; total rainfall
between October 2016 and January 2017 was 64% of the long-term average for the North West, and the
Haweswater catchment had the driest October to January in the 85 year record.
Following these types of significant events we assess how our assets have been impacted and how we can
improve the operational choices we make. Following the dry period in early 2017, we reviewed our
operation of strategic pumping and included detail of this in our Final Drought Plan 2018. Similarly, as part
of the detailed design work for the Thirlmere Transfer scheme, we committed to consider infrastructure
changes to enable greater releases from Thirlmere to reduce flood risk. These changes have been

United Utilities Final Water Resources Management Plan 2019
© United Utilities Water Limited 2019 Page 45 of 191
accounted for in this Water Resources Management Plan. Detailed environmental studies associated with
these changes are being delivered as part of the Thirlmere project.
During the winter of 2017/18 we experienced a significant freeze-thaw event that resulted in high peak
week demands being observed. Several other companies were also affected by this event28. In our area,
this event was successfully managed and this further validated the conclusions of the freeze-thaw
assessment completed in this plan that our system is relatively resilient to freeze-thaw events. This is
explored further in the Section 4.7.5, and in more detail within our Final WRMP19 Technical Report - Water
supply resilience.
Subsequent to this, during summer 2018 our region was affected by a prolonged period of hot, dry weather
and this led to an exceptional increase in demand of almost half a billion litres per day. This period of hot,
dry weather was experienced across England, with the Met Office reporting that the year was the warmest
summer on record based on mean temperature recorded on 31 August. Met Office analysis of our
distribution input has identified that the weather-related component of demand in 2018/19 was the
highest in the last 59 years, and that 2018/19 should be categorised as a “dry year”, broadly equivalent to
our design “dry year” of 1995/96. However, due to the resilience of our system and a co-ordinated
response during this event, we were able to avoid introducing water restrictions for customers during the
year. We have reviewed the demand forecasts and modelled seasonal profiles in the context of this long-
term Water Resources Management Plan by comparison; based on the data available to date, the scale of
the observed summer peaks is comparable to that included in this plan.
We are working with Defra, the Environment Agency, Ofwat and other water companies to determine what
opportunities may exist for future use of reservoirs for flood mitigation. There are a number of potentially
conflicting issues which must be considered regarding reservoir use in such circumstances, including
impacts on the supply demand balance and Water Framework Directive implications. Any potential flood
mitigation projects will only progress if all our statutory obligations can be fully met. We will seek to report
on developments in this area as part of the Annual Water Resources Management Plan review process. We
have provided further narrative on this theme, in response to the consultation, in the Statement of
Response.
3.7 Choosing methods appropriate to the risks
The UKWIR decision making framework (UKWIR, 2016) includes a stage called ‘problem characterisation’,
which helps a water company to identify the scale and complexity of their plan, as well as their vulnerability
to strategic issues, risks and uncertainties. The benefit of this stage is to guide us to select the most
appropriate decision making tools for this Water Resources Management Plan. We carried out an initial
problem characterisation for each resource zone, using information from our 2015 plan such as the outputs
of the climate change vulnerability assessments. For the Strategic Resource Zone this assumes the
completion of the Thirlmere Transfer scheme. A summary of the results is presented in Figure 11.
28 Out in the cold: Water companies' response to the 'Beast from the East' - https://www.ofwat.gov.uk/publication/cold-water-
companies-response-beast-east/
United Utilities Final Water Resources Management Plan 2019
© United Utilities Water Limited 2019 Page 46 of 191
Figure 11 Summary problem characterisation scores
This exercise led to a focus on drought resilience and climate change, driven by the nature of the Strategic
Resource Zone29 and these uncertainties being critical to the long-term direction of water resources.
The outcome from the problem characterisation allowed us to identify where new and innovative
approaches would add value to the planning process, based on the scale and complexity of the future
challenges. Further detail on these methods are detailed in Section 7. This exercise concluded that:
Barepot, Carlisle and North Eden Resource Zones have low strategic needs which is consistent with
the lower complexity of these zones. Focus in this Water Resources Management Plan is on the
traditional core planning methods.
The Strategic Resource Zone is more complex due to the non-linear, conjunctive use nature of the
zone. In a ‘traditional’ plan sense it has a low complexity score, but when considering a water
trading configuration30 it is more complex, lending itself to simulation type methods to explore
different potential futures. Therefore the Scenario Simulation with Robust Decision Making (RDM)
principles have been selected to explore risk and determine the best value long-term plan.
3.8 The national context
In 2016 we worked with the other UK water companies to assess the long term water resources context for
England and Wales. The resulting Water UK publication ‘Water resources long-term planning framework
(2015-2065)’ is available on the Water UK website31.
29 This zone is complex both in terms of its scale and number of assets. In particular, it is complex because of how it responds to
weather events, because the zone is large and therefore big differences in weather patterns and timing might occur across the
zone. This leads the system response to be what is known as ‘non-linear’. 30 This relates to potential future water trading (Section 6.5). The current size of bulk imports and exports between neighbouring
companies is relatively small (see Section 3.3). 31 www.water.org.uk/water-resources-long-term-planning-framework
United Utilities Final Water Resources Management Plan 2019
© United Utilities Water Limited 2019 Page 47 of 191
The report found that there is a significant current risk of severe drought across many regions in the South
and East of England. It also found that the least resilient and most water stressed areas in the South and
East are also subject to the most population growth and climate change risk. The need for changes to
current abstractions to preserve the natural environment add to these pressures, again particularly
affecting the South and East. More Northern and Western regions were found to have generally higher
levels of resilience.
The report recommends that a minimum standard of drought resilience is adopted. Consistent with this,
the Environment Agency Water Resources Planning Guideline has adopted a 1 in 200 year reference level of
service (0.5% annual average risk) for measures such as standpipes and rota cuts. To meet such standards
many companies will need to consider a mix of interventions including extensive demand management,
supply enhancement, and water transfers. The value customers place on avoiding such severe restrictions
and the affordability of such interventions will be key considerations.
The report also says there should be a national level ‘adaptive plan’. Such a plan would identify the key
‘trigger points’ that will determine which set of investments and policy interventions are needed,
depending on how risks materialise in the future. In this plan, companies will need new ways of working
across their boundaries, with a wider range of stakeholders, to optimise the use of nationally scarce water
resources, particularly through inter-regional water transfers.
In this context, we would expect to have less of a need for interventions to maintain resilience of supplies,
and perhaps be able to offer higher resilience standard than some other water companies. Indeed the
Water UK report considers our region to be a potential exporter of water, having potential to contribute to
the national need for water resources.
Water UK’s report is an early high-level assessment. We’ve undertaken further work in preparing this
Water Resources Management Plan, and by working with others as they have prepared their plans. The
national report has set some important context for those plans. It also indicates that after publication of
the plans there will continue to be further developments through the ‘adaptive planning’ approach. Water
UK will carry out further work on the extent to which companies have been able to take account of this
national framework in their plans.
3.8.1 Regional planning
Regional planning groups have a key role to play in supporting both the company Water Resources
Management Plans and planning at a national scale. Given the scale of some of the water resources
challenges across the country, such regional planning groups are important to promote collaboration
between organisations on water resources planning, and to support the national planning agenda.
In 2017, a Water Resources North group was inaugurated to further promote collaborative working on
water resources between organisations in the North of England in future. This builds on the progress made
by organisations such as Water Resources South East (WRSE) and Water Resources East (WRE). We have
actively participated in three meetings to date, with the key focus being to explore the role of the group in
future to support subsequent cycles of the water resources planning process. It has also proven useful to
discuss respective draft Water Resources Management Plan 2019 positions between the constituent
companies to promote alignment of final plans. Whilst future group activities are still being defined,
informed by the needs and outcomes from the 2019 planning round, it is envisaged that the group will play

United Utilities Final Water Resources Management Plan 2019
© United Utilities Water Limited 2019 Page 48 of 191
a key role in consolidating knowledge and seeking future opportunities for Water Resources Management
Plan 2024, particular around water trading and transfers of water.
At a meeting with Defra, the Environment Agency and some other water companies in July 2018, we
proposed the establishment of another new regional planning group: Water Resources West. Recognising
the pressure on water resources and the requirement to meet the needs of an ever growing population and
economy, we recognise the potential for large scale water transfer from North to South through river
systems in the West of England and Wales to play a role in meeting this need. We are proposing to set up
Water Resources West to explore options and facilitate development of a long term strategy and plan. The
purpose of the group would be to ensure strategic oversight and co-ordination of water resources matters
across the River Severn catchments. Introducing a group for this part of the UK fills a gap in the coverage of
existing regional groups, but also has a distinct advantage since the area represents a natural corridor for
water transfers. This means there are opportunities to improve resilience and efficiency through better
coordination.
The primary objectives of Water Resources West would be to:
1. Facilitate a co-ordinated approach across all abstractors from these catchments to water trading
that may contribute to enhancing national water resource resilience.
2. Secure the long-term resilience of water supplies for all current abstractors and potential future
abstractors from this catchment.
We have also continued to participate in relevant catchment planning groups such as the River Severn
Working Group and the River Dee Consultative Committee.
3.8.2 System operators
Due to the complexities of multiple trading partners requiring operational interactions and financial
transactions under a national water trade, there may be a role for a form of system operator for water
trades between the Severn and Thames catchments. This could play a role in mitigating risks around
security of supply, losses and environmental impact of the transfer. In November 2017, we published a
paper on system operation which was developed jointly with Severn Trent and Thames Water32. The paper
sets out a number of different roles that a system operator could take to inform future development of
water transfers and trading. In the strategic planning stages of the project lifecycle (of water resources
options), the aforementioned regional planning groups, with strong governance, may be thought of as a
form of system operator.
3.8.3 National Infrastructure Commission (NIC) report
In April 2018 the National Infrastructure Commission (NIC) published a report entitled ‘Preparing for a drier
future: England’s water infrastructure needs’33. This set out a range of measures which the Commission
believes are required across the industry to ensure future resilience to drought and manage the UK’s water
32 What role for System Operators in the water sector? November 2017 https://www.unitedutilities.com/globalassets/z_corporate-
site/about-us-pdfs/looking-to-the-future/what-role-for-system-operators-in-the-water-sector-november-2017.pdf
33 https://www.nic.org.uk/publications/preparing-for-a-drier-future-englands-water-infrastructure-needs/

United Utilities Final Water Resources Management Plan 2019
© United Utilities Water Limited 2019 Page 49 of 191
supplies more effectively. In simple terms, the recommendations outline the importance of a twin-track
approach to meet future needs, both through increasing supply, including promoting a national water
network, and reducing demand, including an objective for the water industry to halve leakage by 2050. Our
Water Resources Management Plan contributes to the Commission’s recommendations in a number of
ways. In particular, our plan has strong focus on demand management, including significant long-term
leakage reductions. This improves the supply-demand position in the long-term, and improves resilience to
future drought. Also, our proactive approach to water trading complements and contributes to this agenda
nationally.
United Utilities Final Water Resources Management Plan 2019
© United Utilities Water Limited 2019 Page 50 of 191
4 Our baseline position
4.1 Supply-demand balance concept
This section of the plan sets out our assessment of potential changes in our region for the availability of
supply of water (water available for use), the future demand for water (dry year demand), and target
headroom (a calculated allowance for uncertainties). Together these three components comprise the
supply-demand balance, which determines if there is sufficient supply to meet demand in each of our
resource zones. The supply-demand balance concept is illustrated in Figure 12.
Key points
Ensuring a reliable supply to meet future demand is a key customer priority. This
section outlines our forecasts of available supply and future demand for the 25-year
period to 2045.
We account for uncertainty in our forecasts by using ‘target headroom’, with the
choice of percentile reflecting both the degree of confidence in data and potential
risk.
Our demand forecast shows reductions in demand over time even accounting for
future economic and population growth, due to increasing water efficiency and
metering.
Over the planning horizon, supply is forecast to decrease slightly due to the impacts
of climate change.
Our draft plan baseline supply-demand position showed a surplus in all of our
resource zones. The baseline in the final plan shows a very small deficit at the end of
the planning horizon in the Strategic Resource Zone, which is more than addressed
through our proposed leakage reductions.
We have also tested our water supply system to more severe, and different patterns
of drought, and we show a good level of resilience to these events.
Our plan also looks at how resilient our water supply system is to a host of non-
drought hazards (including flooding, freeze-thaw, contamination, asset failure and
power failure), and as a result we are planning for improved resilience across the
next 25 years.

United Utilities Final Water Resources Management Plan 2019
© United Utilities Water Limited 2019 Page 51 of 191
Figure 12 The supply-demand balance concept and outcomes
The surplus or deficit outcome from the supply demand balance is traditionally how a Water Resources
Management Plan has been defined. However, this doesn’t always show the full picture, for example which
assets might be vulnerable to particular non-drought hazard events. The supply-demand balance focuses
on a dry year, however in this plan we also cover wider considerations around risk and resilience (see
Section 4.7).
The step change improvement in planning methods helps us to move beyond the traditional supply-
demand balance view, to include a better appreciation of water resources risk, value, and performance. We
have used simulations and defined metrics (that we introduce in Section 7) to help determine what is the
best-value plan for customers in the long term. We will also ensure that our future plans do not result in
any deterioration of drinking water quality. This alternative view is crucial in helping us to understand how
our system responds to different scenarios, where there are areas of resilience or vulnerability, and drive
the best choices for future investment.
4.2 Baseline demand management
This section provides a high level summary of our baseline position for leakage management, water
efficiency and customer metering. We have included more detail of the methods and results from our
assessments documented within our Final WRMP19 Technical Report - Demand for water.
Our ‘baseline’ forecast indicates what would happen if we didn’t take any new demand actions or
implement any further changes to our current strategies, policies or existing operations, as appropriate.
This enables us to assess a number of strategic choices which include different levels of future demand
management actions and consideration of further enhancements. The strategic choices and alternative
plans are discussed in more detail in Sections 6 and 7, and take into account consultation feedback.
4.2.1 Importance of demand management
Demand management is a key component of our strategy to balance supply and demand. We have
significantly reduced leakage since 1996 to help achieve and maintain a high standard of water supply

United Utilities Final Water Resources Management Plan 2019
© United Utilities Water Limited 2019 Page 52 of 191
reliability. Water efficiency promotion has been significantly enhanced since 201034 and overall water
demand is around its lowest levels for the last 25 years.
We know that reducing both demand and leakage is an important issue for customers, stakeholders and
regulators. For example, through our leakage survey customer panels, leakage reduction was ranked just
below ‘providing safe, clean drinking water’ and ‘providing a reliable water/wastewater service’ and 93% of
customers think that we should do more to reduce leakage. More detail on our customer research is
included in the Final WRMP19 Technical Report - Customer and stakeholder engagement, and this
information has helped to inform our strategic choices in leakage (Section 6.2).
In the guiding principles, Ofwat, the Environment Agency and Defra have strongly encouraged water
companies to achieve further reductions in demand through increased efficiency and innovation. We
explore this further as part of our strategic choices in Section 6.
4.2.2 Leakage management
Leakage management contributes to the overall
reduction in demand and plays a key role in our
management of water resources.
We have met or exceeded our regulatory leakage
target for over 10 years, despite experiencing
two severe winters in 2009/10 and 2010/11. This
has been achieved by carrying out an extensive
range of leakage control actions at significant
cost. We continually strive to improve and
ensure that we are operating as efficiently and
effectively as possible. This means that we have
managed to achieve steady reductions in leakage
over the past few years and our lowest ever
leakage in 2016/17.
Table 7 shows our leakage performance since 2011/12 and the three-year average used to determine the
baseline for this plan. At 448.2 Ml/d this is 14.5 Ml/d below the target set in our Water Resources
Management Plan 2015. We have included this as the starting point to any strategic choice around
potential for further leakage reduction (Section 6.2) beyond this baseline level.
34 The step change since 2010 is associated with the regulatory targets for water efficiency that were introduced by Ofwat in AMP5.
What is leakage?
In the UK, leakage is defined as loss of water
from any point downstream of a water
treatment works, up to a customer’s property.
It includes water lost from connections to
properties (communication pipes) and the
associated supply pipes owned by customers,
known as supply pipe leakage (see Figure 13).
Levels of leakage can be affected by weather
and in particular cold winters, which are
associated with freeze-thaw events.

United Utilities Final Water Resources Management Plan 2019
© United Utilities Water Limited 2019 Page 53 of 191
Figure 13 Water lost from customer owned supply pipe is included in leakage numbers
Table 7 Annual leakage performance since 2011/12
2011/12 2012/13 2013/14 2014/15 2015/16 2016/17 2017/18
Total leakage
(Ml/d)35 453.0 457.4 451.9 453.6 451.9 439.2 453.5
The target from our 2015 Water Resources Management Plan for the 2015-2020 period was flat through
the period, however, weather has a strong influence, resulting in variation in annual outturn performance.
During the winter of 2017/18 we experienced more severe weather than had been observed for a number
of years. This winter contained several freeze-thaw events, with the most severe in March 2018. It is for
this reason that taking a single year as baseline is considered inappropriate and some of these impacts
need to be averaged or normalised.
In our draft Water Resources Management Plan, we proposed the three year average of 2014/15, 2015/16
and 2016/17, giving 448.24 Ml/d. By taking the average of 2015/16, 2016/17 and 2017/18, the three year
average is almost the same at 448.20 Ml/d.
Further justification to this approach is through normalisation of the 2017/18 leakage profile. The later
winter freeze-thaw event followed what had been a relatively normal winter until late February, with some
freeze-thaw events from December. It would normally be expected from late February that leakage levels
would be recovered and gradually reduce through March and April back to the starting position. Removal
of the March 2018 freeze-thaw peak with a reduction back to the starting point for the year, effectively
normalising the profile, would have reduced leakage for 2017/18 from 453.5 Ml/d to 448.7 Ml/d. This
further supports that the baseline derived through the three year average is an appropriate starting
position.
35 There is no potable network for Barepot Resource Zone so the total leakage is based on the sum of our Strategic, Carlisle and
North Eden Resource Zones. The historic West Cumbria Resource Zone is included within the Strategic Resource Zone.

United Utilities Final Water Resources Management Plan 2019
© United Utilities Water Limited 2019 Page 54 of 191
In order to realise this baseline leakage level we have committed significant operational and capital
resources to achieve this through:
Maintenance of our monitoring equipment which identify leaks within district metered areas;
Widespread pressure management to reduce the breakout and flow rate of leaks;
Good quality data and continual review of our leakage management and information systems;
Efficient leakage detection and repair using the latest technologies;
Replacement and refurbishment of poor performing water mains;
Providing free supply pipe repairs for domestic customers; and
Improving customer and community awareness (Leakline campaigns).
Leakage baseline
For our baseline demand forecast we have assumed a flat leakage target of 448.2 Ml/d. In
our future plan we also explore, and plan for additional leakage reductions beyond this
baseline level. This is detailed further within Section 6.2.
United Utilities Final Water Resources Management Plan 2019
© United Utilities Water Limited 2019 Page 55 of 191
4.2.3 Water efficiency
As a water company we have a statutory duty to promote the efficient use of water as required by the
Environment Act 1995 and the Water Industry Act 1991. We also recognise the important contribution
water efficiency actions have in achieving and maintaining an adequate and sustainable supply-demand
balance. This section contains a high-level description of our current water efficiency policies and actions.
Although no mandatory water efficiency targets have been imposed by Ofwat since 2015/16, in the
demand forecast from our Water Resources Management Plan 2015 we committed to continue to achieve,
as a minimum, a continued annual saving of 1 litre per property per day through the planning horizon36. It
should be noted that although the target savings remain at the same level as our previous Water Resources
Management Plan, water efficiency savings become progressively harder to achieve, so we need to
continually innovate and adapt with our approach in this area (we further explain how this level is
stretching within Section 3.3 of our Statement of Response, and in Section 2 of Final WRMP19 Technical
Report - Demand for water). This remains in place for the baseline demand forecast of this plan.
We have a number of policies that impact directly on the water efficient behaviour of customers. These
include policies related to water efficiency, supply pipe repairs and replacement, sustainability and carbon
emissions, and a Free Meter Option scheme.
Building on previous activities we continue to:
Supply free, easy to install water efficiency devices which can be ordered via agents, online or picked up at some of the events we attend;
Run our education programme for primary schools across the North West, which includes topics such as the water cycle, water safety, and water efficiency; and
Carry out free visits to customers’ homes to fit free water efficiency devices.
These are summarised along with some of our other water efficiency activities in Figure 14 on the next page.
We are mindful that in order to maintain the long-term forecast we need to keep our approach fresh. We
are constantly looking for ways to enhance our offering to customers through research and partnership
working, and we have undertaken customer research to understand the benefits, barriers and motivations
to desired behaviours and willingness to act to achieve greater water efficiency. The results of the research
will be used to better inform our approach and we will continue to drive behavioural change through our
customer messaging via community engagement; social media and digital presence; and more traditional
printed messaging on customer correspondence.
A more detailed description of our current and proposed future water efficiency activities is included in our
Final WRMP19 Technical Report - Demand for water.
36 This is separate from (and thus additional to) the benefits from increases in customer metering covered in the next section.
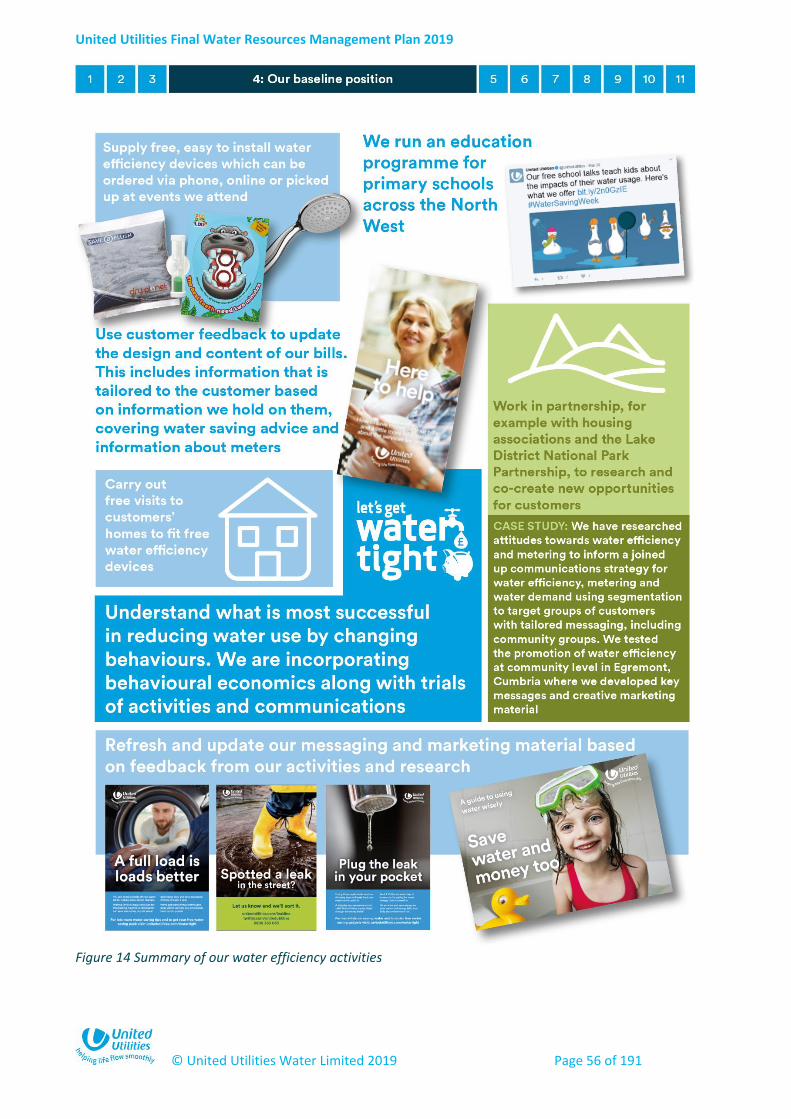
United Utilities Final Water Resources Management Plan 2019
© United Utilities Water Limited 2019 Page 56 of 191
Figure 14 Summary of our water efficiency activities

United Utilities Final Water Resources Management Plan 2019
© United Utilities Water Limited 2019 Page 57 of 191
4.2.4 Customer metering
Customers with a meter typically use less water than those without one. Metering is an opportunity for
customer engagement, which if sustained, can be useful for promoting water efficiency. Metered
customers are able to review the impact of their behaviour on their bills, and metering also gives us the
opportunity to use tariffs based on consumption. ‘Paying for what you use’ is a well-supported principle.
Approximately 40% of household customers are now on a water meter.
Compulsory metering of new premises was introduced in 1990, after the introduction of the community
charge37 and the cessation of applying rateable values. The Water Industry Act 1999 gives customers the
right to opt to have a water meter fitted for free and this is often referred to as the ‘Free Meter Option’.
Between 2020 and 2025 we plan to install a total of around 180,000 water meters. Figure 15 below shows
the meter penetration forecast until 2045, which is equivalent to around 75% meter penetration. This
forecast is lower than our 2015 plan, as in the intervening period the number of optants has dropped. We
have continued a series of promotional events to increase meter uptake, but despite this the overall uptake
is still lower than the previous five years. Working with Artesia Consulting, we have also updated the
models used to forecast the uptake of the Free Meter Option. This helps to ensure that we have a robust
view of the potential numbers of customers who would be willing to opt for a meter each year (Figure 15).
Figure 15 Meter penetration forecast
We continue to promote free meters with inserts in unmeasured bills and from time to time we send out
targeted mailshots to specific customer segments. We also make this visible on our website where we have
an online calculator to help customers decide if a meter is right for them. Additionally, we promote our
Free Meter Option in relevant publications such as All Together Now, a local newspaper targeted at the
older demographic which will include Priority Services customers. Customer research has indicated that
some customers worry that by switching to a meter they may end up paying more for their water. We are
37 The ‘Community Charge’ was the Government’s tax system introduced in 1990 (most people remember this as the Poll Tax). The
Community Charge replaced the Rates system when taxes where based on the Rateable Value of a property. When the Rates
system was abolished, and the Valuation Office no longer assessed Rateable Values, we introduced compulsory metering for new
premises (since there was no longer a rateable value to base charges on).
20%
30%
40%
50%
60%
70%
80%
2010 2015 2020 2025 2030 2035 2040 2045
Ho
use
ho
lds
me
teri
ng
pe
ne
trat
ion
(exc
l. v
oid
s)
Reported Forecast
United Utilities Final Water Resources Management Plan 2019
© United Utilities Water Limited 2019 Page 58 of 191
currently trialling a new metering proposition – the ‘lowest bill guarantee’ (formerly the ‘Price Promise’)
which has been developed to overcome this barrier.
The ‘lowest bill guarantee’ means that if a customer doesn’t save money once the meter is fitted, we will
cap the charge to their previous fixed annual bill. This happens automatically so there is no need for the
customer to contact us. The ‘lowest bill guarantee’ runs for two years from the meter installation, and
during this time customer can still choose to switch back to a fixed annual bill if they think they won’t
benefit from a metered charge. We’re also trialling the installation of water efficiency devices, along with
the ‘lowest bill guarantee’, when a meter is installed to further enhance customer experience, promote
water efficiency behaviour and the potential financial savings for customers. We requested participants for
the trial in specific areas between July and October 2017, and we will need to monitor and assess the data
for two years to determine whether the trial has been successful.
All water meter installations will be equipped with automated reading technology to allow greater
frequency of data collection and more efficient meter reading. This will also help us identify when
customers’ consumption changes or ‘leak alarms’ are triggered so we can proactively notify customers of
the changes. Automated readings can play a key role in leakage detection as the availability of frequent
data and alarms allows leaks to be detected earlier, rather than relying on when a bill is generated.
4.3 Customer’s future demand for water
This section describes how we forecast the future demand for water, before the benefit of any additional
metering, water efficiency or leakage programmes. We call this the ‘baseline’ demand forecast. As a result
of our demand management activities described in Section 4.2, this baseline demand forecast includes
assumptions of water efficiency savings of 1 litre per property per day and the meter penetration forecasts
shown in Figure 15. Further detail on the work underpinning this section can be found in our Final WRMP19
Technical Report - Demand for water.
Demand for water is made up of several key components which are illustrated in the bottom half of
Figure 16. This figure also shows how distribution input is a common measure between the water we
supply and demand for water, as well as where several other components of supply and demand are
accounted for.
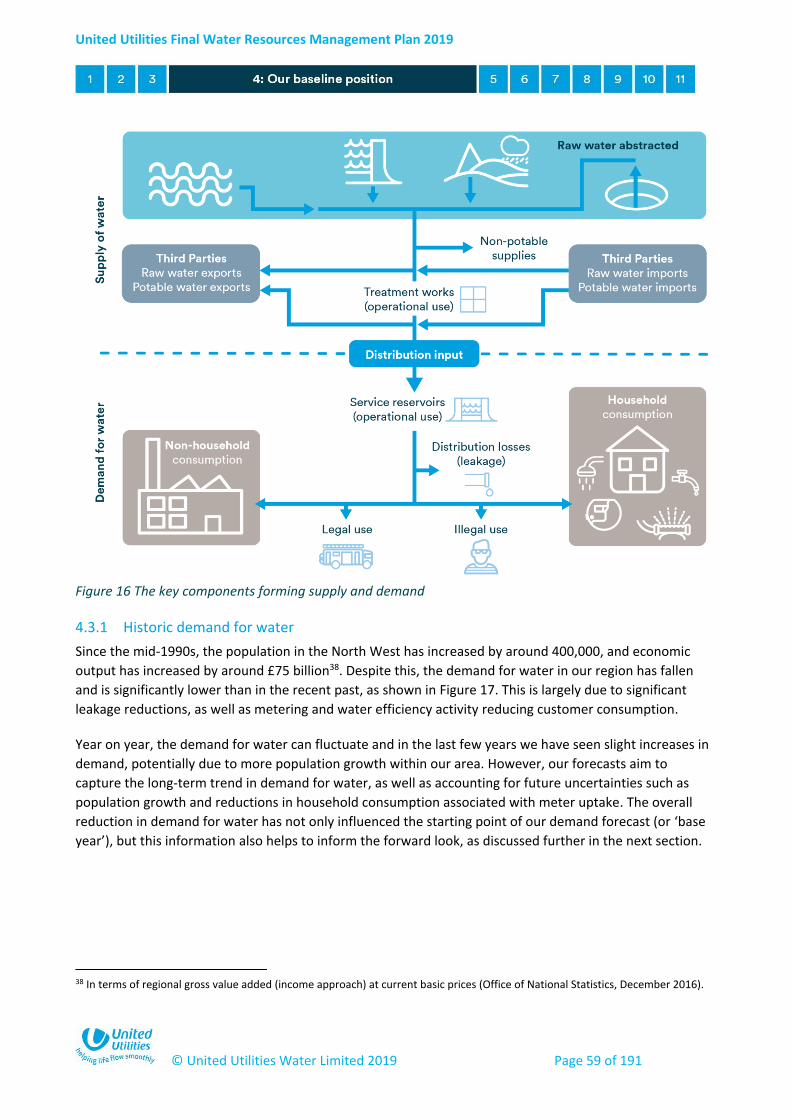
United Utilities Final Water Resources Management Plan 2019
© United Utilities Water Limited 2019 Page 59 of 191
Figure 16 The key components forming supply and demand
4.3.1 Historic demand for water
Since the mid-1990s, the population in the North West has increased by around 400,000, and economic
output has increased by around £75 billion38. Despite this, the demand for water in our region has fallen
and is significantly lower than in the recent past, as shown in Figure 17. This is largely due to significant
leakage reductions, as well as metering and water efficiency activity reducing customer consumption.
Year on year, the demand for water can fluctuate and in the last few years we have seen slight increases in
demand, potentially due to more population growth within our area. However, our forecasts aim to
capture the long-term trend in demand for water, as well as accounting for future uncertainties such as
population growth and reductions in household consumption associated with meter uptake. The overall
reduction in demand for water has not only influenced the starting point of our demand forecast (or ‘base
year’), but this information also helps to inform the forward look, as discussed further in the next section.
38 In terms of regional gross value added (income approach) at current basic prices (Office of National Statistics, December 2016).

United Utilities Final Water Resources Management Plan 2019
© United Utilities Water Limited 2019 Page 60 of 191
Figure 17 Demand for water by component over the last 25 years
4.3.2 Forecasting demand for water
By adhering to the guiding principles, as set out in the Environment Agency’s Water Resources Planning
Guideline, and following industry best practice, we aim for a robust forecast of demand for water over the
planning horizon39. There are several key factors that affect customer consumption:
Population (as well as property and occupancy) change;
Changes in water use behaviour and design standards;
Metering (this has been discussed in Section 4.3.5);
Increasing water efficiency and sustainable water use practices (this has been discussed in
Section 4.2);
Economic conditions; and
Climate change and weather patterns.
Explaining how these factors affect customer consumption is important when looking to forecast overall
demand for water. However, it is equally important to recognise the need to understand the sensitivity of
any forecast to the inherent uncertainty. We account for uncertainty in our target headroom assessment
which is detailed in Section 4.5.
4.3.3 Growth in population and household properties
Population growth has the potential to lead to higher total household customer consumption. To forecast
population change, we have considered the latest Office for National Statistics (ONS) projections40.
39 From our ‘base year’, which is 2015/16 for the draft Water Resources Management Plan to, at least, the year 2044/45. 40 At the time of writing, this was the 2014-based subnational population projections (published in May 2016), updated to use the
2015 mid-year population estimate (published in June 2016) as the ‘base year’.
0
250
500
750
1,000
1,250
1,500
1,750
2,000
2,250
2,500
1993 1995 1997 1999 2001 2003 2005 2007 2009 2011 2013 2015 2017
Me
galit
res
pe
r d
ay (
Ml/
d)
Household consumption Non-household consumption Total leakage Minor components
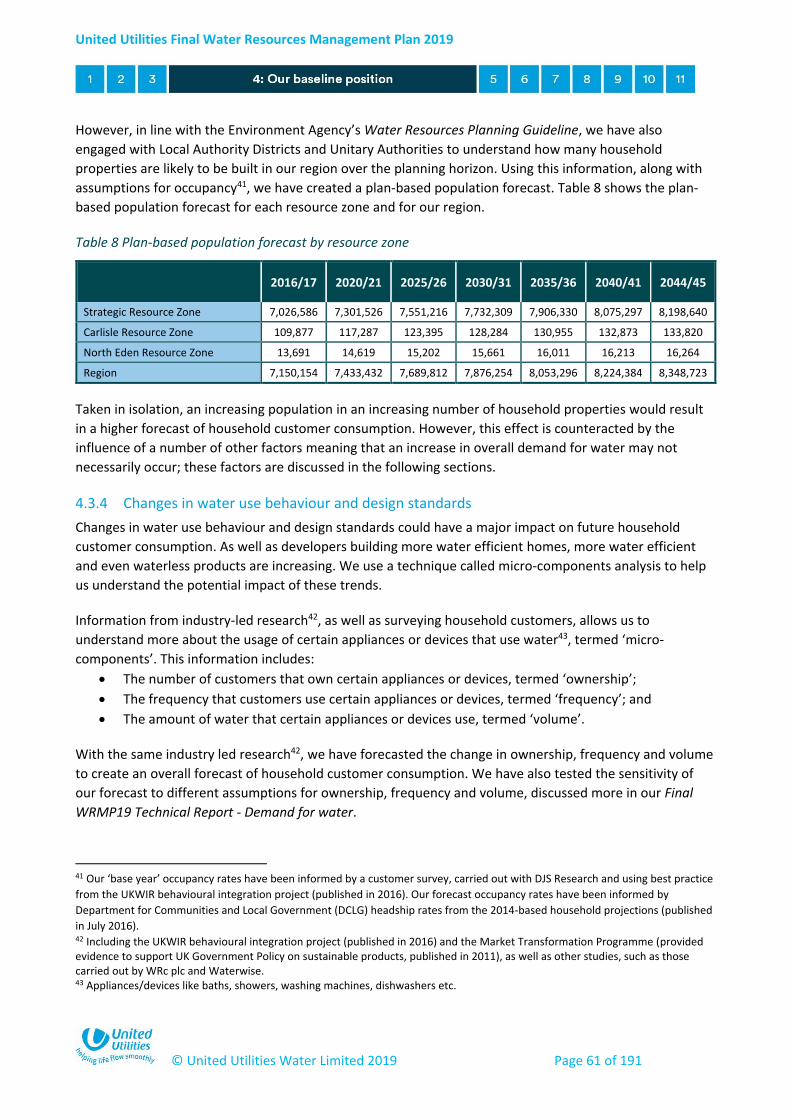
United Utilities Final Water Resources Management Plan 2019
© United Utilities Water Limited 2019 Page 61 of 191
However, in line with the Environment Agency’s Water Resources Planning Guideline, we have also
engaged with Local Authority Districts and Unitary Authorities to understand how many household
properties are likely to be built in our region over the planning horizon. Using this information, along with
assumptions for occupancy41, we have created a plan-based population forecast. Table 8 shows the plan-
based population forecast for each resource zone and for our region.
Table 8 Plan-based population forecast by resource zone
2016/17 2020/21 2025/26 2030/31 2035/36 2040/41 2044/45
Strategic Resource Zone 7,026,586 7,301,526 7,551,216 7,732,309 7,906,330 8,075,297 8,198,640
Carlisle Resource Zone 109,877 117,287 123,395 128,284 130,955 132,873 133,820
North Eden Resource Zone 13,691 14,619 15,202 15,661 16,011 16,213 16,264
Region 7,150,154 7,433,432 7,689,812 7,876,254 8,053,296 8,224,384 8,348,723
Taken in isolation, an increasing population in an increasing number of household properties would result
in a higher forecast of household customer consumption. However, this effect is counteracted by the
influence of a number of other factors meaning that an increase in overall demand for water may not
necessarily occur; these factors are discussed in the following sections.
4.3.4 Changes in water use behaviour and design standards
Changes in water use behaviour and design standards could have a major impact on future household
customer consumption. As well as developers building more water efficient homes, more water efficient
and even waterless products are increasing. We use a technique called micro-components analysis to help
us understand the potential impact of these trends.
Information from industry-led research42, as well as surveying household customers, allows us to
understand more about the usage of certain appliances or devices that use water43, termed ‘micro-
components’. This information includes:
The number of customers that own certain appliances or devices, termed ‘ownership’;
The frequency that customers use certain appliances or devices, termed ‘frequency’; and
The amount of water that certain appliances or devices use, termed ‘volume’.
With the same industry led research42, we have forecasted the change in ownership, frequency and volume
to create an overall forecast of household customer consumption. We have also tested the sensitivity of
our forecast to different assumptions for ownership, frequency and volume, discussed more in our Final
WRMP19 Technical Report - Demand for water.
41 Our ‘base year’ occupancy rates have been informed by a customer survey, carried out with DJS Research and using best practice
from the UKWIR behavioural integration project (published in 2016). Our forecast occupancy rates have been informed by
Department for Communities and Local Government (DCLG) headship rates from the 2014-based household projections (published
in July 2016). 42 Including the UKWIR behavioural integration project (published in 2016) and the Market Transformation Programme (provided evidence to support UK Government Policy on sustainable products, published in 2011), as well as other studies, such as those carried out by WRc plc and Waterwise. 43 Appliances/devices like baths, showers, washing machines, dishwashers etc.
United Utilities Final Water Resources Management Plan 2019
© United Utilities Water Limited 2019 Page 62 of 191
Water efficiency and sustainable water use improves over time. Information from a survey of household
customers and other industry-wide research helps inform our ‘baseline’ household water efficiency target.
This reflects the 1 litre per household property per day additional water saving each year from the
continuation of the activity set out in Section 4.2.3.
To detect any potential shifts in non-household customer water efficiency activity, we have engaged with
retailers around their water efficiency programmes. We have also used the econometric modelling,
discussed in Section 4.3.6, to pick up on trends in water efficiency and create water efficiency scenarios.
4.3.5 Metering
We recognise the important contribution of customer metering and tariff actions in reducing demand for
water. As discussed in Section 4.2.4, this plays a key role in our demand management plans. Over the
25 years we expect meter penetration to increase to around 75%, resulting in a reduction in household
consumption of 100 Ml/d. However, this assumption is very sensitive. For example, it may be that those
households most likely to save water have already switched to metering, with the net effect that further
meter penetration has a lower impact.
During the 1990s, we carried out an extensive programme of metering non-household properties,
wherever practicable. Therefore, the number of properties remaining unmeasured is small44, meaning this
is a relatively minor component of the non-household customer consumption forecast.
4.3.6 Economic conditions
Non-household customer consumption is closely linked to economic conditions. The EU referendum result
has created significant uncertainty in the outlook for the UK economy, both in the short and longer term. At
the same time, the relatively strong performance of the UK economy over the past four years signifies that
it has recovered ground lost during the 2007/08 recession more quickly than seemed likely a few years ago.
We use an economic model to find relationships between certain metrics, for example levels of
employment and non-household customer consumption for different industry sectors, such as construction
or fuel refining. This allows us to forecast the likely consumption for different industry sectors to derive an
overall non-household customer consumption forecast, which is shown in Figure 18.
44 At Regulatory Reporting 2016/17, there were 14,468 unmeasured non-household properties and 148,791 measured non-household properties.
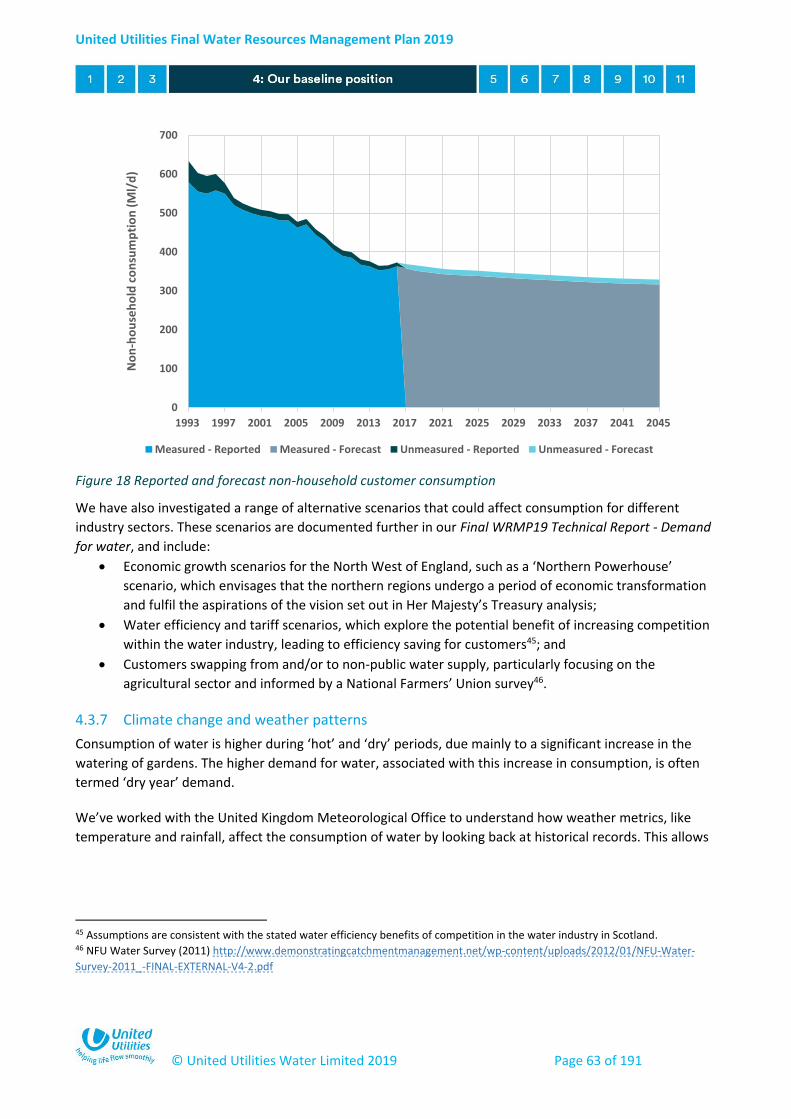
United Utilities Final Water Resources Management Plan 2019
© United Utilities Water Limited 2019 Page 63 of 191
Figure 18 Reported and forecast non-household customer consumption
We have also investigated a range of alternative scenarios that could affect consumption for different
industry sectors. These scenarios are documented further in our Final WRMP19 Technical Report - Demand
for water, and include:
Economic growth scenarios for the North West of England, such as a ‘Northern Powerhouse’
scenario, which envisages that the northern regions undergo a period of economic transformation
and fulfil the aspirations of the vision set out in Her Majesty’s Treasury analysis;
Water efficiency and tariff scenarios, which explore the potential benefit of increasing competition
within the water industry, leading to efficiency saving for customers45; and
Customers swapping from and/or to non-public water supply, particularly focusing on the
agricultural sector and informed by a National Farmers’ Union survey46.
4.3.7 Climate change and weather patterns
Consumption of water is higher during ‘hot’ and ‘dry’ periods, due mainly to a significant increase in the
watering of gardens. The higher demand for water, associated with this increase in consumption, is often
termed ‘dry year’ demand.
We’ve worked with the United Kingdom Meteorological Office to understand how weather metrics, like
temperature and rainfall, affect the consumption of water by looking back at historical records. This allows
45 Assumptions are consistent with the stated water efficiency benefits of competition in the water industry in Scotland. 46 NFU Water Survey (2011) http://www.demonstratingcatchmentmanagement.net/wp-content/uploads/2012/01/NFU-Water-
Survey-2011_-FINAL-EXTERNAL-V4-2.pdf
0
100
200
300
400
500
600
700
1993 1997 2001 2005 2009 2013 2017 2021 2025 2029 2033 2037 2041 2045
No
n-h
ou
seh
old
co
nsu
mp
tio
n (
Ml/
d)
Measured - Reported Measured - Forecast Unmeasured - Reported Unmeasured - Forecast
United Utilities Final Water Resources Management Plan 2019
© United Utilities Water Limited 2019 Page 64 of 191
us to understand the likely increase in demand for water in a dry year47 so that we can apply an uplift to
customer consumption to account for this.
A similar approach is taken to account for the potential impact of climate change on demand for water. The
dry year demand for water is further uplifted, based on the findings from industry research48.
In the Carlisle Resource Zone, water sources are ‘flashy’ and can go from full to their lowest level in a few
months. The time taken for this to happen is called the ‘critical period’ and the demand for water over this
period is known as critical period demand. As the critical period can coincide with the hottest and driest
months of the year, the uplift applied to demand is even higher than for the dry year demand and critical
period demand is presented separately in Table 9.
4.3.8 Our baseline forecast of demand for water
The methods and assumptions described above have been used to prepare baseline demand forecasts. The
central forecast of dry year demand for water, as well as the upper and lower forecast of dry year demand
for water, is presented in Figure 19. The upper and lower forecast of dry year demand for water are used to
inform our target headroom assessment which is detailed in Section 4.5. The central baseline demand
forecast for each resource zone, by component, is summarised in Table 9. As mentioned earlier, in the last
few years we have seen slight increases in demand and we are alert to the fact that this could be the start
of an upward trend. However, it is clear that there are significant uncertainties (detailed in Section 4.3.1)
which make accurate prediction of future demand difficult, as evidenced by the wide variance in the upper
and lower demand forecasts shown in Figure 19. This is a key reason for reviewing our Water Resources
Management Plan on a regular basis and we will continue to monitor demand for water, assessing it against
our demand forecast, as part of our annual review process.
47 Following the Environment Agency Advice Report on our Water Resources Management Plan 2015, as well as further discussions,
we have revised our design dry year from 1995/96 to the 95th percentile from a distribution showing how demand over the last 55
years has been impacted by weather. 48 The Impact of Climate Change on Water Demand UKWIR project (published in 2013), which is still the principal source of climate
change demand uplift information.
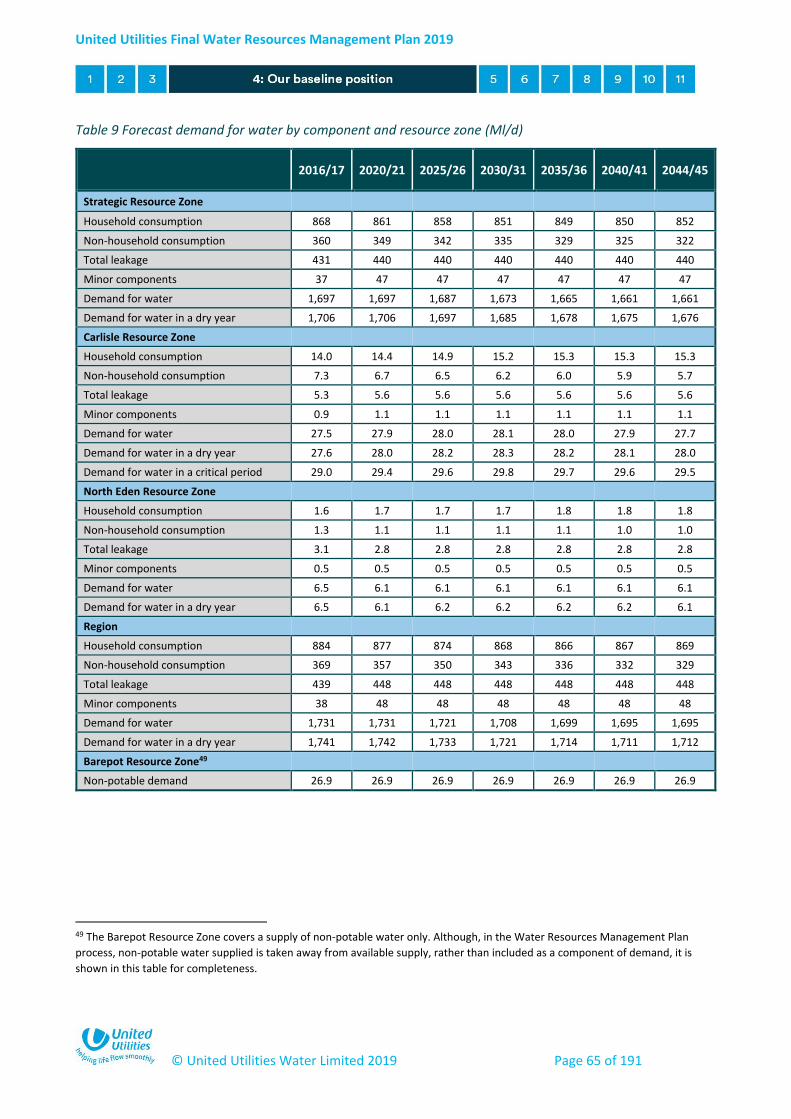
United Utilities Final Water Resources Management Plan 2019
© United Utilities Water Limited 2019 Page 65 of 191
Table 9 Forecast demand for water by component and resource zone (Ml/d)
2016/17 2020/21 2025/26 2030/31 2035/36 2040/41 2044/45
Strategic Resource Zone
Household consumption 868 861 858 851 849 850 852
Non-household consumption 360 349 342 335 329 325 322
Total leakage 431 440 440 440 440 440 440
Minor components 37 47 47 47 47 47 47
Demand for water 1,697 1,697 1,687 1,673 1,665 1,661 1,661
Demand for water in a dry year 1,706 1,706 1,697 1,685 1,678 1,675 1,676
Carlisle Resource Zone
Household consumption 14.0 14.4 14.9 15.2 15.3 15.3 15.3
Non-household consumption 7.3 6.7 6.5 6.2 6.0 5.9 5.7
Total leakage 5.3 5.6 5.6 5.6 5.6 5.6 5.6
Minor components 0.9 1.1 1.1 1.1 1.1 1.1 1.1
Demand for water 27.5 27.9 28.0 28.1 28.0 27.9 27.7
Demand for water in a dry year 27.6 28.0 28.2 28.3 28.2 28.1 28.0
Demand for water in a critical period 29.0 29.4 29.6 29.8 29.7 29.6 29.5
North Eden Resource Zone
Household consumption 1.6 1.7 1.7 1.7 1.8 1.8 1.8
Non-household consumption 1.3 1.1 1.1 1.1 1.1 1.0 1.0
Total leakage 3.1 2.8 2.8 2.8 2.8 2.8 2.8
Minor components 0.5 0.5 0.5 0.5 0.5 0.5 0.5
Demand for water 6.5 6.1 6.1 6.1 6.1 6.1 6.1
Demand for water in a dry year 6.5 6.1 6.2 6.2 6.2 6.2 6.1
Region
Household consumption 884 877 874 868 866 867 869
Non-household consumption 369 357 350 343 336 332 329
Total leakage 439 448 448 448 448 448 448
Minor components 38 48 48 48 48 48 48
Demand for water 1,731 1,731 1,721 1,708 1,699 1,695 1,695
Demand for water in a dry year 1,741 1,742 1,733 1,721 1,714 1,711 1,712
Barepot Resource Zone49
Non-potable demand 26.9 26.9 26.9 26.9 26.9 26.9 26.9
49 The Barepot Resource Zone covers a supply of non-potable water only. Although, in the Water Resources Management Plan
process, non-potable water supplied is taken away from available supply, rather than included as a component of demand, it is
shown in this table for completeness.

United Utilities Final Water Resources Management Plan 2019
© United Utilities Water Limited 2019 Page 66 of 191
Figure 19 Reported regional demand for water, with the central forecast of dry year demand for water, as
well as the upper (accounting for the ‘Northern Powerhouse’ scenario) and lower forecast of dry year
demand for water50
50 The different starting point for each forecast relates to the inherent uncertainty in the starting point, for example, the
uncertainty in the dry year uplift that has been applied to demand for water.
1,500
1,600
1,700
1,800
1,900
2,000
2,100
2,200
2,300
2,400
2,500
1993 1997 2001 2005 2009 2013 2017 2021 2025 2029 2033 2037 2041 2045
De
man
d f
or
wat
er
(Ml/
d)
Reported Central Upper Lower
United Utilities Final Water Resources Management Plan 2019
© United Utilities Water Limited 2019 Page 67 of 191
4.4 Forecasting our future supply
4.4.1 Introduction to supply forecasting
A key component of the Water Resources
Management Plan is the assessment of water
supply availability. This is determined over the
full 25-year planning period (2020-2045) using
two standard industry measures; deployable
output and water available for use. The water
available for use is the basis for the supply
component of the supply-demand balance
comparison.
In assessing available supplies we have followed
national best practice methods. Whilst we focus
on the 25-year planning horizon, we have also
looked beyond this as far as the 2080s. This
analysis helps to test the future performance of
potential plans beyond the year 2045, and is supported by the new sophisticated methods that we have
adopted for this plan (Section 9).
A high-level overview of the approach to supply forecasting, and the resulting water available for use, is
described in this section. A more in depth view of the process followed and the results for different
components of the supply forecast can be found in our Final WRMP19 Technical Report - Supply
forecasting.
4.4.2 Calculating deployable output
Deployable output is the maximum quantity of water that can be provided from a resource zone whilst
meeting our stated level of service (Section 1.4 and 6.3). For this plan we assessed deployable output for all
resource zones and adopted different approaches in line with resource zone complexity. The Barepot
Resource Zone is a simple single source system. The North Eden Resource Zone has low complexity, and
therefore the yields of the different sources in the resource zone are simply summed together. The
Strategic and Carlisle Resource Zones are more complex. These systems are surface water dominated and
sources are used in a ‘conjunctive’ nature, as the supply network means that water from different sources
can be moved around the resource zone to balance water resources risk. System constraints mean that it is
inappropriate to simply sum together source yields so to determine deployable output we used water
resources models in the Aquator package (developed by Oxford Scientific Software). This is documented
further in our Final WRMP19 Technical Report - Supply forecasting.
In calculating deployable output for this plan we have reviewed and, where necessary, refreshed our data.
In aggregate these updates result in a small decrease in deployable output of 32 Ml/d. The following bullet
points show where we have reviewed and refreshed our data:
Hydrological and hydrogeological yield of sources using historic records typically between 54 and
89 years in length;
Asset constraints;
Deployable output: The maximum quantity of water output from a
source or group of sources in a dry period. It
accounts for: water quality, abstraction licence
limits, water treatment, supply system
capabilities, climate change, and sustainability
reductions
Water available for use: A calculation taking deployable output and
then accounting for: raw water, treatment and
operational losses, imports, exports, and
potable bulk supplies to determine the actual
volume of water available for use

United Utilities Final Water Resources Management Plan 2019
© United Utilities Water Limited 2019 Page 68 of 191
Abstraction licence constraints and conditions;
Demands; and
Dead water and emergency storage within impounding reservoirs.
4.4.3 Sustainability changes
A sustainability change (or sustainability reduction as it is sometimes termed) is any change to a water
company abstraction licence to protect (prevent deterioration) or improve the environment. The
Environment Agency works with water companies to identify sustainability changes via the Water Industry
National Environment Programme (WINEP), which sets out measures needed to protect and improve the
environment.
In determining water available for use, any reductions associated with achieving sustainable abstraction
must be accounted for. In line with the guidance we have liaised with Environment Agency and Natural
Resources Wales to determine if we have any abstractions from water bodies that are at risk from
deterioration, and include the requirements set out in the WINEP. Details for sites with a risk of failing to
meet the standards have been provided by the Environment Agency.
In our Water Resources Management Plan 2015 we included a number of sustainability changes and in this
2015-2020 period we are investing to implement them51. The sustainability changes from our 2015 plan
have, therefore, been accounted for in assessing our baseline supply forecast. There are also two new
sustainability changes52 that we have included in our baseline supply forecast. We also identify potential
future sustainability changes that require further investigations in the 2020-2025 period to confirm if they
will go ahead (and have tested these in scenarios, see Section 9).
Working closely with the Environment Agency we have assessed the impact of our plan on the Water
Framework Directive, in particular ensuring that it does not lead to deterioration of water bodies that we
abstract from now, or plan to abstract from in the future. Further detail can be found in our Final WRMP19
Technical Report - Supply forecasting.
4.4.4 Climate change
It is important for us to consider the likely impact of climate change on our water resources to help define
the resilience of our supply system. Our assessment of climate change impacts follows the highest tier of
analysis and has been completed to meet the requirements of the latest Environment Agency guidance.
Climate change has been assessed in a risk-based manner and our choice of approach is based on the
outcomes of a resource zone vulnerability exercise. We engaged with the Environment Agency extensively
throughout this process and held a full day special interest session with regulatory stakeholders.
The approach for assessment comprises four stages:
Vulnerability assessment;
51 Two sustainability changes at Ennerdale Water and Overwater in our West Cumbria Resource Zone will come into effect on
completion of the Thirlmere Transfer scheme. At this point, the abstraction licences for Chapel House Reservoir and Crummock
Water will also be revoked, as part of the compensatory measures package to remediate against abstraction from Ennerdale Water. 52 Implementation of compensation flows at Dean Clough Reservoir and at Grizedale Reservoir (from WINEP3)
United Utilities Final Water Resources Management Plan 2019
© United Utilities Water Limited 2019 Page 69 of 191
Calculate river flows for a resource zone in the 2080s as recommended by the latest Environment
Agency guidance;
Calculate deployable outputs for the 2080s; and
Scaling and uncertainty.
In line with the framework outlined in the guidance, we adopted an approach that is suitably appropriate
based on the outcomes of the vulnerability assessment and the complexity of each resource zone53. The
approach chosen uses 10,000 climate change projections, from which the deployable output is calculated
for a representative sub-selection of 20 scenarios. For the Strategic Resource Zone we expanded our
analysis to test 100 of the scenarios using an emulator model54 of the resource zone. For the Barepot
Resource Zone, results were translated from a similar catchment and applied to the flows at the River
Derwent. For the North Eden Resource Zone the groundwater source yields were reassessed for each of the
20 climate change scenarios. A scaling factor is used to apply the deployable output impact at the year
2080 and adjust it for the time period of our planning horizon.
The results of the climate change assessment for each resource zone are shown in Table 10. There is no
impact in the North Eden Resource Zone due to the sources being constrained by licences rather than the
underlying hydrogeology. There is no impact in the Barepot Resource Zone despite being supplied from a
surface water source. The resource zone itself is constrained by the abstraction licence, and the yield under
each of the 20 climate change scenarios was found to be greater than the source deployable output.
Therefore the source is not impacted by climate change. For the other resource zones the simulated impact
of climate change in 2080 is highest in the Strategic Resource Zone; with a reduction in resource zone
deployable output of 205 Ml/d, or 9.7%. For the Carlisle Resource Zone the resulting reduction in
deployable output is 1.1 Ml/d, or 3.1%.
53 In line with the assessment framework outlined in the Environment Agency supporting guidance we adopted a Tier 3 approach,
which is suitable where the outcome of our vulnerability assessment indicates there is a high vulnerability. This is known as the
‘UKCP09 / water company own approach’ and uses the UKCP09 probabilistic projections 54 The emulator model of our Strategic Resource Zone aggregates some parts of our supply system and enables the rapid
assessment of both climate change and different hydrological scenarios.
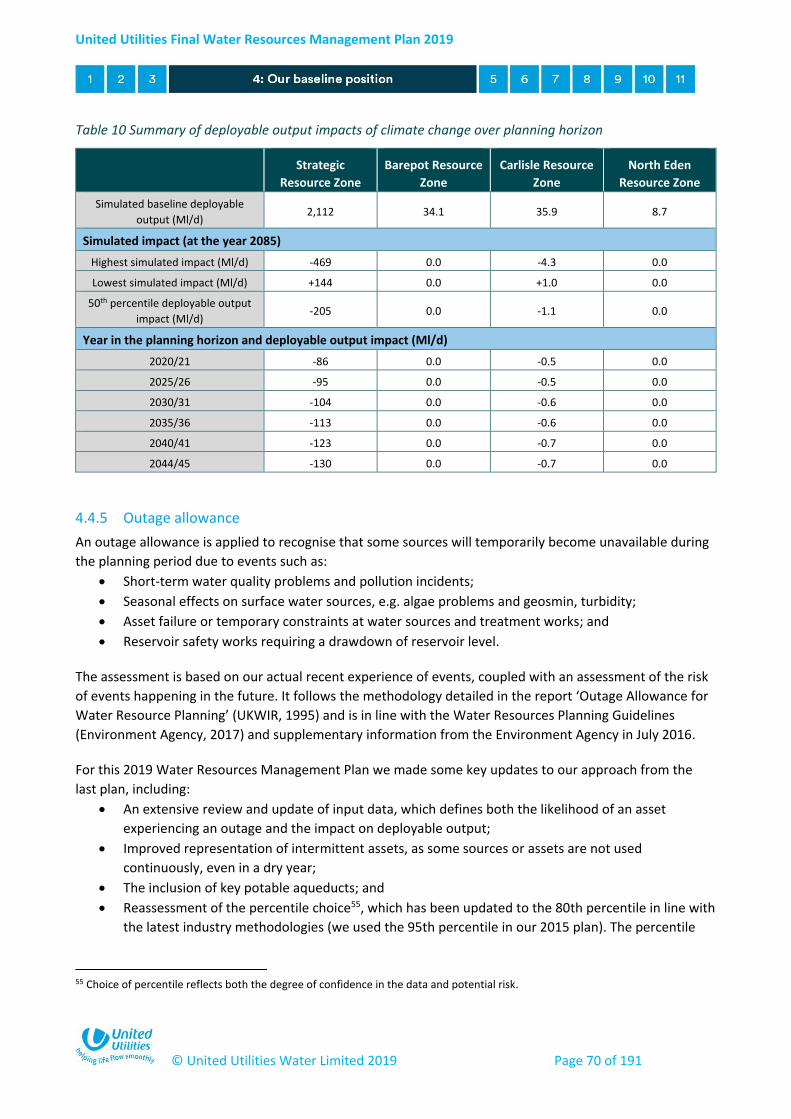
United Utilities Final Water Resources Management Plan 2019
© United Utilities Water Limited 2019 Page 70 of 191
Table 10 Summary of deployable output impacts of climate change over planning horizon
Strategic
Resource Zone
Barepot Resource
Zone
Carlisle Resource
Zone
North Eden
Resource Zone
Simulated baseline deployable
output (Ml/d) 2,112 34.1 35.9 8.7
Simulated impact (at the year 2085)
Highest simulated impact (Ml/d) -469 0.0 -4.3 0.0
Lowest simulated impact (Ml/d) +144 0.0 +1.0 0.0
50th percentile deployable output
impact (Ml/d) -205 0.0 -1.1 0.0
Year in the planning horizon and deployable output impact (Ml/d)
2020/21 -86 0.0 -0.5 0.0
2025/26 -95 0.0 -0.5 0.0
2030/31 -104 0.0 -0.6 0.0
2035/36 -113 0.0 -0.6 0.0
2040/41 -123 0.0 -0.7 0.0
2044/45 -130 0.0 -0.7 0.0
4.4.5 Outage allowance
An outage allowance is applied to recognise that some sources will temporarily become unavailable during
the planning period due to events such as:
Short-term water quality problems and pollution incidents;
Seasonal effects on surface water sources, e.g. algae problems and geosmin, turbidity;
Asset failure or temporary constraints at water sources and treatment works; and
Reservoir safety works requiring a drawdown of reservoir level.
The assessment is based on our actual recent experience of events, coupled with an assessment of the risk
of events happening in the future. It follows the methodology detailed in the report ‘Outage Allowance for
Water Resource Planning’ (UKWIR, 1995) and is in line with the Water Resources Planning Guidelines
(Environment Agency, 2017) and supplementary information from the Environment Agency in July 2016.
For this 2019 Water Resources Management Plan we made some key updates to our approach from the
last plan, including:
An extensive review and update of input data, which defines both the likelihood of an asset
experiencing an outage and the impact on deployable output;
Improved representation of intermittent assets, as some sources or assets are not used
continuously, even in a dry year;
The inclusion of key potable aqueducts; and
Reassessment of the percentile choice55, which has been updated to the 80th percentile in line with
the latest industry methodologies (we used the 95th percentile in our 2015 plan). The percentile
55 Choice of percentile reflects both the degree of confidence in the data and potential risk.

United Utilities Final Water Resources Management Plan 2019
© United Utilities Water Limited 2019 Page 71 of 191
choice is consistent across all resource zones, as we believe it is appropriate for the level of outage
risk to be the same for all supply areas.
The total outage allowance, displayed in Table 11, is modest and reflects the high degree of integration of
the supply system, which enables us to respond efficiently to planned and unplanned events. Further detail
on our outage allowance assessment for this 2019 Water Resources Management Plan is included in
Section 13 of Final WRMP19 Technical Report - Supply forecasting, which also includes specific coverage of
future planned improvements in outage management and activities associated with Cumbrian strategic
pumped resources in Section 13.5.
Table 11 Outage allowances included in this plan
Strategic Resource
Zone
Barepot Resource
Zone
Carlisle Resource
Zone
North Eden Resource
Zone
Outage allowance
(Ml/d) 101.3 Zero 1.55 0.05
4.4.6 Raw water exports and bulk supplies
As noted in Section 3.3 there are raw water exports to Dŵr Cymru Welsh Water and non-potable supplies
from the River Dee (Strategic Resource Zone) totalling around 80 Ml/d. In addition, there are a limited
number of very small imports, exports and potable bulk supplies for the Strategic and North Eden Resource
Zones.
4.4.7 Supply forecasts
The forecasts of deployable output and water available for use for each water resource zone are
summarised in Table 12. Only the start and end of the planning period are shown here; the results for the
full period are shown in Section 4.6 with the supply-demand balance for each resource zone.

United Utilities Final Water Resources Management Plan 2019
© United Utilities Water Limited 2019 Page 72 of 191
Table 12 Water supply forecasts for each resource zone
Component of
supply forecast
(Ml/d)
Strategic
Resource Zone
Barepot
Resource Zone
Carlisle
Resource Zone
North Eden
Resource Zone
2020/21 2044/45 2020/21 2044/45 2020/21 2044/45 2020/21 2044/45
Baseline deployable
output 2,111.6 2,111.6 34.1 34.1 35.9 35.9 8.7 8.7
Sustainability
changes (from
2020/21)
-3.0 -3.0 0.0 0.0 0.0 0.0 0.0 0.0
Climate change -85.5 -130.1 0.0 0.0 -0.5 -0.7 0.0 0.0
Forecast deployable
output 2,023.0 1,978.4 34.1 34.1 35.4 35.2 8.7 8.7
Non-potable/raw
water supplies# -71.6 -75.0 0 0 0.0 0.0 0.0 0.0
Raw water and
process losses -42.0 -42.0 -0.03 -0.03 -0.6 -0.6 -0.04 -0.04
Outage -101.3 -101.3 0.0 0.0 -1.6 -1.6 -0.05 -0.05
Imports 0.05 0.05 0.0 0.0 0.0 0.0 1.3 1.3
Exports## -2.2 -2.5 0.0 0.0 0.0 0.0 0.0 0.0
Water available for
use 1,806.0 1,757.7 34.07 34.07 33.3 33.1 10.0 10.0
#Non-potable/raw water supplies for Barepot Resource Zone are included as non-household demand
## Note that potential future exports are explored later in this document in Sections 6.5 and 8
4.4.8 Extreme droughts, and links to our Drought Plan
In developing past Water Resources Management Plans, we have relied on the analysis of recorded
hydrological data such as rainfall, river flow and reservoir levels. Our key measure of supply, deployable
output (Section 4.4.2), is calculated based on the most severe drought in this record. We refer to this as the
design drought; in the Strategic Resource Zone this is the 1984 event which has a return period of around 1
in 90 years (1.1% annual average risk).
We have good hydrological records, reaching back to the 1920s for the majority of our region. Increasingly
we wish to understand the risks posed by extreme droughts, for example, those we might expect to
experience only 1 in 200 (0.5% annual average risk) or 1 in 500 years (0.2% annual average risk) on average.
However, even with a record length as long as 100 years it is difficult to assess this in a reliable way56.
Therefore, we have developed a stochastic flow dataset; this is derived from rainfall that is statistically
realistic, but has not occurred in the observed record. It has allowed us to extend the length of our records
to over 17,000 years (200 statistically plausible versions of our historic record), to contain a vast array of
different patterns and severities of drought. We have also developed a suite of modelling tools57 to allow us
to simulate the effects of this large volume of hydrological data on our supply system.
56 In previous Drought Plans we have used a technique known as Extreme Value Analysis. 57 As mentioned in Section 4.4.4, we have used an emulator model of our Strategic Resource Zone that enables the rapid
assessment of both climate change and different hydrological scenarios.
United Utilities Final Water Resources Management Plan 2019
© United Utilities Water Limited 2019 Page 73 of 191
Water Resources Management Plans and Drought Plans are set out in legislation as separate plans and are
intended to serve different purposes. Water Resources Management Plans are long-term strategic plans
where the case can be made for investment to maintain supply over a set planning period. Drought plans
are tactical plans that set out triggers and measures in response to drought events. However, the two plans
share the same broad objective of maintaining a secure and sustainable supply of safe, clean water for
customers. The Environment Agency has released a new Water Resources Management Plan table that is
referred to as the Drought Links table58. The table helps companies to consistently demonstrate how their
supply system will respond to a range of relevant drought scenarios (e.g. 1 in 200, 1 in 500 and 1 in 1000
years59). It also enables companies to disaggregate the effects of drought measures from normal non-
drought supplies. A full account of how we have populated the table is provided in the Final WRMP19
Technical Report - Supply forecasting.
There is also a new Defra reference level of service for emergency drought orders (standpipes, rota-cuts
and bowsers) of 1 in 200 years on average (0.5% annual average risk). Companies are expected to include
this level of service in the Water Resources Management Plan as a scenario and determine the required
level of investment to achieve it. Our analysis completed for the Drought Links table indicates that once
emergency storage60 is taken into account we already exceed this level of service; i.e. we have a high level
of resilience to droughts. As a result of this, and when coupled with customer views on the matter, we have
decided not to explore the possibility of investing to further increase drought resilience at this stage.
However, our proposals in this plan will result in supplementary benefits from our investment in other
areas, which manifest in further improved drought resilience, as summarised in Section 7. Our plans mean
that emergency drought orders would not be required except in only very extreme drought events. In
Section 6.3, we also explain that we are considering improved stated level of service for non-essential use
bans, to account for corresponding changes to level of service for drought permits and orders frequency.
58 This is the Table 10 Drought plan links as included in the Environment Agency Planning tables. 59 1 in 200 year event has a 0.5% annual average risk, a 1 in 500 year event has a 0.2% annual average risk, and a 1 in 1000 year
event has a 0.1% annual average risk. 60 This storage would expected to be used only in drought events more severe than on the historic record. It is used in this analysis
as we are testing events more severe than on the historic record.
United Utilities Final Water Resources Management Plan 2019
© United Utilities Water Limited 2019 Page 74 of 191
4.5 Target headroom
4.5.1 Role of target headroom
It is difficult to forecast demand for water or water availability with complete accuracy, especially over a
25-year period. Uncertainties exist in all the components of the supply-demand balance. These include
political, social, environmental, climate change and technical factors that may significantly influence
components of the supply-demand balance. Target headroom is the buffer which is incorporated into water
resources planning to protect customers from the uncertainties associated with the supply and demand
forecasting over the planning horizon. This buffer aims to safeguard sufficient water to supply customers
throughout the planning horizon. Further detail on how we calculate target headroom can be found in our
Final WRMP19 Technical Report - Target headroom.
4.5.2 Target headroom values
For each of the water resource zones a calculation of all of the supply demand uncertainty components is
completed61. Of all the components, climate change makes up the largest proportion of headroom. The
output of the headroom calculations is a probability distribution that represents a likely range of values for
headroom for each year in the planning period. The actual target headroom values included in the supply
demand balance are determined by a choice of percentile. This choice represents the confidence in the
supply-demand data and the level of risk we are prepared to accept in being able to maintain a reliable
supply of water to customers into the future. We have completed some sensitivity testing on the potential
percentile choices to help understand the level of risk and inform our choice. The percentiles alter over
time to account for the opportunity for our plans to be modified and adapted to changing circumstances, to
prevent the risk of planning long-term investment on the basis of high uncertainty.
For the Strategic and Carlisle Resource Zones we vary the percentile choice over the planning horizon in line
with the guidance. Starting with 5% uncertainty (95th percentile) in the year 2020 with a linear increase in
uncertainty to 30% (70th percentile) in the year 2045, as shown in Figure 20. A different approach of a
continuous percentile choice of 5% uncertainty (95th percentile) was chosen for the Barepot and the North
Eden Resource Zones. This is due to the small amount of uncertainty in these resource zones which are
constrained by abstraction licence limits and to avoid there being no buffer later in the planning horizon.
61A breakdown of each of the individual components is provided in our Final WRMP19 Technical Report - Target headroom.

United Utilities Final Water Resources Management Plan 2019
© United Utilities Water Limited 2019 Page 75 of 191
Figure 20 Illustrative results for headroom uncertainty with risk profile for the Strategic Resource Zone
The headroom values tend to fluctuate through time, with upward pressures due to increasing
uncertainties (namely climate change impacts and forecast demand), and downward pressures in line with
the increasing percentile profile. The baseline target headroom values are shown in Table 13. These values
are considered alongside the forecasts for supply and demand to determine the baseline supply-demand
balance in Section 4.6.
Table 13 Target headroom values (including climate change) for each resource zone, 95th to 70th percentile
for the Strategic and Carlisle Resource Zones and a continuous 95th percentile for the Barepot and North
Eden Resource Zones (Ml/d)
Year in the
planning horizon
Strategic Resource
Zone (Ml/d)62
Barepot Resource
Zone (Ml/d)63
Carlisle Resource
Zone (Ml/d)62
North Eden Resource
Zone (Ml/d) 63
2020/21 95.77 1.41 2.35 0.22
2025/26 91.42 1.41 1.99 0.21
2030/31 96.30 1.41 1.66 0.22
2035/36 94.83 1.41 1.36 0.24
2040/41 90.01 1.41 0.99 0.27
2044/45 85.31 1.41 0.77 0.28
62 95th to 70th percentile for the Strategic and Carlisle Resource Zones. 63 Continuous 95th percentile for the Barepot and North Eden Resource Zones.
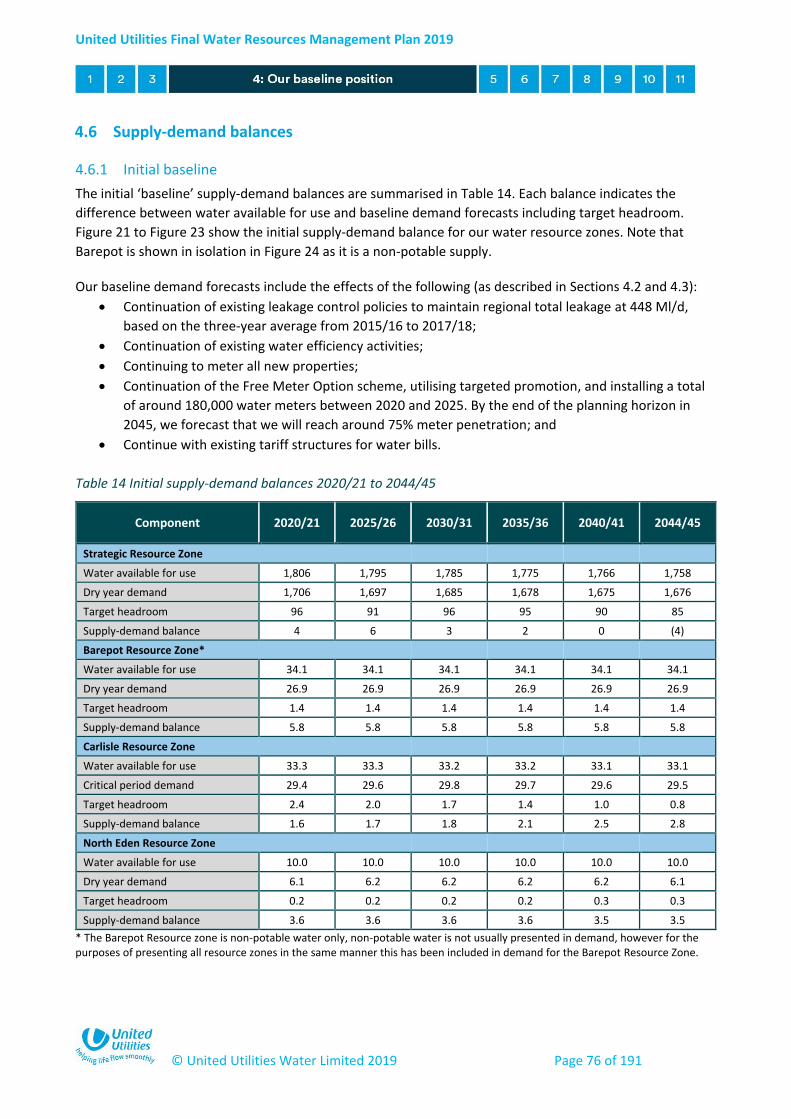
United Utilities Final Water Resources Management Plan 2019
© United Utilities Water Limited 2019 Page 76 of 191
4.6 Supply-demand balances
4.6.1 Initial baseline
The initial ‘baseline’ supply-demand balances are summarised in Table 14. Each balance indicates the
difference between water available for use and baseline demand forecasts including target headroom.
Figure 21 to Figure 23 show the initial supply-demand balance for our water resource zones. Note that
Barepot is shown in isolation in Figure 24 as it is a non-potable supply.
Our baseline demand forecasts include the effects of the following (as described in Sections 4.2 and 4.3):
Continuation of existing leakage control policies to maintain regional total leakage at 448 Ml/d,
based on the three-year average from 2015/16 to 2017/18;
Continuation of existing water efficiency activities;
Continuing to meter all new properties;
Continuation of the Free Meter Option scheme, utilising targeted promotion, and installing a total
of around 180,000 water meters between 2020 and 2025. By the end of the planning horizon in
2045, we forecast that we will reach around 75% meter penetration; and
Continue with existing tariff structures for water bills.
Table 14 Initial supply-demand balances 2020/21 to 2044/45
Component 2020/21 2025/26 2030/31 2035/36 2040/41 2044/45
Strategic Resource Zone
Water available for use 1,806 1,795 1,785 1,775 1,766 1,758
Dry year demand 1,706 1,697 1,685 1,678 1,675 1,676
Target headroom 96 91 96 95 90 85
Supply-demand balance 4 6 3 2 0 (4)
Barepot Resource Zone*
Water available for use 34.1 34.1 34.1 34.1 34.1 34.1
Dry year demand 26.9 26.9 26.9 26.9 26.9 26.9
Target headroom 1.4 1.4 1.4 1.4 1.4 1.4
Supply-demand balance 5.8 5.8 5.8 5.8 5.8 5.8
Carlisle Resource Zone
Water available for use 33.3 33.3 33.2 33.2 33.1 33.1
Critical period demand 29.4 29.6 29.8 29.7 29.6 29.5
Target headroom 2.4 2.0 1.7 1.4 1.0 0.8
Supply-demand balance 1.6 1.7 1.8 2.1 2.5 2.8
North Eden Resource Zone
Water available for use 10.0 10.0 10.0 10.0 10.0 10.0
Dry year demand 6.1 6.2 6.2 6.2 6.2 6.1
Target headroom 0.2 0.2 0.2 0.2 0.3 0.3
Supply-demand balance 3.6 3.6 3.6 3.6 3.5 3.5
* The Barepot Resource zone is non-potable water only, non-potable water is not usually presented in demand, however for the purposes of presenting all resource zones in the same manner this has been included in demand for the Barepot Resource Zone.

United Utilities Final Water Resources Management Plan 2019
© United Utilities Water Limited 2019 Page 77 of 191
Figure 21 Initial supply-demand balance for the Strategic Resource Zone
Figure 22 Initial supply-demand balance for the Carlisle Resource Zone (critical period)
1,100
1,200
1,300
1,400
1,500
1,600
1,700
1,800
1,900
2,000
2021 2023 2025 2027 2029 2031 2033 2035 2037 2039 2041 2043 2045
Me
galit
res
pe
r d
ay (
Ml/
d)
Total Water Available For Use Demand Demand + Target Headroom
25
26
27
28
29
30
31
32
33
34
2021 2023 2025 2027 2029 2031 2033 2035 2037 2039 2041 2043 2045
Me
galit
res
pe
r d
ay (
Ml/
d)
Total Water Available For Use Demand Demand + Target Headroom
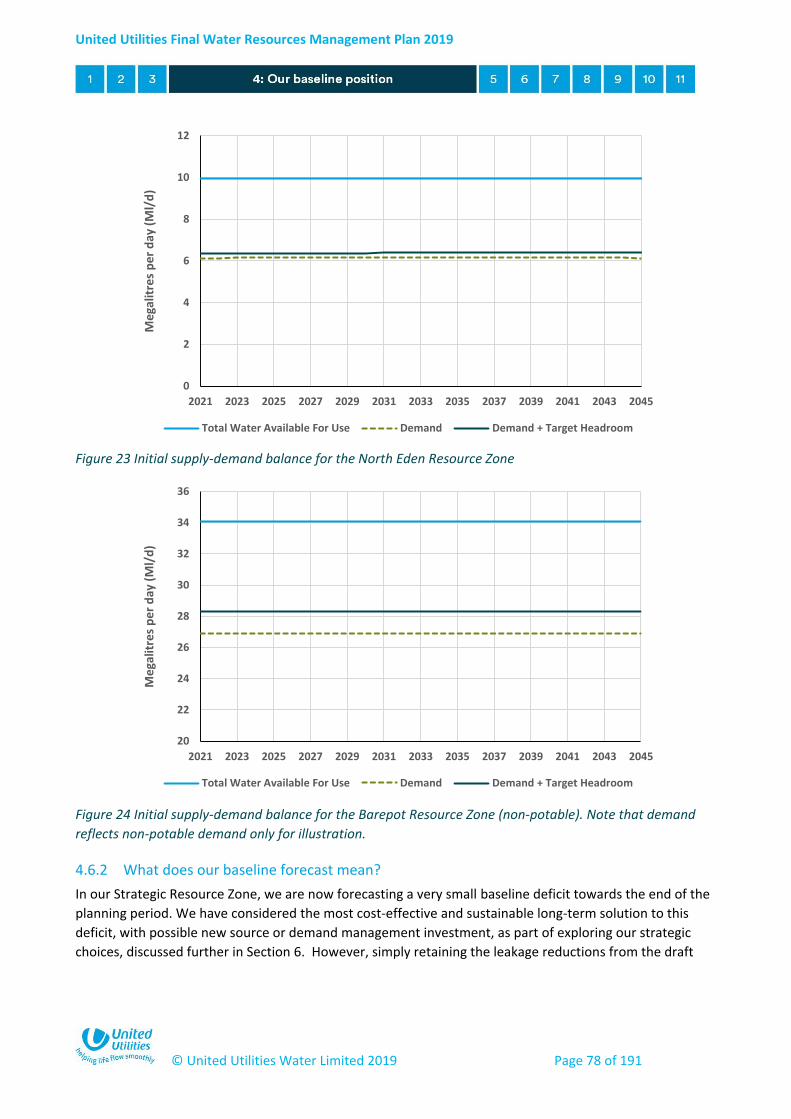
United Utilities Final Water Resources Management Plan 2019
© United Utilities Water Limited 2019 Page 78 of 191
Figure 23 Initial supply-demand balance for the North Eden Resource Zone
Figure 24 Initial supply-demand balance for the Barepot Resource Zone (non-potable). Note that demand
reflects non-potable demand only for illustration.
4.6.2 What does our baseline forecast mean?
In our Strategic Resource Zone, we are now forecasting a very small baseline deficit towards the end of the
planning period. We have considered the most cost-effective and sustainable long-term solution to this
deficit, with possible new source or demand management investment, as part of exploring our strategic
choices, discussed further in Section 6. However, simply retaining the leakage reductions from the draft
0
2
4
6
8
10
12
2021 2023 2025 2027 2029 2031 2033 2035 2037 2039 2041 2043 2045
Me
galit
res
pe
r d
ay (
Ml/
d)
Total Water Available For Use Demand Demand + Target Headroom
20
22
24
26
28
30
32
34
36
2021 2023 2025 2027 2029 2031 2033 2035 2037 2039 2041 2043 2045
Me
galit
res
pe
r d
ay (
Ml/
d)
Total Water Available For Use Demand Demand + Target Headroom
United Utilities Final Water Resources Management Plan 2019
© United Utilities Water Limited 2019 Page 79 of 191
plan that we consulted upon (and subsequently enhanced) addresses this deficit, and increases the overall
level of surplus.
Our Carlisle, North Eden and Barepot Resources Zones are forecast to maintain a positive supply-demand
balance over the planning period, i.e. on a traditional planning approach there are adequate resources
available to meet demand. However, following the Water Resources Planning Guideline, we will consider
this forecast surplus, with possible new source or demand management investment, as part of exploring
our strategic choices, discussed further in Section 6. A summary of each resource zone follows below.
Strategic Resource Zone
Water available for use in the Strategic Resource Zone is expected to reduce by about 46 Ml/d over the
planning horizon due to the incremental impacts of climate change. There will be some additional demand
of around 43 Ml/d when the planned integration of the West Cumbria Resource Zone into the Strategic
Resource Zone is realised (upon delivery of the Thirlmere transfer scheme). In our draft plan, no supply
deficit was forecast, with a surplus of around 38 Ml/d in 2025/26 reducing to around 20 Ml/d by the end of
the planning period in 2044/45. However, with the demand increases we have seen over recent years, we
are now forecasting a very small baseline deficit (circa. 3 Ml/d) towards the end of the planning period as
aforementioned.
Carlisle Resource Zone
Water available for use in the Carlisle Resource Zone is forecasted to remain stable between 2020/21 and
2044/45, with a small reduction of around 0.2 Ml/d due to climate change. A supply demand balance of
over 2.0 Ml/d is forecasted to be maintained between 2020/21 and 2024/25, and increases to 3.3 Ml/d by
2044/45 due to a reduction of target headroom forecasted.
North Eden Resource Zone
There are no supply deficits forecast in the North Eden Resource Zone throughout the planning period.
Barepot Resource Zone
There are no supply deficits forecast in the Barepot Resource Zone throughout the planning period.
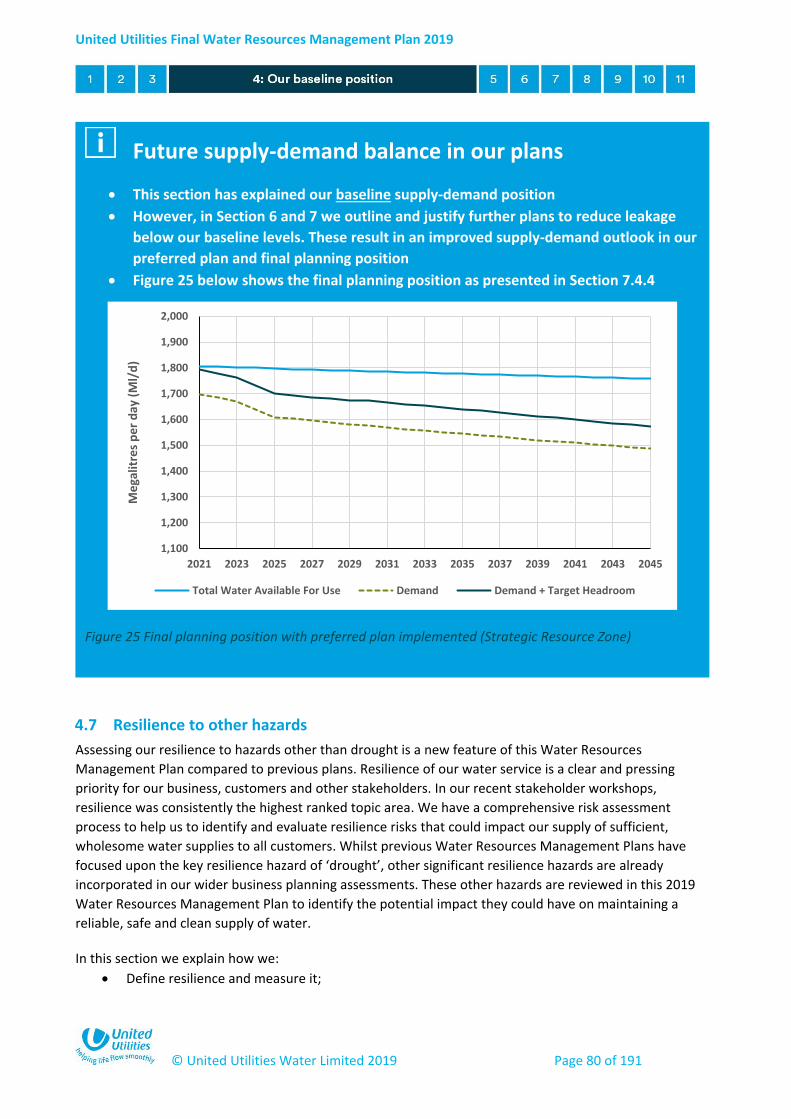
United Utilities Final Water Resources Management Plan 2019
© United Utilities Water Limited 2019 Page 80 of 191
4.7 Resilience to other hazards
Assessing our resilience to hazards other than drought is a new feature of this Water Resources
Management Plan compared to previous plans. Resilience of our water service is a clear and pressing
priority for our business, customers and other stakeholders. In our recent stakeholder workshops,
resilience was consistently the highest ranked topic area. We have a comprehensive risk assessment
process to help us to identify and evaluate resilience risks that could impact our supply of sufficient,
wholesome water supplies to all customers. Whilst previous Water Resources Management Plans have
focused upon the key resilience hazard of ‘drought’, other significant resilience hazards are already
incorporated in our wider business planning assessments. These other hazards are reviewed in this 2019
Water Resources Management Plan to identify the potential impact they could have on maintaining a
reliable, safe and clean supply of water.
In this section we explain how we:
Define resilience and measure it;
Future supply-demand balance in our plans
This section has explained our baseline supply-demand position
However, in Section 6 and 7 we outline and justify further plans to reduce leakage
below our baseline levels. These result in an improved supply-demand outlook in our
preferred plan and final planning position
Figure 25 below shows the final planning position as presented in Section 7.4.4
Figure 25 Final planning position with preferred plan implemented (Strategic Resource Zone)
1,100
1,200
1,300
1,400
1,500
1,600
1,700
1,800
1,900
2,000
2021 2023 2025 2027 2029 2031 2033 2035 2037 2039 2041 2043 2045
Me
galit
res
pe
r d
ay (
Ml/
d)
Total Water Available For Use Demand Demand + Target Headroom
United Utilities Final Water Resources Management Plan 2019
© United Utilities Water Limited 2019 Page 81 of 191
Currently manage resilience and give examples of how we have improved our resilience in the past and will continue to do so now and into the future;
Include corporate and financial resilience considerations, as they also have potential to impact water service resilience;
Have researched customers’ and stakeholders’ expectations to understand how and at what pace they want us to deliver resilience improvements; and
Are planning for improved resilience across the next 25 years. In order to rank and assess our current resilience needs we have: looked at the effects of a severe drought;
modelled our system against freeze-thaw shocks; and identified critical assets risk of failure to flood, power
outage, contamination and malicious physical and cyber-attacks. We have related all current identified
water service resilience risks to their potential impact upon customer supplies both in terms of their
likelihood and consequences. In addition, we have assessed risks associated with our dams and reservoirs
and manage these assets to reduce societal risk.
We use a cost benefit assessment to identify the most appropriate option to address each resilience risk.
Options are identified and reviewed based upon their ability to reduce the resilience risk towards an
acceptable level at an affordable pace. Each option is classified using the four ‘R’s of resilience: ‘resistance’,
‘reliability’, ‘redundancy’ and ‘response and recovery’, see the example schematics in Figure 26 below:
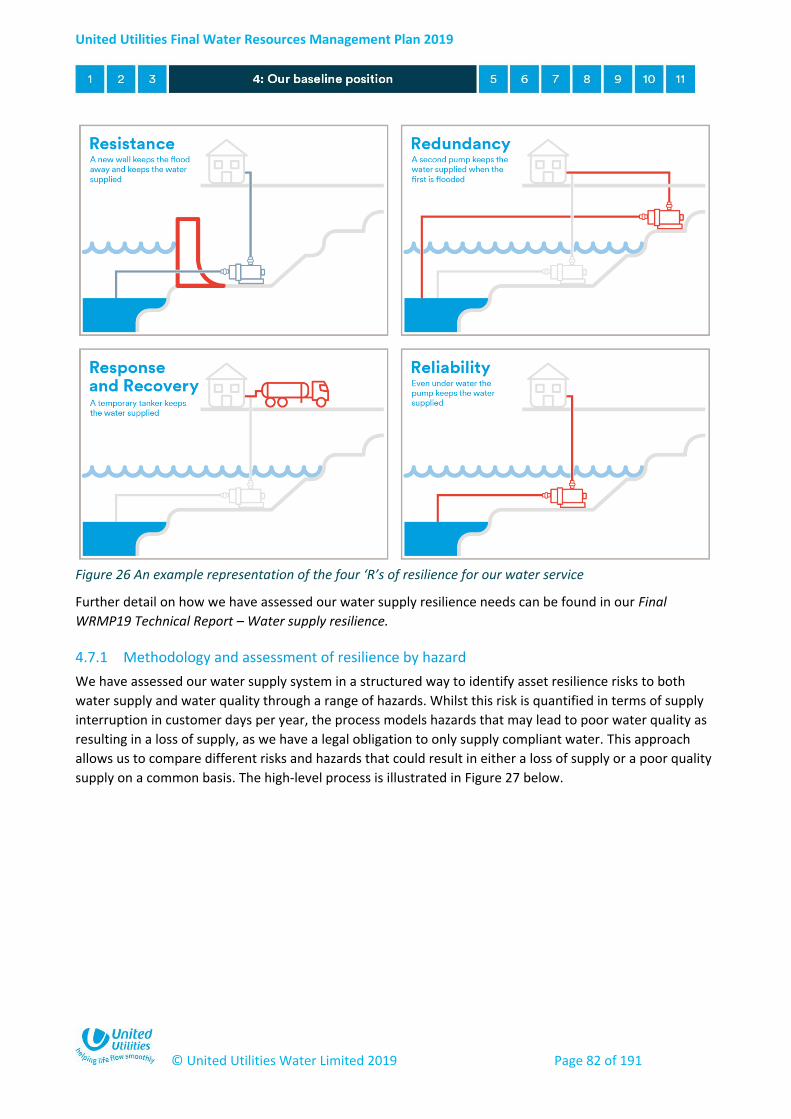
United Utilities Final Water Resources Management Plan 2019
© United Utilities Water Limited 2019 Page 82 of 191
Figure 26 An example representation of the four ‘R’s of resilience for our water service
Further detail on how we have assessed our water supply resilience needs can be found in our Final
WRMP19 Technical Report – Water supply resilience.
4.7.1 Methodology and assessment of resilience by hazard
We have assessed our water supply system in a structured way to identify asset resilience risks to both
water supply and water quality through a range of hazards. Whilst this risk is quantified in terms of supply
interruption in customer days per year, the process models hazards that may lead to poor water quality as
resulting in a loss of supply, as we have a legal obligation to only supply compliant water. This approach
allows us to compare different risks and hazards that could result in either a loss of supply or a poor quality
supply on a common basis. The high-level process is illustrated in Figure 27 below.
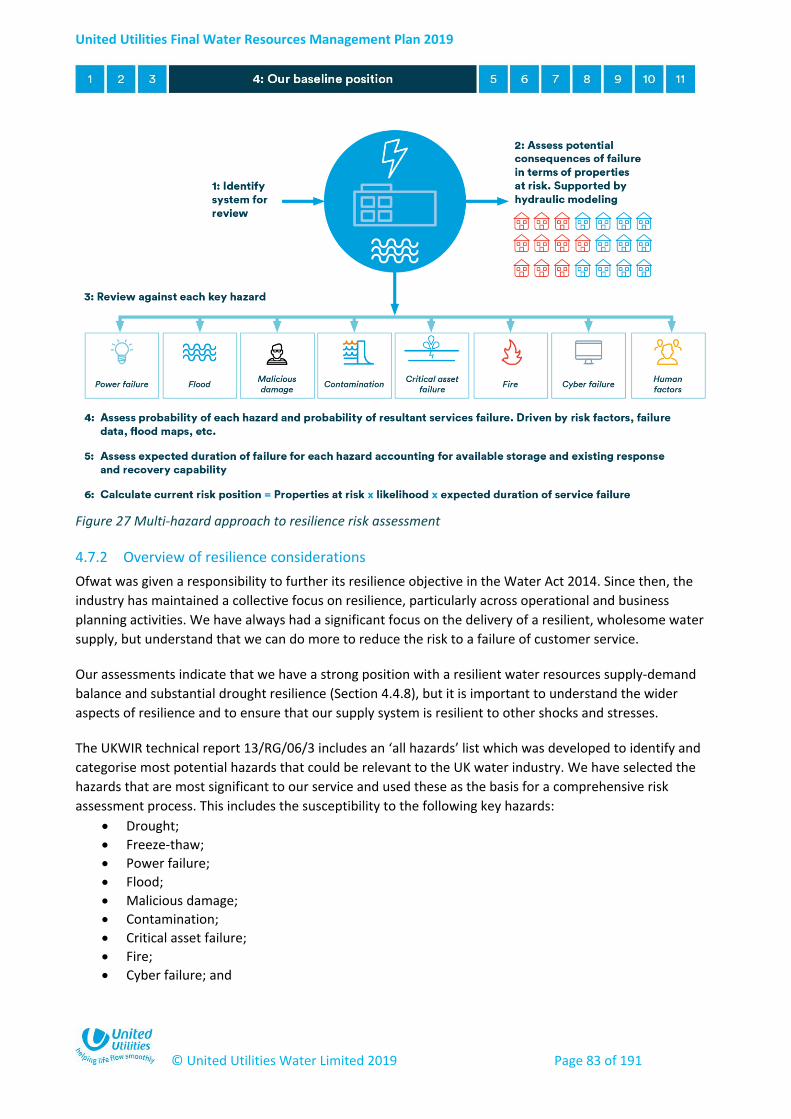
United Utilities Final Water Resources Management Plan 2019
© United Utilities Water Limited 2019 Page 83 of 191
Figure 27 Multi-hazard approach to resilience risk assessment
4.7.2 Overview of resilience considerations
Ofwat was given a responsibility to further its resilience objective in the Water Act 2014. Since then, the
industry has maintained a collective focus on resilience, particularly across operational and business
planning activities. We have always had a significant focus on the delivery of a resilient, wholesome water
supply, but understand that we can do more to reduce the risk to a failure of customer service.
Our assessments indicate that we have a strong position with a resilient water resources supply-demand
balance and substantial drought resilience (Section 4.4.8), but it is important to understand the wider
aspects of resilience and to ensure that our supply system is resilient to other shocks and stresses.
The UKWIR technical report 13/RG/06/3 includes an ‘all hazards’ list which was developed to identify and
categorise most potential hazards that could be relevant to the UK water industry. We have selected the
hazards that are most significant to our service and used these as the basis for a comprehensive risk
assessment process. This includes the susceptibility to the following key hazards:
Drought;
Freeze-thaw;
Power failure;
Flood;
Malicious damage;
Contamination;
Critical asset failure;
Fire;
Cyber failure; and
United Utilities Final Water Resources Management Plan 2019
© United Utilities Water Limited 2019 Page 84 of 191
Human factors.
The assessment of drought as a hazard is a natural extension of the dry year supply-demand balance
assessment, as described already in Section 4.4.8. Our approach to assessing the other non-drought
hazards outlined above is summarised in our Final WRMP19 Technical Report – Water supply resilience. The
Defra guiding principles in particular reference flood and freeze-thaw hazards in the context of the Water
Resources Management Plan, and for this reason, we have provide specific summary of our assessments for
these hazards later in this section (Section 4.7.5).
The subsequent sections below summarise our baseline risk position for water supply resilience resulting
from the assessment of all hazards.
4.7.3 Assessment of our resilience
Most of the hazards that we have assessed are ‘shocks’ to the supply system, although the dry year hazard
and extreme drought are longer duration ‘stresses’ as are some of the specific, long duration, asset failures
that we have evaluated. Other resilience ‘stresses’ to our water supply system that we are including within
the option evaluation process include the effects of climate change and of population growth. All of these
‘stresses’ have the effect of increasing the risks associated with other resilience ‘shocks’ by slowly reducing
the level of resilience in the system. These are described in turn below.
Water treatment works resilience risks
By 2020 we expect to have 25 water treatment works where a major failure can’t be fully offset through
supplies from another water treatment works. In most of these cases we have sufficient potable water
storage to cover the vast majority of incidents and demand scenarios. However, our resilience assessments
have identified credible failure modes related to a range of resilience hazards, typically for extreme
scenarios where high demands are coupled with the hazard. During the current investment period from
2015 to 2020 we have carried out substantial investment to reduce these risks as well as further improved
our operational risk assessments to better manage resilience of supply; a summary of some of these
improvements is included within the section ‘water service specific controls’ in Section 4.7.4. Coupled with
our improved response and recovery capabilities these investments have significantly reduced our baseline
level of resilience risk across our treatment works.
Regional aqueduct system resilience risks
Our regional aqueduct system enables us to proactively move raw and potable water supplies across our
network with approximately a dozen key strategic transfers. Some of these assets have single points of
failure and in certain cases sections are approaching the end of their operational asset lives. We have
identified resilience risks on some of these systems that will require monitoring and some investment. We
are reviewing, updating and testing our operational contingency plans that cover the potential failure of
any of these systems. We will also continue our planned outages and inspections of these key assets.
The largest resilience risk that we have identified is associated with numerous potential single points of
failure on our regional aqueduct system, which supplies water to Manchester and Pennine areas. The
customer service risks associated with this asset can occur throughout the Strategic Resource Zone, as this
aqueduct transports potable water from the Lake District through Cumbria, Lancashire and south to
Greater Manchester. It also provides critical support to the south of the zone and can be used to offset

United Utilities Final Water Resources Management Plan 2019
© United Utilities Water Limited 2019 Page 85 of 191
supply from the River Dee and Lake Vyrnwy, including during an outage event if we experienced
contamination in the River Dee. The development of solutions to address this risk to the Strategic Resource
Zone is collectively referred to as ‘Manchester and Pennine Resilience’.
The long distance aqueducts that supply Manchester have been the subject of investigation and
refurbishment since the 1990s. Considerable planning and investment in enabling works was required to
complete a 4 week outage of a 109 km potable water supply aqueduct commissioned in the 1950s. The
findings from this outage investigation, completed in the winter of 2016, indicate that there are a number
of risks that could affect the resilience of our service to customers. These risks arise mainly from
degradation of concrete lined tunnel sections of the aqueduct. Our risk assessment has been independently
assured.
The Manchester and Pennine Resilience risk could, in the future, result in a widespread water quality
incident (for example, advice to boil water for drinking purposes for over a million properties) or loss of
supply to many thousands of properties for an extended period. We have carried out extensive risk analysis
covering a range of failure modes and consequences, with the risk increasing as the asset ages and
deteriorates over the coming years. For the purposes of customer research and consultation we have
simplified this into three indicative events to represent the overall baseline system risk over a future 10
year period:
65% probability that 1.2 million properties could be affected by water quality problems for at least
one week
35% probability that 120,000 properties could be affected by supply interruptions for up to three
months
10% probability that 240,000 properties could be affected by supply interruptions for up to two
weeks
These represent the baseline risk in the absence of any options which are discussed in the following
sections. The baseline risk ranks highly when assessed alongside other water assets in accordance with the
company risk assessment process.
Trunk main resilience risks
The trunk mains that connect our water treatment works to the local distribution mains are another
potential point of failure that can have major service implications, as often a large number of properties are
fed from a single main. Our network is very flexible and for the majority of mains a burst can be isolated
and supplies re-established quickly. However, we have identified some mains where a repair could take a
long time to complete and there is no current provision to maintain a supply to customers for the full
duration of the repair.
Impounding reservoir and dam risks
We own a large number of dams and reservoirs which can exhibit a risk to people and infrastructure in the
North West of England. We have a well embedded risk assessment process and supporting systems to
evaluate, track and manage the societal risks associated with these assets in line with Health and Safety
Executive guidance. We are committed to a long term programme of risk reduction through programmes of
work aimed at reducing the risk of a catastrophic failure whilst improving our source reliability. We are

United Utilities Final Water Resources Management Plan 2019
© United Utilities Water Limited 2019 Page 86 of 191
making our reservoirs and dams more resilient to hazards such as extreme flood events through improving
reservoir capacity as well as reducing the risk of failure by erosion with other measures.
Catchment resilience
Understanding the interactions between the land and the water is crucial to the successful management of
our essential water resources. Catchment management investigates these interactions and works to
combat or mitigate the activities in the catchment that are detrimental to the sustainability of the water
quality and biodiversity, as well as reducing the risk of flooding to downstream communities. We continue
to manage water catchments in the most effective, efficient and responsible manner to protect and
improve raw water quality and quantity. We manage our catchments in partnership with our tenants and
other land owners to enable the restoration of the upland ecosystems to deliver multiple benefits in terms
of water quality, quantity, biodiversity, access and recreation. In non-owned catchment land we work
creatively with landowners and tenants to influence the land management practices and enhance water
quality.
We own over 50,000 hectares of catchment land in North West England, providing high quality raw water
into our reservoirs and other sources, and we work with third parties to ensure that the remaining 720,000
hectares of our catchment land not in our ownership is managed to the same high standard. Together this
land provides a resilient water supply and protection against downstream flooding as well as wider
environmental and social benefits including biodiversity, carbon sequestration and recreational
opportunities. Through the delivery of our innovative and ground-breaking ‘Sustainable Catchment
Management Programme’ (SCaMP) which began in 2005, and aims to secure multiple benefits at a
landscape scale, we are recognised within the UK water industry as being at the forefront of catchment
management. Working with the Environment Agency, we have evolved our SCaMP approach in the 2015 to
2020 period to focus on 31 drinking water ‘Safeguard zones’, protecting water sources from pollution
regardless of land ownership, and our integrated catchment programme, which supports Defra’s catchment
based approach to improving rivers and bathing waters. Safeguard zones and other catchment initiatives
rely heavily on partnership working with land owners and other stakeholders to deliver sustainable and
resilient catchments.
The impact of Brexit on future agri-environment policy will have significant implications on us as a business,
as a major upland land owner, as a water and wastewater service provider and as a stakeholder in the
management of the natural environment. Throughout Defra's consultation period we have been engaged
with stakeholders to listen to and share our views with politicians, academics, environmental groups and
farmers.
Examples of some of the activities taking place as part of our sustainable catchment management
programme include:
Employment of catchment advisers to provide encouragement and support to farmers in adopting best practice;
Subsidised metaldehyde product substitution;
Free pesticide sprayer, and pelleter testing and calibration
Free services: weedwiper hire, sprayer training, pesticide amnesty, farm health checks;
Passive and spot water quality monitoring to identify the level of risk by sub-catchment and to monitor the benefits of the interventions; and
United Utilities Final Water Resources Management Plan 2019
© United Utilities Water Limited 2019 Page 87 of 191
Use of geographical information (land use cover, erosion potential etc.) to model the highest risk areas and the potential effectiveness of mitigation measures.
In the future, catchment resilience will be key. Catchment resilience is an important issue given recent
experiences, such as Storm Desmond in December 2015, which caused severe flooding in parts of Cumbria,
and the fact that the UK climate projections (UKCP09) are predicting more frequent, intense storm events.
The Water Framework Directive specifies that where water is taken for human consumption, the areas
where that water drains from (i.e. the catchments) must be designated as Drinking Water Protected Areas
(DWPAs). The Environment Agency is required to monitor these areas and coordinate measures to prevent
deterioration in water quality. In DWPAs where water quality is shown to be deteriorating due to human
activity, the Water Framework Directive allows the Environment Agency to establish safeguard zones. We
have worked with the Environment Agency to provide evidence for safeguard zones to be applied to a
number of catchments in the North West. Safeguard zone action plans have been drawn up by the
Environment Agency, listing measures that can prevent further deterioration, so that the need for
additional water treatment is avoided and the level of treatment can be reduced over time.
We follow a number of national best practice and company-specific innovative techniques to understand
the risks to DWPAs. As part of the risk assessment process required by Regulation 27 (in England) and
Regulations 28 (in Wales) of the Water Supply (Water Quality) Regulations 2016, we identify any actual or
potential risks to human health within the catchments of raw water sources and established a raw water
monitoring programme accordingly. Risks to raw water quality are also identified through a variety of other
mechanisms, including information and data gathered by the Environment Agency. Data gathered for
operational purposes (i.e. operational raw water monitoring) is used by ourselves and the Environment
Agency to monitor risks in DWPAs. Where catchment measures are considered the most appropriate to
protect supplies against long term risks of pollution, we work with the Environment Agency to designate
safeguard zones for both surface and groundwater sources. Safeguard zones require voluntary action by
third parties to prevent deterioration with a view to reducing the level of treatment required. We have in-
house catchment teams that manage the 56,000 hectares of catchment land in our ownership as well as
working with third parties to encourage the adoption of best practices on the remaining 720,000 hectares
of non-owned catchment land.
Risk assessments, investigations and operational monitoring data is used to support the identification of
Safeguard Zones and the appraisal of measures to manage and reduce risks to raw water quality. Data is
shared between the Environment Agency and ourselves to assess and manage the risk to raw water quality.
Local partners are engaged to implement catchment measures where appropriate and can often be
involved at the start of the process where their local expertise is used to assist with risk assessments and
investigations. Raw water monitoring is useful in establishing Safeguard Zones and as evidence to support
measures that are considered necessary in those Safeguard Zones.
We follow our Wholesale Risk Asset Planning process when assessing the risk of deteriorating raw water
quality. The water catchment methodology aims to translate the strategic aims set out in our water
catchment strategy into practice for those involved in the management of the risk in the company. The
methodology covers how raw water quality issues with catchment land should be raised and addressed. It
is essential that the methodology is used together with the Drinking Water Safety Plan (DWSP) to correctly
assess risk and record actions taken to control risk.
United Utilities Final Water Resources Management Plan 2019
© United Utilities Water Limited 2019 Page 88 of 191
The methodology describes the data sources, process and outputs to be used in assessing the risk. It
provides a step-by-step process for gathering the information required for catchment risk assessments.
Specifically, the methodology enables the assessment of the risk of deteriorating raw water quality by
identifying and controlling hazards in the catchment. Risk is assessed using the likelihood and consequence
of an event occurring, in-line with the Corporate Risk Framework. The methodology is followed on a
monthly basis by individuals working at a local catchment scale and annually at a regional scale. Data is also
reviewed following an incident or change in the level of risk.
The process of designating a safeguard zone, along with the identification of risk of deteriorating raw water
through the Drinking Water Safety Plan methodology is best practice in the UK. In addition, as
aforementioned, we have an industry leading, long-running approach called SCaMP. Not only does this
begin to reverse long term trends in deteriorating water quality, it provides many other benefits including:
Protecting and improving water quality and quantity
Reducing the rate of increase in raw water colour which will reduce future treatment costs
Protecting and enhancing the natural environment
Improving biodiversity and exceeding national targets for designated sites (SSSIs)
Increasing the resilience of upland habitats to the impacts of climate change
Storing significant volumes of carbon as upland peat moors Other supply network elements The rest of our supply network elements can either be represented with one of the above categories or are, for the most part, inherently resilient with inbuilt redundancy. Consequently most sources, service reservoirs, pumping stations and other related assets have rarely been identified as having substantial inherent resilience risks.
4.7.4 Current resilience risk management controls
We have always understood that a reliable, high quality water service is central to our purpose and
routinely invest and operate to ensure this service. Some of our recent activities to reduce the risk of
service failure are described below:
Water service specific controls
Strategic trunk mains and aqueducts - We commissioned a major new link to our regional supply
system called the West East Link Main (WELM) during AMP5 (2010-2015). This enables supplies
from the west of our region to support short duration inspections of critical infrastructure
supporting Greater Manchester. It also gives us day-to-day flexibility in managing regional supplies,
including supporting the west of the region if required. We are also progressing a project to
address the highest risk section of one of our aqueducts.
Water treatment works risk assessments - We are carrying out extensive operational risk review
processes at each of our treatment works to help us identify and manage risks to water supply in
terms of both quality and quantity.
Water treatment works start up to waste - We are in the process of delivering a ‘start up to waste’
programme that means we can reliably shut down and restart any of our water treatment works in
United Utilities Final Water Resources Management Plan 2019
© United Utilities Water Limited 2019 Page 89 of 191
the event of a concern regarding water quality. This helps us to reduce the risk of water quality
issues with our potable water supply.
Ultraviolet standby capability - We have been delivering a programme of standby disinfection
process capability that will enable us to rapidly deploy powerful ultraviolet disinfection plant at
strategic points across our network. This helps to manage the risk of poor water quality affecting
customer supplies.
Network contingency plans – We have reviewed all of our network contingency plans for a failure
at each of our water treatment works to ensure that we understand in detail which actions are
required and when.
Service reservoir bypass – Any service reservoir that can’t currently be bypassed has been
evaluated and we have developed engineering solutions for delivery.
Impounding reservoir risk reduction – We proactively carry out risk reduction interventions such as
improving flood capacity, or installing filters to prevent internal erosion with the work scheduled to
be efficient and timely. The risk reduction measures we are undertaking often involve increasing
the capacity of the dam to resist floods, ice loading, or earth movement, making the supplies to
customers more resistant to interruption.
Wider wholesale and corporate controls
Telemetry - We have updated our regional telemetry system to ensure that it is robust and can
resist malicious activity associated with cyber-attacks. The system is subject to a constant cycle of
testing and review to manage this threat.
Data security - We have delivered protection to all our assets through improved training systems
and processes and will continue to comply with the increasing accountability for data protection in
the face of ever-present cyber threats.
Human resources – We keep our succession planning under constant review and ensure strength in
depth in all critical business functions as a business as usual activity. Our apprentice and graduate
schemes mean that we can ensure vital skills are passed down and that we can shape and grow the
future business leaders that we need. We have reinvigorated our training programmes and have
enhanced training centres across our region. Our renewed focus on ‘back to basics’ training is
demonstrated by our Water Passport programme, a minimum training requirement for access to
any operational site. In addition, we have in place emergency resourcing plans for helping us to
deal with major incidents to supplement our existing resources.
Supply chain - We have reviewed our supply chain for critical links where a single supplier, point of
infrastructure or other constraint may lead to a vulnerability. Where any weak points have been
identified we have reviewed our existing contracts to manage the risks. We also modified our
contracting process to eliminate these supply chain risks as much as possible.
Financial - We carry out state of the art financial scenario modelling and forecasting to ensure that
we remain on a robust financial footing. Coupled with our integrated corporate risk management
process this helps to ensure financial resilience.
Enhanced operational response - We have reviewed and improved our operational response
capability, not least through the delivery of our Integrated Control Centre enabling wider remote
operation and control across our asset base for improved incident response.
United Utilities Final Water Resources Management Plan 2019
© United Utilities Water Limited 2019 Page 90 of 191
4.7.5 Freeze-thaw and flooding hazards
Freeze-thaw and flooding resilience hazards were specifically mentioned in the Defra guiding principles and
have been covered within our wider resilience hazards assessment. The approaches to the assessments for
these particular hazards are outlined below:
Freeze-thaw
In addition to assessing elements of the water supply system to the multiple hazards indicated in Figure 27,
we have conducted modelling to test our resource zones against the hazard of a freeze-thaw event. Freeze-
thaw events are relatively rare, but place an extreme stress upon our supply system. This manifests in two
related ways:
Failures on customer properties due to burst pipes leading to increased customer demand during
the thaw; and
Failures of our assets throughout the system from the extreme cold ‘freeze’ event, from our pipes
bursting and from our assets operating at their upper limits in peak demand.
Freeze-thaw events typically exhibit greater peak demands than even dry summer peaks, although the
extreme demand seen recently during the extended hot, dry weather in the summer of 2018 saw an
extended period of demand at a level similar to recent freeze-thaw events. The increased demand
associated with a freeze-thaw is almost entirely involuntary, due to burst pipes, and therefore not easily
susceptible to mitigation controls. They also tend to be shorter duration than summer dry spells and not
well reflected in strategic models for assessing dry year water resource availability, as these tend to
operate with longer time steps that do not reflect the severity and relative short duration of a freeze-thaw
event.
We have used our MISER system to stress test our supply system for freeze-thaw risk. MISER is a water
network management modelling package for operational resource planning, widely used in the UK water
industry. We use MISER as a business as usual production planning tool, primarily targeting the distribution
of regional resources for short term week to week forecasts. The model has a slightly finer resolution than
our Aquator™ model for demand modelling, but less hydrological detail. Our MISER model doesn’t include
local treated water storage as this is not generally necessary for regional resource production planning.
Using MISER we have modelled our last three major freeze-thaw events from the winter of 2010/11, to
replicate the historic demand across our system during this particularly widespread series of events. In
order to further stress test our system we increased all demands in the system at 5% intervals in order to
identify the areas of our system least resilient to this hazard. Since the model doesn’t include local storage,
deficits may appear earlier in the model than we would expect in our system. This highlights the parts of
the system most vulnerable to deficits during freeze-thaw events where we would be most reliant upon
local storage.
There are two demand management zones (DMZs) that are initially predicted to be most at risk during
most of the 2010-11 freeze-thaw demand scenarios in the extreme historic peak demands. These deficits
would in practice be met through an operational contingency plan or local storage not fully modelled in the
analysis. Analysing these results further indicates that the current local storage provision provides sufficient
contingency for a typical thaw event across all of our network for the baseline case. In the most extreme

United Utilities Final Water Resources Management Plan 2019
© United Utilities Water Limited 2019 Page 91 of 191
event modelled deficits were noted in a further three DMZs, however, again, we would expect deficits in
these zones to be met through local storage.
As part of developing the final plan, we have also carried out a demand review of both the freeze-thaw
event in March 2018 and the peak demands during the hot, dry weather experienced in the summer of
2018 against the previously modelled events from the winter of 2010/11. The results of this assessment
show that the event in 2018 sits substantially within our system capability as modelled. As described
previously in Section 3.6, consideration of the summer 2018 dry weather event indicated that the peak
demand was similar to that observed in a severe freeze-thaw event, but for a substantially extended
period. This is explained further in Final WRMP19 Technical Report – Water supply resilience (Appendix B).
In conclusion, we are confident in the freeze-thaw resilience of our system, but are continuing to evaluate
the specific conditions in these DMZs as part of our wider and ongoing assessment of business resilience.
Flooding
Our risk assessments have indicated that some of our assets are vulnerable to flooding and in fact we have
experience of flooding affecting the normal operation of a number of our works. Of the two water
treatment works with the biggest flood risk, the demand for one can be fully met through rezoning and
hence stood down, the demand from the other can be supported with water tankers and existing storage
for sufficient time to return the works to service for most credible floods. We have carried out detailed
assessments of the flood risk at all of our larger works that sit within the maximum likely flood extent zones
as published by the Environment Agency to support the National Flood Resilience Review carried out by the
national government during 2016. We currently have contingency plans for all of our water treatment
works and have a number of strategic assets protected against flood return periods up to a 1 in 100 year
flood risk with either permanent or temporary works.
Due to the impact of climate change and our changing understanding of infrastructure flood risk we are
reviewing our flood defences, and response and recovery capability on a regular basis as part of our
business planning process.
4.7.6 Our current level of water supply resilience risk
We have a resilience ambition to minimise the frequency of large scale service failures of greater than 12
hours duration. Our resilience assessments indicate that approximately a third of customers currently face
a resilience risk that exceeds this long-term ambition. Whilst this risk is extremely low for most of these
customers, we are actively looking to reduce both the numbers of customers exposed to this risk and the
level of residual risk that these customers face. This risk is not evenly distributed across our customer base
and one of our ambitions is to provide as even a risk profile as we can achieve within very real bill
affordability constraints.
Through our risk assessment process we have identified resilience needs across our resource zones. These
are risks where a system failure could lead to a significant service impact both in terms of the number of
customers affected and the duration of the impact. The risks themselves vary across different hazards,
although our assessments indicate that raw water ‘contamination’ and ‘critical asset failure’ are the
dominant contributory hazards.
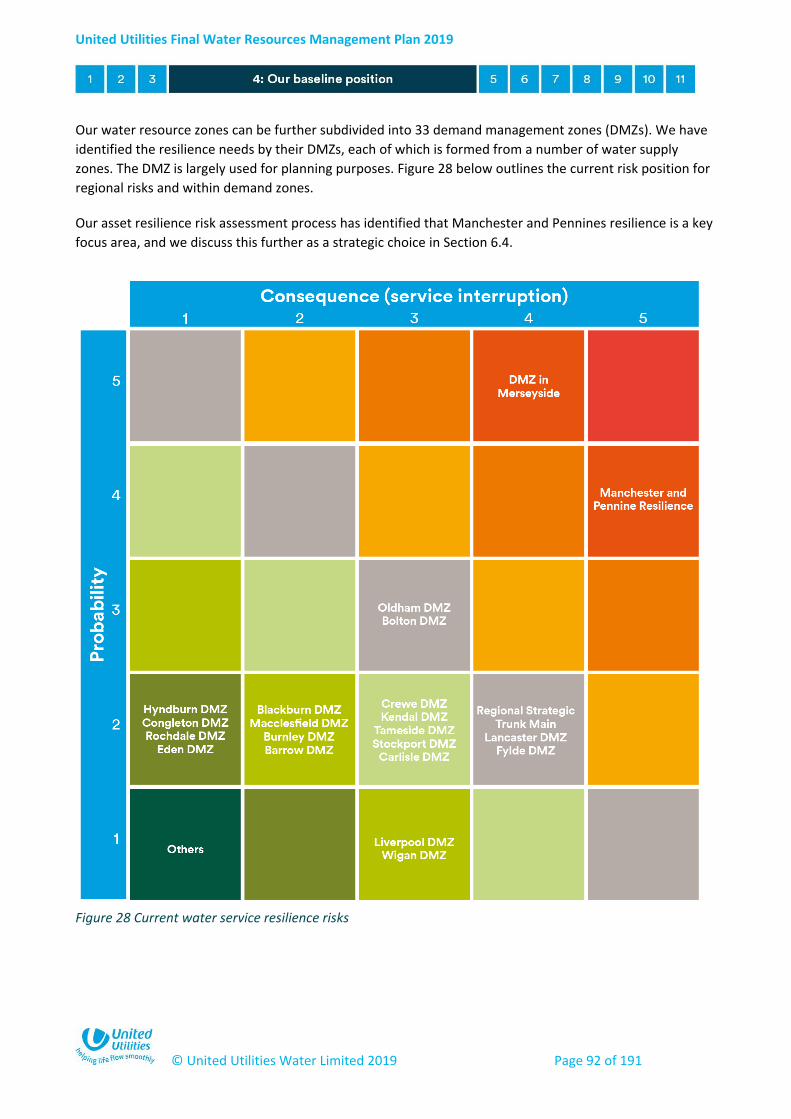
United Utilities Final Water Resources Management Plan 2019
© United Utilities Water Limited 2019 Page 92 of 191
Our water resource zones can be further subdivided into 33 demand management zones (DMZs). We have
identified the resilience needs by their DMZs, each of which is formed from a number of water supply
zones. The DMZ is largely used for planning purposes. Figure 28 below outlines the current risk position for
regional risks and within demand zones.
Our asset resilience risk assessment process has identified that Manchester and Pennines resilience is a key
focus area, and we discuss this further as a strategic choice in Section 6.4.
Figure 28 Current water service resilience risks
United Utilities Final Water Resources Management Plan 2019
© United Utilities Water Limited 2019 Page 93 of 191
5 Identifying future options
5.1 Overview – the need to consider all possible options
This section provides a summary of the approach we have taken to identify and develop a range of possible
options in order to maintain and enhance our supply-demand balance. This supports development of the
most cost effective and sustainable long-term plan. We have included further detail of the methods we
have followed and the results of our assessments within our Final WRMP19 Technical Report - Options
identification. Section 5.6 also explains the process to developing options for water supply resilience to
non-drought hazards.
Identification of the options considered in this section has been carried out in accordance with current
regulatory and industry guidelines which includes the Defra guiding principles, Environment Agency and
Natural Resources Wales guidelines, UKWIR Water Resources Planning Tools report and the Drinking Water
Inspectorate Guidance Note: Long term planning for the quality of drinking water supplies. In following
these industry guidelines we have fulfilled a number of obligations necessary for completion of a successful
Water Resources Management Plan:
We have explored a full range of options, including those that seek to reduce the demand for water
as well as options for new water supplies, to ensure that our final list is comprehensive. This list
includes both our own options as well as those from other organisations such as other water
companies and ‘new market entrants’ who were invited to bid into our Water Resources
Management Plan process with their own ideas to reduce customer demand or provide new
supplies. Collectively, these organisations are called ‘third parties’. See Section 5.2;
Through this process, we have endeavoured to consider innovative solutions. For example, new
water treatment processes to prevent the transfer of invasive non-native species (INNS) or new
techniques/approaches to reduce the demand for water;
We have considered risks and uncertainties when designing the scope of our options. For example,
raw water quality risks may be significant and we recognise that there is a need to not cause
deterioration in the quality of the water which we supply to customers and that this is acceptable
to them. Our systematic approach to generating our own options and the approach to gather ideas
Key points
We have completed an extensive exercise to ensure we consider all possible options.
This has been completed in line with industry guidance.
We have considered around 350 possible options which are a mixture of our own
options and those from third parties.
The third party options have been assessed in the same way as our own options.
We used many different screening criteria in order to assess the viability of options
which resulted in about 150 options being considered during options appraisal.
We summarise the process we have followed to identify non-drought resilience
options for consideration to address water supply resilience risks.
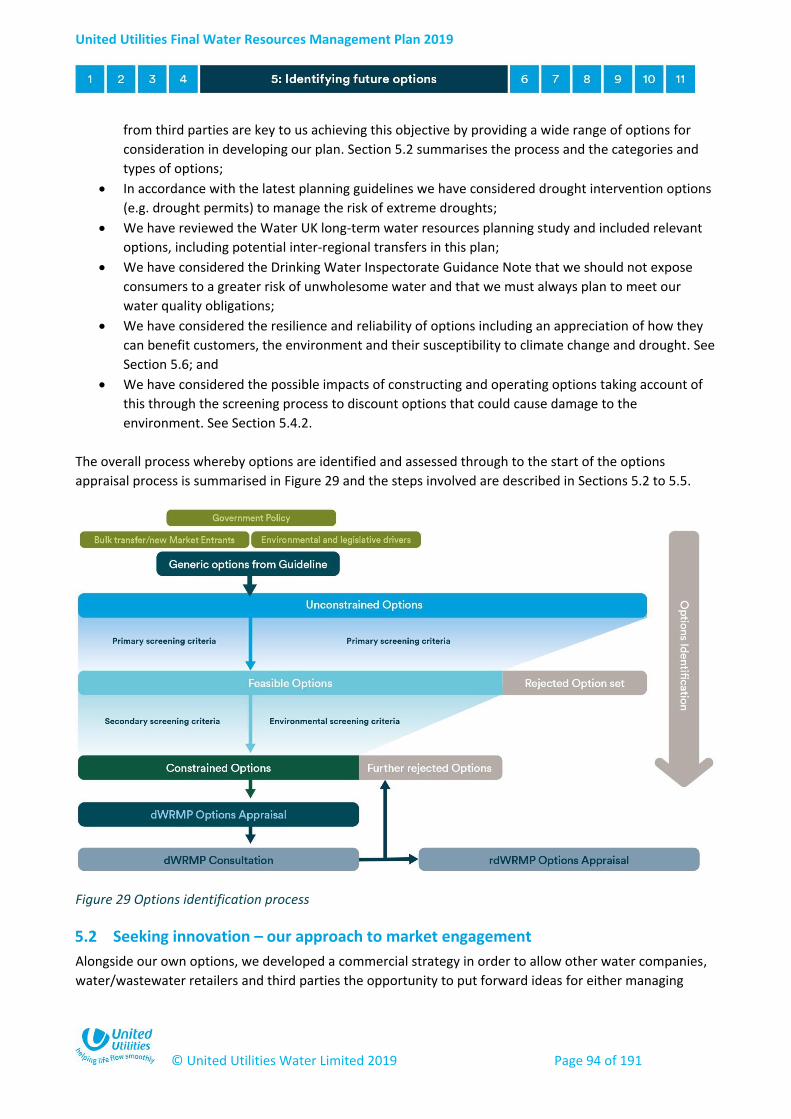
United Utilities Final Water Resources Management Plan 2019
© United Utilities Water Limited 2019 Page 94 of 191
from third parties are key to us achieving this objective by providing a wide range of options for
consideration in developing our plan. Section 5.2 summarises the process and the categories and
types of options;
In accordance with the latest planning guidelines we have considered drought intervention options
(e.g. drought permits) to manage the risk of extreme droughts;
We have reviewed the Water UK long-term water resources planning study and included relevant
options, including potential inter-regional transfers in this plan;
We have considered the Drinking Water Inspectorate Guidance Note that we should not expose
consumers to a greater risk of unwholesome water and that we must always plan to meet our
water quality obligations;
We have considered the resilience and reliability of options including an appreciation of how they
can benefit customers, the environment and their susceptibility to climate change and drought. See
Section 5.6; and
We have considered the possible impacts of constructing and operating options taking account of
this through the screening process to discount options that could cause damage to the
environment. See Section 5.4.2.
The overall process whereby options are identified and assessed through to the start of the options
appraisal process is summarised in Figure 29 and the steps involved are described in Sections 5.2 to 5.5.
Figure 29 Options identification process
5.2 Seeking innovation – our approach to market engagement
Alongside our own options, we developed a commercial strategy in order to allow other water companies,
water/wastewater retailers and third parties the opportunity to put forward ideas for either managing
United Utilities Final Water Resources Management Plan 2019
© United Utilities Water Limited 2019 Page 95 of 191
demand or for the supply of new resources. An important resource management option that has been
considered in this plan relates to the bulk transfer of water into, out of and within our supply area (e.g.
linking water resource zones). Options to improve the connectivity between water companies and to better
share or utilise existing abstraction licences can potentially lead to better value for customers, as long as
the quality of the water supply is maintained or improved. Our approach to this market engagement
activity is summarised in this section and comprises three main parts:
Water trading – through bulk supplies between water companies (neighbouring or not);
Abstraction licence trading/sharing within catchments – this provides a company with an option to
purchase or sell abstraction licences to help meet its supply needs or to sell surplus water to other
abstractors; and
Options provided by other water companies or by third parties – allowing others to provide
demand and/or resource type options in the plan increases the scope for lower costs and
innovative solutions.
5.2.1 Information gathering
We sought to gather information and ideas for options in a number of different ways:
Communicating with known and potential new third parties from a contact database via direct
correspondence. This list comprises, for example, water companies, water/wastewater retailers,
abstraction licence holders, local authorities, reservoir and landowners, navigation authorities,
National Parks, businesses known to offer demand reduction services and options from third
parties who we had previously interacted with during our last Water Resources Management Plan.
Between August and September 2016, we sent out over 350 individual communications to these
organisations notifying them of the Water Resources Management Plan and how they could input
to the process;
Publishing a Prior Information Notice (PIN) within the Official Journal of the European Union
(OJEU)64 with a response template of required information and data of how to contact us with any
ideas they wished to submit. We also communicated to the contact database providing notification
of the PIN publication and response deadline. This PIN was active for a period of six weeks between
August and September 2016;
Publishing a market engagement request ‘Can you help us …’ on our external website with response
forms. We had 20 expressions of interest submitted via this route; and
Holding a market engagement event to discuss the process with interested third parties that
responded to the communications. Fourteen individuals and organisations attended this event.
5.2.2 Collating and assessing responses
Options from third parties were assembled alongside our own options. The process of assessing the
responses was the same for all options through the primary screening process which was completed by an
independently appointed organisation to ensure all options were considered equitably, thereby ensuring
that the final supply-demand strategy (see Section 7) delivers best value for customers. The results of the
market engagement approach are discussed further in Section 5.3.
64 It is a legal requirement for companies operating in many sectors, e.g. water utilities, gas, oil, electricity, railway, postal services,
port and airport related activities, to publish their tenders in the OJEU. 160,000 tenders a year are published through OJEU of which
about 14,000 are from the UK and so the journal is used extensively by potential suppliers of services.
United Utilities Final Water Resources Management Plan 2019
© United Utilities Water Limited 2019 Page 96 of 191
5.3 Unconstrained options and primary screening
As shown in Figure 29 above, the first part of options identification requires the determination of a list of
unconstrained options. At this stage, a number of assumptions have to be made, for example the quality of
the water source, the quantity of water the option could provide, or the amount of water that could be
saved (e.g. leakage repair). These assumptions are used to generate the scope of works that is examined in
more detail through the development of feasible options, see Section 5.4. The options are aligned to a list
of generic option types that are presented within the UKWIR Water Resources Planning Tools report. They
comprise four main categories:
Customer side management options – e.g. metering, water efficiency, changes to level of service;
Distribution side management options – e.g. leakage detection and reduction;
Production side management options – e.g. leakage detection on raw water systems, water
treatment works process loss reduction; and
Resource management options – e.g. river, groundwater, reclaimed water, abstraction licence
trading.
From our Water Resources Management Plan 2015 we already had a comprehensive list of unconstrained
options. We have assembled our new unconstrained options based on this and supplemented the list with
new options. At this unconstrained options stage of the process, we did not take into account constraining
factors, for example the cost of building/operating the scheme, environmental issues (e.g. resilience to
climate change), planning restrictions, regulation/legal issues or whether it is promotable/acceptable to
customers. Such issues form part of the assessment of the feasible options (see Section 5.4) and screening.
However, any options that were not technically feasible were discounted prior to becoming an
unconstrained option. In effect this is a pre-screening stage and we documented the reasons why these
decisions were made. Table 15 provides a summary of the number of options that we have considered in
this plan (including third parties and our own options) at each stage of the options development process. A
number of possible options to export water from our supply area are also detailed here; further
information on this process can be found in Final WRMP19 Technical Report - Options identification.
The primary screening process is applied to the unconstrained options and assesses their potential viability
against a series of specific tests based on questions detailed in the UKWIR report. The overriding principles
for the primary screening are to ensure that:
All options have been subjected to the same scrutiny and testing. It is our priority that these criteria
have been applied consistently across all unconstrained options to achieve a balance between the
number of feasible options and the availability of realistic choices; and
The screening criteria as applied provide a consistent view of the potential environmental impacts
of options. Discarded options from this stage of the process are likely to have unacceptable impacts
that cannot be overcome. More detailed environmental assessments are completed on the feasible
options at subsequent stages of the process.
For all options, the screening criteria questions were based around the following key areas to understand
the:
Impact on the resource base (ability to increase deployable output) or on the demand for water;
Performance against unalterable planning, regulatory and environmental constraints; and
Risk of failure or inherent uncertainty.
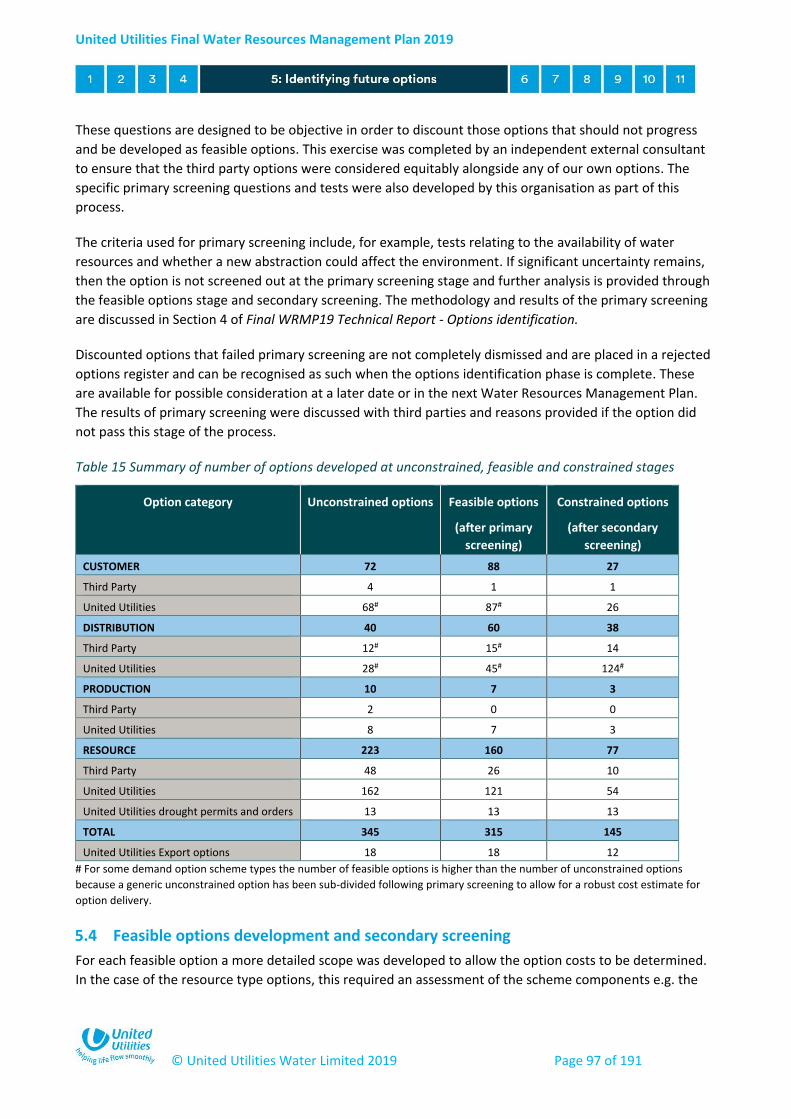
United Utilities Final Water Resources Management Plan 2019
© United Utilities Water Limited 2019 Page 97 of 191
These questions are designed to be objective in order to discount those options that should not progress
and be developed as feasible options. This exercise was completed by an independent external consultant
to ensure that the third party options were considered equitably alongside any of our own options. The
specific primary screening questions and tests were also developed by this organisation as part of this
process.
The criteria used for primary screening include, for example, tests relating to the availability of water
resources and whether a new abstraction could affect the environment. If significant uncertainty remains,
then the option is not screened out at the primary screening stage and further analysis is provided through
the feasible options stage and secondary screening. The methodology and results of the primary screening
are discussed in Section 4 of Final WRMP19 Technical Report - Options identification.
Discounted options that failed primary screening are not completely dismissed and are placed in a rejected
options register and can be recognised as such when the options identification phase is complete. These
are available for possible consideration at a later date or in the next Water Resources Management Plan.
The results of primary screening were discussed with third parties and reasons provided if the option did
not pass this stage of the process.
Table 15 Summary of number of options developed at unconstrained, feasible and constrained stages
Option category Unconstrained options Feasible options
(after primary
screening)
Constrained options
(after secondary
screening)
CUSTOMER 72 88 27
Third Party 4 1 1
United Utilities 68# 87# 26
DISTRIBUTION 40 60 38
Third Party 12# 15# 14
United Utilities 28# 45# 124#
PRODUCTION 10 7 3
Third Party 2 0 0
United Utilities 8 7 3
RESOURCE 223 160 77
Third Party 48 26 10
United Utilities 162 121 54
United Utilities drought permits and orders 13 13 13
TOTAL 345 315 145
United Utilities Export options 18 18 12
# For some demand option scheme types the number of feasible options is higher than the number of unconstrained options
because a generic unconstrained option has been sub-divided following primary screening to allow for a robust cost estimate for
option delivery.
5.4 Feasible options development and secondary screening
For each feasible option a more detailed scope was developed to allow the option costs to be determined.
In the case of the resource type options, this required an assessment of the scheme components e.g. the

United Utilities Final Water Resources Management Plan 2019
© United Utilities Water Limited 2019 Page 98 of 191
source of the water, how it would be abstracted, where would the water be taken for treatment, the likely
water quality risks associated with the source and the necessary water treatment requirements to ensure
we meet our regulatory obligations for water supplies. In particular, changes or uncertainty in raw water
quality were noted as being of importance for the scope to consider. This is to ensure that the design of any
treatment process would not cause any deterioration in the quality of water supplied to customers e.g.
where an option could change the composition of the existing water supply network and potentially cause
aesthetic impacts appropriate mitigation would need to be included. A similar approach was taken with the
third party resource options and this required collaborative working to ensure fair representation of the
proposed scope along with any assumptions made. For our own customer and distribution type options,
costs are derived from the existing known and projected business costs e.g. leakage repair and detection.
For third party customer and distribution options, we have worked with the organisation to understand the
components of their proposals in order to accurately represent the costs.
The feasible options set has been shared and discussed with environmental regulators (Environment
Agency, Natural Resources Wales and Natural England), and early on in the process we held a review
workshop in order to highlight any issues that would help inform our secondary screening and the
subsequent environmental assessments. We have also engaged with the Drinking Water Inspectorate on
the process of developing our options in the plan.
The feasible options have gone through a process of secondary screening; an iterative approach, using
various data sets and assessments in order to discount options from the final list of feasible (constrained)
options. Major components of the secondary screening relate to understanding the possible environmental
effects of implementing different options and non-monetised environmental and social costs. Our Water
Resources Management Plan has a statutory requirement to carry out a Strategic Environmental
Assessment and a Habitats Regulation Assessment and we have used these pieces of work as part of
secondary screening to examine each feasible option in turn. We have also completed assessments, using
an external consultant, to ensure that options in the plan do not result in deterioration of catchments and
waterbodies linked to Water Framework Directive. We have also completed assessments of climate change
risk for the feasible options and whether they have a demonstrable benefit within our supply system when
implemented.
As a result of this process, we have screened out a significant number of feasible options which were
considered to be unacceptable in terms of their potential impacts. This process reduced the number of
feasible options from 315 to 145 (see Table 15).
The components of our secondary screening are described in Sections 5.4.1 to 5.4.5.
5.4.1 Environmental and social costs
An assessment of the environmental and social costs of each option has been completed. These are non-
monetary costs, derived following an industry standard approach65, and consider a wide range of issues, as
appropriate for each particular option, such as:
65 Environment Agency - Environmental Valuation in Water Resources Planning - Additional Information (2016); Benefits Assessment Guidance (2012).

United Utilities Final Water Resources Management Plan 2019
© United Utilities Water Limited 2019 Page 99 of 191
Environmental impacts of water supply schemes, during construction and/or during scheme
operation. Examples of impacts considered include those on aquatic flora and fauna, other water
abstractors, heritage, archaeology and landscape;
Social impacts of water supply schemes, during construction and/or during scheme operation.
Examples of impacts considered include those of informal recreation activities such as cycling or
birdwatching, in-stream recreational activities such as boating, canoeing or rowing, walking, noise,
dust, odour, or time delays to people’s journeys as a result of work in highways to lay or repair
pipelines; and
Increases or reductions in carbon emissions that could result from the abstraction, treatment and
distribution of water. Examples of impacts considered include: fuel consumption of vehicles used in
construction, leakage management, installation of water meters or water efficiency devices, energy
use at work sites, emissions from road traffic as a result of diversions or disruptions, embodied
carbon in materials used, changes in water use (and thus changes in energy use) within the home.
Environmental and social costs are heavily dominated by carbon related impacts during the construction
and operation of schemes and these can therefore be used as a way of quickly assessing what the
environmental and social cost profiles are for options. We used carbon factors for this initial assessment of
environmental and social costs for the first part of secondary screening in order to reduce the number of
feasible options. The full environmental and social cost analysis was completed on the remaining options
that were still considered feasible following this exercise. Our approach to generating environmental and
social costs and results of the analysis is documented in our Final WRMP19 Technical Report - Options
identification. We have also published the Environmental and Social Costs reports for the supply-demand
options66 and Manchester and Pennine Resilience options67 of our preferred plan.
The environmental and social costs and benefits were combined with the whole life financial costs of each
feasible option to derive a term called Average Incremental Social Cost (AISC)68, also see Section 7.2. The
AISC values for each option are used to generate a ranked assessment of overall option costs, represented
as pence per cubic metre. The ranking of options based on AISC can be seen in our Final WRMP19 Technical
Report - Options appraisal.
AISC values have been calculated in accordance with the Water Resources Planning Guideline. We have
calculated the AISC based on using the option at its maximum capacity. All prices are base dated at the
average in FY17/18 (2017/18 financial year) using RPI (Retail Price Index). The AISC values indicate the
relative unit costs of the various options. The development of the most cost effective or economic plan may
not necessarily directly reflect the AISC ranking, so options are subject to a detailed options appraisal
process. This is detailed further in Section 7.2 and the supporting Final WRMP19 Technical Report – Options
appraisal.
Natural capital and environmental net gain
As part of our work on environmental and social costings, we also engaged an external consultant to
complete a literature review and comparative analysis of different approaches to environmental and social
impact assessment namely: a) traditional environmental and social costing; b) an Ecosystem Services
66 Environmental and Social Costs of Water Resources Management Plan 2019 Supply-Demand Options. 67 Environmental and Social Costs of Water Resources Management Plan 2019 Manchester and Pennine Resilience Options. 68 The average unit cost of a particular scheme that represents its whole life cost and includes environmental and social costs.

United Utilities Final Water Resources Management Plan 2019
© United Utilities Water Limited 2019 Page 100 of 191
approach; c) a Natural Capital approach. This was to identify gaps, complementarities and overlaps as well
as potential benefits and limitations of adopting a Natural Capital/Ecosystem Services approach for this
Water Resources Management Plan and/or for future plans.
For this Water Resources Management Plan, we have decided that it was not practical to implement the
Natural Capital/Ecosystems Services Approach for a number of reasons, mainly based around the current
uncertainty of the approach and the lack of a defined framework from which to make decisions. For
example:
We require a greater understanding of how the benefits and liabilities of Natural Capital will be incorporated within our corporate accounts;
Collaborative projects and scheme development using Natural Capital requires time to work with partners on this economic approach to avoid the potential pitfall of it being a ‘black box’ decision making process;
The Ofwat expectation is that the Natural Capital approach would be trialled in AMP7 (2020-2025) and potentially form the basis for environmental planning in AMP8 (2025-3030); and
Our trials and case study work are ongoing. These will provide lessons learnt that can understand and build on and define our processes for the next Water Resources Management Plan.
However, we recognise the potential benefits to this approach and the importance of using it for future
planning rounds. As we continue to mature in our use of natural capital approaches, building on our
ongoing work as described below, we aim to develop a better understanding of how they can be applied
across our wholesale business and use the approach to guide subsequent water resources planning
development for the next planning round (Water Resources Management Plan 2024).
We have trialled a Natural Capital approach in the River Petteril catchment in Cumbria to appraise options
to address Water Framework Directive drivers at a catchment scale. The primary improvement drivers for
the catchment are nitrates, phosphates, bacterial load and flooding (the River Petteril flows into the south
of Carlisle and contributed significantly to the 2015 floods during storm Desmond).
Natural Capital approaches, including (i) accounting, (ii) solutions and (iii) financing, are a central part of the
development of our Catchment Systems Thinking Approach, aimed at integrated, sustainable and
innovative catchment planning and delivery. A systems thinking approach depends on establishing strong
partnerships with local environmental and community stakeholders. We continue to work closely with
Defra’s Catchment Pioneer in Cumbria to support the ambitions set out in the Government’s 25 Year
Environmental Plan, with a strong focus on the role of natural capital in shaping our relationship with the
environment. A primary deliverable of the Petteril project was a decision support tool providing a platform
to optimise and enhance the natural capital value resulting from asset and catchment solutions to meet the
environmental objectives (e.g. water quality). Following the success of the Petteril trial and the positive
engagement with local stakeholders, we will be using the Natural Capital decision support tool and
opportunity mapping methodology to assess a number of other prioritised catchments across the region in
collaboration with our partners in Natural Course69.
69 An EU LIFE (the EU’s financial instrument supporting environmental, nature conservation and climate action projects) Integrated project, building capacity to protect and improve our water environment, now and for the future.

United Utilities Final Water Resources Management Plan 2019
© United Utilities Water Limited 2019 Page 101 of 191
This assessment will be used to develop our plans for the PR19 Business Plan (drivers include Safeguard
Zones, Water Framework Directive and flood resilience) and the delivery of actions in AMP7 (2020-2025)
and beyond. As we continue to mature in our use of Natural Capital approaches, we aim to develop a
better understanding of how they can be applied across our wholesale business including in future water
resources planning cycles.
As the largest corporate land owner and on recognition of the direction of the 25 Year Environment Plan, so
far in 2018 we have undertaken development of a Corporate Natural Capital account, working with leading
industry experts to demonstrate our awareness and understanding of the value of the land in our
ownership. We will continue to evolve our natural capital approaches, and we will be taking part in a pilot
of Defra's metric70 to value ecosystem services at Thirlmere, and of net gain and habitat banking working
with Greater Manchester Authority.
Environmental net gain will be embedded for new infrastructure projects in our capital programme at an
individual project level, from 2020 onwards. We are currently working with Natural England to discuss our
approach to net gain, and are also using the Defra metric to assess biodiversity net gain within our
engineering projects, which can be expanded in the future to include environment net gain71.
5.4.2 Strategic Environmental Assessment (SEA)
The Environmental Assessment of Plans and Programmes Regulations 2004 (known as the ‘SEA
Regulations’) aim to ‘provide for a high level of protection of the environment and to contribute to the
integration of environmental considerations into the preparation and adoption of plans and programmes
with a view to contributing to sustainable development’. Undertaking and reporting a Strategic
Environmental Assessment is a statutory requirement for our Water Resources Management Plan.
Throughout the course of the development of a plan or programme, the Strategic Environmental
Assessment seeks to identify, describe and evaluate the likely significant effects on the environment of
implementing the plan or programme and propose measures to avoid, manage or mitigate any significant
adverse effects and to enhance any beneficial effects. The purposes of the Strategic Environmental
Assessment are to:
Identify the potentially significant environmental effects of the plan in terms of the feasible and
preferred water resource management options being considered;
Help identify appropriate measures to avoid, reduce or manage adverse effects and to enhance
beneficial effects associated with the implementation of the plan wherever possible;
Give the statutory Strategic Environmental Assessment bodies, stakeholders and the wider public
the ability to see and comment upon the effects that the plan may have on them, their
communities and their interests;
Encourage them to make responses and suggest improvements to the draft plan; and
70 Defra 2012 biodiversity metric. https://assets.publishing.service.gov.uk/government/uploads/system/uploads/attachment_data/file/69531/pb13745-bio-technical-paper.pdf 71 The 25 Year plan states that the government will “embed an environmental net gain principle for development”. While there is a metric for biodiversity net gain, there is currently no industry ready metric to account for ecosystem services. A Defra tool based on the biodiversity net gain metric (referenced above) is currently being developed for environmental net gain. https://assets.publishing.service.gov.uk/government/uploads/system/uploads/attachment_data/file/693158/25-year-environment-plan.pdf
United Utilities Final Water Resources Management Plan 2019
© United Utilities Water Limited 2019 Page 102 of 191
Inform our selection of water management options to be taken forward into the final plan.
The Strategic Environmental Assessment has assessed the likely economic, social and environmental effects
of proposed water management options and has identified ways in which adverse effects can be minimised
and positive effects enhanced. We have used the results of this piece of work to indicate where there are
significant potential impacts against the Strategic Environmental Assessment objectives and screened out
options that failed this test.
The preferred plan has been subject to a final environmental appraisal (i.e. to reflect in-combination
impacts), as outlined in Section 7.4, taking account of Strategic Environmental Assessment, Habitats
Regulation and Water Framework Directive elements of environmental appraisal.
5.4.3 Habitats Regulation Assessment
The Conservation of Habitats and Species Regulations 2010 (as amended) (the ‘Habitats Regulations’)
require a Competent Authority to have regard to the requirements of the Habitats Directive in the exercise
of any of its functions. Water companies have a statutory duty to prepare a Water Resources Management
Plan and are therefore the Competent Authorities for these plans under the Habitats Regulations.
The Regulations require that Competent Authorities assess the potential impacts of plans and programmes
on the Natura 2000 network of European protected sites in a process is known as Habitats Regulations
Assessment. It determines whether there will be any ‘likely significant effects’ of a Water Resources
Management Plan on any European site as a result of a plan’s implementation (either on its own or ‘in
combination’ with other plans or projects) and, if so, whether these effects will result in any adverse effects
on the site’s integrity.
The findings of the Habitats Regulations Assessment have been used to inform the assessment of options
as part of the Strategic Environmental Assessment process, and in particular the assessment of options
against Strategic Environmental Assessment Objective 1: To protect and enhance biodiversity, key habitats
and species, working within environmental capacities and limits (see Section 5.4.2). We have used the
results of this piece of work to indicate where there are significant potential impacts documented as part of
the Habitats Regulations Assessment process and screened out options accordingly.
5.4.4 Water Framework Directive
Each new feasible option has been assessed to identify whether they will comply with the Water
Framework Directive. Separate assessments have been completed for each waterbody or Protected Area
which could be impacted by the options. The assessments have determined if the options in the plan could:
Cause a deterioration at element or waterbody level (only relevant elements based on the
waterbody designation will be assessed);
Prevent the achievement of River Basin Management Plan objectives; and/or
Prevent the achievement of Protected Area objectives.
The findings of the Water Framework Directive Assessment have been used to inform the assessment of
options as part of the Strategic Environmental Assessment process, and in particular the assessment of
options against Strategic Environmental Assessment Objective 3: To protect and enhance the quantity and
quality of surface and groundwater resources and the ecological status of water bodies.
United Utilities Final Water Resources Management Plan 2019
© United Utilities Water Limited 2019 Page 103 of 191
We have used the results of this piece of work to indicate where there are significant potential impacts
documented as part of the Water Framework Directive process and screened out options accordingly.
5.4.5 Water available for use and climate change assessments
Each option was assessed to determine its water available for use benefit or, in the case of demand
options, supply-demand balance benefit. This is to identify the usefulness of each option within our supply
system, rather than just the option capacity values alone. We have also considered how resource options
could be affected by climate change impacts and whether there is a risk of the option not delivering its
intended capacity or water available for use benefit. Options have been screened out if either of these
components indicated an insignificant water available for use benefit or a significant impact due to climate
change factors.
Based on all of these results, a final list of options was presented for appraisal, termed the constrained
option set. Those options that fail secondary screening are placed into the rejected options register which
at this stage, are not to be considered further. However, rejected options could be reconsidered if the
supply-demand requirements required an alternative approach that could not be met by the constrained
option set alone.
5.5 Constrained options and options appraisal
The outputs of the secondary screening have been used to inform options appraisal. Our options
identification process resulted in 145 constrained options. This has enabled us to consider a wide variety of
potential schemes to address the future challenges in our resource zones, which will subsequently be
assessed as part of our plans and through our options appraisal process, as detailed in Section 7.2.
It is also important to note that we will continue to progress activities associated with identifying and
developing plan options to inform future plan reviews. In particular, building upon our own market
engagement process, Ofwat has determined the need for each of the water companies to publish a bid
assessment framework for options. The aim of the bid assessment framework is to develop a wider bidding
market for water resources options, and we will be submitting our proposed approach to Ofwat as part of
our Business Plan. In addition, as part of our current process, any rejected options will also continue to be
held on register, and if further information comes to light in future then these may be considered in future
planning rounds.
In accordance with the Environment Agency position statement on the risk of transfer on Invasive Non
Native Species (INNS), we have considered whether the constrained options that form part of the preferred
plan could pose a risk (Section 7.4.5). Specifically, to consider if any of the options proposed in the plan link
isolated catchments, or if the catchments are already connected. This will dictate whether the scheme
needs mitigation measures in place and/or whether an assessment of the increased risk posed by the
scheme needs to be carried out. We recognise that the risk assessments will have to be considered in
further detail if the preferred plan is formally adopted, but we are not proposing any further analysis at this
stage. Further detail on our preliminary risk assessment can be found in the Final WRMP19 Technical
Report - Options appraisal. We have also assessed our existing transfers as outlined in our Final WRMP19
Technical Report - Supply forecasting.
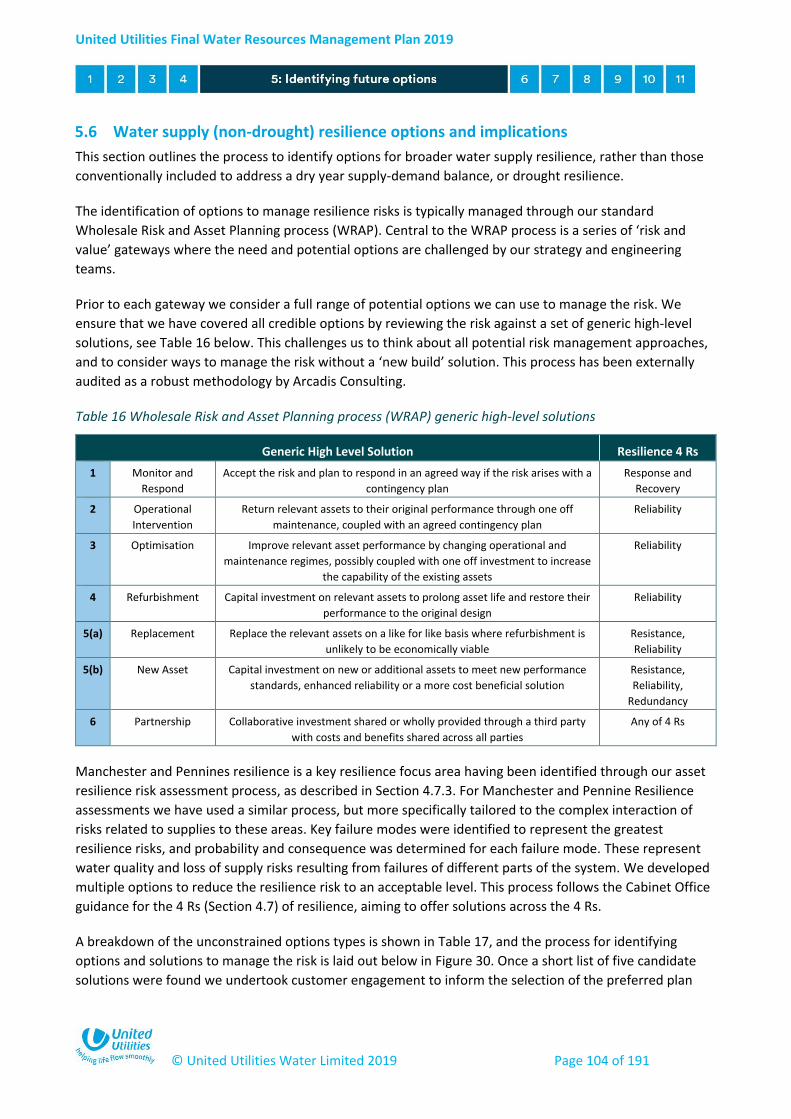
United Utilities Final Water Resources Management Plan 2019
© United Utilities Water Limited 2019 Page 104 of 191
5.6 Water supply (non-drought) resilience options and implications
This section outlines the process to identify options for broader water supply resilience, rather than those
conventionally included to address a dry year supply-demand balance, or drought resilience.
The identification of options to manage resilience risks is typically managed through our standard
Wholesale Risk and Asset Planning process (WRAP). Central to the WRAP process is a series of ‘risk and
value’ gateways where the need and potential options are challenged by our strategy and engineering
teams.
Prior to each gateway we consider a full range of potential options we can use to manage the risk. We
ensure that we have covered all credible options by reviewing the risk against a set of generic high-level
solutions, see Table 16 below. This challenges us to think about all potential risk management approaches,
and to consider ways to manage the risk without a ‘new build’ solution. This process has been externally
audited as a robust methodology by Arcadis Consulting.
Table 16 Wholesale Risk and Asset Planning process (WRAP) generic high-level solutions
Generic High Level Solution Resilience 4 Rs
1 Monitor and
Respond
Accept the risk and plan to respond in an agreed way if the risk arises with a
contingency plan
Response and
Recovery
2 Operational
Intervention
Return relevant assets to their original performance through one off
maintenance, coupled with an agreed contingency plan
Reliability
3 Optimisation Improve relevant asset performance by changing operational and
maintenance regimes, possibly coupled with one off investment to increase
the capability of the existing assets
Reliability
4 Refurbishment Capital investment on relevant assets to prolong asset life and restore their
performance to the original design
Reliability
5(a) Replacement Replace the relevant assets on a like for like basis where refurbishment is
unlikely to be economically viable
Resistance,
Reliability
5(b) New Asset Capital investment on new or additional assets to meet new performance
standards, enhanced reliability or a more cost beneficial solution
Resistance,
Reliability,
Redundancy
6 Partnership Collaborative investment shared or wholly provided through a third party
with costs and benefits shared across all parties
Any of 4 Rs
Manchester and Pennines resilience is a key resilience focus area having been identified through our asset
resilience risk assessment process, as described in Section 4.7.3. For Manchester and Pennine Resilience
assessments we have used a similar process, but more specifically tailored to the complex interaction of
risks related to supplies to these areas. Key failure modes were identified to represent the greatest
resilience risks, and probability and consequence was determined for each failure mode. These represent
water quality and loss of supply risks resulting from failures of different parts of the system. We developed
multiple options to reduce the resilience risk to an acceptable level. This process follows the Cabinet Office
guidance for the 4 Rs (Section 4.7) of resilience, aiming to offer solutions across the 4 Rs.
A breakdown of the unconstrained options types is shown in Table 17, and the process for identifying
options and solutions to manage the risk is laid out below in Figure 30. Once a short list of five candidate
solutions were found we undertook customer engagement to inform the selection of the preferred plan

United Utilities Final Water Resources Management Plan 2019
© United Utilities Water Limited 2019 Page 105 of 191
(Sections 6.4.5 and 7.4). We also carried out environmental appraisals (environmental and social costing,
Strategic Environmental Assessment, Habitats Regulations Assessment and Water Framework Directive
Assessment) using the methodology as explained in Section 5.4.
Further detail on the options identification process for the Manchester and Pennine Resilience scheme is
included in the Final WRMP19 Technical Report – Water supply resilience (and specifically Appendix A
within that document).
Table 17 Summary of the number of options developed at the unconstrained stage
Option category Unconstrained options
Demand management 38
Distribution* 115
Operational intervention and optimisation** 35
Quality 125
Resource 121
Total 434
* Note that since the draft WRMP three options have been reclassified from distribution into other categories
** This includes a wide range of operational response / recovery options to allow us to respond effectively if the risk arises and
return relevant assets to operation, coupled with an agreed contingency plan
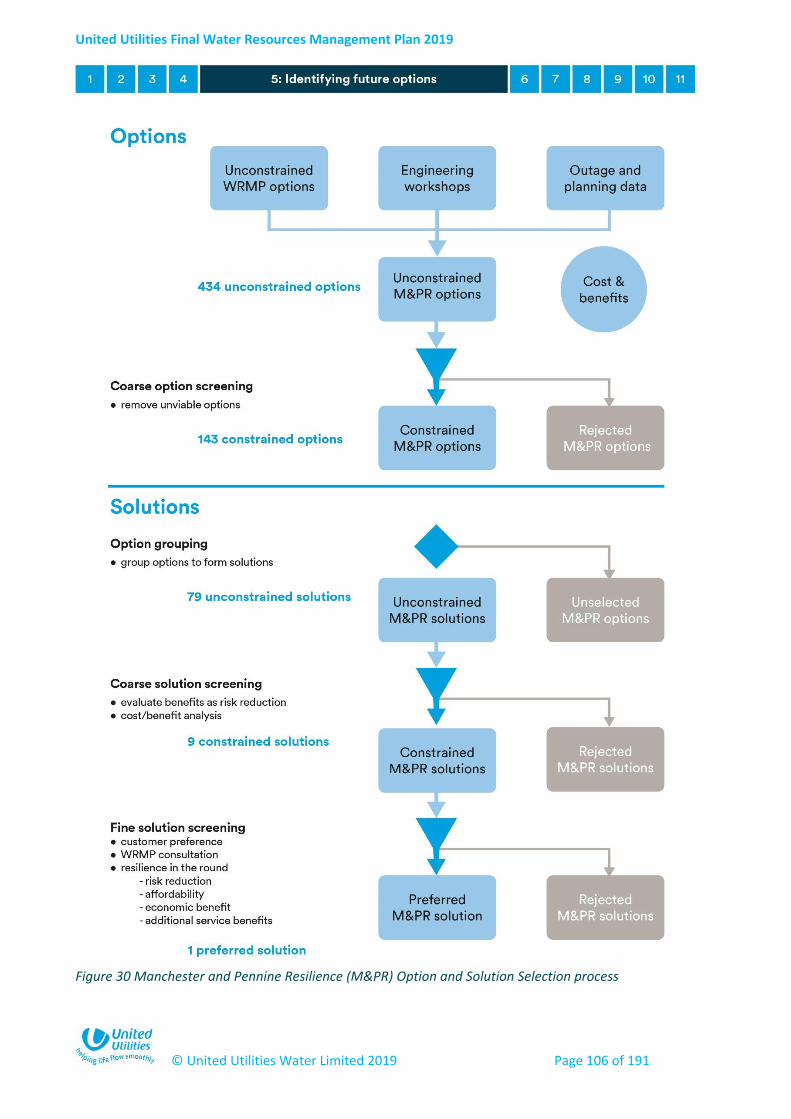
United Utilities Final Water Resources Management Plan 2019
© United Utilities Water Limited 2019 Page 106 of 191
Figure 30 Manchester and Pennine Resilience (M&PR) Option and Solution Selection process

United Utilities Final Water Resources Management Plan 2019
© United Utilities Water Limited 2019 Page 107 of 191
6 Strategic choices for our region
6.1 Overview of strategic choices
In this Water Resources Management Plan we have forecast available supply and future demand for the 25-
year period to 2045. Our analysis has demonstrated that we have a supply-demand surplus in our resource
zones until very late into the planning horizon. The draft plan showed a surplus through the whole planning
horizon, but our final plan shows a very small baseline deficit in the Strategic Resource Zone that is more
than addressed by our plans to enhance leakage reduction (Section 6.2). Beyond the supply demand
balance we have taken the opportunity to consider a number of ‘strategic choices’ in order to help protect
and, where possible, benefit customers and the environment. The strategic choices are related to:
Enhanced leakage reduction;
Improved levels of service;
Increased water supply resilience to non-drought hazards; and
National water trading.
The strategic choices have been developed principally in response to the views of customers, regulators
and other stakeholders. In the remainder of this section we set out the rationale behind each choice and
explain how it has been defined. The strategic choices are then combined into a series of ‘alternative plans’
before we complete an options appraisal process to determine which interventions are required and the
necessary level of investment (Section 7).
Key points
In this section, we also consider the opportunity to make some further ‘strategic
choices’ to protect and, where possible, benefit customers and the environment (as
opposed to simply ensuring a supply-demand balance).
The strategic choices have been developed principally in response to the views of
customers, regulators and other stakeholders. They include: enhanced demand
management, improved level of service, improved water supply resilience to non-
drought hazards, and the potential for water trading.
Our draft plan baseline supply-demand position showed a surplus in all of our
resource zones. The baseline in the final plan shows a very small deficit at the end of
the planning horizon in the Strategic Resource Zone, which is more than addressed
through our proposed leakage reductions.
Following consultation, we have updated our strategic choices based on the feedback
received. In particular, we have further enhanced our leakage reduction aspirations
and confirmed the proposed solution for water supply resilience.
United Utilities Final Water Resources Management Plan 2019
© United Utilities Water Limited 2019 Page 108 of 191
6.2 Enhancing leakage reduction
Demand management is a significant component of our approach to safeguarding the future of our water
supply and the environment. It is a key government priority as, for example, set out in Defra’s guiding
principles. It has an important role to play in managing the supply-demand balance across the planning
horizon, and can benefit resilience to future uncertainty and change. Our baseline demand management
activities are defined in Section 4.2.
Of areas in which we can manage demand, there are particularly strong feelings around leakage; it is
consistently raised as a key concern when we consult with customers and stakeholders. Our regulators
have set out a clear requirement to further reduce leakage, and in its recent draft methodology for PR19
Business Plans, Ofwat challenged companies to make a further 15% reduction during the period 2020-2025.
It is important to reiterate that if we maintain leakage at existing levels, as per our baseline activities
(Section 4.2.2), we will be operating well below the short run sustainable economic level of leakage
(SELL)72. This means that any further reductions will have an associated cost which needs to be taken into
account as we define the strategic choice. This cost has the potential to impact customer bills and our
ability to address customers’ other priorities; we need to ensure that all changes we make are overall
affordable to customers and have factored in their preference and valuation of demand side options
relative to new supply options. We therefore need to ensure that further reductions are assessed in terms
of the costs that have the potential to impact customer bills and our ability to address other customers’
priorities, but also recognise that there is an avoided cost if reducing leakage defers or removes the
requirement for supply side options.
In addition to the total level of leakage reduction, we also need to consider the pace at which it can be
delivered, both in terms of affordability and technical feasibility. In particular, our options identification
process has identified some innovative leakage reduction solutions that require further investigation.
Therefore, reducing leakage in a progressive way potentially allows us to make these savings in a more cost
effective manner for customers. We have considered this in defining this strategic choice and our preferred
plan (Section 7), and explored a range of choices to determine our approach (as described in detail within
Final WRMP19 Technical Report - Options appraisal).
We have conducted a wide range of specific customer research on leakage, as outlined in our Final
WRMP19 Technical Report - Customer and stakeholder engagement. This has shown that, as always, there
is very strong support for leakage reduction. However, it also shows that there are limits and any customer
valuations for leakage reduction are finely balanced with the corresponding costs as shown by the
customer panel leakage survey. In our latest and most advanced piece of water resources research, the
Programme Customer Choice experiment73, an average reduction of 51 Ml/d was selected by customers
once costs and other potential water resource type priorities such as level of service (Section 2.5) were
taken into account. This amount corresponds to around 12% of our current leakage level.
Programme acceptability testing has been also used to inform this final Water Resources Management
Plan, and assessed leakage choices against potential wider water and wastewater investment in our
72 Our Final WRMP19 Technical Report - Demand for water provides an explanation of our SELL and baseline
73 This is an interactive tool to allow customers to ‘build their own’ Water Resources Management Plan.

United Utilities Final Water Resources Management Plan 2019
© United Utilities Water Limited 2019 Page 109 of 191
business planning process. This assessed a range of leakage reductions from 0 to 40%, with rising
incremental costs (presented as bill impacts) of delivering reductions. In terms of overall bill impact, 67% of
customers supported a bill impact of £1 or more, and 44% a bill impact of £2 or more, with the median
level of acceptability in terms of bill impact at £1.74. Following further exploration of leakage innovations
and options for the final plan, this level of acceptability is between the average annual bill impact of £1.56,
and the maximum annual bill impact of £1.96 that we estimate to reduce leakage by 20% in line with the
Ofwat aspiration74. However, the research shows broad support for us to go further than our proposals in
the draft Water Resources Management Plan.
As shown in Table 19, our draft Water Resources Management Plan proposed a reduction of 30 Ml/d (7%)
below the baseline level by 2025, and 80 Ml/d (18%) by the end of the 25-year planning horizon in 2045.
Consultation responses on our leakage proposals were overwhelming in providing a very clear steer that,
whilst there was support in us making a step change to reduce leakage, we had not been ambitious
enough75. At consultation, thirteen respondents raised the topic of leakage reduction in their
representation through formal comments. Whilst the respondents supported our proposal for further
leakage reductions, twelve said that we should adopt a more ambitious target, of which three respondents
recommended that we specifically meet Ofwat’s challenge of a 15% leakage reduction by 2025. One
response supported the specific proposals in the draft plan, and recognised that innovation was required to
help finding smaller leaks to improve the economics of managing leakage at lower levels over time. Both
Ofwat and the Environment Agency challenged us to be more ambitious, as well as the majority of other
stakeholders.
Taking account of customer, stakeholder and regulator feedback, along with consideration of our latest
assessment of leakage options costs (using further work to explore innovative approaches), and the tighter
baseline supply-demand balance evident in the final plan, we have increased our leakage aspirations.
In our revised draft plan, we included a reduction of 190Ml/d (over 40%) by 2044/45, in line with the
National Infrastructure Commission’s long term aspiration to halve leakage by 2050. We proposed to
deliver 67Ml/d of this reduction (15%) by the end of 2024/25. However, in their initial assessment of our
proposed business plan for 2020-2025, Ofwat challenged us to bring forward some of our planned leakage
reduction activities to achieve an even higher reduction during the period 2020-25. Recognising the
importance that our stakeholders, customers and regulators place on reducing leakage, we have now
included in our final plan a reduction of 91Ml/d (20%) by 2024/25.
There are a number of reasons for and against making a significant reduction and step change in leakage.
However, on balance we believe there is sufficient evidence to increase our aspirations from those
presented in the draft plan. There are a range of factors to consider when setting future leakage targets
and reductions. Table 18 summarises the key drivers and considerations behind the decision we have taken
to further enhance leakage reductions. We have presented these in a ‘PESTLE’ table to represent political,
74 Following further exploration of leakage innovations and options costs for the final Water Resources Management Plan.
75 Feedback at the consultation events, albeit informal feedback, also correlated well with the formal responses received. During
interactive sessions, 25 people voted in favour of leakage reductions as a priority. The majority (84%) of voters supported greater
reductions in leakage than we proposed in our draft plan, with 46% supporting a 15% reduction from baseline (or beyond).

United Utilities Final Water Resources Management Plan 2019
© United Utilities Water Limited 2019 Page 110 of 191
environmental, social, technological, legislative and economic considerations and drivers for reducing
leakage.
Table 18 PESTLE considerations76 (Political, Environmental, Social, Technological, Legislative and Economic)
for further leakage reductions
PESTLE category Key drivers and considerations
We are an industry outlier using leakage per km and per property metrics at regional level
Reducing demand, including leakage, is a strategic government priority and stakeholder
responses have asked us to do more than we set out in our draft plan
Reducing leakage further below baseline is beneficial for the environment
Reducing leakage helps to mitigate the risk of longer-term uncertainty such as climate
change and impact positively in relation to levels of service and resilience
Customers and stakeholders strongly support reducing leakage and wanted us to be more
ambitious than our draft plan
The general public and media perceive current leakage levels as being too high, resulting in
reputational issues for the industry and resistance against customer water use restrictions
during drought
Having a high level of leakage is unlikely to help in persuading customers to reduce their
own consumption
There are a range of new tools and technologies that are becoming available
Technology and innovation is expected to drive efficiency and change the economics of
leakage management
There is not a specific legislative driver, however, Ofwat has challenged the industry to set
more challenging and stretching leakage reduction targets, or justify why this is not
appropriate for a particular company
Customers supported on average a 12% reduction in leakage from the Programme Choice
experiment that considered wider affordability and bill impact.
Customer valuations from acceptability testing support the 20% reduction
Customer acceptance of bill impact associated with the planned reduction of 20% is
supportive.
Table 19 below summarises the enhancement we proposed in our draft and revised draft plans, and the
revised leakage reduction enhancement aspirations now included in our final plan.
76 EU Reference – ‘Good Practice in Leakage Management’ – Main Report, 2015
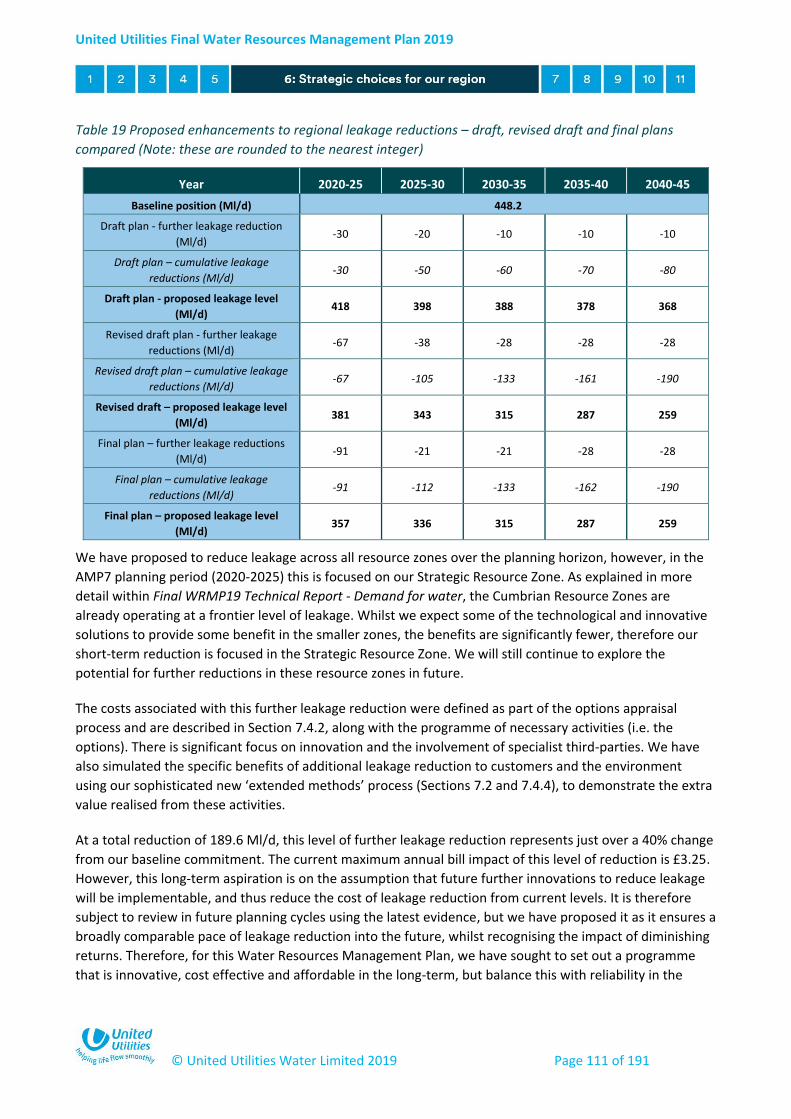
United Utilities Final Water Resources Management Plan 2019
© United Utilities Water Limited 2019 Page 111 of 191
Table 19 Proposed enhancements to regional leakage reductions – draft, revised draft and final plans
compared (Note: these are rounded to the nearest integer)
Year 2020-25 2025-30 2030-35 2035-40 2040-45
Baseline position (Ml/d) 448.2
Draft plan - further leakage reduction
(Ml/d) -30 -20 -10 -10 -10
Draft plan – cumulative leakage
reductions (Ml/d) -30 -50 -60 -70 -80
Draft plan - proposed leakage level
(Ml/d) 418 398 388 378 368
Revised draft plan - further leakage
reductions (Ml/d) -67 -38 -28 -28 -28
Revised draft plan – cumulative leakage
reductions (Ml/d) -67 -105 -133 -161 -190
Revised draft – proposed leakage level
(Ml/d) 381 343 315 287 259
Final plan – further leakage reductions
(Ml/d) -91 -21 -21 -28 -28
Final plan – cumulative leakage
reductions (Ml/d) -91 -112 -133 -162 -190
Final plan – proposed leakage level
(Ml/d) 357 336 315 287 259
We have proposed to reduce leakage across all resource zones over the planning horizon, however, in the
AMP7 planning period (2020-2025) this is focused on our Strategic Resource Zone. As explained in more
detail within Final WRMP19 Technical Report - Demand for water, the Cumbrian Resource Zones are
already operating at a frontier level of leakage. Whilst we expect some of the technological and innovative
solutions to provide some benefit in the smaller zones, the benefits are significantly fewer, therefore our
short-term reduction is focused in the Strategic Resource Zone. We will still continue to explore the
potential for further reductions in these resource zones in future.
The costs associated with this further leakage reduction were defined as part of the options appraisal
process and are described in Section 7.4.2, along with the programme of necessary activities (i.e. the
options). There is significant focus on innovation and the involvement of specialist third-parties. We have
also simulated the specific benefits of additional leakage reduction to customers and the environment
using our sophisticated new ‘extended methods’ process (Sections 7.2 and 7.4.4), to demonstrate the extra
value realised from these activities.
At a total reduction of 189.6 Ml/d, this level of further leakage reduction represents just over a 40% change
from our baseline commitment. The current maximum annual bill impact of this level of reduction is £3.25.
However, this long-term aspiration is on the assumption that future further innovations to reduce leakage
will be implementable, and thus reduce the cost of leakage reduction from current levels. It is therefore
subject to review in future planning cycles using the latest evidence, but we have proposed it as it ensures a
broadly comparable pace of leakage reduction into the future, whilst recognising the impact of diminishing
returns. Therefore, for this Water Resources Management Plan, we have sought to set out a programme
that is innovative, cost effective and affordable in the long-term, but balance this with reliability in the
United Utilities Final Water Resources Management Plan 2019
© United Utilities Water Limited 2019 Page 112 of 191
shorter term. A reduction of 91 Ml/d (or 20%) below the baseline during 2020-2025 seeks to balance the
pace of reduction against customer priorities and affordability (based on the latest evidence), as well as
practical considerations and recognition of our supply-demand balance position.
Leakage reduction can be implemented incrementally and in stages, with considerable flexibility in
comparison to some supply options, and does not require the same level of initial commitment that a
supply option may require. The pace of reduction can be increased or reduced accordingly over time, and
based on the needs of future plans. Committing to a reduction of 20% by 2024/25 does not expose
customers to undue risk, as leakage reduction options are all scalable in comparison to a new supply
option. This provides a degree of flexibility that can assess the relative costs and benefits, and either
accelerate or decelerate the pace of reduction in future planning cycles as required.
6.2.1 Future reporting of leakage
Like all companies, in future we are required to report leakage in line with a consistent new definition for
reporting leakage (sometimes known as ‘leakage convergence’). We are in the process of shadow reporting
against this updated definition to Ofwat, and will continue to do so until 2020. We have made considerable
progress in working towards compliance with the new industry definition between 2016/17 and 2017/18.
For our final plan, we have based this on the old definition of reporting, as we did not have sufficient data
available at the time of producing the plan to fully migrate to the new reporting definitions.
Therefore, our tables relate to the old definition for reporting. Our latest current information is that the
change to the new definition would result in reporting total leakage 4.1 Ml/d lower using the new
definition, than we have using the old reporting definition, and this is a change of less than 1%.
The change in reporting of leakage is purely a change in reporting; it does not affect the actual amount of
water lost through leakage. As a methodological adjustment, it does not affect actual leakage levels, and
hence the way this strategic choice is defined. We are committed to reducing leakage in Ml/d terms as set
out in this plan, therefore any reporting/methodological changes do not change the reduction in leakage
that is being proposed in real, volumetric terms. Any reporting changes will be clearly explained in our
annual WRMP reviews.
Ofwat have also asked for leakage to be reported as a three-year average in the Business Plan, to remove
the impact of variability due to different weather that can have a significant annual effect. When a
reduction in leakage is being made, this averaging introduces a lag effect as the preceding years will have
higher levels of leakage. This means that a 20% reduction by 2024/25 using the annual values will be less
when expressed as a three year average, with a 14% reduction by 2024/25 based on the reduction profile
we have developed from our programme. Once leakage stabilises and reaches a plateau then the lag effect
is reduced. This is an important point to note in terms of making any comparisons between business plans
and the WRMP. In Table 20 below we provide a comparison of the annual reductions, expressed as a three-
year average and as a percentage change from the WRMP baseline, to ensure that there is clarity and
alignment between the plans.
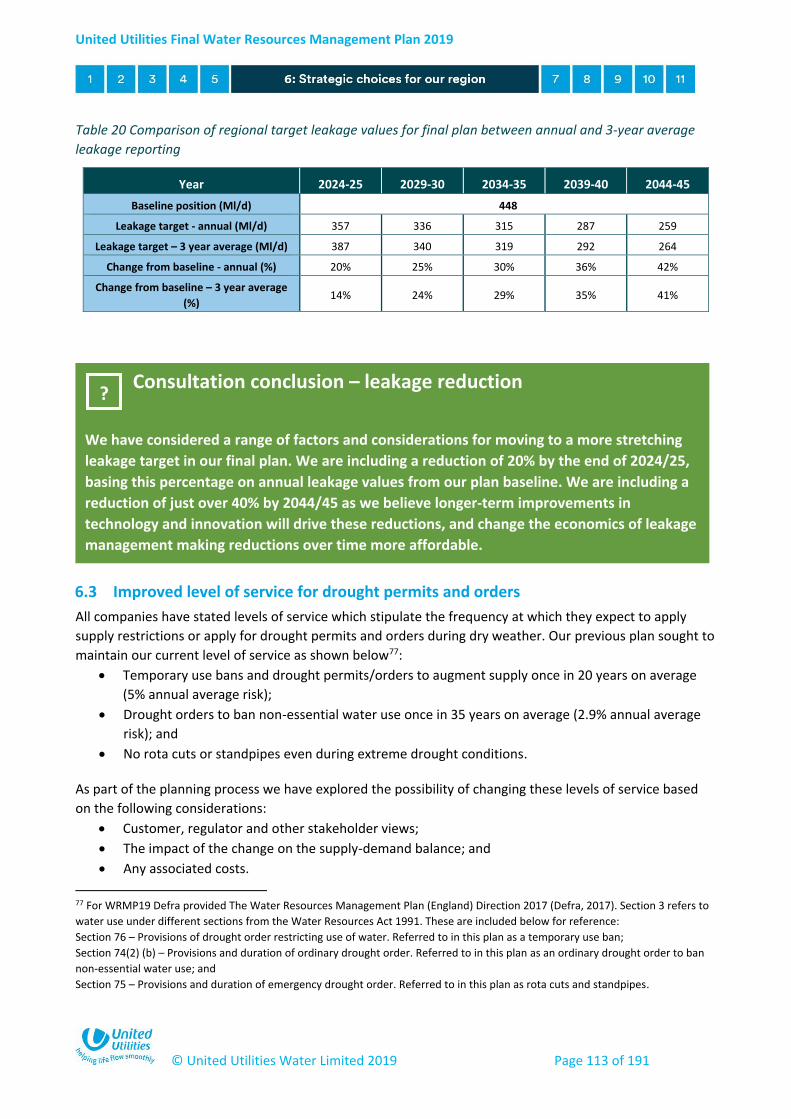
United Utilities Final Water Resources Management Plan 2019
© United Utilities Water Limited 2019 Page 113 of 191
Table 20 Comparison of regional target leakage values for final plan between annual and 3-year average
leakage reporting
Year 2024-25 2029-30 2034-35 2039-40 2044-45
Baseline position (Ml/d) 448
Leakage target - annual (Ml/d) 357 336 315 287 259
Leakage target – 3 year average (Ml/d) 387 340 319 292 264
Change from baseline - annual (%) 20% 25% 30% 36% 42%
Change from baseline – 3 year average
(%) 14% 24% 29% 35% 41%
6.3 Improved level of service for drought permits and orders
All companies have stated levels of service which stipulate the frequency at which they expect to apply
supply restrictions or apply for drought permits and orders during dry weather. Our previous plan sought to
maintain our current level of service as shown below77:
Temporary use bans and drought permits/orders to augment supply once in 20 years on average
(5% annual average risk);
Drought orders to ban non-essential water use once in 35 years on average (2.9% annual average
risk); and
No rota cuts or standpipes even during extreme drought conditions.
As part of the planning process we have explored the possibility of changing these levels of service based
on the following considerations:
Customer, regulator and other stakeholder views;
The impact of the change on the supply-demand balance; and
Any associated costs.
77 For WRMP19 Defra provided The Water Resources Management Plan (England) Direction 2017 (Defra, 2017). Section 3 refers to
water use under different sections from the Water Resources Act 1991. These are included below for reference:
Section 76 – Provisions of drought order restricting use of water. Referred to in this plan as a temporary use ban;
Section 74(2) (b) – Provisions and duration of ordinary drought order. Referred to in this plan as an ordinary drought order to ban
non-essential water use; and
Section 75 – Provisions and duration of emergency drought order. Referred to in this plan as rota cuts and standpipes.
Consultation conclusion – leakage reduction
We have considered a range of factors and considerations for moving to a more stretching
leakage target in our final plan. We are including a reduction of 20% by the end of 2024/25,
basing this percentage on annual leakage values from our plan baseline. We are including a
reduction of just over 40% by 2044/45 as we believe longer-term improvements in
technology and innovation will drive these reductions, and change the economics of leakage
management making reductions over time more affordable.
?
United Utilities Final Water Resources Management Plan 2019
© United Utilities Water Limited 2019 Page 114 of 191
As set out in our Final WRMP19 Technical Report - Supply forecasting, we determined the supply-demand
requirement for a range of level of service improvements for temporary use bans and drought permits and
orders. Unlike in the previous 2015 Water Resource Management Plan, we did not assess a deterioration in
level of service as it was clear from that plan, and from the pre-consultation exercise, that this would be
unpalatable to customers and stakeholders. Using the supply-demand requirements we were then able to
estimate the costs to implement the improved levels of service, and then compare these against
quantitative customer research.
As outlined in our Final WRMP19 Technical Report - Customer and stakeholder engagement, customer
research in this area presents a mixed response between different surveys. Quantitative research to assess
customer acceptability at different level of service levels78 assessment indicated a high level of acceptability
for the status quo, with only marginal differences in acceptability between service levels. However, a water
resources focused willingness to pay assessment, completed as part of the same survey, suggests a very
high customer valuation for improvement once these are aggregated across the whole customer base79.
This is particularly true for drought permits and orders to augment supply once the cost to implement is
taken into account (refer to our Final WRMP19 Technical Report – Options appraisal). Similarly, our
customer choice experiment indicated customers might tolerate marginally worse levels of service for
water use restrictions, and marginally better levels of service for drought permits/orders to augment supply
at an average of 1 in 24 years (4.2% annual average risk). Overall, we have interpreted this research as
showing that customers do place some value on improved levels of service, but not to the extent that this
would be a priority investment driver in its own right.
Some of our stakeholders have particularly strong views about the planned frequency of drought permits to
augment supply and would like to see an improvement in this area. In addition to the general expectation
of all companies to explore different levels of service, as part of the Water Resources Management Plan
pre-consultation process, the Environment Agency specifically requested that we explore the possibility of
making drought permit applications only once we have implemented a temporary use ban (i.e. a hosepipe
ban). In practice this would mean implementing the drought permit/orders to augment supply later and,
therefore, at a lower frequency than a temporary use ban.
Research presented in our Water Resources Management Plan 2015 led us to the conclusion that
customers would be willing to pay for an improvement in the level of service for drought permits and
orders to augment supply, but not temporary use bans. We said that we would continue to explore this in
the next plan and, taken on balance, our new research points us to the same conclusion. Therefore, the
definition of this strategic choice is to reduce the stated frequency of drought permits/orders to augment
supply from 1 in 20 years on average to 1 in 40 years on average (from 5% to 2.5% annual average risk). We
are not proposing to change the frequency of temporary use bans at this stage as there is no evidence to
demonstrate customer support of changes in this area.
78 This has been completed using a technique called ‘Gabor Granger’ analysis. 79 It is important to note that customer valuations were higher to avoid deterioration in levels of service. We have also tried to
reduce our reliance on traditional willingness to pay methods in this planning round, and balance these with more innovative and
alternative approaches to derive customer valuations, as described.
United Utilities Final Water Resources Management Plan 2019
© United Utilities Water Limited 2019 Page 115 of 191
We have used our water resource models to estimate the size of supply-demand enhancement required to
reduce the frequency of drought permits/orders to augment supply to this level. We did this by looking at
the benefit we get from them during a severe drought, and considering how we might replace them with
other types of options to avoid a loss of resilience. This process is explained in our Final WRMP19 Technical
Report - Supply forecasting and the required enhancement is estimated to be around 10 Ml/d.
Given the results of our customer engagement, rather than invest directly in new options to facilitate this
strategic choice we have decided to link it to the previous choice to enhance leakage reduction, as a
supplementary benefit of these activities. There is a supply-demand benefit of 91 Ml/d from leakage
reduction by 2025, which exceeds the requirement80 to move to a 1 in 40 year frequency for drought
permits and orders to augment supply (2.5% annual average risk). Therefore, the timing of this strategic
choice is to state the improved level of service from 2025 onwards. This is consistent with the outcomes of
our customer engagement, whereby customers do place some value on improvements in this area, but do
not consider it a strong relative investment priority in its own right. It also means that from 2025 we would
be able to implement temporary use bans before applying for drought permits/orders to augment supply.
It should be noted that whilst the formal stated minimum level of service is proposed to be changed at the
end of the next 5-year planning period, customers and stakeholders would essentially be benefitting from
reduced leakage reductions before this time. The level of service is a stated minimum level, and in practice,
performance should at least be as good as this level, as detailed further in Final WRMP19 Technical Report -
Supply forecasting.
Our proposals were generally supported during consultation. By taking this forward into this updated plan,
this will require further work in the future to consider how it would specifically work in practice (beyond
the strategic change to levels of service), for example, detailed derivation of new drought triggers. Drought
permits/orders to augment supply would likely be implemented at a new lower ‘drought trigger 5’ rather
than the current drought trigger 4. This would be reported and represented in a future Drought Plan upon
implementation of the change in level of service. We have included further explanation of how we would
define a new drought trigger in Appendix D of Final WRMP19 Technical Report - Supply forecasting.
As part of this Water Resources Management Plan we have also explored how our system performs under
extreme drought. To do this we used a range of sophisticated new tools and techniques such as synthetic
hydrology; these are all described in Section 4.4.8 and our Final WRMP19 Technical Report - Supply
forecasting. We have been able to more reliably consider the level of service for non-essential use bans and
emergency droughts orders (i.e. rota cuts, standpipes or bowsers). The analysis demonstrated that we are
resilient to extreme drought and we are able to state improved level of service without requiring any
additional investment.
For non-essential use bans we are able to improve the stated expected frequency from no more than 1 in
35 years on average to more than 1 in 80 years (moving from 2.9% to 1.25% annual average risk), reflecting
the point at which we would expect these to be implemented in line with our Drought Plan. For emergency
droughts orders we can demonstrate that we are able to meet a frequency of no more than 1 in 200 years
80 Noting the resulting surplus level may differ by 2025 and beyond, driven by inherent uncertainties in the supply-demand balance
as covered in Section 9.
United Utilities Final Water Resources Management Plan 2019
© United Utilities Water Limited 2019 Page 116 of 191
on average (0.5% annual average risk), Defra’s new reference level of service, and this is expanded upon in
the next section. This does not constitute an improvement in the level of service statement as such, but
adds context to our existing position that they are unacceptable, even in extreme droughts. Our proposed
future level of service with our preferred plan in place is shown in Section 7.4.
6.3.1 Investing to increase resilience to extreme droughts
In Section 4.4.8 we outlined how we have tested the resilience of our supply system to more extreme
droughts than those in the historic record. This demonstrates that we already have a resilient system that is
able to withstand at least a 1 in 200 year event (that has 0.5% annual average risk), correlating with Defra’s
reference level of service for emergency drought orders (standpipes, rota-cuts and bowsers).
As part of this strategic choice we considered improving resilience to droughts even further. However,
given that we are already resilient to extreme droughts there is no significant reason to improve. This
position was reinforced by our research that indicated there was no customer support to invest to improve
further. Level of service acceptability surveys indicated that the level of acceptance of different drought
severities between 1 in 100 year (1% annual average risk) and 1 in 1000 years (0.1% annual average risk)
didn’t vary significantly, a theme that was also consistent when tested with a small number of stakeholders
in our Technical Stakeholder Group. Subsequent research for the revised draft plan has further verified this
conclusion, even when customers were shown relative drought resilience to those of other companies.
In advance of considering whether to improve our resilience to extreme droughts, and in line with the
planning guidelines, we developed drought resilience options mirroring all of the supply measures in our
Drought Plan. These correspond to actions linked to levels of service such as implementing drought permits
and orders to augment supply, but also include disused sources that we don’t include in our deployable
output calculation (Section 4.4.2). Whilst these measures would be implemented in a repeat of some of the
historic droughts that have traditionally been covered by the Water Resources Management Plan process,
their role is to protect us if the drought develops into something more severe than we have experienced in
the historic record.
Any exercise to improve resilience to extreme droughts should therefore include the existing measures in
the same format as any new options, so that we can ensure that the overall supply configuration is
appropriate. The development of the drought resilience options is described our Final WRMP19 Technical
Report - Options identification and our Final WRMP19 Technical Report - Supply forecasting outlines the
benefits of Drought Plan measures in droughts of different severities, linked to the population of the
Drought Links table detailed in Section 4.4.8.
Consultation conclusion – level of service for drought permits
and orders
The majority of consultees supported our strategic choice to improve our stated minimum
levels of service for drought permits and orders from 1 in 20 years (5% annual chance) to 1 in
40 years on average (2.5% annual chance) by 2025. We have retained this proposal.
?
United Utilities Final Water Resources Management Plan 2019
© United Utilities Water Limited 2019 Page 117 of 191
Whilst at this stage we are not considering further improving our resilience to extreme droughts, the
information provided by this process has allowed us to consider whether our existing configuration is the
most effective way to maintain drought resilience. We focused on the largest drought permits at
Windermere and Ullswater, and compared their average incremental and social cost (AISC) against those
for other types of options. AISC is a whole-life (80 year) cost which, in addition to capital and operating
costs, includes environmental and social costs, as outlined in Section 7.2. As the AISC of these drought
permits was much lower than our other options, this exercise confirmed that it would be inappropriate,
even in the long-term, to make significant investments in other types of options to replace them81. The case
is significantly further strengthened once the likely frequency of use is taken into account (not included in
AISC).
Our proposed future levels of service with the preferred plan in place is shown in Section 7.4.
6.4 Resilience to non-drought hazards
Our baseline resilience position to non-drought hazards is detailed in Section 4.7. In this section we outline
how we consider future resilience to non-drought hazards as a strategic choice.
6.4.1 Customer and stakeholder views
We have carried out a number of targeted assessments of customer and stakeholder views and opinions of
water service resilience, including:
Five events to understand customer and stakeholder priorities;
Traditional willingness to pay stated preference surveys around water service failures;
Natural experiments using operational data reflecting customer contacts and attitudes during
interruptions;
Innovative immersive surveys to expose customers to long duration supply failure issues; and
Comparative online surveys to evaluate customers’ views around water service failures.
Resilience has been consistently ranked as a high priority by the majority of our stakeholders. Whilst there
is little appetite for increasing water bills, there is wide support to prioritise resilience expenditure within
existing budgets. We are confident from our research that customers support our strategy of achieving long
term water supply resilience, delivered at a pace that is affordable, wherever this is economically feasible.
Further detail on how we have assessed our water supply resilience needs can be found in our Final
WRMP19 Technical Report – Water supply resilience.
81 This conclusion is based on our assessment of drought risk and drought permits as options, but does not pre-empt the
conclusions of mitigation studies for the more severe drought permit option at Windermere currently underway.
Consultation conclusion – drought resilience
The majority of consultees supported our conclusion that we already have an appropriate
level of resilience to extreme droughts (without further specific investment), and welcomed
the further improvements as a supplementary benefit of our demand management plan.
?
United Utilities Final Water Resources Management Plan 2019
© United Utilities Water Limited 2019 Page 118 of 191
6.4.2 25-year resilience programme
Through our risk assessment process we have identified our largest resilience risks for priority investment.
This is detailed in Section 4.7 along with the current risk position across our region. During the 2015-2020
period we are already investing around £220 million in targeted water service resilience improvements.
For the future, we have defined a pace of resilience investment that customers support and can afford as
part of our business plan processes. Future investment will be targeted on addressing risks associated with
our regional aqueduct system, some of our most vulnerable treatment works and major supply mains. In
the early part of the planning horizon, investment will mainly be associated with our regional aqueduct
system. Over the longer term we will prioritise investment to address other risks. The interventions will be
across all four ‘R’s and will increase our water service resilience. Managing all of the currently identified
resilience risks to meet the current service level target of very infrequent large scale service failures that
exceed 12 hours is expected to take up to 20 years of future investment (with supply risks falling to around
a quarter over this time, compared to the start of the planning period).
This strategic choice is focused on our approach to manage the highest risk area (Manchester and Pennines
resilience), and described further below.
6.4.3 Prioritising resilience expenditure within existing budgets
As shown in both the previous section and in Section 4.7.3, Manchester and Pennines resilience is a key
resilience focus area. In light of the customer research we are improving our capability to monitor and
respond through a number of improvements that will benefit resilience to Manchester and the Pennines,
and across our region:
Failure contingency planning, including assessment of additional supply, re-zone and alternative
water supplies, and water treatment works contingency plans;
A new 24/7 Integrated Control Centre Network response team is in place to coordinate operational
responses to water treatment work, aqueduct and network failures;
Additional Alternative Supply Vehicle (ASV) provision, to accelerate operational responses;
On-line monitoring and enhanced laboratory analysis;
Installation of ultraviolet rigs for microbiological treatment;
Automated facilities that divert short term deterioration of water quality to waste;
Agricultural land management to protect water quality; and
Progressing a project to address the highest risk section of one of our aqueducts.
These interventions have been made through prioritising within existing budgets in the current investment period and are already reflected in the baseline Manchester and Pennine Resilience risk explained in Section 4.7.3.
6.4.4 Considering further risk reduction
Through the options process explained in Section 5.6, we identified five alternative solutions to further reduce the future Manchester and Pennine resilience risk. These represent a strategic choice between different levels of investment and residual risk. Broadly there is a choice between investing to address only the highest risks relating to deterioration of some tunnel sections of the aqueduct, or to address a wider range of risks.

United Utilities Final Water Resources Management Plan 2019
© United Utilities Water Limited 2019 Page 119 of 191
The two figures below compare the five alternative solutions and through the consultation we sought views
on these, to inform our selection of one solution to take forwards into our final plan. In parallel to the
consultation we carried out in depth qualitative and quantitative customer engagement to inform the
selection. We also carried out further economic and environmental appraisals of the options.

United Utilities Final Water Resources Management Plan 2019
© United Utilities Water Limited 2019 Page 120 of 191
Figure 31 Five solutions for
improving Manchester and
Pennine resilience showing
pros (green boxes) and cons
(red boxes) for each solution

United Utilities Final Water Resources Management Plan 2019
© United Utilities Water Limited 2019 Page 121 of 191
Figure 32 Five solutions
for improving
Manchester and Pennine
resilience showing
likelihood of associated
risks to customer supply
and estimated annual bill
impact of executing each
solution. Note that the
arrows on the right of
each bar denote different
risk levels for each
solution. These
correspond to the colour
coding on the arrows to
the left of the diagram.
These arrows to the left
of Option A on the
diagram show the
baseline risk position and
the nature of the risk to
customers.
United Utilities Final Water Resources Management Plan 2019
© United Utilities Water Limited 2019 Page 122 of 191
Further option specific detail on these five solutions for the Manchester and Pennine Resilience scheme is
included in the Final WRMP19 Technical Report - Water supply resilience (and specifically Appendix A,
Section A6, within that document).
6.4.5 Best option for customers and the environment
We have considered the evidence from customer engagement, consultation, economic and environmental
appraisals to select a preferred solution for Manchester and Pennine Resilience.
We worked closely with YourVoice, our Customer Challenge Group, to engage effectively with customers.
Due to the scale and complexity, it was recognised that it was especially important that customers fully
understood the risks and that the engagement was designed in a way to avoid biasing the results.
YourVoice appointed independent experts from the Centre for Regional Social and Economic Research at
Sheffield Hallam University to review the reasonableness of the research and interpretation of the results.
We addressed all of their feedback before the research was formally launched.
The customer engagement had qualitative and quantitative phases. In the quantitative phase 1,965
household customers and 300 business customers were interviewed to make sure the results were
statistically valid. Customers were presented with information about the options consistent with the
material shown in Section 6.4.4. Customers showed a clear preference for Solution D, which gave a
relatively low residual risk and a bill increase of £11. The relative preference for this solution was eight
times higher than for the status quo. Overall both household and business customers have a statistically
significant preference for Solution D or Solution E, which is a more expensive option with a greater risk
reduction. Sheffield Hallam University concluded: “the research has been conducted in a rigorous manner;
the results capture customer preferences and are robust; the findings provide a sound basis for the
recommendations made.”
At stakeholder events during the consultation period we sought views on the preferred option of those
present. These events included our WRMP events, our regular public health liaison meeting and the
Greater Manchester Green summit. This feedback was consistent with the customer engagement with
Solutions D and E being preferred most often and little support for lower cost, higher residual risk options.
Formal responses to the consultation were generally supportive of including Manchester and Pennines
resilience in the preferred plan, although few respondents chose to express a direct preference for one
option or another. The Environment Agency raised some concerns about those options which included new
or changed abstraction patterns. Natural England noted that the strategic environmental assessment of the
options suggests that Solution D might be preferable in both greatest resilience and minimising
environmental effects. YourVoice expressed support for taking forward either Solution D or E. It said that
consideration will need to be given to whether the additional £4 annual bill impact associated with Solution
E compared to Solution D is justified by the extra reduction in risk that would follow.
In addition to formal consultation responses, following engagement with stakeholders we also received
directly a number of letters relating to the issue. The Greater Manchester Infrastructure Advisory Group,
the Greater Manchester Resilience Forum, and the Mayor of Greater Manchester all welcomed the priority
given to the long-term resilience of water supplies and said that the preferred plan must provide an
appropriate and long-term solution to the issue. The Mayor of Greater Manchester confirmed that the
Greater Manchester Combined Authority (GMCA) formally endorsed his recommendation. The Lancashire

United Utilities Final Water Resources Management Plan 2019
© United Utilities Water Limited 2019 Page 123 of 191
Resilience Forum Local Authorities sub-group expressed support for the need to carry out the works and
said that the group’s preference was for Solution D.
After we submitted evidence, the Drinking Water Inspectorate (DWI) wrote to us commending support for
the proposals and confirming that the proposed scheme is consistent with the requirements of Defra’s
Strategic Policy Statement published in September 2017, and DWI guidance on principles for the
assessment of drinking water quality provisions within the PR19 process82. In particular, the DWI noted that
“we are satisfied that the proposed scheme adopts a sound risk based approach to management of water
supplies from source to tap using a water safety plan approach”.
We considered these results alongside other factors, including an environmental appraisal (see Section
7.4.5), and an economic appraisal (see Table 21). In a multi-criteria analysis, using some principles of robust
decision making, we tested the sensitivity of the solution selection to different weightings of the factors
considered (to ensure that a particular solution was not preferred due to over-reliance on one particular
criterion). Because the environmental impact of Solution D performs favourably in comparison with other
solutions, and it has high marginal benefits compared to cost, this solution was also the most robust option
(Figure 33). This was also the most cost-beneficial solution.
Looking at all these results in the round it is clear that Solution D represents the best solution for customers
and the environment to provide resilient water supplies for the long term. Therefore, we are selecting
Solution D as part of our preferred plan. Fully detailed evidence has been provided to Ofwat as part of our
business plan, and an explanation of the methods and results is in included in Final WRMP19 Technical
Report - Water supply resilience.
Table 21 Results of cost-benefit analysis.
£m 80 year NPV Solutions in cost-benefit ranked order
Solution B A C E D
Total benefits 4,795 5,409 6,242 7,109 7,085
Solution Totex (671) (406) (706) (1,651) (965)
Environmental Costs (356) (1) (36) (27) (21)
Total Costs (1,027) (407) (742) (1,677) (986)
Net benefits 3,768 5,002 5,500 5,432 6,100
82 As set out in DWI Information Letter 03/2017, published on 12 September 2017
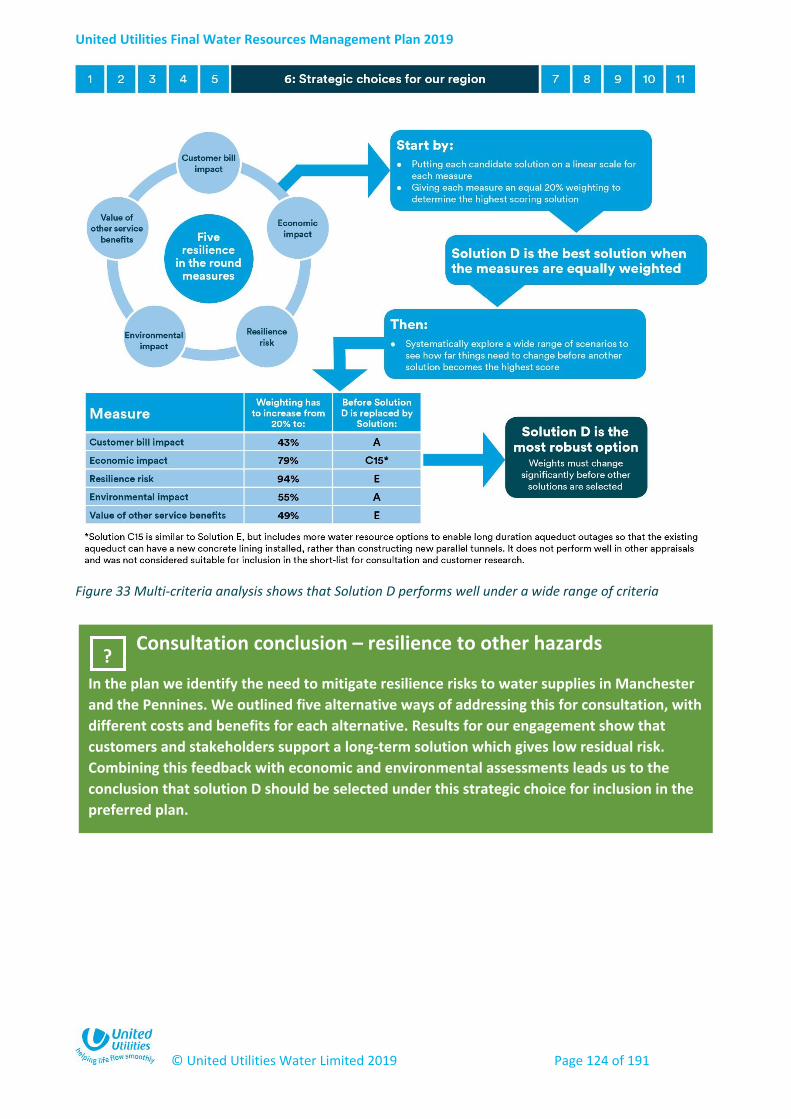
United Utilities Final Water Resources Management Plan 2019
© United Utilities Water Limited 2019 Page 124 of 191
Figure 33 Multi-criteria analysis shows that Solution D performs well under a wide range of criteria
Consultation conclusion – resilience to other hazards
In the plan we identify the need to mitigate resilience risks to water supplies in Manchester
and the Pennines. We outlined five alternative ways of addressing this for consultation, with
different costs and benefits for each alternative. Results for our engagement show that
customers and stakeholders support a long-term solution which gives low residual risk.
Combining this feedback with economic and environmental assessments leads us to the
conclusion that solution D should be selected under this strategic choice for inclusion in the
preferred plan.
?

United Utilities Final Water Resources Management Plan 2019
© United Utilities Water Limited 2019 Page 125 of 191
6.5 National water trading
In line with the planning guidelines and the Water UK long term water resources planning study83, this
strategic choice relates to national water trading. In our 2015 plan, we identified technically feasible export
options in conjunction with other water companies, and explored the potential impacts at high level as a
scenario test within the plan. There was a ‘high’ impact on our supply-demand balance of significant new
exports up to 180 Ml/d from our Strategic Resource Zone. This means that options would need to be
implemented to maintain resilient supplies to customers. There would be a national benefit to such an
arrangement if it allowed resilient supplies to other areas and there would be a benefit to the North West
due to the revenues paid by the importing company. We have a strategic choice as to whether such exports
should feature in this plan.
A number of stakeholders raised specific water trading points in their pre-consultation feedback. While
there was understanding of why it was being considered, there were some important aspects highlighted
for consideration:
Cost and benefits in terms of the environment;
Modelling of impacts on water resources in the North West and implications for droughts;
A need to significantly increase the North West's resilience and resources to enable the trade -
particularly with the future uncertainty and likelihood for more regular and increasingly extreme
events;
Steps taken by importing companies to minimise their call on North West resources;
The potential to negatively impact on vulnerable water bodies and Water Framework Directive
objectives;
Potential to impact negatively on customers, in terms of cost. Alternatively any service benefits
should go to local residents (for example a reduction in water bills, direct re-investment in local
infrastructure, improved resilience or improved natural capital);
Impact on lake levels for environmental and amenity use;
The need for a national and balanced framework; and
The risk of transferring invasive non-native species from one area to another.
In our customer research to inform the draft Water Resources Management Plan we identified the
following views:
Overall support that water trading should be considered – only 7% of customers said that this was
not an important area for us to consider;
The view of many people when it comes to the idea of water trading is that it is good in principle,
but there is a natural concern of the implications and consequences to ensure that the North West
does not suffer as a result;
There were some concerns that if contractual agreements were put in place to provide water to
other parts of the country when they were in need, then what would that mean for the North West
if that region was also suffering from a deficit?;
It was clear that there would need to be safeguards put in place, so that the North West region did
not suffer if it were to enter into a contractual obligation to provide water to other areas;
83 The resulting report, ‘Water resources long-term planning framework (2015-2065)’ is available on the Water UK website -
www.water.org.uk/water-resources-long-term-planning-framework
United Utilities Final Water Resources Management Plan 2019
© United Utilities Water Limited 2019 Page 126 of 191
There were also some isolated views that the water in the North West belongs to the region and
should not be exported at all – however this does not represent the views of the majority;
Many participants felt the water in the North West region is of superior quality to the rest of the
UK. Some had fears that water transported into the region might be of a lower quality than the
region has become accustomed to having ‘on tap’;
Some participants had concerns over the potential costs of transporting the water. Does new
infrastructure need to be built? Will this cost be passed onto the customer?; and
Some felt that there might be an environmental impact, including upsetting the ecosystem, should
new infrastructure be put in place; this was a concern for a number of participants.
At the draft plan stage we included a water export from the region in the preferred plan for consultation, as
we recommended that we continue to work towards a future trade from our region as in the best interests
of customers. In developing those proposals we have taken the concerns of customers and stakeholders
into account. We developed the extended methods (sophisticated and improved options appraisal) process
(Section 7.2) specifically to address these concerns. This allowed us to select options to enable an export
which at least maintains resilience at the levels expected by customers, and protect the environment (this
is shown in Section 8). We have also worked with Thames Water to set out a ‘heads of terms’ which could
form the basis of future contractual protections for both parties.
Due to uncertainty around a potential trade, and dependencies on the Water Resources Management Plans
from other water companies, we cannot commit in isolation to an export. Similarly, from a very early stage
in the plan development process we have clearly understood that large-scale national water trading, and
decisions associated with it would likely span multiple planning rounds. In other words, we saw there being
a likelihood that exploration of water trading in other company plans would be inconclusive and there
would be a regulatory and government expectation that we continue to explore a water export from the
region further in future. With this in mind, we should have flexibility in our plan which allows us to prepare
for and adapt to potential trades.
As outlined in our Final WRMP19 Technical Report - Options identification we have engaged with a number
of companies about potential exports. Thames Water was the only company to confirm that an import
from United Utilities as a candidate for their preferred plan at the draft plan stage. The export to the South
East would be from Vyrnwy reservoir, via the River Severn, a new raw water transfer pipeline and the River
Thames. This export could be up to 180 Ml/d, although it would be used relatively infrequently, during
periods when dry weather meant there was a need for the water in the South East (less than 15% of the
time on average). We have tested a larger trade with the 180 Ml/d export used more extensively
(Section 9.2) and we have completed some preliminary work on exports of smaller volumes. Whilst we
have not reported the details here, it is important to note that we can facilitate different sized trades, i.e.
release smaller volumes from Vyrnwy with a lower level of investment required, and that this could be
explored further at a later date.
This proposed export has been set in the context of a national assessment of water resources need (Water
UK, 2015), which sets out a balanced approach between demand reductions, new resource development
across England and Wales, and strategic transfers of water. The proposed export from Vyrnwy was
identified in this work as a cost effective and resilient way of meeting the national need. Water UK will
carry out further work on the extent to which companies have been able to take account of this national
framework in their plans.

United Utilities Final Water Resources Management Plan 2019
© United Utilities Water Limited 2019 Page 127 of 191
We assumed that any trade would occur from the mid-2030s onwards84. The timing of, and need for, any
trade is subject to confirmation through completion of other companies’ Water Resources Management
Plans, which is why we are adopting a pathway approach (Section 8.1). For a trade of this scale to progress
there would be significant further investigation and analysis work, with the work completed at a pace and
scale tailored to the timing of a prospective trade. Investment would be triggered only if and when the
needs of the importing company is confirmed.
As part of developing this final plan we have engaged with Severn Trent and Thames Water further to
discuss interactions between our respective plans. Thames Water have confirmed that an export option
from our region is not included in their preferred plan within the first 25 years of the planning horizon,
although they would like to continue actively engaging with us to explore the option in future and have
included the Vyrnwy export option in their preferred plan outside our main assessment horizon in 208385.
Severn Trent Water have indicated the potential for a smaller 60 Ml/d trade to be a desirable long-term
option in their future plans subject to further exploration, however, this would be explored in the Water
Resources Management Plan 2024 planning round.
It remains our preference to continue working towards making water available for export. The water
trading strategic choice gained positive support during the consultation process. In addition, for the revised
draft plan we completed further customer research to evaluate customer views on water transfer (or
trading) solutions in comparison with water supply and demand management alternatives.
Customers were consulted from the operating areas of Thames Water, United Utilities and Severn Trent
Water in England and across Wales. The research was carried about by market research company Verve
from March to May 2018. The insight gathered is based on an informed customer view - throughout the
research process, participants were provided with information on the issue of future water scarcity in the
UK, possible solutions and considerations. The approach involved a qualitative ‘deep dive’ with 49 non-
household depth interviews and an online community with 173 household participants over 5 days. Results
were quantified with an online survey of 1,505 household participants. The sample was designed to be
representative of key demographics within each water company area. This similarly showed support to
continue exploring water trading, whilst also giving further insight into the potential benefits customers
would like to see from an export from our region (i.e. potential for reinvestment in the water supply system
rather than bill reductions given their scale). Verve has provided the summary statement in the box at the
end of Section 6.5 for the three companies to consistently report the findings of the research. Further
details are in our Final WRMP19 Technical Report – Customer and stakeholder engagement.
84 Our assessment is based on 2035, however, it may be considered as representative of a trade occurring at any point in the 2030s.
It is unlikely that the 180 Ml/d trade assessed will be required before this date based on discussions with Thames Water, with
scenarios in their plan currently indicate an earliest date of 2039. Dialogue with Severn Trent Water has indicated the potential for
a smaller 60 Ml/d trade which could be implemented earlier (they have confirmed that they would like to explore this further for
the Water Resources Management Plan 2024 planning round). They also noted the potential need for a potential small scale import
at Peckforton (and there could be other smaller trades in future), however, this is considered of the scale that could be reviewed
and accommodated through the Annual WRMP process. We will reassess our future plans accordingly in future depending on the
desired implementation date of any water trade depending on the needs determined by other companies. 85 Our plan is tested to the 2080s, however, the core supply-demand assessment of need is focused on the 25-year horizon.
United Utilities Final Water Resources Management Plan 2019
© United Utilities Water Limited 2019 Page 128 of 191
We therefore remain committed to working with potential future trading partners so that an export can be
made available when it is needed. Our strategy to facilitate a future trade has been retained within an
adaptive pathway (see Section 8), which could form a future preferred plan if water trading was
subsequently required in future. The pathway sets out how customers and the environment are protected
under a future export. We will continue to work with others on water trading beyond WRMP19 towards
the WRMP24 planning cycle. This will build on our approach to WRMP19, drawing on the ongoing
collaborative, multi-organisational work through, for example, Water UK, Water Resources North, the River
Severn Working / Modelling Groups etc. Given our experience in WRMP19, we will also actively support
and engage on the WRMP24 planning framework.

United Utilities Final Water Resources Management Plan 2019
© United Utilities Water Limited 2019 Page 129 of 191
Key points – Water trading customer research, July 2018
Customers have limited knowledge about the water scarcity issue, but quickly recognise the need for long term sustainable solutions
Informed reaction to water scarcity: 7 in 10 are concerned about water scarcity, particularly those in the Thames Water catchment area. Customers recognise that water scarcity is a long term issue requiring immediate nationally co-ordinated action. Customers call for widespread education on the issue. They assume that fixing leaks will be the major priority for water companies – the preferred demand management solution for all customers irrespective of region.
Preference for supply solutions: Water reuse is the most preferred supply solution across all water company regions, closely followed by building new reservoirs. Whilst regional transfer is the least preferred of the three solutions, 62% rank it as their first or second choice. Customers see sustainability (ability to provide water for the long term), environmental impact and the volume of water produced as the key evaluation criteria when choosing solutions to put in place.
Water trading, delivered cost effectively with assurances, works for customers
Level of support for water trading: Customers raise multiple concerns about water trading - the security of supply, environmental and financial impacts. Potential ‘donor’ customers are concerned as to the impact on their own supply, whilst Thames Water customers ask whether water will be available when needed. Despite concerns, 74% of all customers *agree they support water trading as part of the solution - it’s logical to share. Support declines for a proportion of Thames Water customers (from 80% to 70%) on being told the cost will be paid back through the bill over a long period of time – they are unable to assess fully without a figure. In donor regions, 40p is seen as better reinvested into future water resource management.
Key assurances required: Eight assurance statements have been developed to help mitigate core areas of concern with water trading
1. Companies selling the water only do so if they can ensure they have a reliable source in the future 2. Water will only be taken when it is needed by Thames Water and the wider South-East region 3. There are plans in place to maintain new pipework 4. The 40p per donor customer is used for the improvement and upgrade of water services, with no impact
on bills 5. Impact on bills for recipient regions will be kept to a minimum by spreading the cost over a long period 6. The regulator ensures water is traded at a fair price, and any cost to customers fairly reflects the level of
investment made 7. External bodies will be involved in monitoring processes which could pose a risk to the environment 8. Water companies will be regulated on environmental impacts and must conduct due diligence checks
Assurances are also required about the continued improvement of demand management.
The Welsh perspective: Customers in Wales, whilst still concerned, have lower levels of support for water trading than observed in other potential donor regions.
Their preference for demand and supply solutions is consistent with other water company regions – reducing leakage, water reuse and building new reservoirs are most preferred
Wariness remains about supply side solutions given the history of issues such as the Tryweryn Reservoir
They are the most concerned to know that there is enough water left within ‘donor’ region post transfer (61% raise this as a concern compared with 54% of all customers)
Whilst 65% support water trading as part of the solution, those in Wales have the lowest levels of support (65% *agree they support water trading compared with 73% for Severn Trent England and United Utilities).
*agree is a total of those who agree strongly or slightly with the statement “I support water trading as part of the solution to the water scarcity in the UK”
United Utilities Final Water Resources Management Plan 2019
© United Utilities Water Limited 2019 Page 130 of 191
6.6 Strategic choices summary
We have outlined a number of strategic choices and described their benefits in the sections above
following consultation. The following strategic choices are therefore being taken forward in our preferred
plan in Section 7:
Enhanced leakage reduction – 91 Ml/d (20%) reduction by 2025, with 190 Ml/d (over 40%) by 2045;
Improved level of service for drought permits/orders to augment supply; and
Increasing our resilience to non-drought hazards through Solution D to the Manchester and
Pennines resilience need.
Finally, to reiterate, our strategic choices have been developed based on customer and stakeholder views;
this process is summarised below in Figure 34.
Consultation conclusion – national water trading
We consulted on a potential export from our region in our draft plan, to explore with
stakeholders as to how a future water trade could work and gain feedback. There was
tentative support for a water trade.
It remains our preference to continue working towards making water available for
export in future.
A corresponding import has not been identified in the preferred plan of another water
company over the 25 year planning horizon, so it is no longer considered for inclusion
in our preferred plan, but is instead included as an adaptive pathway.
?
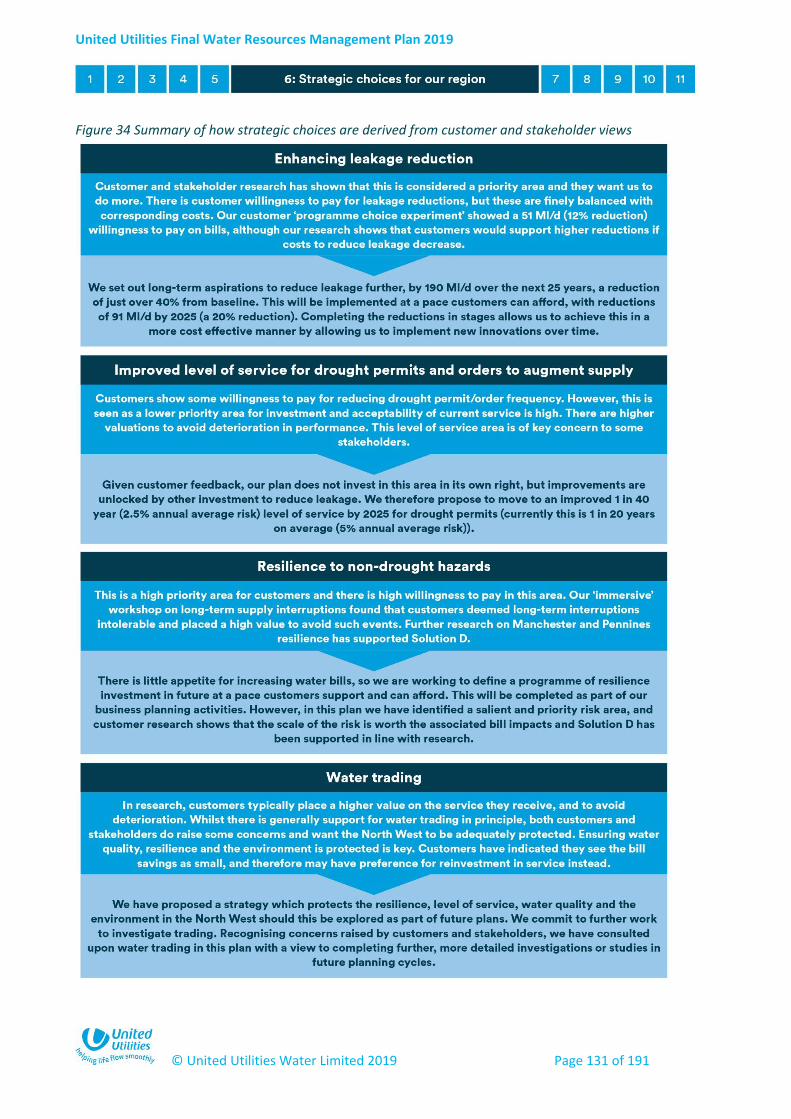
United Utilities Final Water Resources Management Plan 2019
© United Utilities Water Limited 2019 Page 131 of 191
Figure 34 Summary of how strategic choices are derived from customer and stakeholder views
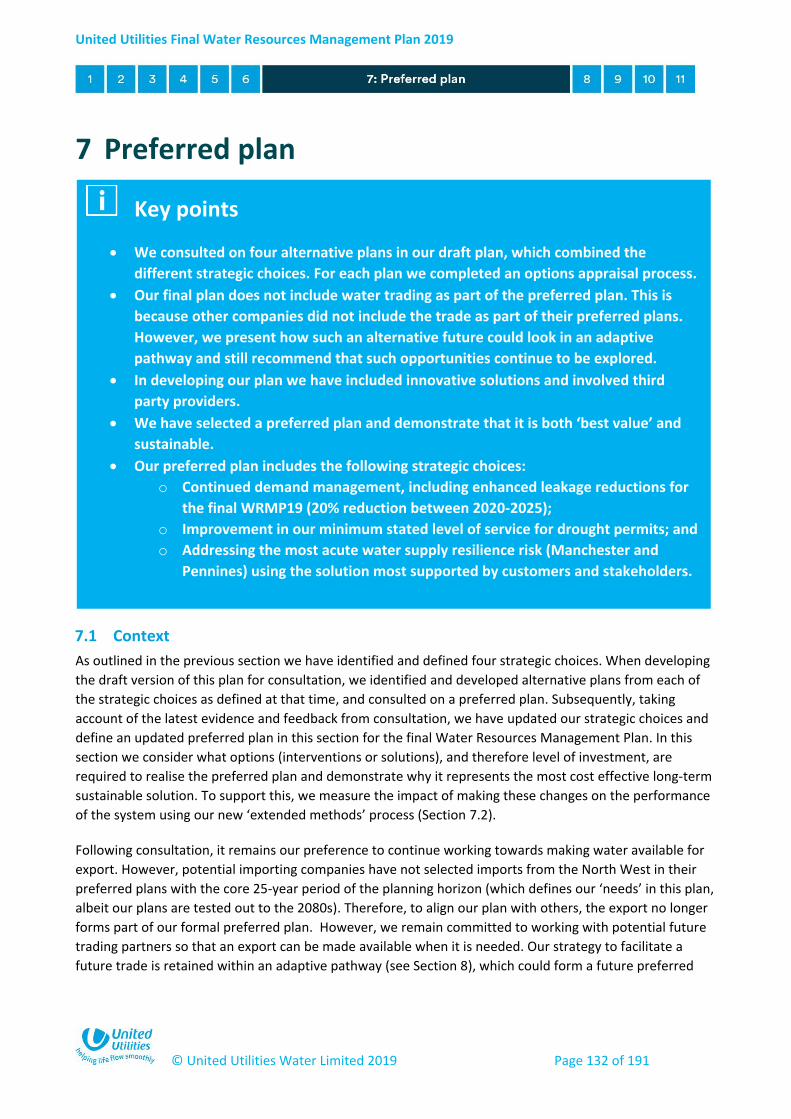
United Utilities Final Water Resources Management Plan 2019
© United Utilities Water Limited 2019 Page 132 of 191
7 Preferred plan
7.1 Context
As outlined in the previous section we have identified and defined four strategic choices. When developing
the draft version of this plan for consultation, we identified and developed alternative plans from each of
the strategic choices as defined at that time, and consulted on a preferred plan. Subsequently, taking
account of the latest evidence and feedback from consultation, we have updated our strategic choices and
define an updated preferred plan in this section for the final Water Resources Management Plan. In this
section we consider what options (interventions or solutions), and therefore level of investment, are
required to realise the preferred plan and demonstrate why it represents the most cost effective long-term
sustainable solution. To support this, we measure the impact of making these changes on the performance
of the system using our new ‘extended methods’ process (Section 7.2).
Following consultation, it remains our preference to continue working towards making water available for
export. However, potential importing companies have not selected imports from the North West in their
preferred plans with the core 25-year period of the planning horizon (which defines our ‘needs’ in this plan,
albeit our plans are tested out to the 2080s). Therefore, to align our plan with others, the export no longer
forms part of our formal preferred plan. However, we remain committed to working with potential future
trading partners so that an export can be made available when it is needed. Our strategy to facilitate a
future trade is retained within an adaptive pathway (see Section 8), which could form a future preferred
Key points
We consulted on four alternative plans in our draft plan, which combined the
different strategic choices. For each plan we completed an options appraisal process.
Our final plan does not include water trading as part of the preferred plan. This is
because other companies did not include the trade as part of their preferred plans.
However, we present how such an alternative future could look in an adaptive
pathway and still recommend that such opportunities continue to be explored.
In developing our plan we have included innovative solutions and involved third
party providers.
We have selected a preferred plan and demonstrate that it is both ‘best value’ and
sustainable.
Our preferred plan includes the following strategic choices:
o Continued demand management, including enhanced leakage reductions for
the final WRMP19 (20% reduction between 2020-2025);
o Improvement in our minimum stated level of service for drought permits; and
o Addressing the most acute water supply resilience risk (Manchester and
Pennines) using the solution most supported by customers and stakeholders.

United Utilities Final Water Resources Management Plan 2019
© United Utilities Water Limited 2019 Page 133 of 191
plan if water trading was subsequently required in future. The pathway sets out how customers and the
environment are protected under a future export.
7.2 Options appraisal process
This section summarises the options appraisal process used to develop the Water Resources Management
Plan, which is detailed further in our Final WRMP19 Technical Report - Options appraisal and a high-level
overview is shown in Figure 35.
Figure 35 Overview of how we have developed our plans
This process has been developed over a number of successive water resources management plans. For this
plan we have used three different complementary options appraisal techniques, which can be summarised
as follows:
Average Incremental Social Cost (AISC) – in simple terms, a way to rank options according to their cost by
unit volume (pence per cubic metre). AISC includes monetised environmental and social costs and can be
used to apply options to a supply-demand deficit at a single point in time.
Economics of Balancing Supply and Demand (EBSD) – using AISC as an input, this modelling approach is
used to apply options to a time varying (i.e. 2020-2045) supply-demand balance. It generates an optimised
‘lowest cost’ portfolio of options to address any supply-demand deficit. We used EBSD to help define the
leakage reduction programme (Section 7.4.2) and examine a range of scenarios (Section 9), however,
options for water trading assessed in an adaptive pathway (Section 8) were defined using our extended
methods process.
Extended methods – a new sophisticated approach developed in conjunction with one of our water
resource service providers; Atkins. As described in detail in our Final WRMP19 Technical Report - Options
appraisal, this method represents a move away from the traditional supply demand balance approach to
explore wider aspects of water resources performance. It allows us to answer a number of pertinent
questions:

United Utilities Final Water Resources Management Plan 2019
© United Utilities Water Limited 2019 Page 134 of 191
How does a portfolio of options perform under a wide range of future conditions such as extreme
droughts or climate change? What if we look a long way into the future, for example, the 2030s or
even the 2080s?
Can we alter a portfolio to increase its value under these conditions, as measured by a range of
performance metrics which have been agreed with stakeholders?
Do we need further or different options to protect customers and the environment from the wider
impacts of water trading?
Our metrics were defined in discussion with a range of internal and external stakeholders. For the
assessment we arranged them into two groups as shown in Figure 36. In the following sections we refer
only to the primary metrics to help us to present a clear picture of impacts86. The full set of results can be
found in our Final WRMP19 Technical Report - Options appraisal.
Figure 36 Metrics used to indicate the performance of our plans
86 However, it should be noted that when defining any portfolios for water trading under the adaptive pathway (Section 8) both the
primary and contributory metrics were used; i.e. we were looking for portfolios of options that did not compromise performance in
any of these areas.
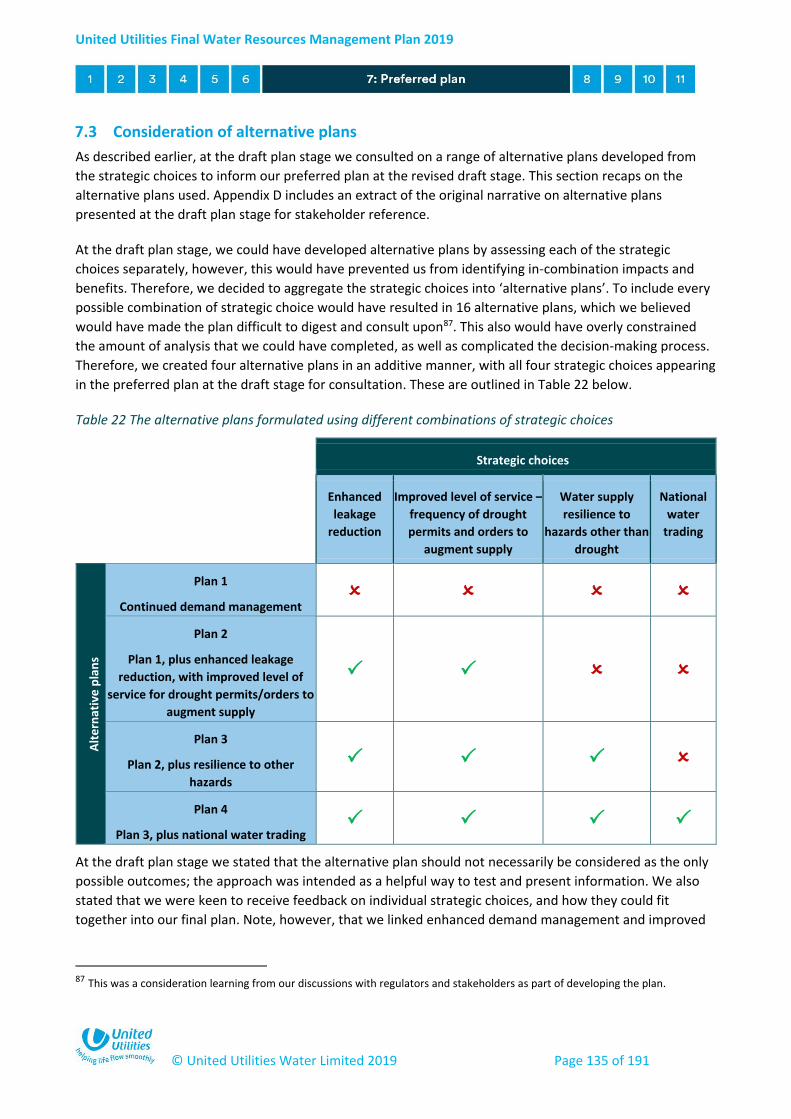
United Utilities Final Water Resources Management Plan 2019
© United Utilities Water Limited 2019 Page 135 of 191
7.3 Consideration of alternative plans
As described earlier, at the draft plan stage we consulted on a range of alternative plans developed from
the strategic choices to inform our preferred plan at the revised draft stage. This section recaps on the
alternative plans used. Appendix D includes an extract of the original narrative on alternative plans
presented at the draft plan stage for stakeholder reference.
At the draft plan stage, we could have developed alternative plans by assessing each of the strategic
choices separately, however, this would have prevented us from identifying in-combination impacts and
benefits. Therefore, we decided to aggregate the strategic choices into ‘alternative plans’. To include every
possible combination of strategic choice would have resulted in 16 alternative plans, which we believed
would have made the plan difficult to digest and consult upon87. This also would have overly constrained
the amount of analysis that we could have completed, as well as complicated the decision-making process.
Therefore, we created four alternative plans in an additive manner, with all four strategic choices appearing
in the preferred plan at the draft stage for consultation. These are outlined in Table 22 below.
Table 22 The alternative plans formulated using different combinations of strategic choices
Strategic choices
Enhanced
leakage
reduction
Improved level of service –
frequency of drought
permits and orders to
augment supply
Water supply
resilience to
hazards other than
drought
National
water
trading
Alt
ern
ativ
e p
lan
s
Plan 1
Continued demand management
Plan 2
Plan 1, plus enhanced leakage
reduction, with improved level of
service for drought permits/orders to
augment supply
Plan 3
Plan 2, plus resilience to other
hazards
Plan 4
Plan 3, plus national water trading
At the draft plan stage we stated that the alternative plan should not necessarily be considered as the only
possible outcomes; the approach was intended as a helpful way to test and present information. We also
stated that we were keen to receive feedback on individual strategic choices, and how they could fit
together into our final plan. Note, however, that we linked enhanced demand management and improved
87 This was a consideration learning from our discussions with regulators and stakeholders as part of developing the plan.
United Utilities Final Water Resources Management Plan 2019
© United Utilities Water Limited 2019 Page 136 of 191
level of service as the leakage reduction allow us to make this change without any additional investment
(Section 6.3). Detailed performance metrics and costs were calculated for the different alternative plans.
At the draft plan stage, our preferred plan was based on Plan 4 and therefore:
Ensured the baseline supply-demand balance position as outlined in Section 4 was achieved,
including through with key demand management activities:
o Water efficiency activities achieving, as a minimum, an annual saving of 1 litre per property
per day; and
o Installing a total of around 180,000 water meters between 2020 and 2025. By the end of
the planning horizon in 2045, we forecast that we will reach 76% meter penetration;
Further leakage reductions of 80 Ml/d over the planning horizon, a reduction of 18% below the
baseline position, with 30 Ml/d reductions (7%) taking place between 2020-2025;
Improvement of our minimum stated level of service for drought permits/orders to augment
supplies, from no more than once every 20 years (5% annual average risk) to once every 40 years
(2.5% annual average risk) by 2025, enabled by the leakage reductions above;
Applying one of five potential plans to address the most pressing water supply resilience risk;
To continue to work towards a future water trade from our region, enabled by new or enhanced
water sources and enhanced water efficiency. This element of the plan ensured that water quality,
resilience and the environment in the North West are protected, whilst delivering bill reductions
and performance improvements.
The consultation process essentially confirmed support for Plan 4, albeit with various comments and
considerations being raised on the plan within the strategic choices as described in Section 6. However, for
consistency with the preferred plans of potential importing companies, our new preferred plan essentially
defaults back to Plan 3 at this time. Various aspects of the underlying strategic choices and resulting
options have, however, changed from the draft Water Resources Management Plan. The preferred plan in
this final Water Resources Management Plan is described fully in the next section.
7.4 The preferred plan
Our preferred plan now includes, in addition to the specified baseline activities, the following updated
strategic choices:
Adopt an enhanced leakage reduction comprising a total of 190 Ml/d over the planning period, a
reduction of just over 40% from the baseline position of 448Ml/d. By the end of 2024/25 we plan to
reduce leakage by at least 91 Ml/d, or 20%;
Improve level of service for drought permits and orders to augment supply from 1 in 20 years to 1
in 40 years (moving from 5% to 2.5% annual average risk); and
Increase resilience to others hazards, specifically for our regional aqueduct system associated with
Manchester and Pennines resilience. This involves completing Solution D, which involves rebuilding
all single line sections of the relevant aqueduct.
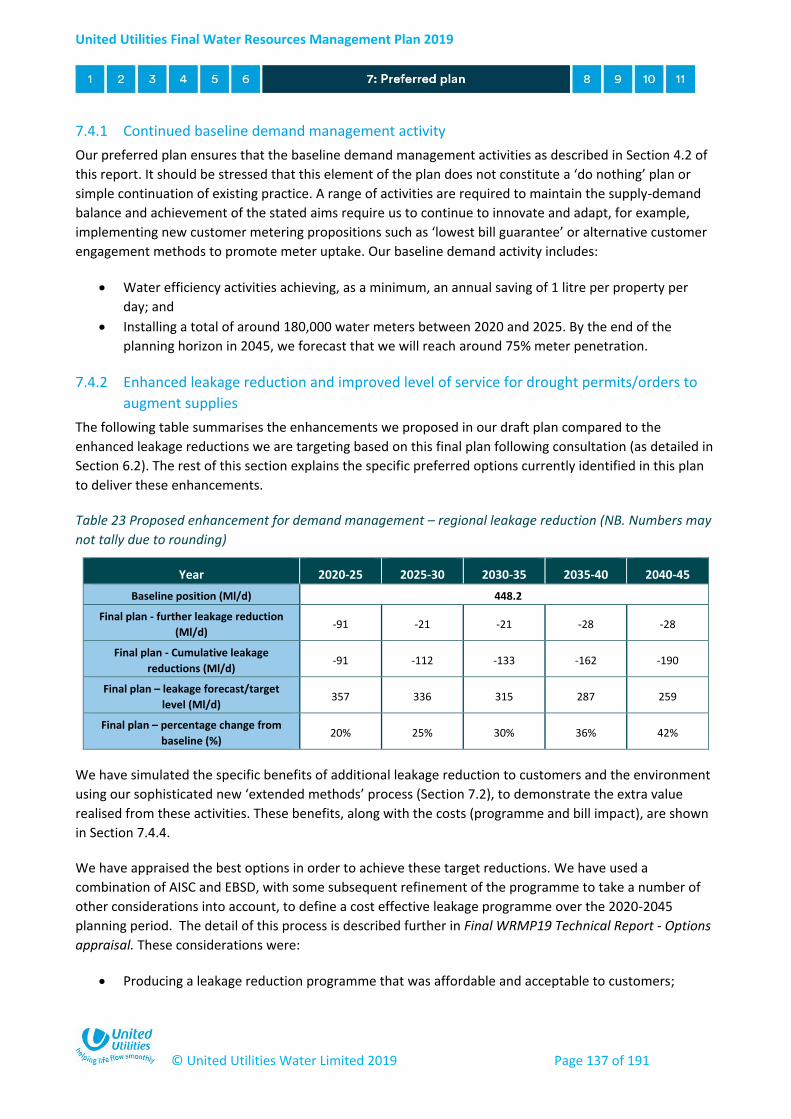
United Utilities Final Water Resources Management Plan 2019
© United Utilities Water Limited 2019 Page 137 of 191
7.4.1 Continued baseline demand management activity
Our preferred plan ensures that the baseline demand management activities as described in Section 4.2 of
this report. It should be stressed that this element of the plan does not constitute a ‘do nothing’ plan or
simple continuation of existing practice. A range of activities are required to maintain the supply-demand
balance and achievement of the stated aims require us to continue to innovate and adapt, for example,
implementing new customer metering propositions such as ‘lowest bill guarantee’ or alternative customer
engagement methods to promote meter uptake. Our baseline demand activity includes:
Water efficiency activities achieving, as a minimum, an annual saving of 1 litre per property per
day; and
Installing a total of around 180,000 water meters between 2020 and 2025. By the end of the
planning horizon in 2045, we forecast that we will reach around 75% meter penetration.
7.4.2 Enhanced leakage reduction and improved level of service for drought permits/orders to
augment supplies
The following table summarises the enhancements we proposed in our draft plan compared to the
enhanced leakage reductions we are targeting based on this final plan following consultation (as detailed in
Section 6.2). The rest of this section explains the specific preferred options currently identified in this plan
to deliver these enhancements.
Table 23 Proposed enhancement for demand management – regional leakage reduction (NB. Numbers may
not tally due to rounding)
Year 2020-25 2025-30 2030-35 2035-40 2040-45
Baseline position (Ml/d) 448.2
Final plan - further leakage reduction
(Ml/d) -91 -21 -21 -28 -28
Final plan - Cumulative leakage
reductions (Ml/d) -91 -112 -133 -162 -190
Final plan – leakage forecast/target
level (Ml/d) 357 336 315 287 259
Final plan – percentage change from
baseline (%) 20% 25% 30% 36% 42%
We have simulated the specific benefits of additional leakage reduction to customers and the environment
using our sophisticated new ‘extended methods’ process (Section 7.2), to demonstrate the extra value
realised from these activities. These benefits, along with the costs (programme and bill impact), are shown
in Section 7.4.4.
We have appraised the best options in order to achieve these target reductions. We have used a
combination of AISC and EBSD, with some subsequent refinement of the programme to take a number of
other considerations into account, to define a cost effective leakage programme over the 2020-2045
planning period. The detail of this process is described further in Final WRMP19 Technical Report - Options
appraisal. These considerations were:
Producing a leakage reduction programme that was affordable and acceptable to customers;

United Utilities Final Water Resources Management Plan 2019
© United Utilities Water Limited 2019 Page 138 of 191
Considered the reliability and deliverability of options as well as the costs and benefits, particularly
in the short term, to ensure there was an appropriate balance of risk to the programme;
Ensuring the programme in the short term contained a balance of options that are tried and tested,
as well as including new and innovative options to drive efficiency and continuous improvement;
and
Selecting innovative third party options where appropriate, particularly where there is significant
longer term potential, but the roll out needs to be carried out in a controlled way to manage the
risk to customers and ensure deliverability.
We are working closely with third-party suppliers to further develop and trial selected options. We should
of course recognise that, by 2025, some of the newer approaches may already have been displaced by
technologies that are yet to be invented; this is natural for a long-term strategic planning process like the
Water Resources Management Plan. Our future forecasts will be reviewed fully in each planning round.
It is important to point out that any third-party contributions implemented in the future will be subject to
an appropriate procurement process taking account of any legislative requirements. Demand management
options will be subject to a future bid assessment framework, once published. This applies to any trials or
pilot studies that fall within the legal requirements. There is significant focus on innovation and the
involvement of specialist third parties.
Figure 37 summarises our programme, which splits the leakage programme into two distinct phases, as also
explained below:
In the first five years from 2020-2025 there is a balance between options that we know are proven
and deliverable, but also recognising the need to be more innovative to drive future efficiencies.
Beyond 2025 we have included options that are less cost-beneficial, or are cost beneficial, but more
uncertain or require time to do further trials and investigations to ensure they are deliverable
We presented our current levels of service in Figure 5 (Section 1.4), and we have updated this below in
Figure 38 to reflect the proposed changes in our preferred plan. As included in our draft plan and explained
in Section 6.3, leakage reductions over the next five years unlock improvements to our stated minimum
levels of service for drought permits/orders to augment supplies. Our stated level of service for emergency
drought orders (i.e. rota cuts or standpipes) remains unchanged, however, using our sophisticated new
tools and techniques (Section 6.3) we have explored the actual expected frequency of implementation.
There is a fairly high degree of uncertainty in this assessment, but the maximum simulated frequency at
any point during the 2020-2045 planning period is 1 in 1000 years on average (0.1% annual average risk)
with the preferred plan in place (trading pathway). This analysis is outlined in our Final WRMP19 Technical
Report - Supply forecasting.
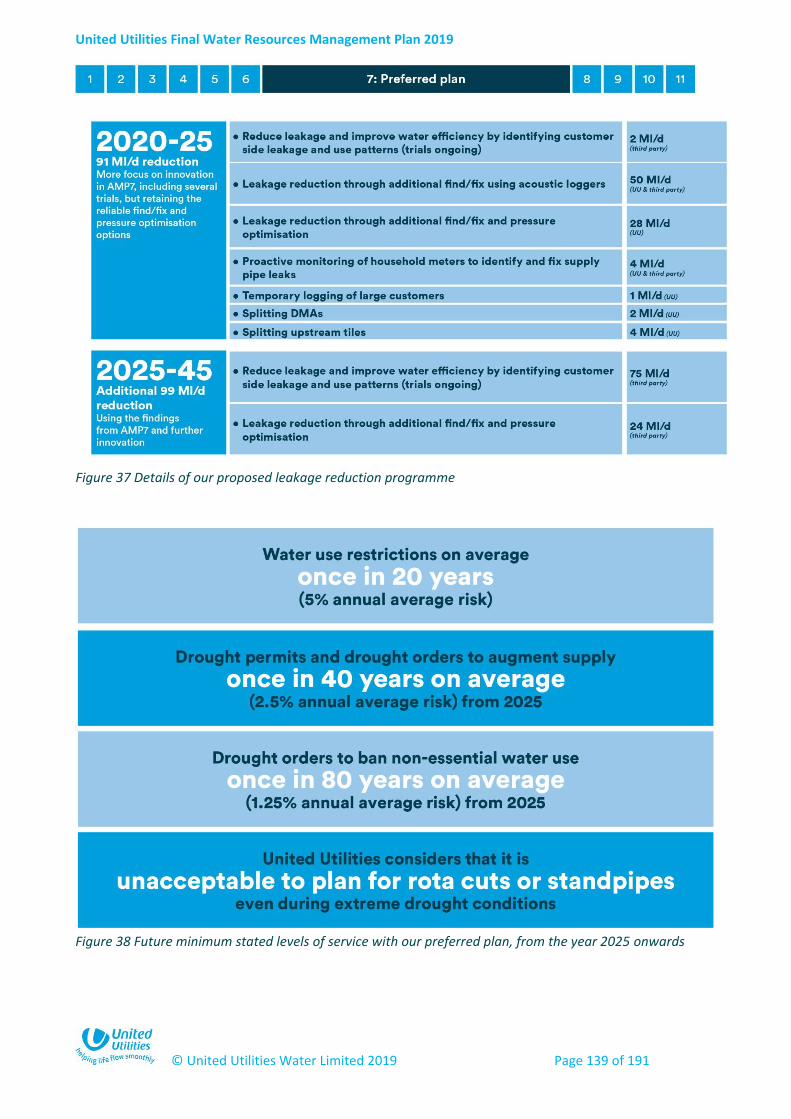
United Utilities Final Water Resources Management Plan 2019
© United Utilities Water Limited 2019 Page 139 of 191
Figure 38 Future minimum stated levels of service with our preferred plan, from the year 2025 onwards
Figure 37 Details of our proposed leakage reduction programme
United Utilities Final Water Resources Management Plan 2019
© United Utilities Water Limited 2019 Page 140 of 191
7.4.3 Resilience to other hazards (Manchester and Pennines resilience)
As outlined in Section 6.4, we identified five potential solutions to mitigate the risk to water supplies in
Manchester and the Pennines for consultation. Following consultation and customer research we propose
to take forward Solution D in our preferred plan which involves rebuilding all necessary tunnel sections of
the aqueduct. Evidence presented in Section 6.4 shows that this option is preferred by customers,
supported by stakeholders, is the most cost-beneficial, and is the most robust to a range of decision
metrics.
This preferred solution involves rebuilding all single line sections of the aqueduct. In terms of the simplified
presentation of the risk as three indicative events, it means:
Reducing the future 10 year probability that 1.2 million properties could be affected by water
quality problems for at least one week from 65% to less than 5%
Reducing the future 10 year probability that that 120,000 properties could be affected by supply
interruptions for up to three months from 35% to less than 5%
Reducing the future 10 year probability that 240,000 properties could be affected by supply
interruptions for up to two weeks from 10% to 5%
This will achieve a level of risk acceptable to customers. We estimate that due to the scale of the work needed it will take until 2028 to reduce the risk to this level. As we noted in Section 6.4.3 we are already progressing a project to replace the highest risk tunnel section and construction works are expected to start on this section in 2018, with completion of all tunnel sections expected by 2029.
7.4.4 Costs and performance of preferred plan
We are committed to ensuring that our preferred plan offers ‘best value’ as part of ensuring our plan
represents the most cost effective and sustainable long-term solution. Our objective has been to ensure
that both customers and the environment are protected whilst achieving our strategic objectives in the
most sustainable way, with the minimum possible overall level of investment. Our Final WRMP19 Technical
Report - Options appraisal describes how portfolios of options were selected, tested and optimised to
achieve this objective and Table 24 helps to summarise the process. The preferred plan has demonstrable
benefits overall compared to the base position (noting water supply resilience benefits are presented in the
previous section).
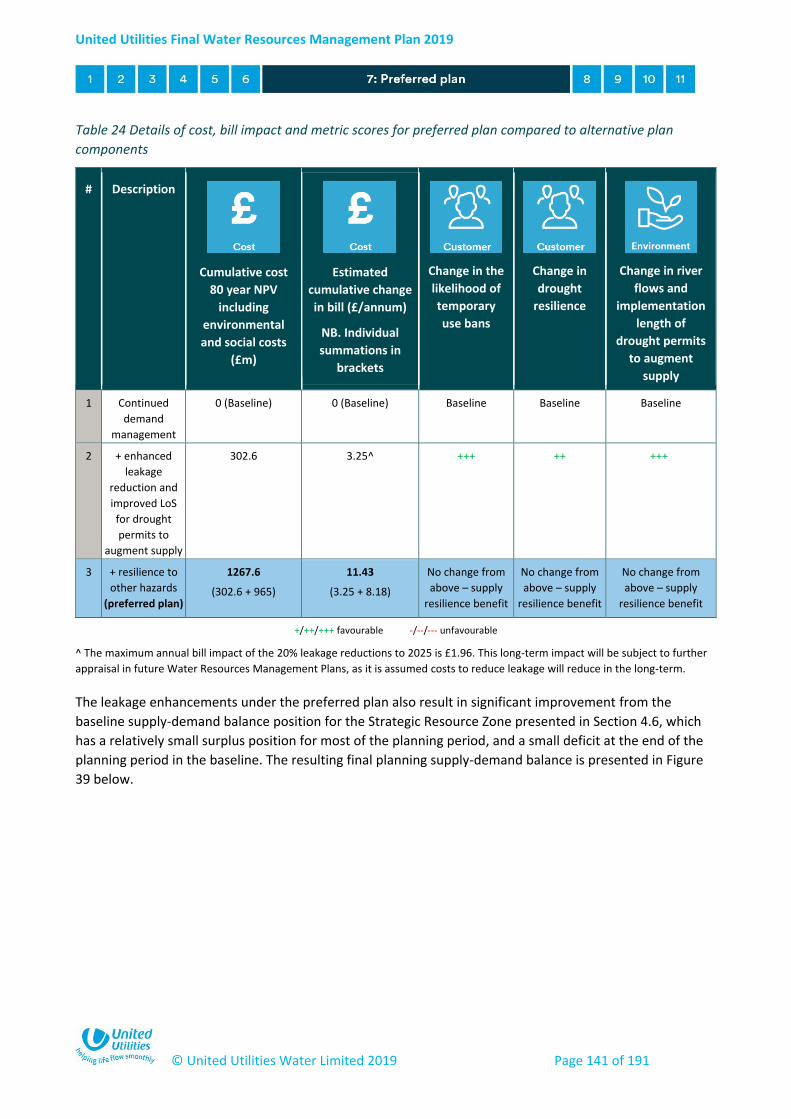
United Utilities Final Water Resources Management Plan 2019
© United Utilities Water Limited 2019 Page 141 of 191
Table 24 Details of cost, bill impact and metric scores for preferred plan compared to alternative plan
components
# Description
Cumulative cost
80 year NPV
including
environmental
and social costs
(£m)
Estimated
cumulative change
in bill (£/annum)
NB. Individual
summations in
brackets
Change in the
likelihood of
temporary
use bans
Change in
drought
resilience
Change in river
flows and
implementation
length of
drought permits
to augment
supply 1 Continued
demand
management
0 (Baseline) 0 (Baseline)
Baseline Baseline Baseline
2 + enhanced
leakage
reduction and
improved LoS
for drought
permits to
augment supply
302.6 3.25^ +++ ++ +++
3 + resilience to
other hazards
(preferred plan)
1267.6
(302.6 + 965)
11.43
(3.25 + 8.18)
No change from
above – supply
resilience benefit
No change from
above – supply
resilience benefit
No change from
above – supply
resilience benefit
^ The maximum annual bill impact of the 20% leakage reductions to 2025 is £1.96. This long-term impact will be subject to further
appraisal in future Water Resources Management Plans, as it is assumed costs to reduce leakage will reduce in the long-term.
The leakage enhancements under the preferred plan also result in significant improvement from the
baseline supply-demand balance position for the Strategic Resource Zone presented in Section 4.6, which
has a relatively small surplus position for most of the planning period, and a small deficit at the end of the
planning period in the baseline. The resulting final planning supply-demand balance is presented in Figure
39 below.
+/++/+++ favourable -/--/--- unfavourable
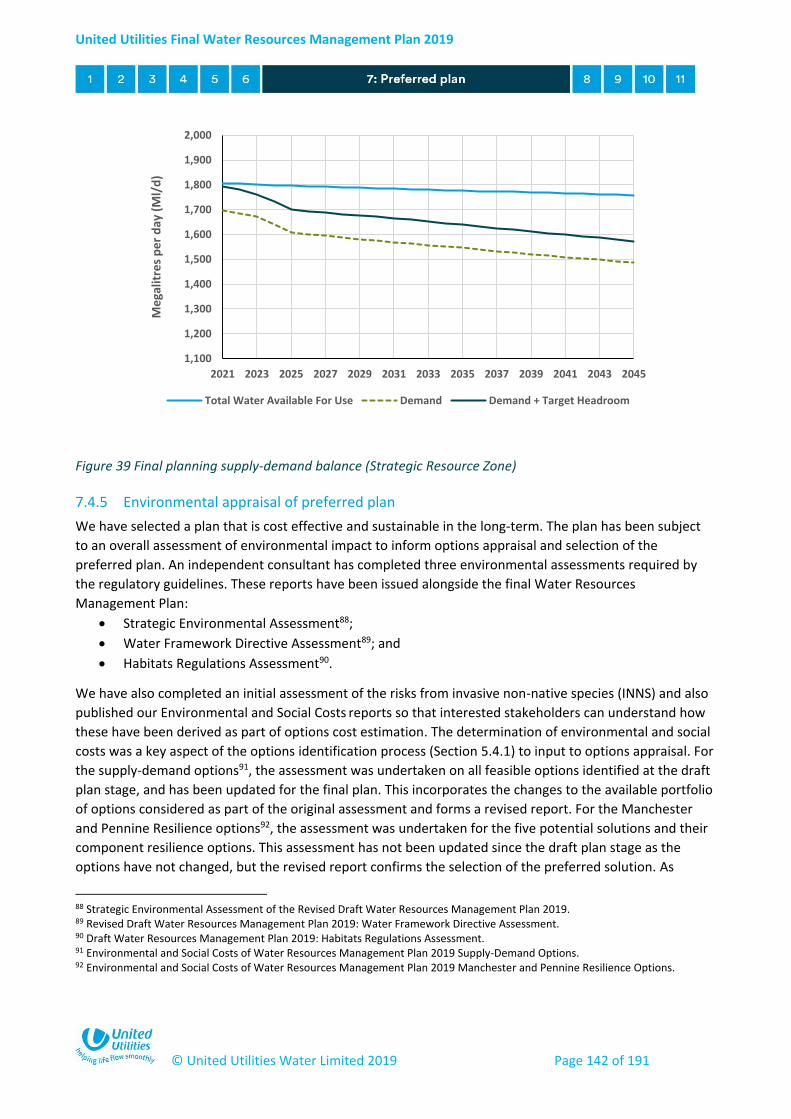
United Utilities Final Water Resources Management Plan 2019
© United Utilities Water Limited 2019 Page 142 of 191
Figure 39 Final planning supply-demand balance (Strategic Resource Zone)
7.4.5 Environmental appraisal of preferred plan
We have selected a plan that is cost effective and sustainable in the long-term. The plan has been subject
to an overall assessment of environmental impact to inform options appraisal and selection of the
preferred plan. An independent consultant has completed three environmental assessments required by
the regulatory guidelines. These reports have been issued alongside the final Water Resources
Management Plan:
Strategic Environmental Assessment88;
Water Framework Directive Assessment89; and
Habitats Regulations Assessment90.
We have also completed an initial assessment of the risks from invasive non-native species (INNS) and also
published our Environmental and Social Costs reports so that interested stakeholders can understand how
these have been derived as part of options cost estimation. The determination of environmental and social
costs was a key aspect of the options identification process (Section 5.4.1) to input to options appraisal. For
the supply-demand options91, the assessment was undertaken on all feasible options identified at the draft
plan stage, and has been updated for the final plan. This incorporates the changes to the available portfolio
of options considered as part of the original assessment and forms a revised report. For the Manchester
and Pennine Resilience options92, the assessment was undertaken for the five potential solutions and their
component resilience options. This assessment has not been updated since the draft plan stage as the
options have not changed, but the revised report confirms the selection of the preferred solution. As
88 Strategic Environmental Assessment of the Revised Draft Water Resources Management Plan 2019. 89 Revised Draft Water Resources Management Plan 2019: Water Framework Directive Assessment. 90 Draft Water Resources Management Plan 2019: Habitats Regulations Assessment. 91 Environmental and Social Costs of Water Resources Management Plan 2019 Supply-Demand Options. 92 Environmental and Social Costs of Water Resources Management Plan 2019 Manchester and Pennine Resilience Options.
1,100
1,200
1,300
1,400
1,500
1,600
1,700
1,800
1,900
2,000
2021 2023 2025 2027 2029 2031 2033 2035 2037 2039 2041 2043 2045
Me
galit
res
pe
r d
ay (
Ml/
d)
Total Water Available For Use Demand Demand + Target Headroom
United Utilities Final Water Resources Management Plan 2019
© United Utilities Water Limited 2019 Page 143 of 191
discussed in Section 5.4.1, environmental net gain will be embedded for new infrastructure projects in our
capital programme at an individual project level, from 2020 onwards. We are currently working with
Natural England to discuss our approach to net gain, and are also using the Defra metric to assess
biodiversity net gain within our engineering projects, which can be expanded in the future to include
environment net gain93.
Our environmental assessments are intrinsic to the Water Resource Management Plan process and have
informed key decisions along the way. All feasible options were assessed as part of the options
identification stage, as outlined in Section 5.4. Options then selected for the preferred plan were assessed
in more detail during options appraisal. Our future use of existing sources was also considered, particularly
in relation to the Water Framework Directive and the need to avoid deterioration of water bodies in our
region. These assessments will therefore ensure that our Water Resource Management Plan as a whole is
sustainable in the long-term.
Strategic Environmental Assessment (SEA)
The Strategic Environmental Assessment found that the preferred plan is expected to generate a mix of
positive and negative effects over the construction and operational phases.
During the construction phase, capital investment associated with the preferred plan would generate
supply chain benefits, employment opportunities and increased spend in the local economy by contractors
and construction workers, and has been assessed as having an overall significant positive effect on
wellbeing. However, the operation of plant and machinery and vehicle movements during the construction
phase for Manchester and Pennine Resilience Solution D, and the leakage reduction and network metering
options, would generate emissions to air and has therefore been assessed as having a significant negative
effect on air quality and climate change, and a minor negative effect on health. Solution D has also been
assessed as having a minor negative effect on biodiversity, water quantity and quality, geology and soils,
and flood risk. However, these effects reflect the emissions to air, energy and resource use associated with
the implementation of the water management measures, which is to a large extent unavoidable (although
effects may be reduced at the project stage through, for example, the use of renewable energy and
sustainably sourced construction materials).
Once construction activity associated with the preferred plan is complete, there are likely to be very few
adverse environmental impacts and no significant negative operational effects have been identified. Only a
negative effect on water quantity and quality as a result of Solution D has been identified at this stage,
although some uncertainty remains. No operational effects are expected on biodiversity, geology and soils,
flood risk, air quality, cultural heritage or landscape.
The assessment has also identified a number of significant positive effects across several of the SEA
objectives. The strategic choices ensure continuity of water supply to customers and support population
and economic growth, and therefore would have a significant positive effect on health and wellbeing. In
terms of climate change mitigation, demand reductions and lower levels of leakage may reduce
93 The 25 Year plan states that the government will “embed an environmental net gain principle for development”. While there is a metric for biodiversity net gain, there is currently no industry ready metric to account for ecosystem services. A Defra tool based on the biodiversity net gain metric (referenced above) is currently being developed for environmental net gain. https://assets.publishing.service.gov.uk/government/uploads/system/uploads/attachment_data/file/693158/25-year-environment-plan.pdf

United Utilities Final Water Resources Management Plan 2019
© United Utilities Water Limited 2019 Page 144 of 191
greenhouse gas emissions and energy use; overall, the preferred plan has been assessed as having a mixed
significant positive and minor negative effect on climate change and resource use. The leakage reduction
programme and preferred demand management options would lower demand for water abstraction, and
has been assessed as having a significant positive effect on water resources and a positive effect on water
quantity and quality.
Water Framework Directive Assessment
The final Water Resources Management Plan was found to be in compliance with the requirements of the
Water Framework Directive. In terms of the current abstraction licences, the assessments indicate that
although there is some residual risk, the operation of the licences, the reductions noted by the
Environment Agency and the schemes identified for completion by 2020 (Section 4.4.3) should be enough
to mitigate against any significant risks to the Water Framework Directive water bodies in future.
The Water Framework Directive Assessment for the options that comprise the preferred plan have been
reviewed and updated to ensure that our plan has been fully assessed in terms of its potential impacts on
WFD water bodies. For our final plan, the options assessed are those resilience options that comprise the
preferred Manchester and Pennine Resilience Solution D. The assessment results indicate that one of the
options that constitutes Solution D could have a medium level of impact against Water Framework
Directive objectives, and as such will require further assessment at the detailed planning (project) stage.
However, the impact assessments were based on a precautionary approach, and with further mitigation,
the option is unlikely to result in significant or long-term potential impacts. As such, it will be possible to be
compliant with Water Framework Directive objectives.
Habitats Regulations Assessment
The conclusion of the Habitats Regulations Assessment is that the preferred plan will have no adverse
effects, alone or in combination, on any European sites, that cannot be reliably avoided or mitigated using
normal project-level controls. There is still the requirement for standard avoidance measures to be
employed, including consideration at the planning stage of the potential for European sites to be affected,
to ensure that potential adverse effects can be identified and avoided at the project stage.
The conclusion does not remove the need for consideration of a Habitats Regulation Assessment at the
project-level, which will be required to address those aspects and uncertainties that cannot be
meaningfully assessed at the plan-level, such as potential ‘in combination’ effects with forthcoming plans or
projects that may coincide with option delivery.
Invasive Non Native Species Assessment (INNS)
Where there is a transfer of raw water there is potential to pose a risk to the spread of invasive non-native
species (INNS). We have undertaken a preliminary INNS assessment to consider whether the options
included in the preferred plan could pose a risk to the spread of invasive non-native species, as detailed in
our Final WRMP19 Technical Report - Options appraisal. As the options in our preferred plan do not involve
the transfer of raw water, we have identified that INNS risk assessments will not be needed. We have also
assessed our existing transfers as outlined in our Final WRMP19 Technical Report - Supply forecasting.
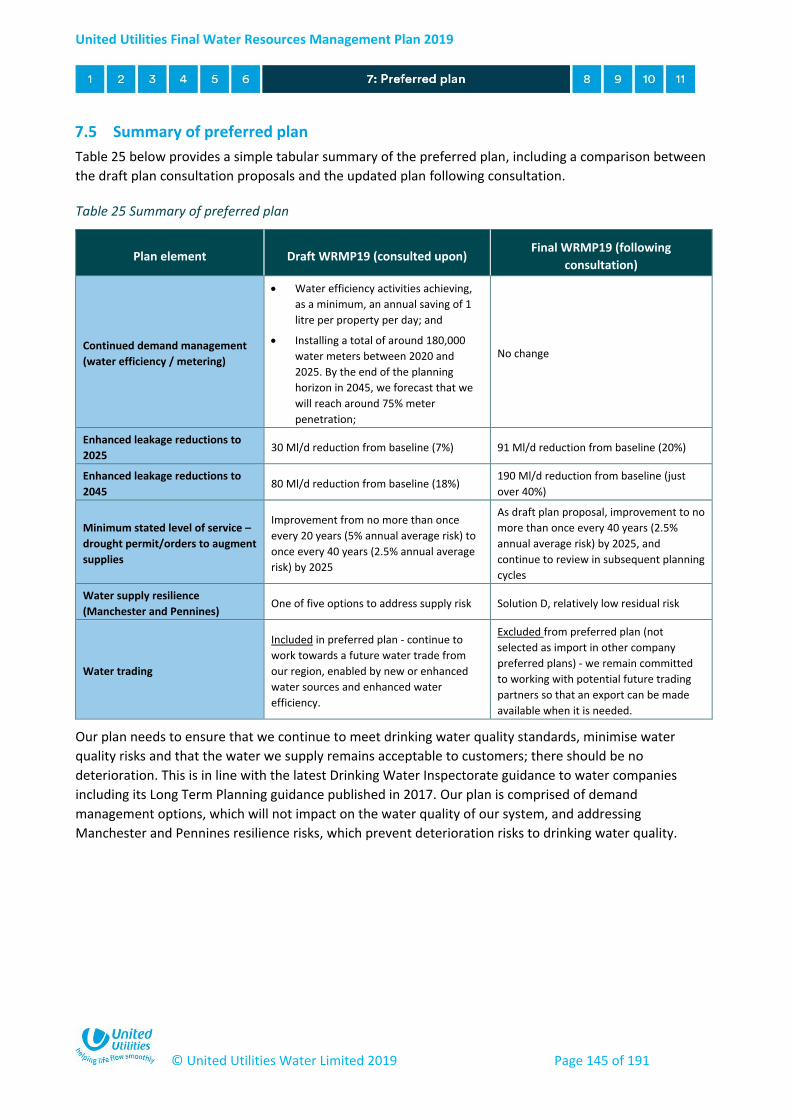
United Utilities Final Water Resources Management Plan 2019
© United Utilities Water Limited 2019 Page 145 of 191
7.5 Summary of preferred plan
Table 25 below provides a simple tabular summary of the preferred plan, including a comparison between
the draft plan consultation proposals and the updated plan following consultation.
Table 25 Summary of preferred plan
Plan element Draft WRMP19 (consulted upon) Final WRMP19 (following
consultation)
Continued demand management
(water efficiency / metering)
Water efficiency activities achieving,
as a minimum, an annual saving of 1
litre per property per day; and
Installing a total of around 180,000
water meters between 2020 and
2025. By the end of the planning
horizon in 2045, we forecast that we
will reach around 75% meter
penetration;
No change
Enhanced leakage reductions to
2025 30 Ml/d reduction from baseline (7%) 91 Ml/d reduction from baseline (20%)
Enhanced leakage reductions to
2045 80 Ml/d reduction from baseline (18%)
190 Ml/d reduction from baseline (just
over 40%)
Minimum stated level of service –
drought permit/orders to augment
supplies
Improvement from no more than once
every 20 years (5% annual average risk) to
once every 40 years (2.5% annual average
risk) by 2025
As draft plan proposal, improvement to no
more than once every 40 years (2.5%
annual average risk) by 2025, and
continue to review in subsequent planning
cycles
Water supply resilience
(Manchester and Pennines) One of five options to address supply risk Solution D, relatively low residual risk
Water trading
Included in preferred plan - continue to
work towards a future water trade from
our region, enabled by new or enhanced
water sources and enhanced water
efficiency.
Excluded from preferred plan (not
selected as import in other company
preferred plans) - we remain committed
to working with potential future trading
partners so that an export can be made
available when it is needed.
Our plan needs to ensure that we continue to meet drinking water quality standards, minimise water
quality risks and that the water we supply remains acceptable to customers; there should be no
deterioration. This is in line with the latest Drinking Water Inspectorate guidance to water companies
including its Long Term Planning guidance published in 2017. Our plan is comprised of demand
management options, which will not impact on the water quality of our system, and addressing
Manchester and Pennines resilience risks, which prevent deterioration risks to drinking water quality.
United Utilities Final Water Resources Management Plan 2019
© United Utilities Water Limited 2019 Page 146 of 191
8 Water trading adaptive pathway
8.1 Context for pathway approach
As part of our options identification process, we discuss the potential for water trading with other water
companies (as detailed in Section 8 of Final WRMP19 Technical Report - Options identification). This
complemented collaborative work at a national level (Section 3.8). Building on dialogue in the previous
planning round, at the draft Water Resources Management Plan stage a potential trade to Thames Water
from Lake Vyrnwy via a Severn-Thames transfer was explored (Section 6.5).
Given long-term uncertainty and the scale of such a proposal, we acknowledged as early as pre-
consultation that it was likely confirmation of need and investigation of such options would span multiple
planning rounds. Noting this, and given that companies are completing Water Resources Management
Plans simultaneously, limiting the opportunity for iteration, we decided to adopt a pathway approach
(essentially a very detailed scenario). This ensured that we could explore, using a prospective real-world
case, how a future water trading export could work. It also allowed us to consult with stakeholders and
customers on our strategy to facilitate such a trade, should it ever be selected as part of another company
plan. Such activity could then inform any future water trading investigation and it also ensured that we
were agile as other company requirements changed.
In order to maintain supplies to customers if exporting from Lake Vyrnwy we would need to make
modifications to our supply system. This would include developing new sources of water and options to
reduce demand to ensure there is no impact on customers or the environment, taking into account the
benefits of our leakage reduction programme. In the draft Water Resources Management Plan we included
this water trading pathway in our preferred plan. We had a mainly positive response to water trading
Key points
Following consultation it remains our preference to continue working towards
making water available for export.
To align our plan with others, the export no longer forms part of our formal preferred
plan, but we have retained the full appraisal of how a future large-scale national
water trade could look in an adaptive pathway.
The pathway could form the basis of a future preferred plan, e.g. in Water Resources
Management Plan 2024.
Our strategy to facilitate a future trade sets out how customers and the environment
are protected under a future export. We demonstrate that this would be both ‘best
value’ and sustainable in the long-term.
We are committed to working with potential future trading partners so that an
export can be made available when it is needed.
United Utilities Final Water Resources Management Plan 2019
© United Utilities Water Limited 2019 Page 147 of 191
during consultation, subject to further work and protection of customers and the environment, as
explained in Section 6.5.
Given that a water trade has not been selected by other water companies in the core 25-year part of the
planning horizon as part of their preferred plans (our preferred plan is outlined in Section 7), an updated
Summary – The Severn Thames Transfer
The pressures of population growth and climate change are affecting the whole of the South East of
England. By working together with other water companies across England and Wales we’re taking a
coordinated approach to planning for the future and making sure all our plans offer customers the best
possible value for money. The water transfers we have looked at include transferring water from the
Midlands, Wales and the North West and transferring it via the River Seven and across to the River
Thames.
A number of variants of the Severn Thames transfer have been considered as we developed our plans.
United Utilities, Severn Trent, Welsh Water, and the Canal and River Trust have provided options to
free-up water in the River Severn catchment. Thames Water has considered these options for
transferring water from the River Severn and River Wye to the River Thames.
In appraising options to meet its own needs, and the needs of other companies in the South East,
Thames Water has selected a Severn Thames transfer as part of its long term preferred plan. This
includes, from 2083 onwards:
300 Ml/d pipeline transfer between Deerhurst on the River Severn and Culham on the River Thames, including treatment for invasive non-native species
90 Ml/d of support from Vyrnwy reservoir provided by United Utilities, 60 Ml/d of which would be released into tributaries of the Upper Severn and 30 Ml/d would be provided to Severn Trent Water to offset their abstractions further downstream
15 Ml/d of support from Severn Trent at Mythe in Gloucestershire
35 Ml/d of support from Severn Trent’s Netheridge sewerage treatment works in Gloucestershire
Thames Water also considered a number of scenarios. The Severn Thames transfer is called on under
some scenarios tested. The earliest the transfer is required in these scenarios is 2039. The scenarios
select a range of different support options up to 250 Ml/d in total. The 250 Ml/d support comprises of
125 Ml/d from Vyrnwy reservoir and 125 Ml/d from Severn Trent options.
Given the national strategic importance of the Severn to Thames transfer scheme, as recognised by the
National Infrastructure Commission report ‘Preparing for a Drier Future’, we remain committed to
ensuring that momentum is maintained. To this end we will continue to work on appropriate technical
and environmental aspects in 2020-25, for example ecological work, losses and reliability, water
quality, regulation, river temperature, in partnership with the other companies. We will continue to
work closely with the other companies to examine these options in more detail. This will allow the
transfer options to be considered further in future WRMPs.
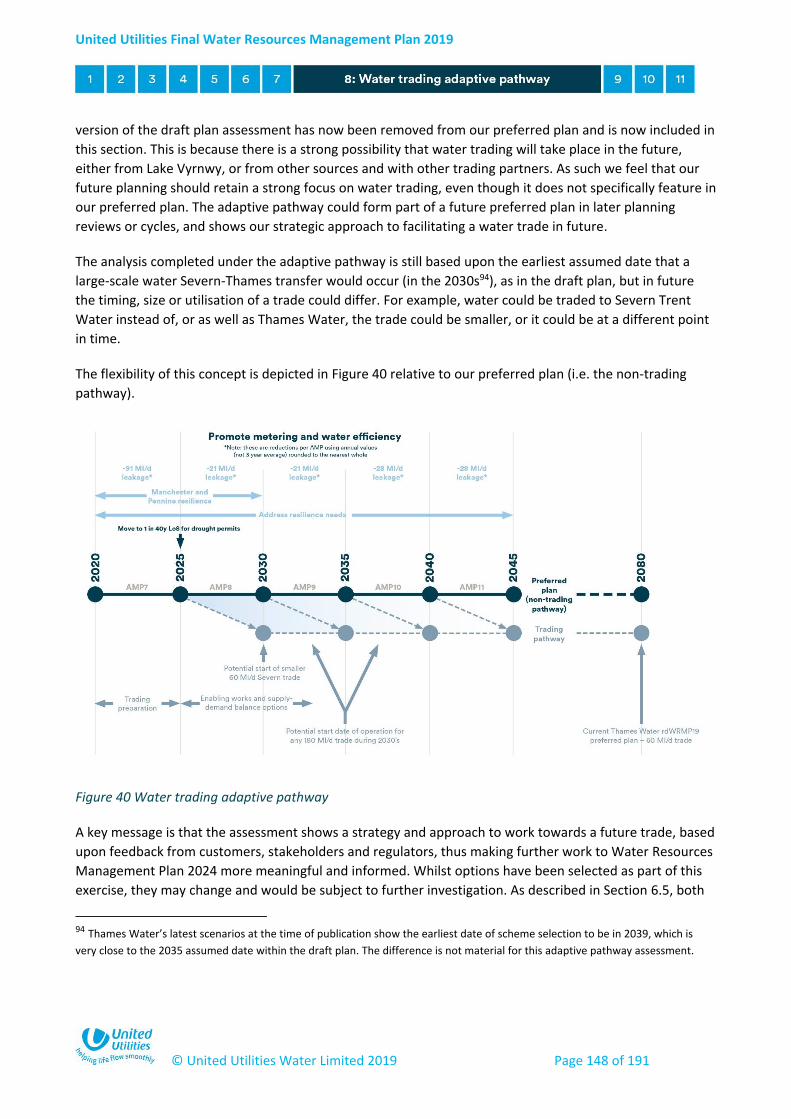
United Utilities Final Water Resources Management Plan 2019
© United Utilities Water Limited 2019 Page 148 of 191
version of the draft plan assessment has now been removed from our preferred plan and is now included in
this section. This is because there is a strong possibility that water trading will take place in the future,
either from Lake Vyrnwy, or from other sources and with other trading partners. As such we feel that our
future planning should retain a strong focus on water trading, even though it does not specifically feature in
our preferred plan. The adaptive pathway could form part of a future preferred plan in later planning
reviews or cycles, and shows our strategic approach to facilitating a water trade in future.
The analysis completed under the adaptive pathway is still based upon the earliest assumed date that a
large-scale water Severn-Thames transfer would occur (in the 2030s94), as in the draft plan, but in future
the timing, size or utilisation of a trade could differ. For example, water could be traded to Severn Trent
Water instead of, or as well as Thames Water, the trade could be smaller, or it could be at a different point
in time.
The flexibility of this concept is depicted in Figure 40 relative to our preferred plan (i.e. the non-trading
pathway).
Figure 40 Water trading adaptive pathway
A key message is that the assessment shows a strategy and approach to work towards a future trade, based
upon feedback from customers, stakeholders and regulators, thus making further work to Water Resources
Management Plan 2024 more meaningful and informed. Whilst options have been selected as part of this
exercise, they may change and would be subject to further investigation. As described in Section 6.5, both
94 Thames Water’s latest scenarios at the time of publication show the earliest date of scheme selection to be in 2039, which is
very close to the 2035 assumed date within the draft plan. The difference is not material for this adaptive pathway assessment.
United Utilities Final Water Resources Management Plan 2019
© United Utilities Water Limited 2019 Page 149 of 191
Thames Water and Severn Trent Water want to continue to explore a potential water import from the
North West in future. Thames Water have also included the Vyrnwy option in their preferred plan, but in
208395, which is outside our core assessment horizon.
The remainder of Section 8 outlines the changes made since the draft Water Resources Management Plan
for this pathway, and presents the final picture for this final plan taking account of consultation feedback
(e.g. on options).
8.2 Strategy and options under the adaptive pathway
The approach taken at draft plan and consulted upon has been retained in principle, which is to protect
customers and environment from deterioration from the levels they would otherwise have experienced
following leakage reductions included in the plan. This ensures that improved resilience and levels of
service resulting from these investments are not lost subsequently through water trading.
As outlined in Section 7.2, we used our sophisticated new extended methods process for selecting options
for water trading. The principal reasons for doing this were:
(i) To take into account significant medium to long-term uncertainties, in particular associated
with droughts and climate change; and
(ii) Ensure that customers and the environment in the northwest are protected under such a
trading agreement.
The extended methods input data were largely unchanged from the draft to final Water Resource
Management Plan. However, there were two key updates that resulted from the consultation process:
Feedback was received during consultation on some of the options previously selected for trading,
particularly around environmental considerations96. We therefore screened some additional
options out from the feasible list prior to completing the extended methods options appraisal; and
Supply-demand balance related data was updated in line with changes made to the final plan
(Section 4), and in particular, enhancements to the planned level of leakage reduction in the 2030s
(Section 7.4.2).
We were also able to make a minor improvement to the process itself, which allowed better cost
optimisation of the portfolios of options tested. We have included a detailed explanation of the extended
methods process, including differences between draft and final approach, in Section 4 of the Final WRMP19
Technical Report - Options appraisal.
The portfolio of options selected for the water trading adaptive pathway bears a close resemblance to that
presented in the preferred plan at the draft stage (available in Appendix D for reference). However,
following the above changes three options are no longer selected at this stage:
Python Mill (WR114)
Shropshire Union Canal (WR821)
95 Our plan is tested to the 2080s, however, the core supply-demand assessment of need is focused on the 25-year horizon. 96 We had flagged risks warranting further investigation or mitigation on some options, and in some cases already identified
appropriate substitutes
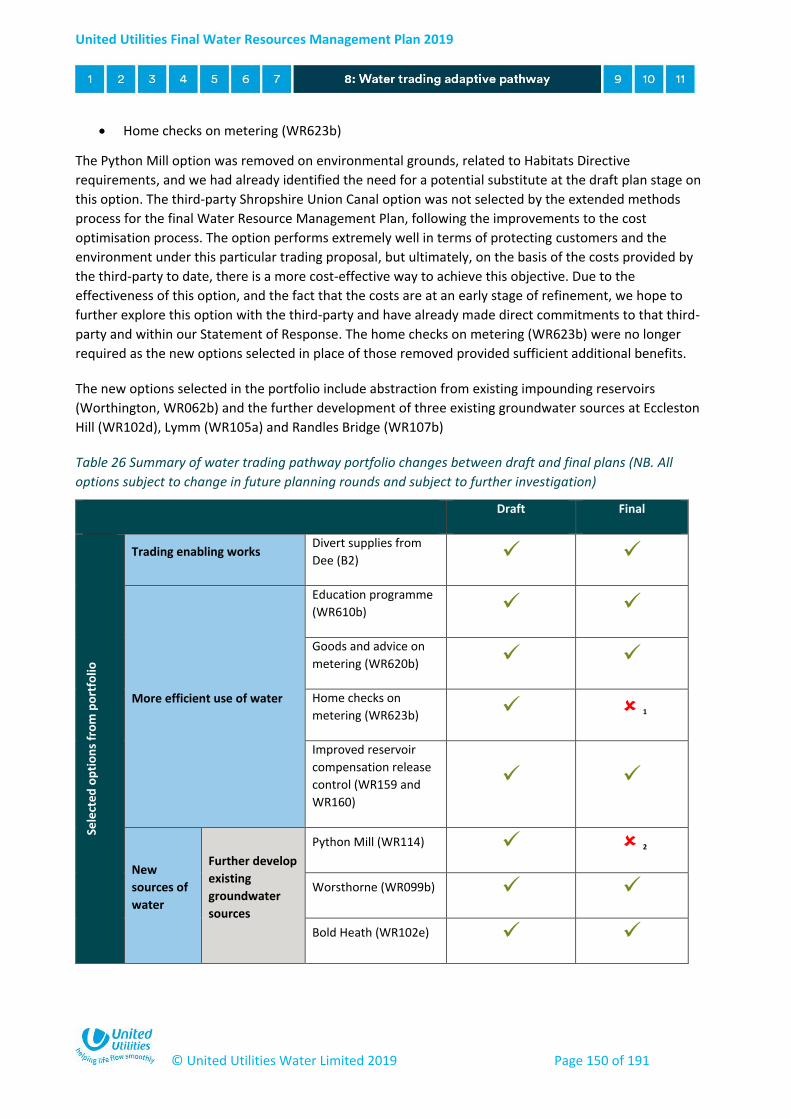
United Utilities Final Water Resources Management Plan 2019
© United Utilities Water Limited 2019 Page 150 of 191
Home checks on metering (WR623b)
The Python Mill option was removed on environmental grounds, related to Habitats Directive
requirements, and we had already identified the need for a potential substitute at the draft plan stage on
this option. The third-party Shropshire Union Canal option was not selected by the extended methods
process for the final Water Resource Management Plan, following the improvements to the cost
optimisation process. The option performs extremely well in terms of protecting customers and the
environment under this particular trading proposal, but ultimately, on the basis of the costs provided by
the third-party to date, there is a more cost-effective way to achieve this objective. Due to the
effectiveness of this option, and the fact that the costs are at an early stage of refinement, we hope to
further explore this option with the third-party and have already made direct commitments to that third-
party and within our Statement of Response. The home checks on metering (WR623b) were no longer
required as the new options selected in place of those removed provided sufficient additional benefits.
The new options selected in the portfolio include abstraction from existing impounding reservoirs
(Worthington, WR062b) and the further development of three existing groundwater sources at Eccleston
Hill (WR102d), Lymm (WR105a) and Randles Bridge (WR107b)
Table 26 Summary of water trading pathway portfolio changes between draft and final plans (NB. All
options subject to change in future planning rounds and subject to further investigation)
Draft Final
Sele
cted
op
tio
ns
fro
m p
ort
folio
Trading enabling works Divert supplies from
Dee (B2)
More efficient use of water
Education programme
(WR610b)
Goods and advice on
metering (WR620b)
Home checks on
metering (WR623b) 1
Improved reservoir
compensation release
control (WR159 and
WR160)
New
sources of
water
Further develop
existing
groundwater
sources
Python Mill (WR114) 2
Worsthorne (WR099b)
Bold Heath (WR102e)

United Utilities Final Water Resources Management Plan 2019
© United Utilities Water Limited 2019 Page 151 of 191
Tytherington (WR113)
Franklaw (WR101)
Eccleston Hill
(WR102d) 3
Lymm (WR105a) 3
Randles Bridge
(WR107b) 3
Reinstatement
of existing
impounding
reservoir
Worthington
(WR062b) 3
Third party
supply
Shropshire Union Canal
at Hurleston (WR821) 4
Supply capacity / demand reduction 111 Ml/d 112 Ml/d
Cost (NPV with E&S costs) £260m £231m
1 Not selected on cost grounds, but potentially good option to support trading, if innovations in this area reduce the cost of delivery 2 Removed on environmental grounds, following specific issues raised during consultation 3 Not selected at draft 4 Not selected on cost grounds but good option to support trading (warrants further post-WRMP discussions with third-party)
The resulting options currently selected under this pathway are shown in Figure 41 and Figure 42 below. The new supplies will provide water to offset that which would normally come from the River Dee and Vyrnwy. These options have been selected to maintain resilience and maintain environmental standards.

United Utilities Final Water Resources Management Plan 2019
© United Utilities Water Limited 2019 Page 152 of 191
For any new supplies, or changes to existing supplies, we would ensure that there is no deterioration to drinking water quality (Section 8.4).
Figure 41 Summary options selected under the adaptive pathway for water trading
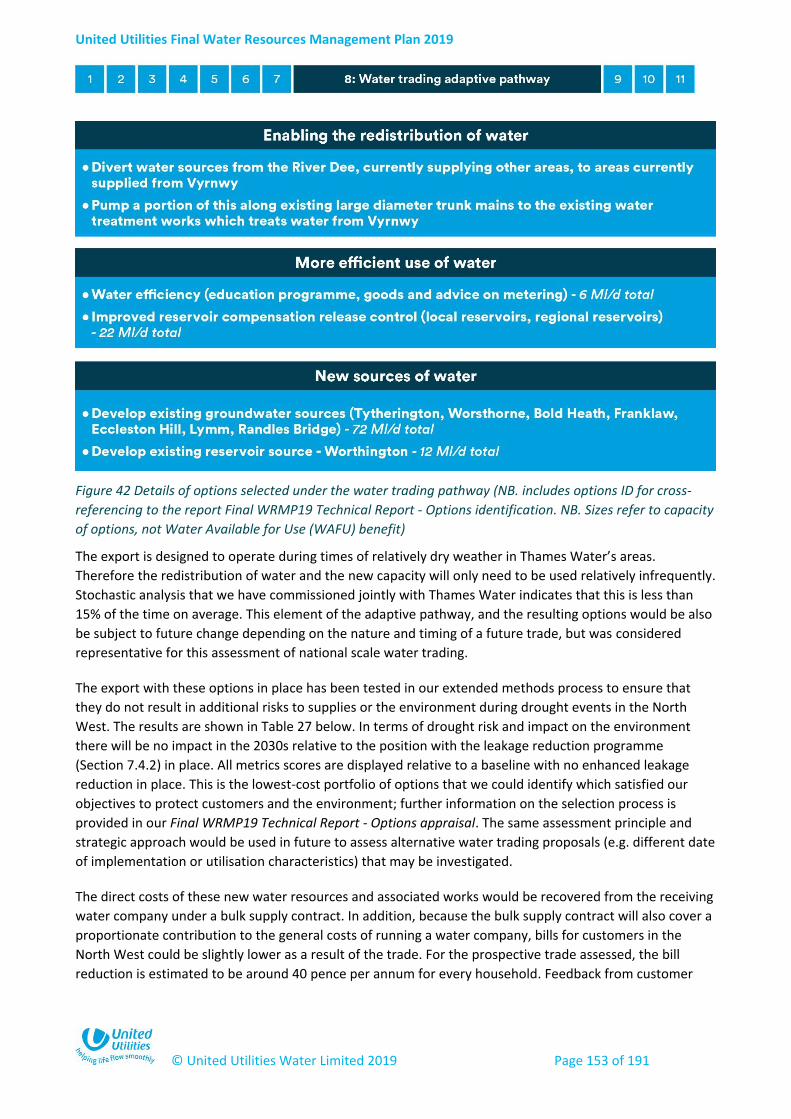
United Utilities Final Water Resources Management Plan 2019
© United Utilities Water Limited 2019 Page 153 of 191
Figure 42 Details of options selected under the water trading pathway (NB. includes options ID for cross-
referencing to the report Final WRMP19 Technical Report - Options identification. NB. Sizes refer to capacity
of options, not Water Available for Use (WAFU) benefit)
The export is designed to operate during times of relatively dry weather in Thames Water’s areas.
Therefore the redistribution of water and the new capacity will only need to be used relatively infrequently.
Stochastic analysis that we have commissioned jointly with Thames Water indicates that this is less than
15% of the time on average. This element of the adaptive pathway, and the resulting options would be also
be subject to future change depending on the nature and timing of a future trade, but was considered
representative for this assessment of national scale water trading.
The export with these options in place has been tested in our extended methods process to ensure that
they do not result in additional risks to supplies or the environment during drought events in the North
West. The results are shown in Table 27 below. In terms of drought risk and impact on the environment
there will be no impact in the 2030s relative to the position with the leakage reduction programme
(Section 7.4.2) in place. All metrics scores are displayed relative to a baseline with no enhanced leakage
reduction in place. This is the lowest-cost portfolio of options that we could identify which satisfied our
objectives to protect customers and the environment; further information on the selection process is
provided in our Final WRMP19 Technical Report - Options appraisal. The same assessment principle and
strategic approach would be used in future to assess alternative water trading proposals (e.g. different date
of implementation or utilisation characteristics) that may be investigated.
The direct costs of these new water resources and associated works would be recovered from the receiving
water company under a bulk supply contract. In addition, because the bulk supply contract will also cover a
proportionate contribution to the general costs of running a water company, bills for customers in the
North West could be slightly lower as a result of the trade. For the prospective trade assessed, the bill
reduction is estimated to be around 40 pence per annum for every household. Feedback from customer

United Utilities Final Water Resources Management Plan 2019
© United Utilities Water Limited 2019 Page 154 of 191
research indicated that it may be better to reinvest the proceeds into future water resource management.
We will explore this in future planning rounds.
Table 27 Details of cost, bill impact and metric scores for the water trading adaptive pathway (note the blue
row relates to the preferred plan, with green denoting this pathway for comparison)
# Description
Cumulative
cost 80 year
NPV including
environmental
and social
costs (£m)
Estimated
cumulative
change in bill
(£/annum)
NB. Individual
summations in
brackets
Change in the
likelihood of
temporary use
bans
Change in
drought
resilience
Change in river
flows and
implementation
length of
drought permits
to augment
supply
1 Continued demand
management
0 0
Baseline Baseline Baseline
2
+ enhanced leakage
reduction and
improved LoS for
drought permits to
augment supply
302.6 3.25 +++ ++ +++
3
+ resilience to other
hazards (preferred
plan)
1267.6
(302.6 + 965)
11.43
(3.25 + 8.18)
As above As above As above
4
+ water trading
adaptive pathway
1498.7
(1267.6 + 231.1)
11.03
(11.43 - 0.40)
+++ ++ +++
For the purposes of preparing water resources management plans, we have agreed with Thames Water
that any environmental impacts downstream of Vyrnwy in the Severn and Thames catchments will be
assessed in its Water Resources Management Plan process. So for example, the risk of transferring invasive
non-native species from the River Severn to the River Thames has been assessed in Thames Water’s plan
and mitigation included. We have included a summary of their environmental assessments in Section 8.3.
We would expect the same principle to apply to trades to other water companies.
Table 28 shows an expansion of the previous table, but allows comparison of the adaptive pathway to
potential lower or higher cost portfolios (and in essence strategies) to meet facilitate a water trade (as well
as to the baseline and preferred plan positions). By the current earliest assumed date to commence trading
for the pathway (so in this case in the 2030s), customers and the environment will be benefitting from our
strategic choice to enhance leakage reduction under the preferred plan, as highlighted by the green ‘plus’
NSC no significant change +/++/+++ favourable -/--/--- unfavourable
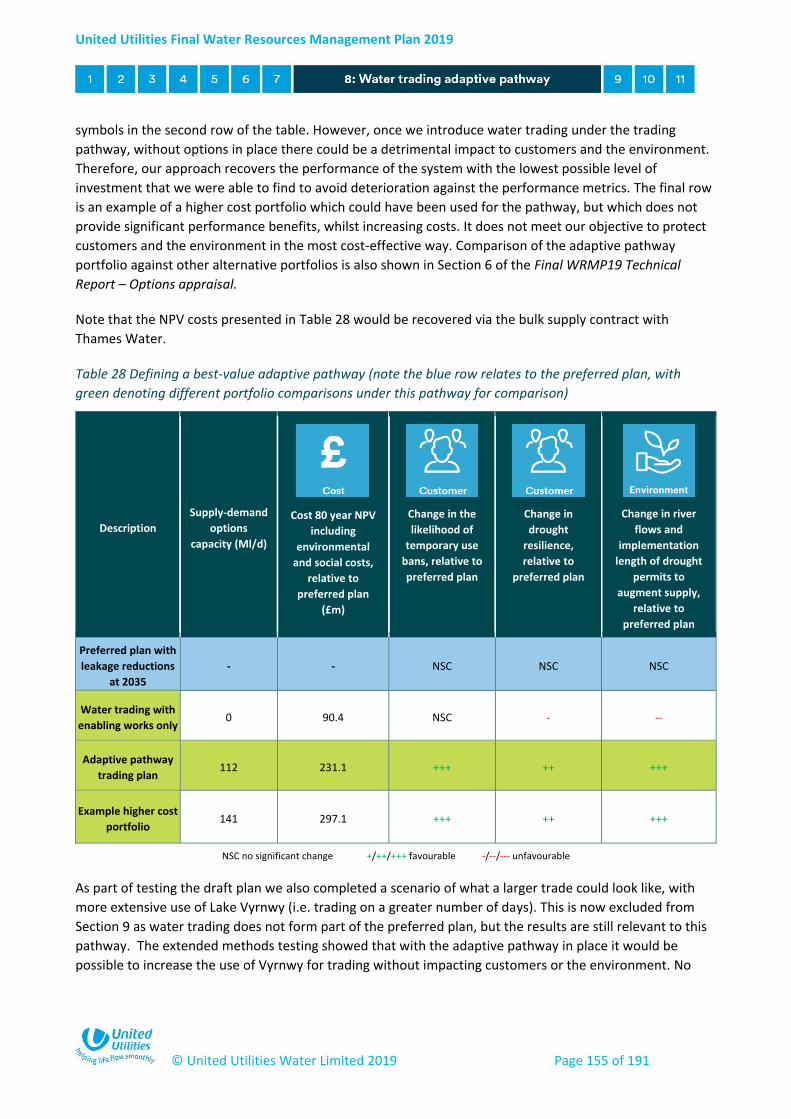
United Utilities Final Water Resources Management Plan 2019
© United Utilities Water Limited 2019 Page 155 of 191
symbols in the second row of the table. However, once we introduce water trading under the trading
pathway, without options in place there could be a detrimental impact to customers and the environment.
Therefore, our approach recovers the performance of the system with the lowest possible level of
investment that we were able to find to avoid deterioration against the performance metrics. The final row
is an example of a higher cost portfolio which could have been used for the pathway, but which does not
provide significant performance benefits, whilst increasing costs. It does not meet our objective to protect
customers and the environment in the most cost-effective way. Comparison of the adaptive pathway
portfolio against other alternative portfolios is also shown in Section 6 of the Final WRMP19 Technical
Report – Options appraisal.
Note that the NPV costs presented in Table 28 would be recovered via the bulk supply contract with
Thames Water.
Table 28 Defining a best-value adaptive pathway (note the blue row relates to the preferred plan, with
green denoting different portfolio comparisons under this pathway for comparison)
Description
Supply-demand
options
capacity (Ml/d)
Cost 80 year NPV
including
environmental
and social costs,
relative to
preferred plan
(£m)
Change in the
likelihood of
temporary use
bans, relative to
preferred plan
Change in
drought
resilience,
relative to
preferred plan
Change in river
flows and
implementation
length of drought
permits to
augment supply,
relative to
preferred plan
Preferred plan with
leakage reductions
at 2035
- - NSC NSC NSC
Water trading with
enabling works only 0 90.4 NSC - --
Adaptive pathway
trading plan 112 231.1 +++ ++ +++
Example higher cost
portfolio 141 297.1 +++ ++ +++
As part of testing the draft plan we also completed a scenario of what a larger trade could look like, with
more extensive use of Lake Vyrnwy (i.e. trading on a greater number of days). This is now excluded from
Section 9 as water trading does not form part of the preferred plan, but the results are still relevant to this
pathway. The extended methods testing showed that with the adaptive pathway in place it would be
possible to increase the use of Vyrnwy for trading without impacting customers or the environment. No
NSC no significant change +/++/+++ favourable -/--/--- unfavourable
United Utilities Final Water Resources Management Plan 2019
© United Utilities Water Limited 2019 Page 156 of 191
new options would likely be required, but the level of utilisation of those selected would be higher. This
helped to demonstrate a long-term best value plan following the aforementioned approach.
Were the trade to have a smaller capacity, for instance 90 Ml/d, from 2083 onwards a cheaper portfolio,
with less capacity, would likely give performance that protected our customers and the environment.
Whilst not tested quantitatively at this stage it is likely the portfolio would comprise the demand
management and compensation flow reduction options, along with some of the more cost effective
groundwater sources, selected for our adaptive pathway.
We have also taken the opportunity provided by the extended methods process to explore how the water
trading adaptive pathway would perform beyond the 2020-2045 planning period, right out to the 2080s.
We used the 2080s UKCP09 climate change projections (Section 4.4.4), extended our demand forecast and
included a working assumption that we would continue to enhance leakage reduction by 10 Ml/d every 5
years beyond 2045.
This demonstrated that our adaptive pathway was relatively robust in the 2080s, and we would only need
to invest in some additional groundwater capacity in the south of the region (Cheshire). Under all
circumstances we would protect the water quality of supplies to all customers.
8.3 Environmental appraisal
As set out in the previous section, we will ensure that any future water trading agreement does not
negatively impact on customers or the environment. We have selected a plan that is cost effective and
sustainable in the long-term. The plan has been subject to an overall assessment of environmental impact
to inform options appraisal and selection of the plan to inform the adaptive pathway. As we are retaining
an adaptive pathway for water trading, the feasible option assessments have been retained in the
environmental reports, and updated where possible. A summary of these reports in the context of water
trading is provided below.
We have also published an Environmental and Social Costs report, which also includes assessment of the
environmental and social costs of the water trading supply-demand options97. The assessment was
undertaken on all feasible options identified at the draft plan stage, including those options now included in
the revised portfolio to support water trading.
Strategic Environmental Assessment (SEA)
The Strategic Environmental Assessment contains an assessment of two portfolios of options identified to
facilitate a water trade. The assessment demonstrates that the cumulative effects of the trading portfolios
would be very similar, with significant positive effects identified across several of the SEA objectives,
including water quality and quantity, climate change, health, wellbeing, water resources and resource use.
Adverse effects associated with the construction/implementation of water management measures would
be short term and temporary, and it is expected that best practice construction techniques and methods
could be implemented at the project stage to help reduce the likelihood of such effects occurring and their
magnitude. Similarly, it is expected that negative operational effects could be managed to an acceptable
level at the project stage, with appropriate mitigation identified through further detailed assessment of
97 Environmental and Social Costs of Water Resources Management Plan 2019 Supply-Demand Options

United Utilities Final Water Resources Management Plan 2019
© United Utilities Water Limited 2019 Page 157 of 191
environmental impacts. The exception to this is in respect of climate change and resource use, where
cumulative significant negative effects have been identified during construction and operation for both
trading portfolios. However, these effects reflect the unavoidable energy and resource use associated with
the implementation of the water management measures, although this may be reduced at the project
stage. Overall significant negative effects on air quality have also been identified, as a result of the scale of
vehicle movements associated with the implementation of Manchester and Pennine Resilience Option 37-
42 (which features in both portfolios). The Severn Thames Transfer component of B2 required for both
alternatives could also have significant negative effects on cultural heritage and landscape during
construction.
For the purposes of the assessment, we agreed with Thames Water that any environmental impacts
downstream of Vyrnwy in the Severn catchment, and in the Thames catchments associated with this
transfer, would be assessed in Thames Water’s Water Resources Management Plan. The findings of Thames
Water’s SEA in respect of this transfer have been incorporated in our revised report and associated
cumulative assessment.
Water Framework Directive Assessment
The Water Framework Directive Assessment includes an assessment of the supply-demand options and
enabling works required to facilitate a water trade. The assessment of these options has been retained in
the report; the conclusion at the draft plan stage indicated that most of the options could have a medium
level of impact against Water Framework Directive objectives, and as such would require further
assessment at detailed planning stage. However, the impact assessments were based on a precautionary
approach and could be mitigated. As such, it would be possible to be compliant with Water Framework
Directive objectives.
For the purposes of the assessment, we agreed with Thames Water that any environmental impacts
downstream of Vyrnwy in the Severn catchment, and in the Thames catchments associated with this
transfer, would be assessed in Thames Water’s Water Resources Management Plan. The findings of Thames
Water’s WFD assessment in respect of this transfer have been incorporated in the revised report. As the
water traded is currently abstracted for our supply, it is assumed that there would be no impacts on Lake
Vyrnwy itself.
Habitats Regulations Assessment
The Habitats Regulations Assessment includes an assessment of the supply-demand options and enabling
works required to facilitate a water trade. The conclusion at the draft plan stage indicated that two of the
options could have an adverse effect on European sites, and as such would require further assessment at
detailed planning stage. No further assessment of these options has been undertaken for the revised
report, however the results of the assessment at draft plan stage has been retained.
Invasive Non Native Species Assessment (INNS)
Where there is a transfer of raw water there is potential to pose a risk to the spread of invasive non-native
species (INNS). We have undertaken a preliminary INNS assessment to consider whether the options
included in the preferred plan could pose a risk to the spread of invasive non-native species, as detailed in
our Final WRMP19 Technical Report - Options appraisal.
United Utilities Final Water Resources Management Plan 2019
© United Utilities Water Limited 2019 Page 158 of 191
The national water trading pathway involves the transfer of raw water between the River Severn and the
River Thames catchments. If this scheme is progressed it will require a more detailed INNS risk assessment.
As the option is associated with national water trading there is sufficient time to undertake this work in the
future and ensure that any risks are mitigated. The assessment of these elements of the scheme are
covered in Thames Water’s Water Resources Management Plan.
8.4 Drinking water quality
Our plan needs to ensure that we continue to meet drinking water quality standards, minimise water
quality risks and that the water we supply remains acceptable to customers; there should be no
deterioration. This is in line with the latest Drinking Water Inspectorate guidance to water companies
including its Long Term Planning guidance published in 2017.
Through the development of our plan, we have considered the potential water quality changes that may
occur within our supply system. In accordance with Drinking Water Inspectorate guidance, any changes to
the supply will need to ensure that there is no deterioration in the absolute water quality parameters and
aesthetic water quality. This is of particular relevance for resilience and water trading drivers where there
could be transient changes to how our supply system operates at certain times. There is the potential for
increased numbers of customer contacts if these types of scenarios are not correctly managed (for
example, due to aesthetic or taste changes).
We have considered this risk of ‘deterioration’ of water quality in a number of ways:
All options that we have considered have been designed to ensure that they meet the required
drinking water quality standards. This is a regulatory requirement;
Furthermore, we have also considered whether additional stages of water treatment processes
may be required in order to reduce the risks of water quality changes and to ensure that our
supplies remain acceptable to customers. This thinking has been built into our Engineering
assumptions used to support the development of our feasible options. For example, a water
softening process may be required in certain circumstances (for instance if water supplies changed
from surface water to groundwater, or from Vyrnwy to Dee). It is recognised that if any of the
options are taken forward as part of the preferred plan, then a higher level of design maturity will
be required, in conjunction with the regulators to ensure customers are protected; and
We have completed some provisional analysis of our supply system during a water trading scenario
to understand the significance of the changes and where water quality impacts to customers might
be observed. This also includes any enabling works that are required to facilitate the water trading
scenario.
As part of the water trading adaptive pathway, we have assessed how the options selected could change
the composition of the water supplied in different parts of the supply system. We have done this using our
water resources models to indicate what proportion of demand they comprise when in operation during
indicative dry and normal demand years. Furthermore, we have also considered the effects of the water
trading ‘enabling works’ as these would be required ahead of options for water trading coming into
operation.
Figure 43 shows how each of the options could potentially change the composition of supplies in the areas
which they feed. The key conclusions from this graph are as follows:

United Utilities Final Water Resources Management Plan 2019
© United Utilities Water Limited 2019 Page 159 of 191
During water trading in a dry year, about 11% of the reduced output demand normally fed from
Lake Vyrnwy would be made up from the River Dee;
Existing and normally used groundwater sources at Tytherington (Macclesfield) and Franklaw
(Fylde) would be utilised more in both normal and dry demand year scenarios during water trading
at less than 15% of the total demand for that area;
Existing but unused groundwater sources at Bold Heath (Prescot), Eccleston Hill (Prescot) and
Worsthorne (Burnley)98 would be required to provide between 3% and 6% of the demand in dry
years. Bold Heath water would be mixed with other regional supplies prior to treatment.
Worsthorne is designed to offset compensation from existing impoundment reservoirs and so there
would be no change envisaged to the source water for the treatment works water.
The introduction of water from Worthington reservoirs and Randles Bridge groundwater sources
could change the composition of the water normally supplied to those areas significantly by 30%
and just less than 20% respectively.
Figure 43 Proportion of water supplied to the nearest demand centre from the new options when used for
water trading
In conclusion, there are some potential changes in water source in particular areas. The use of some
existing supply sources may change depending on the supply-demand requirements at certain times. We
will use this provisional analysis as we develop our long-term plans to understand the significance of these
changes, risks to water quality and that our supplies remain acceptable to customers at all times. We would
envisage that this would be through more specific assessments of the supply system changes, including a
98 Worsthorne is included in our Drought Plan as a supply side option. This WRMP19 option both makes this capacity permanently
available as a ‘business as usual’ source contributing to WAFU, whilst also adding additional asset capacity.
United Utilities Final Water Resources Management Plan 2019
© United Utilities Water Limited 2019 Page 160 of 191
better understanding of the potential risks and required mitigation, particularly where new sources of
water are required and/or where the type of water supplied changes (e.g. surface water to a significant
proportion of groundwater).
8.5 Assessment of wider supply resilience
The expected effect of the options in the water trading adaptive pathway, to our overall system resilience,
will be to at least maintain the existing level against all significant hazards. Whilst we have not yet carried
out all hazard system resilience assessments against the water trading options, we have assessed the
supply resilience to both drought and freeze-thaw hazards. Further detailed option design will address all
significant hazards associated with the options.
The modelled effects of the trading options during a drought are reported above. The same freeze-thaw
assessment process as discussed in Section 4.7.5 was applied to the system including trading options based
on the draft plan portfolio. In all of the cases assessed the system resilience was at least as high as in the
baseline case without the trading options. Further testing would occur in future, as require, to explore
different water trading variants or proposals.
8.6 Future and next steps
We will continue to work with others on water trading beyond Water Resources Management Plan 2019
towards the Water Resources Management Plan 2024 planning round. This will build on our approach to
this plan, drawing on the ongoing collaborative, multi-organisational work through, for example, Water UK,
Water Resources North and the River Severn Working/Modelling Groups etc. Given our experience in this
planning round, we will also actively support and engage on the Water Resources Management Plan 2024
planning framework to ensure that water trading can be as effectively appraised as possible.
We will undertake further work, as a donor company, to develop the feasible supporting option within its
supply area. These options are needed in order to release water that is currently used to supply customers
in the North West of England to be made available for the water transfer scheme. This will provide additional
confidence that the new supply is feasible, resilient in the face of future uncertainties, does not cause a
detrimental impact on the environment and to provide additional confidence in the cost estimates for these
options. This will build on the assessments already completed as part of Water Resources Management Plan
2019 and will include assessment of variants to the transfer scheme in terms of level and timing of support.
In addition we will provide senior manager resource to coordinate the work across the various parties and
ensure effective governance arrangements are in place. The total cost of this work is estimated at £1.0m,
and is included within our Business Plan submission.
The focus of the work in 2020-25 will be:
1. Senior management providing leadership and support to the joint work on the transfer scheme
across the various parties, and engaging with multiple stakeholders.
2. More detailed engineering assessments of the scope and costs of the supporting options, supported
by multi-discipline site based investigations.
3. Environmental studies for a number of supporting options, including a screening phase and more
detailed investigations at a smaller number of sites.

United Utilities Final Water Resources Management Plan 2019
© United Utilities Water Limited 2019 Page 161 of 191
4. A study to assess the contribution that our transfer options will make to the well-being goals for
Wales contained in the Well-being of Future Generations (Wales) Act 2015.
5. A study to assess whether changes to the magnitude of timing of River Severn support would affect
water levels at Vyrnwy reservoir and the environmental effects of any changes to water levels.
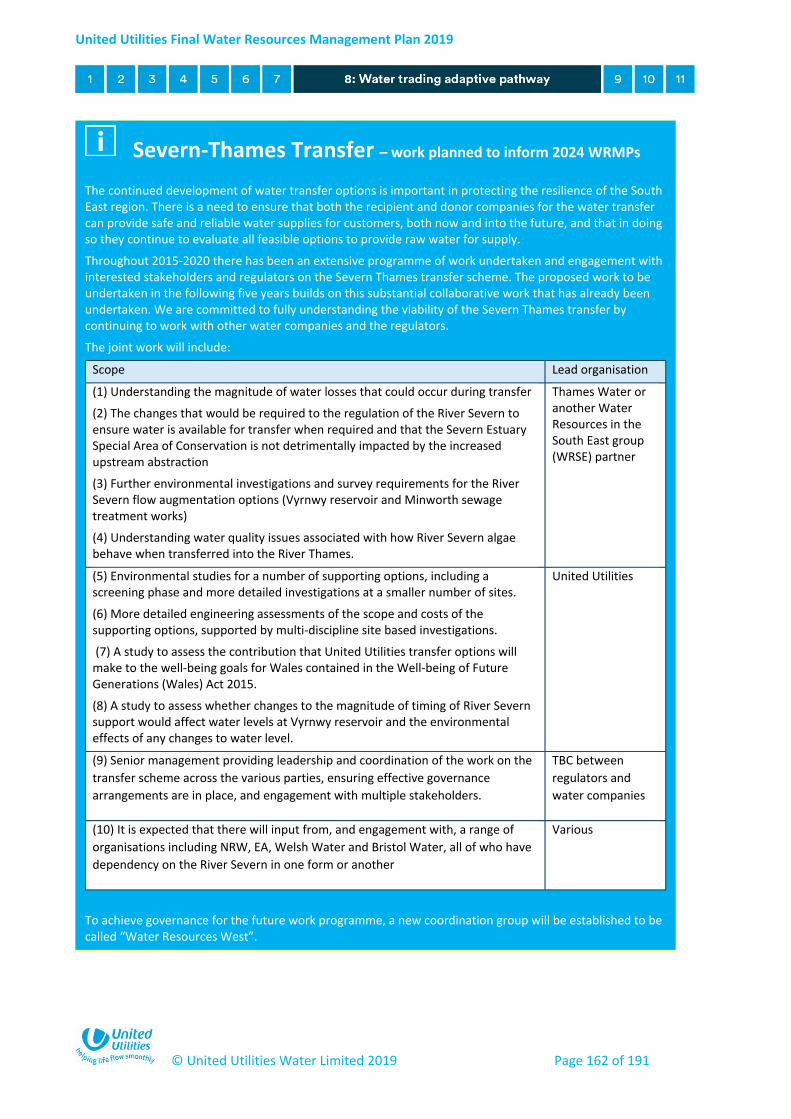
United Utilities Final Water Resources Management Plan 2019
© United Utilities Water Limited 2019 Page 162 of 191
Severn-Thames Transfer – work planned to inform 2024 WRMPs
The continued development of water transfer options is important in protecting the resilience of the South East region. There is a need to ensure that both the recipient and donor companies for the water transfer can provide safe and reliable water supplies for customers, both now and into the future, and that in doing so they continue to evaluate all feasible options to provide raw water for supply.
Throughout 2015-2020 there has been an extensive programme of work undertaken and engagement with interested stakeholders and regulators on the Severn Thames transfer scheme. The proposed work to be undertaken in the following five years builds on this substantial collaborative work that has already been undertaken. We are committed to fully understanding the viability of the Severn Thames transfer by continuing to work with other water companies and the regulators.
The joint work will include:
Scope Lead organisation
(1) Understanding the magnitude of water losses that could occur during transfer
(2) The changes that would be required to the regulation of the River Severn to ensure water is available for transfer when required and that the Severn Estuary Special Area of Conservation is not detrimentally impacted by the increased upstream abstraction
(3) Further environmental investigations and survey requirements for the River Severn flow augmentation options (Vyrnwy reservoir and Minworth sewage treatment works)
(4) Understanding water quality issues associated with how River Severn algae behave when transferred into the River Thames.
Thames Water or another Water Resources in the South East group (WRSE) partner
(5) Environmental studies for a number of supporting options, including a screening phase and more detailed investigations at a smaller number of sites.
(6) More detailed engineering assessments of the scope and costs of the supporting options, supported by multi-discipline site based investigations.
(7) A study to assess the contribution that United Utilities transfer options will make to the well-being goals for Wales contained in the Well-being of Future Generations (Wales) Act 2015.
(8) A study to assess whether changes to the magnitude of timing of River Severn support would affect water levels at Vyrnwy reservoir and the environmental effects of any changes to water level.
United Utilities
(9) Senior management providing leadership and coordination of the work on the
transfer scheme across the various parties, ensuring effective governance
arrangements are in place, and engagement with multiple stakeholders.
TBC between
regulators and
water companies
(10) It is expected that there will input from, and engagement with, a range of
organisations including NRW, EA, Welsh Water and Bristol Water, all of who have
dependency on the River Severn in one form or another
Various
To achieve governance for the future work programme, a new coordination group will be established to be called “Water Resources West”.
United Utilities Final Water Resources Management Plan 2019
© United Utilities Water Limited 2019 Page 163 of 191
9 Testing our plans
9.1 Overview
There are significant uncertainties in water resources planning such as the impacts of climate change,
population growth and future customer demand for water. We have incorporated a wide range of these
uncertainties into our planning through the application of target headroom (Section 4.5) and use of
extended methods (Section 7.2). It would be inappropriate, however, to invest large sums of customers’
money to address all of the possible eventualities that we can foresee.
It is nevertheless prudent to ‘stress-test’ the preferred plan to ensure that in the unlikely event that
conditions outside of our planning envelope were to materialise, there are no significant risks to supply that
we cannot mitigate. Therefore, we have performed careful scenario testing of our preferred plan, including
those resource zones where we are not planning to invest in new options. This work is outlined fully in our
Final WRMP19 Technical Report - Options appraisal, which includes, for example, possible impacts on
abstraction due to continued compliance with the Water Framework Directive. A summary of the most
significant uncertainties (in terms of scale) for each resource zone is provided in the following sections. In
all cases we will monitor the future situation carefully, and reassess risks for the production of each five-
yearly Water Resources Management Plan, as well as our ongoing Water Resources Management Plan
annual review process.
We have also completed a number of scenarios around leakage convergence99. None of these leakage
scenarios particularly stress the system; they are reported in our Final WRMP19 Technical Report - Demand
for water.
99 Leakage convergence is a methodological adjustment and does not affect actual leakage levels. Further explanation of leakage
convergence is included in our Final WRMP19 Technical Report - Demand for water.
Key points
Our preferred plan is robust to a wide range of uncertainties.
It would be inappropriate to invest large sums of customers’ money to address all
possible eventualities.
We tested a range of scenarios beyond what we have planned for, and set out the
scale and cost of mitigation required.
In the event that any of these were to materialise they would be addressed as part of
the annual review process or a future Water Resources Management Plan.
We will protect the resilience and water quality of supplies to all customers.

United Utilities Final Water Resources Management Plan 2019
© United Utilities Water Limited 2019 Page 164 of 191
9.2 Strategic Resource Zone scenarios
Key scenarios for the Strategic Resource Zone are shown in Table 29 below.
Table 29 Scenarios used to test the Strategic Resource Zone
Scenario Change What would we need to do
to mitigate this?
How much would this cost
through to 2045? (NPV
£m)
Demand is much higher
than forecast
148 Ml/d increase in
demand, leading to
shorter term deficit, with
preferred plan in place
(non-trading pathway)
With our proposed leakage
reduction, no new options are
selected, but shorter term demand
increases may require an
acceleration of our enhanced
demand management
programme100.
0 (although, there may be
increased costs in the shorter
term to accelerate our enhanced
demand management
programme)
Climate change impacts are
worse than anticipated
Three sets of climate
change projections tested
through extended
methods.
Through protecting customers and
the environment against the
impacts of trading the preferred
plan is robust to a range of climate
change impacts (up to the 75th
percentile). Therefore no mitigation
actions are required.
0
Future changes to
Windermere abstraction
licence (now not proposed,
based on evidence from
licence review study – see
Section 9.2.1 for further
details)
Increase hands off flow
condition to 373 Ml/d all
year round.
Develop further groundwater
capacity
63.8
As Section 4.3.8 explains (and explored in detail within the Final WRMP19 Technical Report - Demand for
water), there is inherent uncertainty in demand forecasts over the long-term. At times, short-term trends
may be out of line with longer term plans or expectations. Since the 2015 Water Resources Management
Plan we have seen several years of demand increases out of line with expectations, which we continue to
monitor and explore as part of the Annual WRMP reporting process. In part, these increases have been
impacted by weather influences such as freeze-thaw or dry weather101. Our long-term forecasts for this
plan still show reductions in demand, taking account of the benefits of future demand management
activities, albeit at a lower rate than in the previous plan and with additional associated uncertainty in
target headroom. The demand scenario outlined in the table accounts for significantly higher demand than
expectations, based on the extremes of uncertainty in target headroom. The scenario may be viewed as a
100 From our Draft WRMP19, this scenario would have required the implementation of several options to mitigate. These options
included re-establishing an abandoned reservoir, developing further groundwater sources and increasing the capacity of an existing
water treatment works and the estimated cost (NPV) was £96.5m. However, our proposal to increase the level of leakage reduction
has meant that we should now be able to mitigate the impact via an acceleration of our demand management programme. 101 As described in Section 3.6, at the time of publishing this plan in summer 2018, a dry weather event is currently occurring in the
North West, and we will review this against the plan forecasts as part of the Annual WRMP review following the event when we
have a complete set of data.
United Utilities Final Water Resources Management Plan 2019
© United Utilities Water Limited 2019 Page 165 of 191
proxy for either significantly higher growth in the longer-term, but also shorter term increases that may be
experienced for a variety of reasons and considered in Annual WRMP reviews. As stated in Table 29, with
our proposed leakage reduction, no new options are required, but shorter term demand increases may
require an acceleration of our enhanced demand management programme.
9.2.1 Windermere licence study scenario
Windermere, the largest lake in England, is one of the key sources in the Strategic Resource Zone. In 2017,
as part of developing our Final Drought Plan 2018, Defra requested that we review the Windermere
abstraction licence, which authorises abstraction for public water supply from Calgarth. We appointed an
independent consultancy to undertake this work with the following objectives:
Review and update the 2007 abstraction licence environmental assessment;
Consider the current licence, recent operation and alternative abstraction licence scenarios;
Develop alternative licence scenarios through consultation with the Environment Agency and
stakeholders;
Assess the impacts and benefits of the current licence and the alternative scenarios e.g. on lake
level, public water supplies, river flows, recreational and commercial interests, ecology;
Compare the costs and benefits of the abstraction licence scenarios;
Identify and quantify associated risks e.g. flooding;
Inform the Environment Agency and stakeholders of the results of the review.
The Windermere licence constrains abstraction in a range of different ways:
Abstraction must not exceed 205 Ml/d;
Abstraction must not exceed 36,504 Ml/year;
Abstraction cannot take place if flow in the downstream River Leven is less than 273 Ml/d from 1st
May to 30th September, or 136 Ml/d from 1st October to 30th April.
Abstraction tends, however, to be mainly constrained by flow in the River Leven. This type of licence
constraint is known as a ‘hands off flow’ condition, and forms the basis of the alternative licence scenarios
considered in the review. There were eight scenarios in total: the current licence; no abstraction102; and six
variants of the hands off flow condition, each with different flow amounts and timing.
The hands off flow scenarios considered are all more restrictive than the current licence, hence they could
impact on availability of supply. As explained in Section 4.4, we test availability of supply in this resource
zone using a water resources model and a measure called deployable output. The impact on resource zone
deployable output of the six hands off flow scenarios when tested ranged from 0 Ml/d to 32 Ml/d.
For the Water Resources Management Plan we incorporated one of the scenarios from the review into our
testing of the preferred plan, reflecting the potential for a future licence change. Selection of which
scenario to include in the Water Resources Management Plan was discussed and decided with
stakeholders. It was selected simply to help represent the range of potential benefits and impact on supply;
it should not be assumed that this was the most likely outcome of the review. Specifically, the scenario
102 This scenario is not considered to be a potential outcome, but is used in the environmental assessment.
United Utilities Final Water Resources Management Plan 2019
© United Utilities Water Limited 2019 Page 166 of 191
involves increasing the hands off flow condition to 373 Ml/d all year, and the impact on resource zone
deployable output was 25 Ml/d.
As shown in Table 29 we used our EBSD model (Section 7.2) to select options to replace the lost 25 Ml/d of
supply. The most cost optimal solution was to develop further groundwater capacity at Franklaw. The
whole-life cost net present value (NPV), including environmental and social costs, is £63.8m (£62.8m,
excluding environmental and social costs).
However, the review has now been completed and the outcome was shared with the Environment Agency
and other stakeholders at an event in Kendal in June 2019, and summarised by letter to Defra in July 2019.
The review has concluded that the current abstraction regime has no significant impact on Windermere or
the River Leven, and that the predicted benefits of the alternative scenarios are relatively minor compared
to the significant potential impacts on deployable output and risk of severe drought actions. Therefore we
will not be seeking any changes to the abstraction licence, and none of the alternative scenarios will be
taken forward into our final plan. .
9.3 Carlisle Resource Zone scenarios
The supply-demand balance in this resource zone is robust. Our current assessment shows that even with
the worst climate change impacts we still have a surplus, though this is relatively small at 0.5 Ml/d. All other
scenarios tested resulted in a larger surplus, as outlined in our Final WRMP19 Technical Report - Options
appraisal.
9.4 Barepot and North Eden Resource Zone scenarios
The supply-demand balance in these resource zones is very robust and none of the scenarios we tested led
to a requirement for further investment in new options. In both resource zones supply is constrained by
physical assets and abstraction licences rather than hydrological conditions, therefore even the more
severe demand or climate change projections do not lead to the need for investment.

United Utilities Final Water Resources Management Plan 2019
© United Utilities Water Limited 2019 Page 167 of 191
10 Assurance and board engagement
10.1 New requirements for Board assurance
We take the development and assurance of our Water Resources Management Plan submission very
seriously. Recognising the increasing importance of the Water Resources Management Plan and its links
with wider business planning processes, the Defra guiding principles and Water Resources Planning
Guideline also advocate some new specific requirements for Board assurance.
There are two key statements:
1. The Defra guiding principles for the Water Resources Management Plan state an expectation that
“with assurance from your company’s Board we want to see you collaborate with customers,
partners and regulators to develop a strong understanding of future needs, explore every option,
and build consensus on delivery plans”; and
2. The Water Resources Planning Guideline states the need to gain “assurance from your Board that
they are satisfied the plan represents the most cost effective and sustainable long term solution”.
For the draft plan we assured the plan against Statement 2 above. Given the specific requirement defined
in the Defra guiding principles under Statement 1 around collaboration and consensus, we decided that it
was more appropriate to assure this aspect at the revised draft stage following public consultation
(although we ensured that we were ‘on track’ to meet this statement at the draft plan stage). Therefore,
for this final Water Resources Management Plan our plans have now been assured to both of the
statements above and endorsed by the Company Board prior to submission accordingly.
10.2 Assurance undertaken on the plan
To enable Board assurance, and to ensure submission of a robust plan in line with the regulatory guidelines
and Defra guiding principles, we have undertaken an extensive assurance process. This was completed by
CH2M.
Key points
We have completed extensive assurance activities as part of developing this plan,
and have engaged our Company Board throughout the process.
Our Corporate Audit Team have overseen our assurance activities, supported by an
independent third party audit process by CH2M.
This ensures that our plan meets the Defra guiding principles and regulatory
guidelines, in particular that the plan represents the most cost effective and
sustainable long-term solution.
Our assurance has also included compliance to the drinking water quality guidance.
The Company Board have assured this final Water Resources Management Plan
submission following the outcome of our audit and assurance processes

United Utilities Final Water Resources Management Plan 2019
© United Utilities Water Limited 2019 Page 168 of 191
Development of the draft plan for consultation included three phases, as follows:
Stage 1 – Preparedness Audit – June 2016:
Confirmed that the Water Resources Management Plan is defined, maintained and tested in
line with the relevant water resources planning guidelines. This included a review of the
robustness of the water resources management planning methodology and controls over:
o key inputs;
o models and outputs; and
o internal and external approval procedures.
Reviewed our readiness to adopt the changes to water resources management planning
guidelines, supporting UKWIR methodologies and readiness to assess the key strategic
questions impacting the next Water Resources Management Plan.
Stage 2 – Water Resources Management Plan Processes and Resilience – June 2017:
Confirmed the definition and maintenance of the Water Resources Management Plan is in line
with the latest relevant technical guidelines (e.g. Environment Agency/Natural Resources
Wales Guidelines; Defra guiding principles; and supporting UKWIR methodologies).
Confirmed the Water Resources Management Plan has been tested against different scenarios.
Confirmed governance meetings and communication with key internal and external
stakeholders throughout the planning processes is in place.
Confirmed implementation of the Water Resources Management Plan options identification
process (including incorporation of 3rd party options) and readiness for options appraisal.
Stage 3 – Water Resources Management Plan Processes – October 2017:
Confirmed the rationale for Options Appraisal.
Evaluation of the options appraisal process; considering the associated costs and benefits;
overall need for investment and economic, social and environmental justification for a
preferred strategy.
The final stage of the process was also expanded to ensure that compliance to new Drinking Water
Inspectorate long-term planning guidance could be evidenced. This ensures that drinking water quality and
quantity are given parity during the development of the plan. We have considered the requirements of this
guidance and have sought counsel from the Water Quality and Public Health teams within the Company to
ensure that our plan is appropriate.
For the revised draft plan, a further subsequent phase was completed, building on that completed for the
draft plan:
Stage 4 – Review of Water Resources Management Plan (Revised Draft) – July 2018:
The objective of this audit was to review the adequacy of the revised draft WRMP following
consultation and reaffirm that the revised plan is compliant with the requirements of the Water
Resources Planning Guidelines (WRPG) (including the DWI compliance long term planning
compliance statement):
UU has collaborated with customers, partners and regulators to develop a strong
understanding of future needs, explore every option, and build consensus on delivery plans;
and
United Utilities Final Water Resources Management Plan 2019
© United Utilities Water Limited 2019 Page 169 of 191
The revised plan represents the most cost effective and sustainable long-term solution.
Further information on our governance and assurance activities, and evidence of meeting the relevant
regulatory requirements may be found in our Final WRMP19 Technical Report - Assurance and governance.
10.3 Engagement with our Company Board
We originally engaged with our Board early in the process prior to pre-consultation in September 2016. We
have subsequently provided regular updates on plan development. From the latter phase of draft plan
development until revised draft submission this engagement took place on an approximately monthly
basis. As well as presenting our proposed plans to the Board, to allow the Board to endorse the plan we
have:
Underpinned Board engagement with extensive governance processes for reviewing and approving
the plan, which also integrates into our wider business planning. In particular, our main approvals
group for the Water Resources Management Plan comprised Director level representatives, and
subsequently fed into Executive level endorsement; and
Completed an extensive assurance audit process of the Water Resources Management Plan
development process, led by our Corporate Audit Team using an independent third party, CH2M
(as outlined in Section 10.2 above).
In July 2018 the Board endorsed and subsequently assured that the revised draft Water Resources
Management Plan represents the most cost effective and sustainable long term solution. However, in our
initial assessment of the PR19 business plan (IAP), Ofwat requested that the delivery of leakage reduction
options should be accelerated in order to achieve a more challenging target of 20% reduction by 2025. The
UU board has now accepted this target.

United Utilities Final Water Resources Management Plan 2019
© United Utilities Water Limited 2019 Page 170 of 191
11 Conclusions
11.1 Summary of our plans
We have carried out detailed analysis to determine the future dry year supply-demand balance and water
supply resilience. These include delivery of sustainability improvements as part of the Water Industry
National Environment Programme (WINEP), and take account of future climate change and population
growth. Our assessments have taken account of the latest regulatory guidelines and incorporate current
best practice, applying new and innovative planning methods. We have engaged the market to identify
potential solutions from third parties to address any needs in our plan, in addition to options identified by
ourselves.
Our baseline plan continues to promote water efficiency, and retains the benefit of leakage reductions
observed in recent years. As part of our plan we will continue to encourage customers to take up free
water meters, using our ongoing customer engagement and research insights to allow effective
communication and remove disincentives to meter uptake. Our forecasts show meter penetration reaching
around 75% by the end of the planning horizon. We will continue to target annual savings of 1 litre per
property per day through the planning horizon as part of our water efficiency programme.
Key points
Our plan accounts for the delivery of the Thirlmere transfer project as defined in the
previous Water Resources Management Plan 2015.
We are committed to sustainably providing high quality, safe, clean and reliable
drinking water to customers and ensure our proposed plan helps to deliver this.
This final Water Resources Management Plan has taken on board customer,
stakeholder, and regulator feedback both during in its development and following
public consultation on the draft plan.
We have proposed a plan that represents the most cost effective and sustainable
long-term solution. Our plan has been subject to extensive independent assurance
and Board endorsement.
We have explored several key strategic choices to propose further leakage
reductions, improved levels of service and resilience as part of our preferred plan.
Our final planning supply-demand position results in a healthy surplus following
delivery of our preferred plan.
We propose to continue to work towards water trading, as part of an adaptive future
pathway for water resources in the North West.
Although potential importing companies have not selected imports from the North
West in their preferred plans, we remain committed to working with potential future
trading partners so that an export can be made available when it is needed.

United Utilities Final Water Resources Management Plan 2019
© United Utilities Water Limited 2019 Page 171 of 191
Accounting for these measures, our baseline broadly maintains a supply-demand balance in the final plan,
apart from a small deficit right at the end of the planning horizon in the Strategic Resource Zone103.
However, we have explored wider strategic choices driven by wider water resources considerations, such as
levels of service and the environment. We have also identified resilience needs to reduce risks to water
supply posed by hazards other than drought.
We consulted upon the following proposals and summarise conclusions of this, forming our preferred plan:
Further leakage reductions of 190 Ml/d over the planning horizon, a reduction of 40% below the
baseline position of 448 Ml/d, with 91 Ml/d of the reduction (20%104) taking place between 2020-
2025;
Improvement of our minimum stated level of service for drought permits/orders to augment
supplies, from no more than once every 20 years (5% annual average risk) to once every 40 years
(2.5% annual average risk) by 2025, enabled by the leakage reductions above; and
Increasing resilience to other hazards, specifically for our regional aqueduct system associated with
Manchester and Pennine resilience. This involves completing Solution D, which involves rebuilding
all single line sections of the relevant aqueduct.
Although potential importing companies have not selected imports from the North West in their preferred
plans, and therefore the export does not form part of our formal preferred plan, our strategy to facilitate a
future trade has been retained within an adaptive pathway. This part of the plan shows how, if considered
as part of the preferred plan in future planning cycles, we would ensure that water quality, resilience and
the environment in the North West are protected whilst delivering financial benefit to customers and
performance improvements. We remain committed to working with potential future trading partners so
that an export can be made available when it is needed.
Our plans have been extensively stress-tested (including beyond the 25-year planning horizon to the 2080s,
where appropriate), and has shown it to be resilient to future change. We are committed to sustainably
providing high quality, safe, clean and reliable drinking water to customers and ensure that our proposed
plan helps to deliver this.
11.2 Next steps
The draft version of this plan was submitted to Defra on the 1st December 2017 prior to publication on 2nd
March 2018 for consultation. Water resources planning is a dynamic process, and we thank our customers
and stakeholders for their active engagement and feedback during the consultation period, which has been
taken account of in developing this final plan.
Our revised draft plan was submitted to Defra at the end of August 2018 along with a Statement of
Response and revised supporting Technical Reports. The revised draft plan was subsequently approved by
103 Whilst this is the case, even retaining the further leakage reductions from the draft plan in the final planning supply-demand
balance would result in a healthy long-term surplus position.
104 Compared to 7%, or 30 Ml/d in the draft plan
United Utilities Final Water Resources Management Plan 2019
© United Utilities Water Limited 2019 Page 172 of 191
the Secretary of State and therefore we are now publishing it as our final plan, with some minor updates
including enhanced leakage savings by 2025.
Following publication of this final plan, it will be reviewed annually, with the annual Water Resources
Management Plan review published at:
https://www.unitedutilities.com/corporate/about-us/our-future-plans/water-resources/
As described in our Statement of Response and throughout this submission, we commit to continue active
engagement with stakeholders and regulators towards the next planning round on a range of aspects. Our
next statutory Water Resources Management Plan is expected to be published in 2024.
United Utilities Final Water Resources Management Plan 2019
© United Utilities Water Limited 2019 Page 173 of 191
Appendix A – List of technical reports The following technical reports have been written to provide additional detail on the work underpinning
this Water Resources Management Plan;
Final WRMP19 Technical Report – Assurance and governance
Final WRMP19 Technical Report – Customer and stakeholder engagement
Final WRMP19 Technical Report – Demand for water
Final WRMP19 Technical Report – Options appraisal
Final WRMP19 Technical Report – Options identification
Final WRMP19 Technical Report – Supply forecasting
Final WRMP19 Technical Report – Target headroom
Final WRMP19 Technical Report – Water supply resilience
Final WRMP19 Technical Report – West Cumbria legacy
Water Trading Report (2018).
Amec Foster Wheeler (now Wood). (2018). Environmental and Social Costs of Water Resources
Management Plan 2019 Manchester and Pennine Resilience Options.
Wood Environment & Infrastructure Solutions UK Limited. (2019). Environmental and Social Costs of
Water Resources Management Plan 2019 Supply-Demand Options.
Amec Foster Wheeler (now Wood). (2019). Final Water Resources Management Plan 2019: Habitats
Regulations Assessment.
Amec Foster Wheeler (now Wood). (2019). Final Water Resources Management Plan 2019: Water
Framework Directive Assessment.
Amec Foster Wheeler (now Wood). (2018). Strategic Environmental Assessment of the Revised Draft
Water Resources Management Plan 2019.
Wood Environment & Infrastructure Solutions UK Limited. (2019). Strategic Environmental
Assessment of the Final Water Resources Management Plan 2019 Post Adoption Statement.
United Utilities Final Water Resources Management Plan 2019
© United Utilities Water Limited 2019 Page 174 of 191
Appendix B – References
Consumer Council for Water. (2006). Public perceptions on water use.
Defra. (2009). UK Climate Projections (UKCP09) (sponsored by Defra).
Defra. (2017). Market Transformation Programme. Retrieved from http://efficient-products.ghkint.eu/
Defra. (2017). The Water Resources Management Plan (England) Direction.
Defra. (2017). The water white paper, water for life.
Drinking Water Inspectorate. (September 2017). Guidance Note: Long term planning for the quality of
Drinking Water Supplies.
Environment Agency. (2012). Benefits Assessment Guidance.
Environment Agency. (2016). Drought plan and WRMP links.
Environment Agency. (2016). Environmental valuation in water resources planning - additional information.
Environment Agency. (2016). Water resource zone integrity.
Environment Agency. (2016). Water Resources Planning Tables - Instructions.
Environment Agency. (2016). WRMP19 methods: Outage allowance.
Environment Agency, Ofwat, & Natural Resources Wales. (2013). Water Resources Planning Guideline.
National Farmers Union. (2011). Water Survey.
Ofwat. (2008). Water efficiency targets 2010/11 to 2014/15.
Ofwat. (2015). Water 2020: Regulatory framework for wholesale market and the 2019 price review.
Ofwat. (2017). Delivering Water 2020: Consulting on our methodology for the 2019 price review.
Plain English Campaign. (2017, November). Crystal Mark Accredited. Retrieved from
http://www.plainenglish.co.uk/services/crystal-mark.html
UK Government. (1991). Water Resources Act.
UK Government. (1999). The Water Industry Act.
UK Government. (2004). The Environmental Assessment of Plans and Programmes Regulations.
UK Government. (2014). Water Act.
UK Government. (2016). National Flood Resilience Review.
UK Government. (2016). The Water Supply (Water Quality) (Amended) Regulations.
UK Government. (2017). Conservation of Habitats & Species Regulations.
UKWIR. (1995). Outage Allowance for Water Resource Planning [WRP-001/B].
UKWIR. (2013). Impact of Climate Change on Water Demand [13/CL/04/12].
United Utilities Final Water Resources Management Plan 2019
© United Utilities Water Limited 2019 Page 175 of 191
UKWIR. (2015). WRMP19 - Methods - Population, Household Property and Occupancy Forecasting
[15/WR/02/8].
UKWIR. (2015). WRMP19 Methods - Household Consumption Forecasting [15/WR/02/9].
UKWIR. (2016). Integration of behavioural change into demand forecasting and water efficiency practices
[16/WR/01/15].
UKWIR. (2016). Resilience: Making a Business Case for PR14 [13/RG/06/3].
UKWIR. (2016). WRMP19 - Methods - Decision Making Process: Guidance [16/WR/02/10].
UKWIR. (2016). WRMP19 - Methods - Risk Based Planning [16/WR/02/11].
United Utilities. (2015). Water Resources Management Plan.
United Utilities. (2017). Statutory Drought Plan.
United Utilities. (2017, September). YourVoice. Retrieved from United Utilities - helping life flow smoothly:
https://www.unitedutilities.com/corporate/about-us/our-future-plans/Yourvoice/
Waterwise. (2008). Evidence base for large-scale water efficiency.
Welsh Government. (2015). Well-being of future generations act.
WRc. (2007). Alternative approaches to leakage target setting (Report by WRc for Ofwat, Quinquepartite
Report).

United Utilities Final Water Resources Management Plan 2019
© United Utilities Water Limited 2019 Page 176 of 191
Appendix C – Glossary Abstraction The removal of water from any source, either permanently or temporarily.
Abstraction Licence The authorisation granted by the Environment Agency to allow the removal of water from
a source.
AMP Asset Management Plan: AMP5 covers the period April 2010 to March 2015, AMP6 covers
the period April 2015 to March 2020, etc.
AMR Automated Meter Reading.
AquatorTM The name of a water resources computer modelling system used by United Utilities.
Aqueduct An artificial channel for conveying raw or partially treated water.
Average Incremental Social Cost (AISC)
The ratio of present Social Costs over Present Net Value of additional water delivered or reduced demand.
Barepot A small resource zone in the West Cumbria area serving non-potable water to commercial
customers only.
Base Year
The first year of the planning period/horizon, forming the basis for the water demand and supply forecasting of subsequent years.
Baseline Demand Forecast
A demand forecast which reflects a company’s current demand management policy, but which assumes the achievement of the current agreed target for leakage during the
forecast duration, as well as the implementation of the current company water efficiency plans, irrespective of any surplus.
Bristol Water The licensed water only company for Bristol.
Canal and River Trust A charitable organisation playing a protective role for waterways in England and Wales.
Catchment The area from which precipitation (rainfall) and groundwater would naturally collect and
contribute to the flow of a river.
Carlisle Resource Zone The resource zone covering the Carlisle area (see resource zone).
Co-imagine Where water companies work with customers and/or stakeholders to imagine the future
for water.
Co-create Where water companies work alongside customers and/or stakeholders to create
solutions.
Co-deliver Where water companies work alongside customers and/or stakeholders to deliver these
solutions.
Consumer Council for Water The Consumer Council for Water (Northern), which represents the interests of water
customers.
Countryside Council Wales Countryside Council for Wales. To be replaced by Natural Resources Wales 1 April 2013.
Compensation flow / release Stored water released from a reservoir to ensure a continuous flow in the downstream
watercourse.
Competition / Competitive Markets
A concept introducing customer choice of supplier into a formerly regionally monopolised industry.
Critical Period The length of time between a reservoir being full and the reservoir reaching minimum
storage during the worst drought on record.
DCLG Department for Communities and Local Government

United Utilities Final Water Resources Management Plan 2019
© United Utilities Water Limited 2019 Page 177 of 191
Dee Valley Water The licenced water only company serving Chester and Wrexham areas, now part of
Severn Trent PLC.
Defra Department for Environment, Food and Rural Affairs.
Demand Management The implementation of policies or measures which serve to control or influence the
consumption or waste of water. (This definition can be applied at any point along the chain of supply).
Deployable Output The output of a commissioned source or group of sources or of a bulk supply as
constrained by: the environment; abstraction licences; water quality; existing water treatment and supply system capacities.
DETR Department of the Environment, Transport and the Regions (which no longer exists and
many of its functions are now completed by the new department Defra).
Distribution Input The amount of water entering the distribution system at the point of treated water
production.
Distribution Losses Comprises water lost from trunk mains, service reservoirs, distribution mains and
communication pipes. Distribution losses = distribution input less water taken.
DMA
District Meter Area – an area (of up to 3000 properties) where the supply to it is continuously monitored, and there is a defined and permanent boundary. DMAs were
set-up for leak detection prioritisation. Guidance states that DMA’s should typically have, under normal operation, a single supply inlet.
DMZ
Demand Monitoring Zone. There are currently 33 DMZs in our region, which are areas used to monitor demand and losses. All supply inputs and outputs are metered around the boundary of a DMZ. A DMZ
is built up of a number of smaller units; however, these are predominantly for water quality and leakage detection purposes.
Dead Water
The part of a reservoir’s total storage volume that is not usable for water supply purposes. Often the dead storage of a reservoir is required to store sediment
accumulation during the life of the reservoir. In some cases, a portion of the dead storage may be recoverable through engineering works.
Dry Year In water resources modelling, a period of low rainfall from which future demand is
forecast. For this plan we have used 2016.
Dry Year Annual Average Daily Demand
The level of demand, which is just equal to the maximum annual average, which can be met without the introduction of demand restrictions at any time during the year. This
should be based on a continuation of current policies regarding demand management. The dry year demand should be expressed as the total demand in the year divided by the
number of days in the year.
Droughts (severe, extreme) A prolonged dry period potentially leading to scarcity of water. Severe and extreme
droughts are defined by Defra return periods of 1:200 years and 1:500/1000 respectively.
Drought Order
The Water Resources Act 1991 gives the Secretary of State or the National Assembly for Wales the power to grant ordinary and emergency drought orders to water undertakers
or the EA.
Ordinary drought orders can include the same powers to abstract water as drought permits, but they can also authorise water undertakers to take other actions. In this plan
the term ‘drought permit/order’ is used to differentiate these from drought orders for non-essential use.
An emergency drought order gives water companies complete discretion on the uses of water that may be prohibited or limited, and they can authorise supply of water by
standpipes or water tanks, or impose rota cuts.
Drought Permit Schedule 22 of the Environment Act 1995 amended the Water Resources Act 1991 to give the Environment Agency the power to grant drought permits. Drought permits can only

United Utilities Final Water Resources Management Plan 2019
© United Utilities Water Limited 2019 Page 178 of 191
authorise a water undertaker to ‘take water’ from specified sources or modify or suspend restrictions or obligations relating to a water undertaker’s existing powers to ‘take water’ from a source. In this plan the term ‘drought permit/order’ is used to differentiate these
from drought orders for non-essential use.
Drought Plan
A statutory document written every 5 years, detailing company strategy to maintaining water supplies during periods of drought.
Dŵr Cymru Welsh Water The licensed water and sewerage company for wales.
Emergency Storage
A reserve water storage capacity aimed at accommodating the operational uncertainty for the duration of a particular drought. The value of the reserve store should be agreed with the regulators and should be reflected in the level of risk a water company is taking
across the planning period.
Environment Agency (EA)
One of our regulators. The Environment Agency (EA) is a non-departmental public body, established in 1995 and sponsored by the United Kingdom Government's Department for
Environment, Food and Rural Affairs (Defra), with responsibilities relating to the protection and enhancement of the environment in England (and until 2013 also Wales).
EBSD Economics of Balancing Supply and Demand – a key methodology document published by
UKWIR in 2002.
ELL Economic level of leakage, which is being superseded by the concept of ‘sustainable
economic level of leakage’ (SELL).
Final Planning Demand Forecast A demand forecast that reflects a company’s preferred policy for managing demand and
resources through the planning period, after taking account of all options through economic analysis.
Freeze-thaw
Freeze-thaw events relate to peak demands caused by rapidly increasing leakage levels. These normally occur during the winter months, when changes in temperature can cause
the ground to freeze and then thaw relatively quickly. This can result in pipes or mains cracking or bursting.
Habitats Directive
The European Union Habitats Directive (92/43/EC) is the instrument through which Member States must identify and protect as ‘Special Areas of Conservation’ (SAC) certain
sites that are representative of specified habitats for specific species which are of European importance. It also covers ‘Special Protection Areas’ (SPA) but none are
identified as being affected by United Utilities abstractions
Habitats Regulation Assessment (HRA)
Habitats Regulations Assessment is a process for identifying the implications of the drought plan options for European designated sites (SAC, SPA, and Ramsar). If likely
significant adverse impacts are predicted, then a detailed Appropriate Assessment of the option is required
Hands off flow A hands off flow (also known as a prescribed flow) is normally associated with a river
abstraction and is the flow above which abstraction can occur. The purpose of a hands off flow is to ensure a given flow of water continues in the river prior to abstraction.
Headroom Available headroom is the difference (in Ml/d or %) between WAFU (including imported
water) and demand at any given point in time. See also Target Headroom.
Hosepipe Ban / Temporary Use Bans
Section 36 of The Flood and Water Management Act 2010 replaced the original Section 76 of the Water Industry Act 1991. The original legislation only allowed water undertakers to prohibit or restrict the use of hosepipes (or similar apparatus) for the
purposes of watering private gardens and the washing of private motor cars, commonly known as a hosepipe ban. The new legislation gives water companies further powers to
restrict water use by customers. Therefore this plan refers to ‘water use restrictions’ rather than hosepipe bans.
Household A property used as a single domestic dwelling as defined by Ofwat.
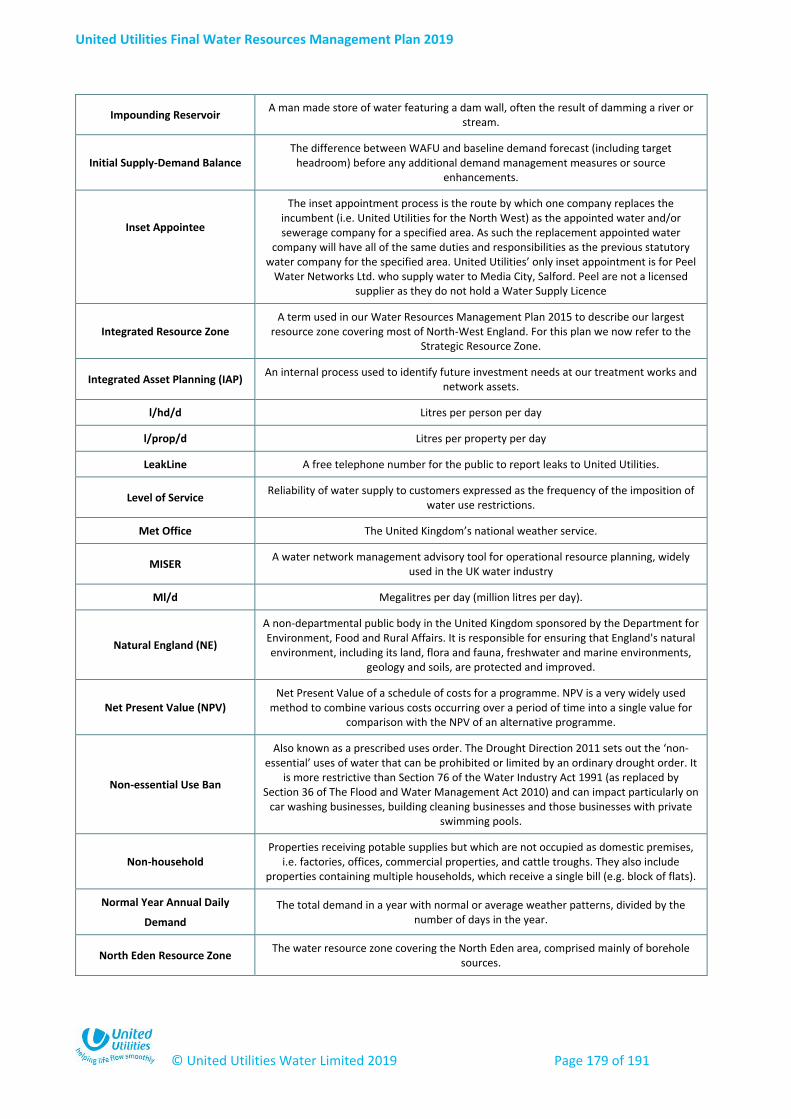
United Utilities Final Water Resources Management Plan 2019
© United Utilities Water Limited 2019 Page 179 of 191
Impounding Reservoir A man made store of water featuring a dam wall, often the result of damming a river or
stream.
Initial Supply-Demand Balance The difference between WAFU and baseline demand forecast (including target
headroom) before any additional demand management measures or source enhancements.
Inset Appointee
The inset appointment process is the route by which one company replaces the incumbent (i.e. United Utilities for the North West) as the appointed water and/or sewerage company for a specified area. As such the replacement appointed water
company will have all of the same duties and responsibilities as the previous statutory water company for the specified area. United Utilities’ only inset appointment is for Peel
Water Networks Ltd. who supply water to Media City, Salford. Peel are not a licensed supplier as they do not hold a Water Supply Licence
Integrated Resource Zone A term used in our Water Resources Management Plan 2015 to describe our largest
resource zone covering most of North-West England. For this plan we now refer to the Strategic Resource Zone.
Integrated Asset Planning (IAP) An internal process used to identify future investment needs at our treatment works and
network assets.
l/hd/d Litres per person per day
l/prop/d Litres per property per day
LeakLine A free telephone number for the public to report leaks to United Utilities.
Level of Service Reliability of water supply to customers expressed as the frequency of the imposition of
water use restrictions.
Met Office The United Kingdom’s national weather service.
MISER A water network management advisory tool for operational resource planning, widely
used in the UK water industry
Ml/d Megalitres per day (million litres per day).
Natural England (NE)
A non-departmental public body in the United Kingdom sponsored by the Department for Environment, Food and Rural Affairs. It is responsible for ensuring that England's natural environment, including its land, flora and fauna, freshwater and marine environments,
geology and soils, are protected and improved.
Net Present Value (NPV) Net Present Value of a schedule of costs for a programme. NPV is a very widely used
method to combine various costs occurring over a period of time into a single value for comparison with the NPV of an alternative programme.
Non-essential Use Ban
Also known as a prescribed uses order. The Drought Direction 2011 sets out the ‘non-essential’ uses of water that can be prohibited or limited by an ordinary drought order. It
is more restrictive than Section 76 of the Water Industry Act 1991 (as replaced by Section 36 of The Flood and Water Management Act 2010) and can impact particularly on
car washing businesses, building cleaning businesses and those businesses with private swimming pools.
Non-household Properties receiving potable supplies but which are not occupied as domestic premises,
i.e. factories, offices, commercial properties, and cattle troughs. They also include properties containing multiple households, which receive a single bill (e.g. block of flats).
Normal Year Annual Daily
Demand
The total demand in a year with normal or average weather patterns, divided by the number of days in the year.
North Eden Resource Zone The water resource zone covering the North Eden area, comprised mainly of borehole
sources.
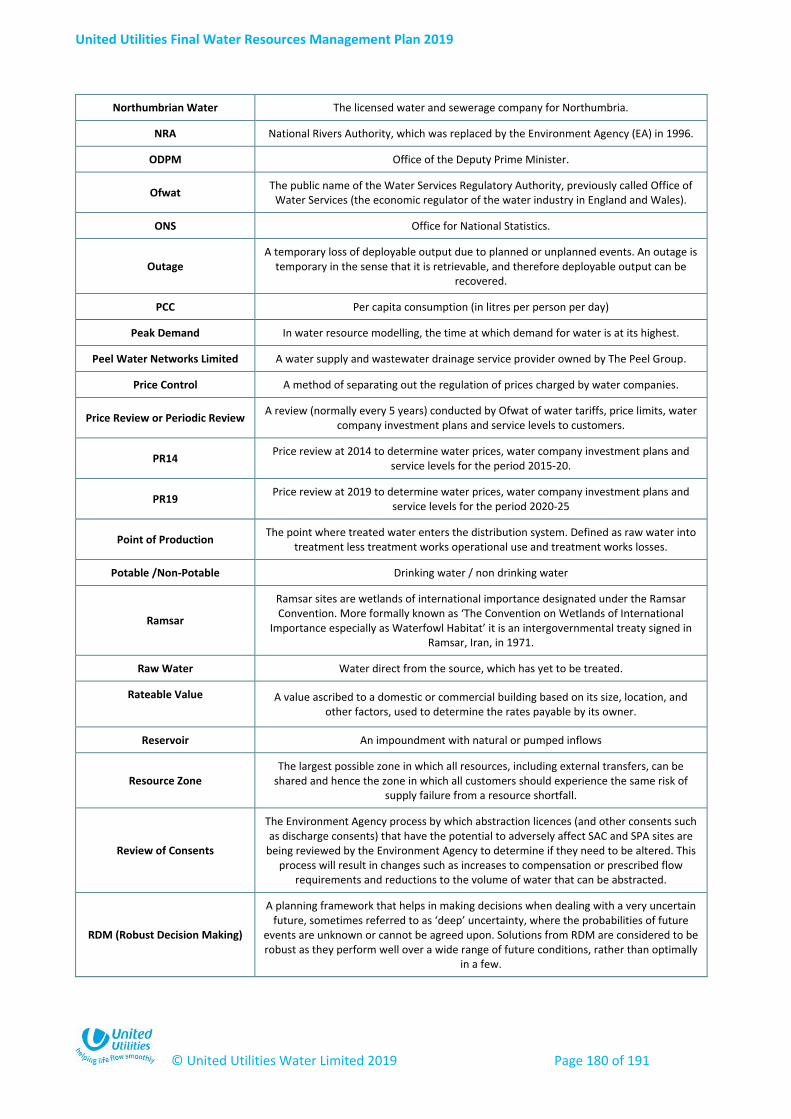
United Utilities Final Water Resources Management Plan 2019
© United Utilities Water Limited 2019 Page 180 of 191
Northumbrian Water The licensed water and sewerage company for Northumbria.
NRA National Rivers Authority, which was replaced by the Environment Agency (EA) in 1996.
ODPM Office of the Deputy Prime Minister.
Ofwat The public name of the Water Services Regulatory Authority, previously called Office of
Water Services (the economic regulator of the water industry in England and Wales).
ONS Office for National Statistics.
Outage A temporary loss of deployable output due to planned or unplanned events. An outage is
temporary in the sense that it is retrievable, and therefore deployable output can be recovered.
PCC Per capita consumption (in litres per person per day)
Peak Demand In water resource modelling, the time at which demand for water is at its highest.
Peel Water Networks Limited A water supply and wastewater drainage service provider owned by The Peel Group.
Price Control A method of separating out the regulation of prices charged by water companies.
Price Review or Periodic Review A review (normally every 5 years) conducted by Ofwat of water tariffs, price limits, water
company investment plans and service levels to customers.
PR14 Price review at 2014 to determine water prices, water company investment plans and
service levels for the period 2015-20.
PR19 Price review at 2019 to determine water prices, water company investment plans and
service levels for the period 2020-25
Point of Production The point where treated water enters the distribution system. Defined as raw water into
treatment less treatment works operational use and treatment works losses.
Potable /Non-Potable Drinking water / non drinking water
Ramsar
Ramsar sites are wetlands of international importance designated under the Ramsar Convention. More formally known as ‘The Convention on Wetlands of International
Importance especially as Waterfowl Habitat’ it is an intergovernmental treaty signed in Ramsar, Iran, in 1971.
Raw Water Water direct from the source, which has yet to be treated.
Rateable Value
A value ascribed to a domestic or commercial building based on its size, location, and other factors, used to determine the rates payable by its owner.
Reservoir An impoundment with natural or pumped inflows
Resource Zone The largest possible zone in which all resources, including external transfers, can be
shared and hence the zone in which all customers should experience the same risk of supply failure from a resource shortfall.
Review of Consents
The Environment Agency process by which abstraction licences (and other consents such as discharge consents) that have the potential to adversely affect SAC and SPA sites are
being reviewed by the Environment Agency to determine if they need to be altered. This process will result in changes such as increases to compensation or prescribed flow
requirements and reductions to the volume of water that can be abstracted.
RDM (Robust Decision Making)
A planning framework that helps in making decisions when dealing with a very uncertain future, sometimes referred to as ‘deep’ uncertainty, where the probabilities of future
events are unknown or cannot be agreed upon. Solutions from RDM are considered to be robust as they perform well over a wide range of future conditions, rather than optimally
in a few.

United Utilities Final Water Resources Management Plan 2019
© United Utilities Water Limited 2019 Page 181 of 191
SAC Special Area of Conservation designated under the EU Habitats Directive
SEA Strategic environmental assessment – see Section 8.5.
SELL Sustainable economic level of leakage, a concept introduced by Ofwat in 2007.
SELWE Sustainable economic level of water efficiency, a concept introduced by Ofwat in 2010.
Secretary of State The Secretary of State for Defra (Department for Environment, Food and Rural Affairs).
Service Reservoir A holding tank for treated water prior to distribution into the network.
Severn Trent Water The licenced water and sewerage company serving the majority of the midlands
(England).
South Staffordshire Water The licensed water only company serving parts of Staffordshire and the west-midlands.
Sustainability Reductions Reductions in deployable output required by the Environment Agency to meet statutory
and/or environmental requirements
SPA Special Protection Area, as designated under the EU Directive on the conservation of wild birds (also known as the Birds Directive). Together with SAC’s these form the Natura 2000
network of protected sites
SSSI Site of Special Scientific Interest
Statutory Water Use Restrictions
Statutory Water Use Restrictions would be implemented approximately 28 days following the introduction of Voluntary Water Use Restrictions. The Statutory Water Use
Restrictions are as set out in Section 76 of the Water Industry Act 1991 (as replaced by Section 36 of The Flood and Water Management Act 2010)
Stochastic A process incorporating an element of randomness, the evolution of which can only be
predicted within a range of values of the uncertain variables
Strategic Resource Zone The largest water resource zone, covering the majority of the North-West of England.
Formerly the Integrated Resource Zone, but including West Cumbria also.
Supply-demand balance The difference between total water available for use (as supply) and forecast distribution
input (as water demand) at any given point in time over the Water Resources Management Plan’s planning period/horizon.
Supply Pipe Losses Losses that occur from pipes which are the responsibility of the customer.
Sustainability Reduction Reduction in deployable output of a water source, or group of water sources, due to
change in abstraction licence conditions imposed by the Environment Agency to ensure more environmentally sustainable water abstraction.
Target Headroom Target headroom is the threshold of minimum acceptable headroom, which would trigger
the need for total water management options to increase WAFU or decrease demand.
Telemetry Telemetry is an automated communications process by which measurements and other
data are collected at remote or inaccessible points and transmitted to receiving equipment for monitoring.
Thirlmere transfer scheme
A large scale capital project to enable transfers of water from Thirlmere reservoir into the demand area fed by the former West Cumbria Resource Zone. This was defined in our
previous Water Resources Management Plan. It is expected to be implemented by March 2022 at the latest.
Total Leakage The sum of distribution losses and customer supply pipe losses.
Total Water Management All water management activities from source to end use (i.e. resource management,
production management, distribution management and customer-side management)
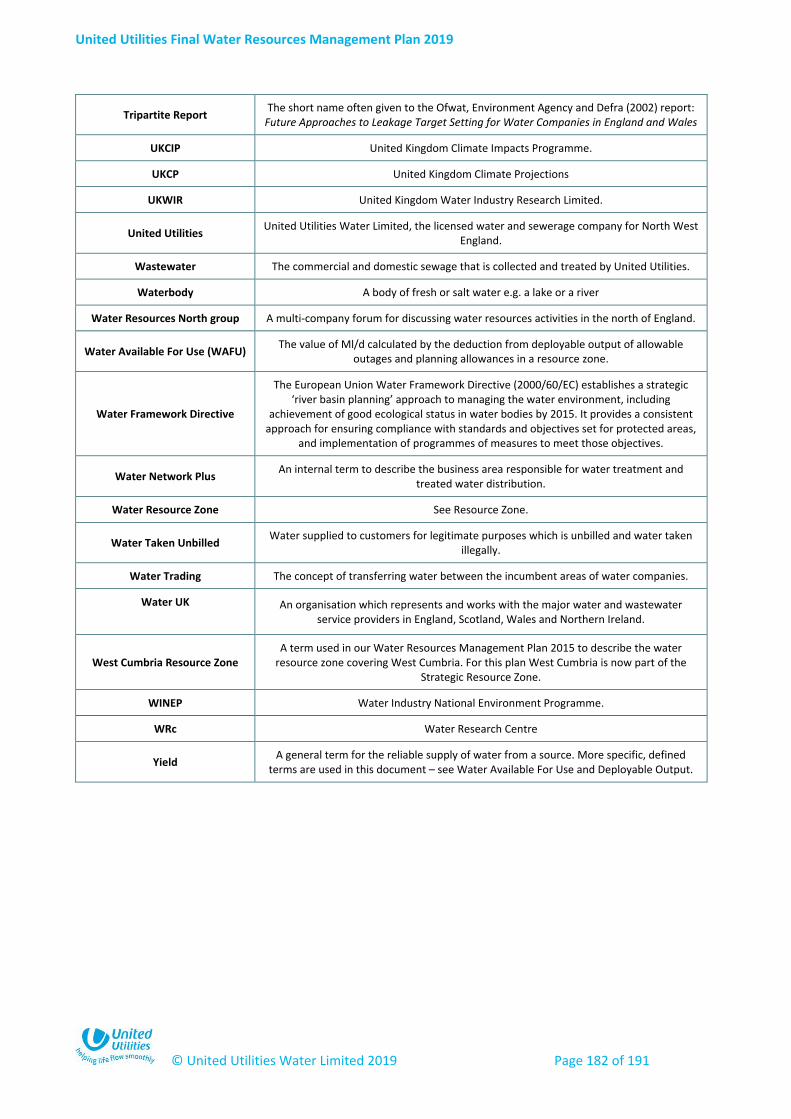
United Utilities Final Water Resources Management Plan 2019
© United Utilities Water Limited 2019 Page 182 of 191
Tripartite Report The short name often given to the Ofwat, Environment Agency and Defra (2002) report:
Future Approaches to Leakage Target Setting for Water Companies in England and Wales
UKCIP United Kingdom Climate Impacts Programme.
UKCP United Kingdom Climate Projections
UKWIR United Kingdom Water Industry Research Limited.
United Utilities United Utilities Water Limited, the licensed water and sewerage company for North West
England.
Wastewater The commercial and domestic sewage that is collected and treated by United Utilities.
Waterbody A body of fresh or salt water e.g. a lake or a river
Water Resources North group A multi-company forum for discussing water resources activities in the north of England.
Water Available For Use (WAFU) The value of Ml/d calculated by the deduction from deployable output of allowable
outages and planning allowances in a resource zone.
Water Framework Directive
The European Union Water Framework Directive (2000/60/EC) establishes a strategic ‘river basin planning’ approach to managing the water environment, including
achievement of good ecological status in water bodies by 2015. It provides a consistent approach for ensuring compliance with standards and objectives set for protected areas,
and implementation of programmes of measures to meet those objectives.
Water Network Plus An internal term to describe the business area responsible for water treatment and
treated water distribution.
Water Resource Zone See Resource Zone.
Water Taken Unbilled Water supplied to customers for legitimate purposes which is unbilled and water taken
illegally.
Water Trading The concept of transferring water between the incumbent areas of water companies.
Water UK
An organisation which represents and works with the major water and wastewater service providers in England, Scotland, Wales and Northern Ireland.
West Cumbria Resource Zone A term used in our Water Resources Management Plan 2015 to describe the water
resource zone covering West Cumbria. For this plan West Cumbria is now part of the Strategic Resource Zone.
WINEP Water Industry National Environment Programme.
WRc Water Research Centre
Yield A general term for the reliable supply of water from a source. More specific, defined
terms are used in this document – see Water Available For Use and Deployable Output.

United Utilities Final Water Resources Management Plan 2019
© United Utilities Water Limited 2019 Page 183 of 191
Appendix D – Alternative plans consulted upon We have revised the strategic choices and preferred plan following consultation in Sections 6 and 7 of this
final plan. The alternative plans consulted upon at the draft plan stage are included in their original form for
legacy reference and transparency for the benefit of stakeholders to show change through the planning
process. Accordingly, this content is as the draft Water Resources Management Plan submission within
Section 7, and has not been revised for this latest version of the plan.
Alternative plan 1 – continued demand management
This plan maintains our baseline supply demand balance position as outlined in Section 4. As such, no
options are required and there is no further investment. However, it should not be considered a ‘do
nothing’ plan, as a range of demand management activities are required to maintain the supply-demand
balance. These are defined as part of the baseline in Section 4.2 and account for:
Maintaining leakage levels at 448.2 Ml/d based on our three-year average from 2014/15 to
2016/17;
Water efficiency activities achieving, as a minimum, an annual saving of 1 litre per property per
day; and
Installing a total of around 180,000 water meters between 2020 and 2025. By the end of the
planning horizon in 2045, we forecast that we will reach 76% meter penetration.
This alternative plan provides a useful comparator for assessing the others below.
Alternative plan 2 – plan 1 plus enhanced leakage reduction and improved level of
service for drought permits/orders to augment supplies
As described in our Draft WRMP19 Technical Report - Options appraisal we have used a combination of
AISC and EBSD to define a leakage programme over the 2020-2045 planning period for the purposes of
consultation. The total level of leakage reduction proposed (Section 6.2) is challenging and as such we have
sought to employ innovative techniques and involve specialist third parties. At the same time we are
acutely aware that many of the newer approaches are not yet fully proven. If we are to make shorter-term
commitments on leakage we need to ensure that we can deliver them.
Therefore, we have decided to split the leakage programme into three distinct phases, as also illustrated in
Figure 35 below:
In the first five years from 2020-2025 there will be a larger dependency on the leakage options that
we are confident can be delivered, with only a small reliance on innovative approaches;
During 2025-2030 we have an even balance of reliable and innovative solutions; and
Beyond 2030 we have removed this constraint and focused on low cost and innovation by selecting
options solely on AISC.
Starting now we have the opportunity to work closely with third party suppliers to further develop and trial
these options. We should of course recognise that by 2030 some of the newer approaches may already
have been displaced by technologies that are yet to be invented; this is natural for a long-term strategic
planning process like the Water Resources Management Plan. Our future forecasts will be reviewed fully in
each planning round.
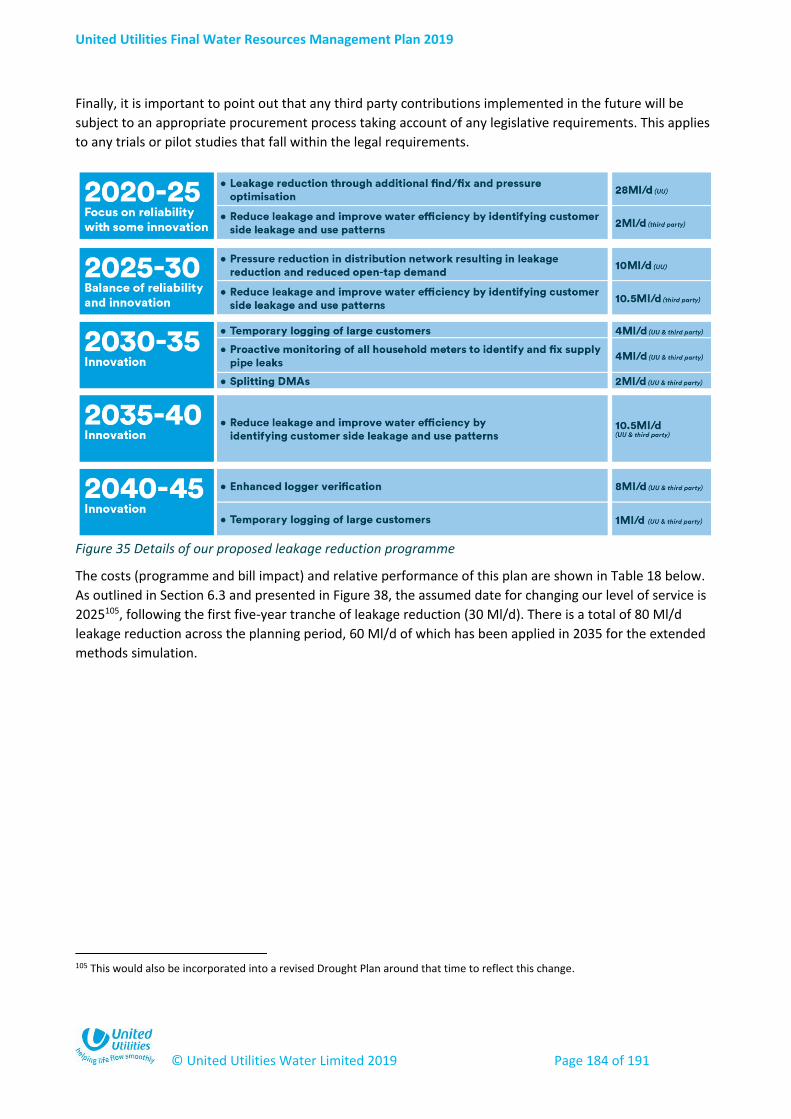
United Utilities Final Water Resources Management Plan 2019
© United Utilities Water Limited 2019 Page 184 of 191
Finally, it is important to point out that any third party contributions implemented in the future will be
subject to an appropriate procurement process taking account of any legislative requirements. This applies
to any trials or pilot studies that fall within the legal requirements.
Figure 35 Details of our proposed leakage reduction programme
The costs (programme and bill impact) and relative performance of this plan are shown in Table 18 below.
As outlined in Section 6.3 and presented in Figure 38, the assumed date for changing our level of service is
2025105, following the first five-year tranche of leakage reduction (30 Ml/d). There is a total of 80 Ml/d
leakage reduction across the planning period, 60 Ml/d of which has been applied in 2035 for the extended
methods simulation.
105 This would also be incorporated into a revised Drought Plan around that time to reflect this change.
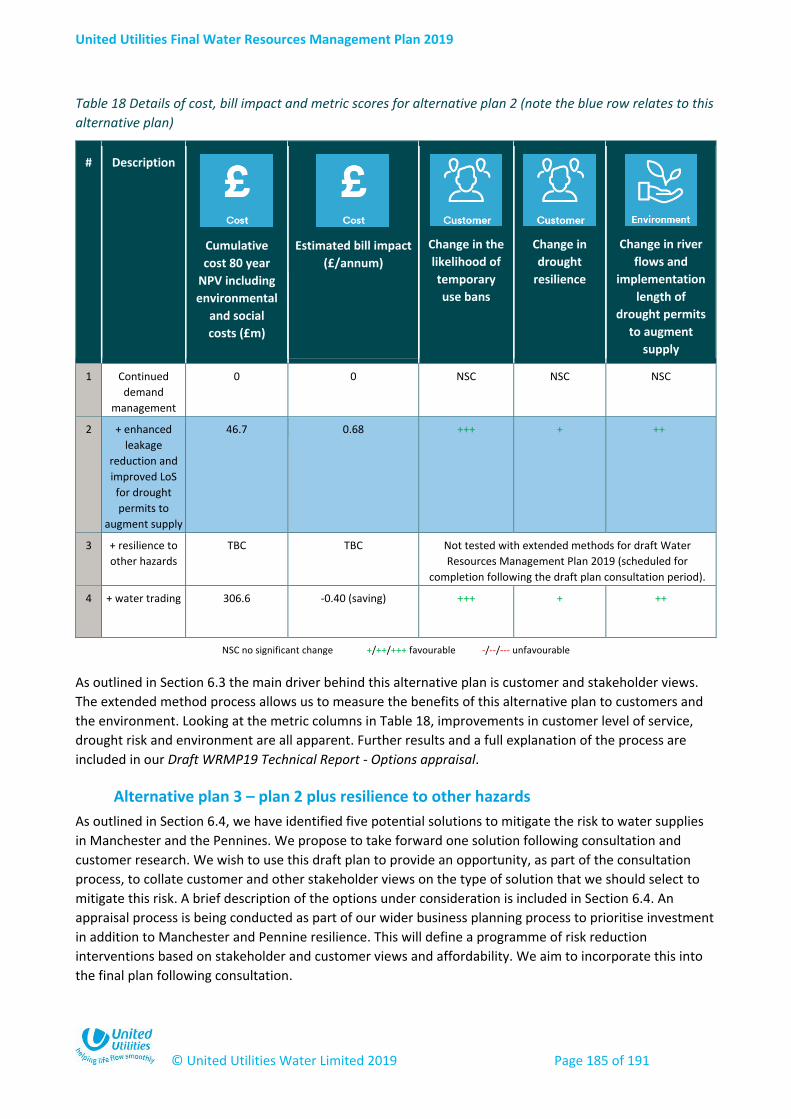
United Utilities Final Water Resources Management Plan 2019
© United Utilities Water Limited 2019 Page 185 of 191
Table 18 Details of cost, bill impact and metric scores for alternative plan 2 (note the blue row relates to this
alternative plan)
# Description
Cumulative
cost 80 year
NPV including
environmental
and social
costs (£m)
Estimated bill impact
(£/annum)
Change in the
likelihood of
temporary
use bans
Change in
drought
resilience
Change in river
flows and
implementation
length of
drought permits
to augment
supply 1 Continued
demand
management
0 0
NSC NSC NSC
2 + enhanced
leakage
reduction and
improved LoS
for drought
permits to
augment supply
46.7 0.68 +++ + ++
3 + resilience to
other hazards TBC TBC Not tested with extended methods for draft Water
Resources Management Plan 2019 (scheduled for
completion following the draft plan consultation period). 4 + water trading 306.6 -0.40 (saving) +++ + ++
As outlined in Section 6.3 the main driver behind this alternative plan is customer and stakeholder views.
The extended method process allows us to measure the benefits of this alternative plan to customers and
the environment. Looking at the metric columns in Table 18, improvements in customer level of service,
drought risk and environment are all apparent. Further results and a full explanation of the process are
included in our Draft WRMP19 Technical Report - Options appraisal.
Alternative plan 3 – plan 2 plus resilience to other hazards
As outlined in Section 6.4, we have identified five potential solutions to mitigate the risk to water supplies
in Manchester and the Pennines. We propose to take forward one solution following consultation and
customer research. We wish to use this draft plan to provide an opportunity, as part of the consultation
process, to collate customer and other stakeholder views on the type of solution that we should select to
mitigate this risk. A brief description of the options under consideration is included in Section 6.4. An
appraisal process is being conducted as part of our wider business planning process to prioritise investment
in addition to Manchester and Pennine resilience. This will define a programme of risk reduction
interventions based on stakeholder and customer views and affordability. We aim to incorporate this into
the final plan following consultation.
NSC no significant change +/++/+++ favourable -/--/--- unfavourable
United Utilities Final Water Resources Management Plan 2019
© United Utilities Water Limited 2019 Page 186 of 191
These options comprise either rebuilding or repairing aqueduct sections, new water treatment works for
operational use, or some new assets to provide redundancy for outages or failures. At this stage we have
assumed that there is no impact of these options on the supply-demand balance, because the capacity of
the new assets would only be used infrequently. Once the options to address this risk have been further
established we will be able to examine how this interacts with other elements of the preferred plan and
whether there are any resulting changes to the final supply-demand balance position. We therefore aim to
incorporate this element further into the final plan following consultation if necessary. However, it should
be noted that this is not expected to impact on water trading options covered in the next section
(Alternative Plan 4, see Section 7.6), which relates to medium-long term needs and is designed to maintain
the pre-trading level of resilience for customers.
Alternative plan 4 – plan 3 plus national water trading
As outlined in Section 6.5 and our Draft WRMP19 Technical Report - Options identification, we have
explored a number of potential water trades. Our strategic choice relates to a national water trade
involving Thames Water. In order to maintain supplies to customers when exporting from Lake Vyrnwy we
will need to make modifications to our supply system. This will include developing new sources of water to
ensure there is no impact on customers or the environment, taking into account the benefits of our leakage
reduction programme.
Our proposed options are shown in Figure 36 below. The new supplies will provide water to offset that
which would normally come from the River Dee and Vyrnwy. These options have been selected to maintain
resilience and maintain environmental standards. For any new supplies, or changes to existing supplies, we
would ensure that there is no deterioration to drinking water quality (Section 9.5).

United Utilities Final Water Resources Management Plan 2019
© United Utilities Water Limited 2019 Page 187 of 191
Figure 36 Details of our proposed option for water trading (includes options ID for cross-referencing to our
Final WRMP19 Technical Report - Options identification, sizes refer to capacity) *Substitute option
identified106
The export is designed to operate during times of relatively dry weather in Thames Water’s areas.
Therefore the redistribution of water and the new sources will only need to be used relatively infrequently.
Stochastic analysis that we have commissioned jointly with Thames Water indicates that this is less than
15% of the time on average.
The export with these options in place has been tested in our extended methods process to ensure that
they do not result in additional risks to supplies or the environment during drought events in the North
West. The results are shown in Table 19 below. In terms of drought risk and impact on the environment
there will be no impact in 2035 relative to the position with the leakage reduction program (Section 7.4) in
place. There is an indicated further improvement in customer level of service; this is a coincidental benefit
of the requirement to maintain performance across all metrics. This is the lowest-cost portfolio of options
that we could identify which satisfied our objectives to protect customers and the environment; further
information on the selection process is provided in our Draft WRMP19 Technical Report - Options appraisal.
We have also tested the implications for drinking water quality, this work is outlined in Section 9.5.
106 As outlined in Section 7.4.5 a groundwater abstraction at Barrow in Furness (WR100) was identified as a substitute option for
Python Mill (WR114). Potential risks were identified with WR114 as part of the Habitats Regulation Assessment. If these cannot be
effectively mitigated in the future a substitute option will be required.
•Divert water sources from the River Dee, currently supplying other areas, to areas currently supplied from Vyrnwy
•Pump a portion of this along existing large diameter trunk mains to the existing water treatment works which treats water from Vyrnwy
Enabling the redistribution of water
•Water efficiency (education programme, goods and advice on metering, home checks on metering) - WR610b, WR620b, WR623b (10 Ml/d total)
•Improved reservoir compensation release control (local reservoirs, regional reservoirs) -WR159 and WR160 (22 Ml/d total)
More efficient use of water
•Further develop existing groundwater sources (Tytherington, Worsthorne, Bold Heath, Python Mill, Franklaw) - WR113, WR099b, WR102e, WR114*, WR101 (49 Ml/d total)
•Third party supply (Shropshire Union Canal at Hurleston WTW) - WR821 (30 Ml/d)
New sources of water
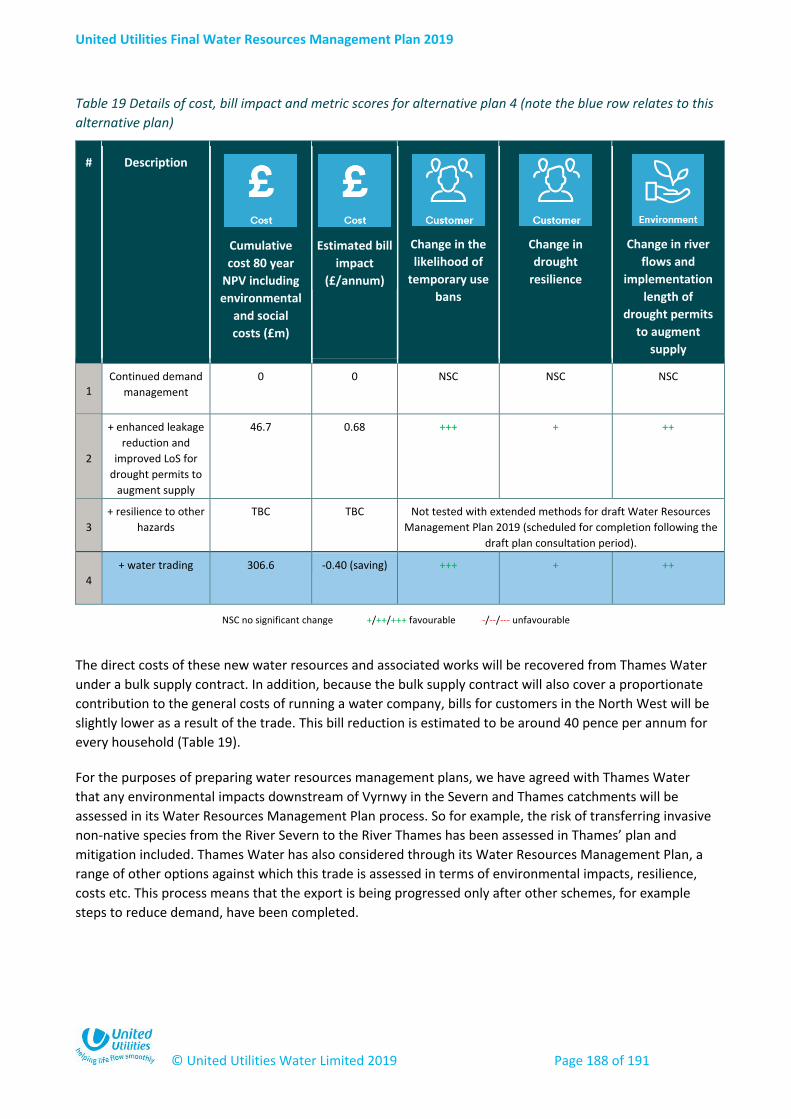
United Utilities Final Water Resources Management Plan 2019
© United Utilities Water Limited 2019 Page 188 of 191
Table 19 Details of cost, bill impact and metric scores for alternative plan 4 (note the blue row relates to this
alternative plan)
# Description
Cumulative
cost 80 year
NPV including
environmental
and social
costs (£m)
Estimated bill
impact
(£/annum)
Change in the
likelihood of
temporary use
bans
Change in
drought
resilience
Change in river
flows and
implementation
length of
drought permits
to augment
supply
1 Continued demand
management
0 0
NSC NSC NSC
2
+ enhanced leakage
reduction and
improved LoS for
drought permits to
augment supply
46.7 0.68 +++ + ++
3
+ resilience to other
hazards
TBC TBC Not tested with extended methods for draft Water Resources
Management Plan 2019 (scheduled for completion following the
draft plan consultation period).
4
+ water trading 306.6 -0.40 (saving) +++ + ++
The direct costs of these new water resources and associated works will be recovered from Thames Water
under a bulk supply contract. In addition, because the bulk supply contract will also cover a proportionate
contribution to the general costs of running a water company, bills for customers in the North West will be
slightly lower as a result of the trade. This bill reduction is estimated to be around 40 pence per annum for
every household (Table 19).
For the purposes of preparing water resources management plans, we have agreed with Thames Water
that any environmental impacts downstream of Vyrnwy in the Severn and Thames catchments will be
assessed in its Water Resources Management Plan process. So for example, the risk of transferring invasive
non-native species from the River Severn to the River Thames has been assessed in Thames’ plan and
mitigation included. Thames Water has also considered through its Water Resources Management Plan, a
range of other options against which this trade is assessed in terms of environmental impacts, resilience,
costs etc. This process means that the export is being progressed only after other schemes, for example
steps to reduce demand, have been completed.
NSC no significant change +/++/+++ favourable -/--/--- unfavourable
United Utilities Final Water Resources Management Plan 2019
© United Utilities Water Limited 2019 Page 189 of 191
The preferred plan
In combining the strategic choices as a coherent plan, we have ensured that we have considered in-
combination impacts and opportunities. In simple terms, Alternative Plan 4 was selected as the preferred
plan because it contains all of the strategic choices we have proposed to address customer and stakeholder
views. Selecting Alternative Plan 3 would not allow us to continue to explore national water trading,
thereby failing to meet a potential future national need, and missing the opportunity to provide the
associated bill saving to customers. Alternative plan 2, whilst cheaper than Alternative plan 3 (cost to be
confirmed), would not allow us to address pressing supply system resilience needs. Alternative plan 2 has
an additional estimated cost of £46.7m (net present value including environmental and social costs)
compared to Alternative plan 1, but will help to meet customer, stakeholder and regulatory aspirations on
leakage reduction, and at the same time provide environmental benefits and allow us to improve our level
of service for drought permits in 2025. Alternative Plan 1 has the lowest cost of all plans, but it does not
deliver any of these strategic choices.

United Utilities Final Water Resources Management Plan 2019
© United Utilities Water Limited 2019 Page 190 of 191