
WEST COAST DATA ROUND UP
Matthew TooleBuyouts WestNovember 18, 2008

Worldwide M&A Activity down 37% - Private Equity-backed M&A declines 75% over 2007
0
200
400
600
800
1,000
1,200
1,400
1,600
1Q05 2Q05 3Q05 4Q05 1Q06 2Q06 3Q06 4Q06 1Q07 2Q07 3Q07 4Q07 1Q08 2Q08 3Q08
Vo
lum
e ($
bil
)
0%
5%
10%
15%
20%
25%
30%
% P
riva
te E
qu
ity
Act
ivit
y
Strategic M&A
Private Equity M&A
Private Equity M&A as % of Total M&A

US M&A Activity down nearly 40%; Private Equity-backed M&A declines 85% over 2007
0
100
200
300
400
500
600
700
1Q05 2Q05 3Q05 4Q05 1Q06 2Q06 3Q06 4Q06 1Q07 2Q07 3Q07 4Q07 1Q08 2Q08 3Q08
Vo
lum
e ($
bil
)
0%
5%
10%
15%
20%
25%
30%
35%
40%
% P
riva
te E
qu
ity
Act
ivit
y
Strategic M&A
Private Equity M&A
Private Equity M&A as % of Total M&A

West Coast Buyout Investments up 18% over 2007;Number of West Coast Buyout Investments Decline
0
500
1000
1500
2000
1Q05 2Q05 3Q05 4Q05 1Q06 2Q06 3Q06 4Q06 1Q07 2Q07 3Q07 4Q07 1Q08 2Q08 3Q08
Vo
lum
e ($
bil
)
0
20
40
60
80
100
120
140
160
180
Nu
mb
er o
f D
eals
Buyout Investments by West Coast Firms ($bil)
Number of Deals

0
100
200
300
400
500
600
Americas Europe Central Asia/Asia-Pacific
Japan Africa/Middle East
Vo
lum
e ($
bil
)
Volume: 1/1/2008-11/17/2008 Volume: 1/1/2007-11/17/2007
Private Equity Slump is a Global Phenomenon
-59%
-81%
-4% -51% -72%
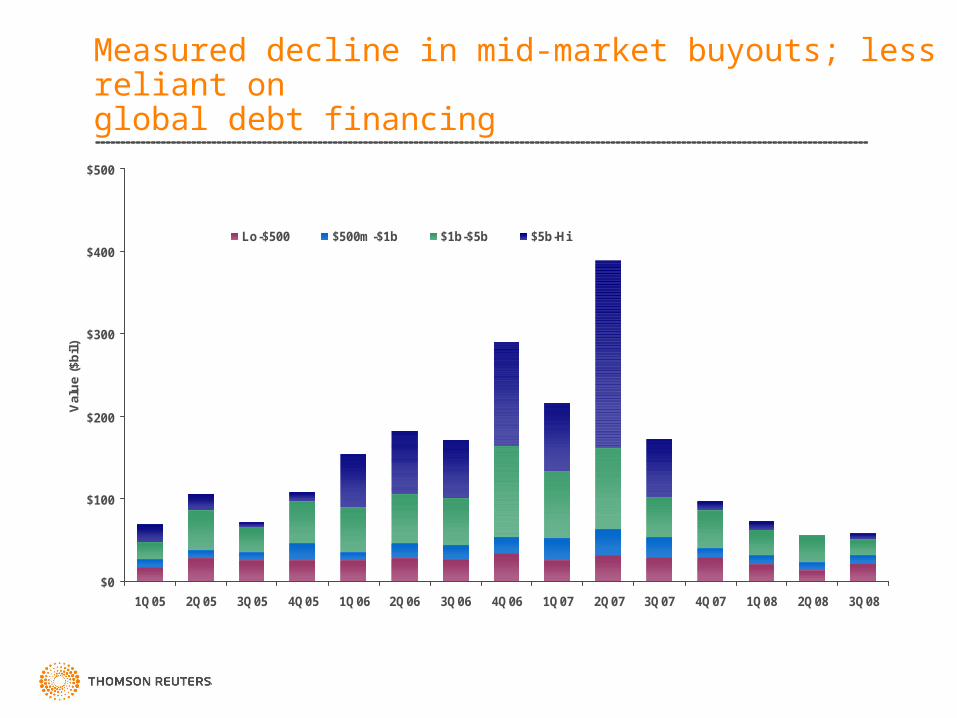
Measured decline in mid-market buyouts; less reliant on global debt financing
$0
$100
$200
$300
$400
$500
1Q05 2Q05 3Q05 4Q05 1Q06 2Q06 3Q06 4Q06 1Q07 2Q07 3Q07 4Q07 1Q08 2Q08 3Q08
Val
ue
($b
il)
Lo-$500 $500m-$1b $1b-$5b $5b-Hi

Global Buyout Investments by Sector
Worldw ide Buyouts by Industry
21.6
14.4
119.5
8.9
6.3
5.8
5.3
4.8
4.3 3.6
4.5
Financials Energy and Power
High Technology Consumer Products and Services
Industrials MaterialsMedia and Entertainment Healthcare
Telecommunications Consumer Staples
Real Estate Retail
Global M&A - Buyouts Impact
0
50
100
150
200
250
300
350
400
450
500
Fin
anci
als
En
erg
y an
d P
ow
er
Co
nsu
mer
Pro
du
cts
Co
nsu
mer
Sta
ple
s
Mat
eria
ls
Ind
ust
rial
s
Hea
lth
care
Hig
h T
ech
Rea
l E
stat
e
Tel
eco
m
Med
ia
Ret
ail
Strategic Volume ($bil)
Buyout Volume ($bil)
*Data through 9/30/2008

PE Activity was a Key Driver of the M&A Market and Investment Banking Fees
Imputed Fee Estimates by Freeman & Co
0
2000
4000
6000
8000
10000
12000
14000
16000
2001 2002 2003 2004 2005 2006 2007
Fee
s ($
mil
)
M&A Exit
Equity Exit
Portfolio Activity
Buyout Financing
Buyout
Fees paid by Financial Sponsors

Global Retraction in Credit Markets Slows Buyout Activity; HY Activity down 80% over 2007
0
10000
20000
30000
40000
50000
60000
70000
80000
'04 '05 '06 '07 '080
20
40
60
80
100
120
140
160
180
High Yield Bonds ($mil) Number of Deals
0
50
100
150
200
250
300
350
400
450
500
'04 '05 '06 '07 '080
100
200
300
400
500
600
700
800
900
Leveraged Loans ($bil) Number of Deals
*Data through 9/30/2008

Frozen Exit Markets for Venture and Buyouts
0
10
20
30
40
50
60
70
80
90
2001 2002 2003 2004 2005 2006 2007 2008*
Venture-backed IPO Buyout-backed IPO
0
50
100
150
200
250
300
350
400
2001 2002 2003 2004 2005 2006 2007 2008*
Venture-backed M&A Buyout-backed M&A
US Initial Public Offerings US Mergers & Acquisitions

Global Private Equity Fundraising
0
50
100
150
200
250
300
1996 1997 1998 1999 2000 2001 2002 2003 2004 2005 2006 2007 2008*
Venture Fundraising ($bil) Buyout Fundraising ($bil)
*Data through 9/30/2008

West Coast Buyout Fundraising Down 38% from 2007 levels; Number of Funds on Par with Year-Ago
0
5
10
15
1Q05 2Q05 3Q05 4Q05 1Q06 2Q06 3Q06 4Q06 1Q07 2Q07 3Q07 4Q07 1Q08 2Q08 3Q08
Fu
nd
s ($
bil
)
0
5
10
15
20
25
Nu
mb
er o
f F
un
ds
Funds Raised by West Coast Buyout Firms ($bil) Number of Funds

* net of management fees and carried interest
• All calculations are done at the fund level* by Thomson Reuters based on cash flows and NAVs reported by participating LPs and GPs
• Cash flow database contains 1800+ US private equity funds (480+ buyout funds)
• Pooled IRR: IRR of a group of funds where their cash flows have been aggregated together before IRR calculation
• Investment Horizon Return: IRR calculated with Net Asset Value as capital outflow at beginning of period, Net Asset Value at end of period, and actual cash flow in between
Definitions:
Performance Methodology

US Performance Benchmarks
Fund Type 1 Yr 3 Yr 5 Yr 10 Yr 20 Yr
Early/Seed VC 2.10 4.90 5.00 32.90 21.40 Balanced VC 2.50 10.80 11.90 14.40 14.70 Later Stage VC 15.30 12.40 11.10 8.50 14.50 All Venture 5.10 8.50 8.80 16.60 16.90 Small Buyouts (8.40) 5.20 8.90 4.70 12.60 Med Buyouts 15.10 11.60 12.80 7.40 11.80 Large Buyouts 27.40 8.30 13.50 6.70 12.00 Mega Buyouts (1.90) 11.10 14.50 7.80 11.30 All Buyouts 0.40 10.50 13.90 7.40 11.60 Mezzanine 12.50 5.40 5.20 5.80 8.10 Buyouts and Other PE 0.80 11.40 13.70 7.80 11.40 All Priv Equity 1.60 10.60 12.30 9.50 13.30
*Data through 6/30/2008

US Private Equity Performance Index
-10
-5
0
5
10
15
20
1 yr 3yr 5yr 10yr 20yr
All Venture All Buyouts NASDAQ S&P 500
*Data through 6/30/2008


