
Workshop objectives
1. To understand differences in DD models and outputs
2. To assess contribution of women to harnessing the DD
3. To understand issues with implementing DD-related development strategies at the country level
4. To gain knowledge on strategies for communicating research on the DD to non-technical audiences

“Field guide” to available DD models
J.M. Ian Salas
Jan. 25, 2016

Preface
• In ICFP program, there is a session on “Modeling the DD”
1. NTA labor-consumption age profiles
2. DemDiv simulation tool
3. CKW macro-simulation model
• This presentation aims to situate the approaches against each other

Different DD-related approaches
1. NTA labor-consumption age profiles
2. DemDiv simulation tool
3. CKW macro-simulation model
* Nigeria example

Economic Lifecycle
• The economic lifecycle refers to the variation over our lifetime of our needs and our abilities
• Expresses itself in age variation in what we consume and what we produce
• In all contemporary societies we have extended periods at the beginning and the end of our lives, when we are consuming far more than we are producing.

Economic Lifecycle
• Labor income– Wages & salaries
– Self-employment income
• Profiles based on household surveys of wages and income
• Adjusted to match National Income and Product Accounts
• Reflects age variation in productivity, hours worked, unemployment, and labor force participation.
• Consumption– Public and private
– Education, health, and other
• Profiles based on surveys and administrative records
• Adjusted to match National Income and Product Accounts
• Reflects age variation in expenditures

Important features of the
economic lifecycle
• In all contemporary societies there are large per capita lifecycle deficits at both the young and old ages.
• The per capita child deficit is rising as fertility declines, more is invested in human capital, and entry into the labor force is delayed.
• The per capita old age deficit is rising as age at retirement has declined and spending on health care has increased.
• The aggregate economic lifecycle is dominated by changes in age structure.

Per capita age profiles
Consumption & Labor income, 1999
Philippine NTA
0
10,000
20,000
30,000
40,000
50,000
60,000
70,000
0 10 20 30 40 50 60 70 80 90+
Pesos
Labor income
Consumption

Aggregate age profiles
Consumption & Labor income, 1999
Philippine NTA
0
10
20
30
40
50
60
70
0 10 20 30 40 50 60 70 80 90+
Billion Pesos
Total labor
income
Total
consumption

Aggregate age profiles
Lifecycle deficit, 1999
Philippine NTA
-30
-20
-10
0
10
20
30
40
50
60
0 10 20 30 40 50 60 70 80 90+
Billion Pesos
Surplus
Deficit
Deficit

USA, 2003
Austria, 2000
Sweden, 2003
Germany, 2003
0
0.3
0.6
0.9
1.2
1.5
0 10 20 30 40 50 60 70 80 90+ 0
0.3
0.6
0.9
1.2
1.5
0 10 20 30 40 50 60 70 80 90+ 0
0.3
0.6
0.9
1.2
1.5
0 10 20 30 40 50 60 70 80 90+ 0
0.3
0.6
0.9
1.2
1.5
0 10 20 30 40 50 60 70 80 90+
Japan, 2004
Finland, 2004
Spain, 2000
Slovenia, 2004
0
0.3
0.6
0.9
1.2
1.5
0 10 20 30 40 50 60 70 80 90+ 0
0.3
0.6
0.9
1.2
1.5
0 10 20 30 40 50 60 70 80 90+ 0
0.3
0.6
0.9
1.2
1.5
0 10 20 30 40 50 60 70 80 90+ 0
0.3
0.6
0.9
1.2
1.5
0 10 20 30 40 50 60 70 80 90+
Taiwan, 1998
Korea, 2000
Hungary, 2005
Mexico, 2004
0
0.3
0.6
0.9
1.2
1.5
0 10 20 30 40 50 60 70 80 90+ 0
0.3
0.6
0.9
1.2
1.5
0 10 20 30 40 50 60 70 80 90+ 0
0.3
0.6
0.9
1.2
1.5
0 10 20 30 40 50 60 70 80 90+ 0
0.3
0.6
0.9
1.2
1.5
0 10 20 30 40 50 60 70 80 90+
Chile, 1997
Costa Rica, 2004
Uruguay, 1994
Brazil, 1996
0
0.3
0.6
0.9
1.2
1.5
0 10 20 30 40 50 60 70 80 90+ 0
0.3
0.6
0.9
1.2
1.5
0 10 20 30 40 50 60 70 80 90+ 0
0.3
0.6
0.9
1.2
1.5
0 10 20 30 40 50 60 70 80 90+ 0
0.3
0.6
0.9
1.2
1.5
0 10 20 30 40 50 60 70 80 90+
Thailand, 2004
Indonesia, 2005
China, 2002
Philippines, 1999
0
0.3
0.6
0.9
1.2
1.5
0 10 20 30 40 50 60 70 80 90+ 0
0.3
0.6
0.9
1.2
1.5
0 10 20 30 40 50 60 70 80 90+ 0
0.3
0.6
0.9
1.2
1.5
0 10 20 30 40 50 60 70 80 90+ 0
0.3
0.6
0.9
1.2
1.5
0 10 20 30 40 50 60 70 80 90+
India, 2004
Nigeria, 2004
Kenya, 1994
0
0.3
0.6
0.9
1.2
1.5
0 10 20 30 40 50 60 70 80 90+ 0
0.3
0.6
0.9
1.2
1.5
0 10 20 30 40 50 60 70 80 90+ 0
0.3
0.6
0.9
1.2
1.5
0 10 20 30 40 50 60 70 80 90+
0
1
2
1 11 21 31 41 51 61 71 81 91
YL
C
CF
CG
Source: Tung (2011)

Age Reallocation System
• Age reallocation system is the counterpart of the economic lifecycle
• Economic system that shifts resources from one age group to another.
• Accounting: Fills the gap between consumption and labor income (flow constraint).
• All reallocations fall in two broad classes – Transfers
• Public transfers (cash and in-kind)
• Private transfers (familial including intra-household)
– Asset-based reallocations
• Asset income
• Saving

The NTA Flow Account Identity
• Inflows
– Labor Income
– Asset Income
– Transfer Inflows
• Outflows
– Consumption
– Saving
– Transfer Outflows
Inflows Outflows
( ) ( ) ( ) ( ) ( ) ( )l aY x Y x x C x S x x
Lifecycle Deficit Net Transfers Asset-based Reallocations
Age Reallocations
( ) ( ) ( ) ( ) ( ) ( )l aC x Y x x x Y x S x
where x is age.

Components of Lifecycle Deficit, US 2003
-30000
-20000
-10000
0
10000
20000
30000
40000
50000
60000
70000
0 3 6 9 12 15 18 21 24 27 30 33 36 39 42 45 48 51 54 57 60 63 66 69 72 75 78 81 84 87 90
Age
US
$
Public Asset-Based Reallocations
Private Asset-Based Reallocations
Public Transfers
Private Transfers
Funding the Child Deficit
Net public transfers – public
schools, value of public
goods allocated to children.
Net private transfers – intra-
household transfers to
children; largest in all
countries studied.
Asset-based flows – none for
children, small for young
adults (mostly credit).
Source: NTA

Components of Lifecycle Deficit, US 2003
-30000
-20000
-10000
0
10000
20000
30000
40000
50000
60000
70000
0 3 6 9 12 15 18 21 24 27 30 33 36 39 42 45 48 51 54 57 60 63 66 69 72 75 78 81 84 87 90
Age
US
$
Public Asset-Based Reallocations
Private Asset-Based Reallocations
Public Transfers
Private Transfers
Funding the Old-age Deficit
Asset-based reallocations –
asset income and dis-saving
from owner-occupied
housing, private pension
funds, personal saving, etc.
Net public transfers – social
programs (public pensions,
health care, etc.), benefits
from general programs, less
taxes paid.
Net private transfers – inter-
and intra-household
transfers.
Source: NTA

Nigeria age profiles, 2004 and 2009
Source: NTA
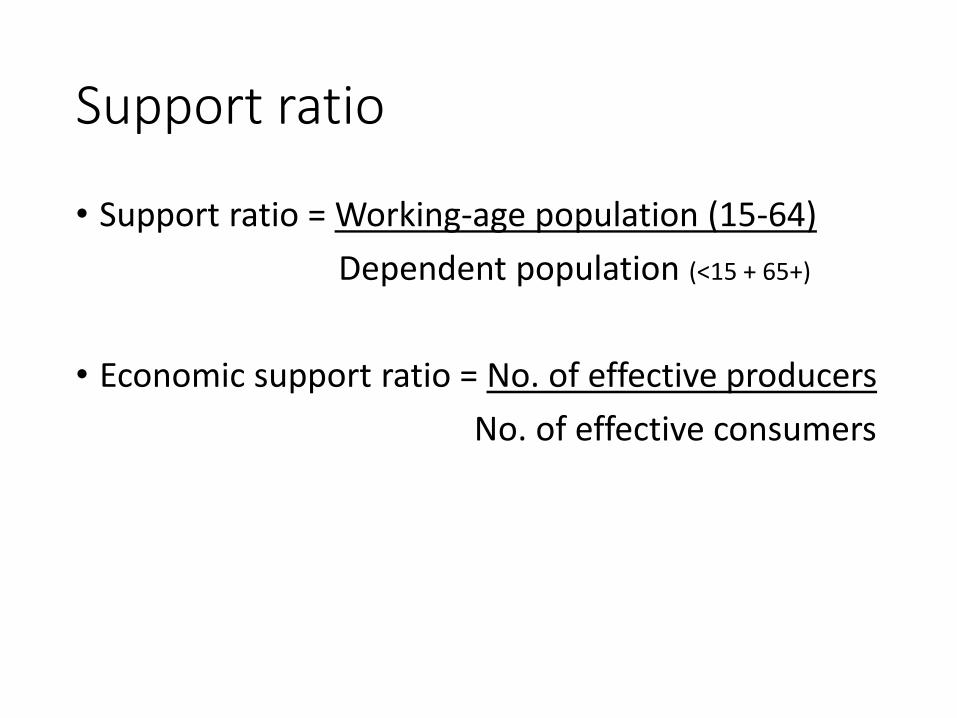
Support ratio
• Support ratio = Working-age population (15-64)
Dependent population (<15 + 65+)
• Economic support ratio = No. of effective producers
No. of effective consumers

Comparing the two for Nigeria
0.3
0.35
0.4
0.45
0.5
0.55
0.6
0.65
1950 2000 2050 2100
Economic Support Ratio
0.8
1.2
1.6
2
2.4
1950 2000 2050 2100
Support Ratio

Mechanical and behavioral sources of potential growth
Source: NTA manual

First and second dividend in Nigeria
Source: Mason, Lee, Jiang (2015)

DemDiv: Demographic sub-model
Source: DemDiv technical guide

DemDiv: Economic sub-model
Source: DemDiv technical guide

Source: DemDiv

DemDiv: Kenya example
Source: DemDiv

DemDiv: Kenya example
Source: DemDiv

DemDiv: Kenya example
Source: DemDiv

DemDiv: Kenya and Uganda output
• Kenya • Uganda Vision 2040
Source: DemDiv briefs
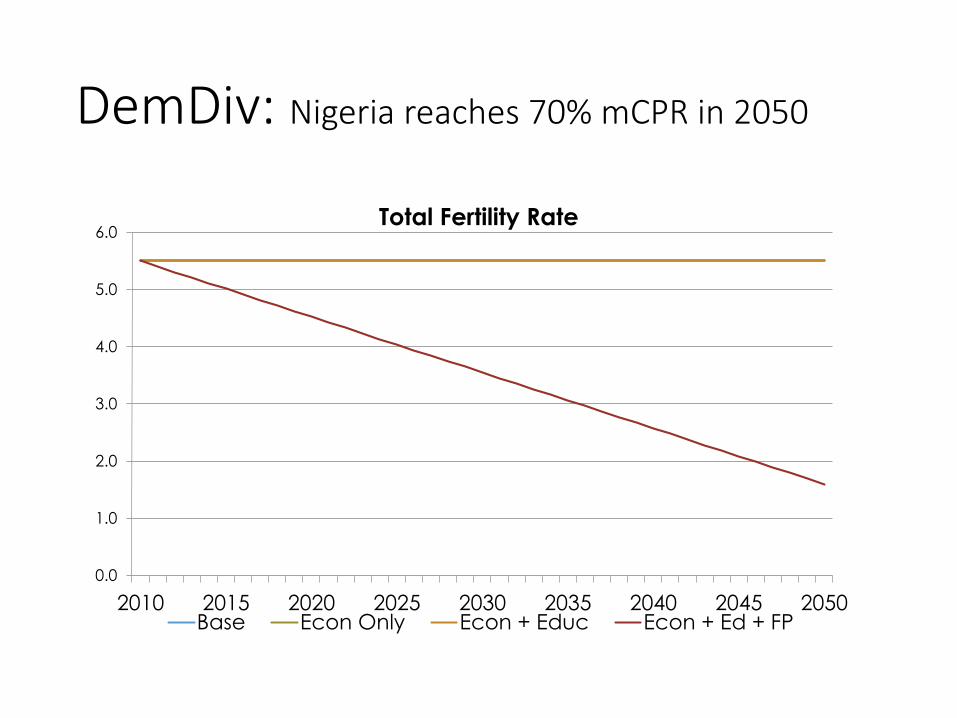
DemDiv: Nigeria reaches 70% mCPR in 2050
0.0
1.0
2.0
3.0
4.0
5.0
6.0
2010 2015 2020 2025 2030 2035 2040 2045 2050
Total Fertility Rate
Base Econ Only Econ + Educ Econ + Ed + FP
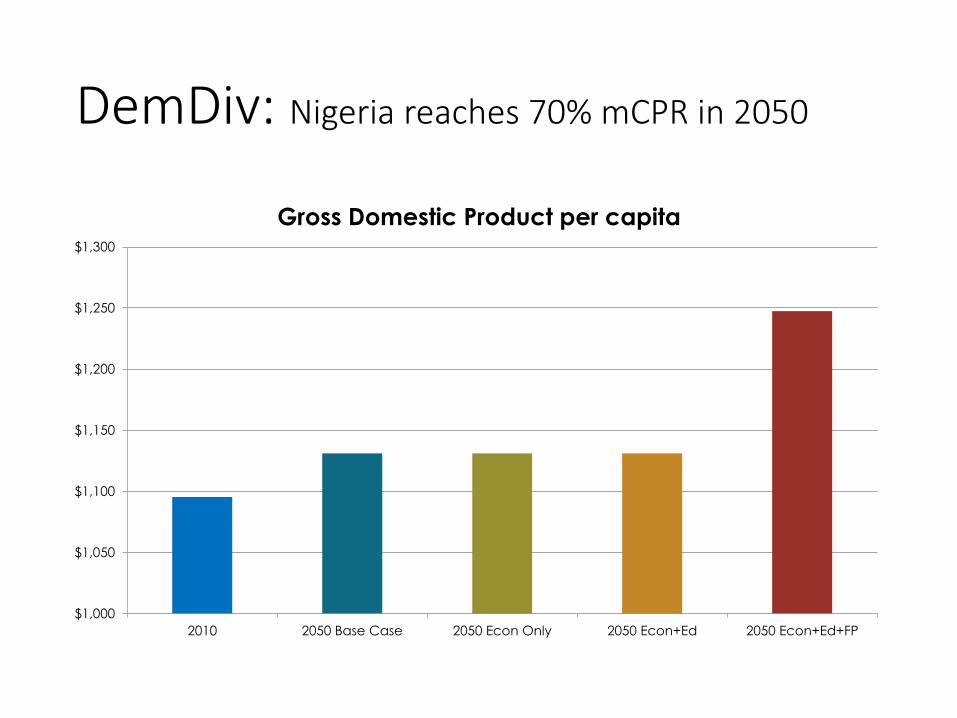
DemDiv: Nigeria reaches 70% mCPR in 2050
$1,000
$1,050
$1,100
$1,150
$1,200
$1,250
$1,300
2010 2050 Base Case 2050 Econ Only 2050 Econ+Ed 2050 Econ+Ed+FP
Gross Domestic Product per capita

DemDiv
• intended for practical use with concrete policy levers and connections
• relationships “stylized” from cross-country regressions
• policy variables for econ, education, and FP distinct and separate, so no dynamic feedback loops incorporated

CKW: Full model of production
Source: CKW (2015)

CKW: Micro-founded relationships
Source: CKW (2015)
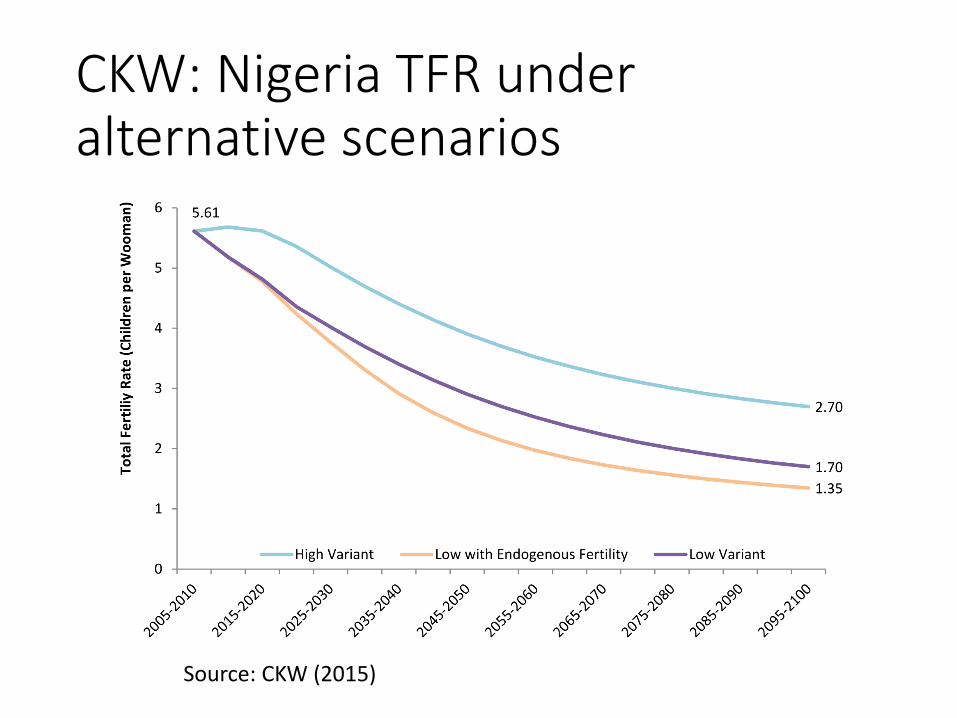
CKW: Nigeria TFR under alternative scenarios
Source: CKW (2015)

CKW: Nigeria population projected under alternative scenarios
Source: CKW (2015)

CKW: Simulated income per capita
Source: CKW (2015)

CKW: Female employment
Source: CKW (2015)
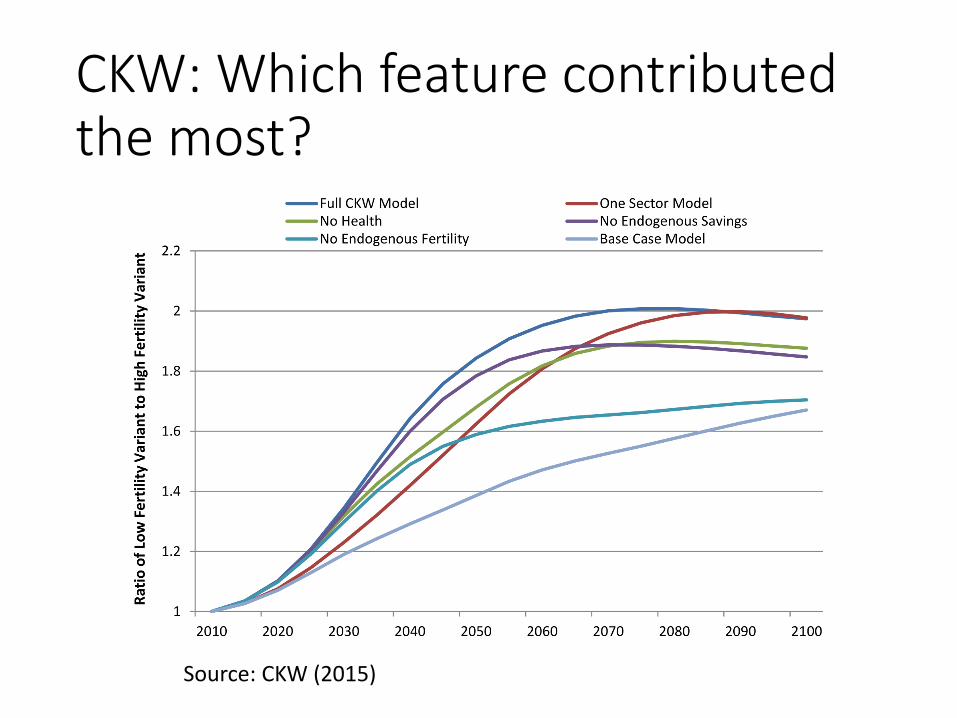
CKW: Which feature contributed the most?
Source: CKW (2015)

Summary
• NTA: support ratio a refinement of dependency ratio
• DemDiv: macro-based simulation model, policy-oriented
• CKW: micro-founded simulation model
• Schultz's take• micro experiments along the lines of Matlab
• DD benefits course through changes in time allocation/economic activity of women
• also health and productivity gains of women and their children

Summary (2)
• Complicated endeavor because of complexity involved
• Approaches highlight different features• NTA: economic lifecycle, support system; a bit static
• CKW: structural model showing channels and mechanisms; with dynamic feedback loops
• DemDiv: ease of use and relevance to policymakers
Questions/issues to be raised
• Need for system-level understanding of the economic and demographic forces that are at play
• Things change slowly, but compounding magnifies any initial change
• How does this modeling relate to the often-mentioned assertion that context-specific policies are needed to realize the DD?


