workshop objectives - gates institute guide on dd...workshop objectives 1. ... •this presentation...
TRANSCRIPT

Workshop objectives
1. To understand differences in DD models and outputs
2. To assess contribution of women to harnessing the DD
3. To understand issues with implementing DD-related development strategies at the country level
4. To gain knowledge on strategies for communicating research on the DD to non-technical audiences

“Field guide” to available DD models
J.M. Ian Salas
Jan. 25, 2016

Preface
• In ICFP program, there is a session on “Modeling the DD”
1. NTA labor-consumption age profiles
2. DemDiv simulation tool
3. CKW macro-simulation model
• This presentation aims to situate the approaches against each other

Different DD-related approaches
1. NTA labor-consumption age profiles
2. DemDiv simulation tool
3. CKW macro-simulation model
* Nigeria example

Economic Lifecycle
• The economic lifecycle refers to the variation over our lifetime of our needs and our abilities
• Expresses itself in age variation in what we consume and what we produce
• In all contemporary societies we have extended periods at the beginning and the end of our lives, when we are consuming far more than we are producing.

Economic Lifecycle
• Labor income– Wages & salaries
– Self-employment income
• Profiles based on household surveys of wages and income
• Adjusted to match National Income and Product Accounts
• Reflects age variation in productivity, hours worked, unemployment, and labor force participation.
• Consumption– Public and private
– Education, health, and other
• Profiles based on surveys and administrative records
• Adjusted to match National Income and Product Accounts
• Reflects age variation in expenditures

Important features of the
economic lifecycle
• In all contemporary societies there are large per capita lifecycle deficits at both the young and old ages.
• The per capita child deficit is rising as fertility declines, more is invested in human capital, and entry into the labor force is delayed.
• The per capita old age deficit is rising as age at retirement has declined and spending on health care has increased.
• The aggregate economic lifecycle is dominated by changes in age structure.

Per capita age profiles
Consumption & Labor income, 1999
Philippine NTA
0
10,000
20,000
30,000
40,000
50,000
60,000
70,000
0 10 20 30 40 50 60 70 80 90+
Pesos
Labor income
Consumption

Aggregate age profiles
Consumption & Labor income, 1999
Philippine NTA
0
10
20
30
40
50
60
70
0 10 20 30 40 50 60 70 80 90+
Billion Pesos
Total labor
income
Total
consumption

Aggregate age profiles
Lifecycle deficit, 1999
Philippine NTA
-30
-20
-10
0
10
20
30
40
50
60
0 10 20 30 40 50 60 70 80 90+
Billion Pesos
Surplus
Deficit
Deficit

USA, 2003
Austria, 2000
Sweden, 2003
Germany, 2003
0
0.3
0.6
0.9
1.2
1.5
0 10 20 30 40 50 60 70 80 90+ 0
0.3
0.6
0.9
1.2
1.5
0 10 20 30 40 50 60 70 80 90+ 0
0.3
0.6
0.9
1.2
1.5
0 10 20 30 40 50 60 70 80 90+ 0
0.3
0.6
0.9
1.2
1.5
0 10 20 30 40 50 60 70 80 90+
Japan, 2004
Finland, 2004
Spain, 2000
Slovenia, 2004
0
0.3
0.6
0.9
1.2
1.5
0 10 20 30 40 50 60 70 80 90+ 0
0.3
0.6
0.9
1.2
1.5
0 10 20 30 40 50 60 70 80 90+ 0
0.3
0.6
0.9
1.2
1.5
0 10 20 30 40 50 60 70 80 90+ 0
0.3
0.6
0.9
1.2
1.5
0 10 20 30 40 50 60 70 80 90+
Taiwan, 1998
Korea, 2000
Hungary, 2005
Mexico, 2004
0
0.3
0.6
0.9
1.2
1.5
0 10 20 30 40 50 60 70 80 90+ 0
0.3
0.6
0.9
1.2
1.5
0 10 20 30 40 50 60 70 80 90+ 0
0.3
0.6
0.9
1.2
1.5
0 10 20 30 40 50 60 70 80 90+ 0
0.3
0.6
0.9
1.2
1.5
0 10 20 30 40 50 60 70 80 90+
Chile, 1997
Costa Rica, 2004
Uruguay, 1994
Brazil, 1996
0
0.3
0.6
0.9
1.2
1.5
0 10 20 30 40 50 60 70 80 90+ 0
0.3
0.6
0.9
1.2
1.5
0 10 20 30 40 50 60 70 80 90+ 0
0.3
0.6
0.9
1.2
1.5
0 10 20 30 40 50 60 70 80 90+ 0
0.3
0.6
0.9
1.2
1.5
0 10 20 30 40 50 60 70 80 90+
Thailand, 2004
Indonesia, 2005
China, 2002
Philippines, 1999
0
0.3
0.6
0.9
1.2
1.5
0 10 20 30 40 50 60 70 80 90+ 0
0.3
0.6
0.9
1.2
1.5
0 10 20 30 40 50 60 70 80 90+ 0
0.3
0.6
0.9
1.2
1.5
0 10 20 30 40 50 60 70 80 90+ 0
0.3
0.6
0.9
1.2
1.5
0 10 20 30 40 50 60 70 80 90+
India, 2004
Nigeria, 2004
Kenya, 1994
0
0.3
0.6
0.9
1.2
1.5
0 10 20 30 40 50 60 70 80 90+ 0
0.3
0.6
0.9
1.2
1.5
0 10 20 30 40 50 60 70 80 90+ 0
0.3
0.6
0.9
1.2
1.5
0 10 20 30 40 50 60 70 80 90+
0
1
2
1 11 21 31 41 51 61 71 81 91
YL
C
CF
CG
Source: Tung (2011)

Age Reallocation System
• Age reallocation system is the counterpart of the economic lifecycle
• Economic system that shifts resources from one age group to another.
• Accounting: Fills the gap between consumption and labor income (flow constraint).
• All reallocations fall in two broad classes – Transfers
• Public transfers (cash and in-kind)
• Private transfers (familial including intra-household)
– Asset-based reallocations
• Asset income
• Saving

The NTA Flow Account Identity
• Inflows
– Labor Income
– Asset Income
– Transfer Inflows
• Outflows
– Consumption
– Saving
– Transfer Outflows
Inflows Outflows
( ) ( ) ( ) ( ) ( ) ( )l aY x Y x x C x S x x
Lifecycle Deficit Net Transfers Asset-based Reallocations
Age Reallocations
( ) ( ) ( ) ( ) ( ) ( )l aC x Y x x x Y x S x
where x is age.

Components of Lifecycle Deficit, US 2003
-30000
-20000
-10000
0
10000
20000
30000
40000
50000
60000
70000
0 3 6 9 12 15 18 21 24 27 30 33 36 39 42 45 48 51 54 57 60 63 66 69 72 75 78 81 84 87 90
Age
US
$
Public Asset-Based Reallocations
Private Asset-Based Reallocations
Public Transfers
Private Transfers
Funding the Child Deficit
Net public transfers – public
schools, value of public
goods allocated to children.
Net private transfers – intra-
household transfers to
children; largest in all
countries studied.
Asset-based flows – none for
children, small for young
adults (mostly credit).
Source: NTA

Components of Lifecycle Deficit, US 2003
-30000
-20000
-10000
0
10000
20000
30000
40000
50000
60000
70000
0 3 6 9 12 15 18 21 24 27 30 33 36 39 42 45 48 51 54 57 60 63 66 69 72 75 78 81 84 87 90
Age
US
$
Public Asset-Based Reallocations
Private Asset-Based Reallocations
Public Transfers
Private Transfers
Funding the Old-age Deficit
Asset-based reallocations –
asset income and dis-saving
from owner-occupied
housing, private pension
funds, personal saving, etc.
Net public transfers – social
programs (public pensions,
health care, etc.), benefits
from general programs, less
taxes paid.
Net private transfers – inter-
and intra-household
transfers.
Source: NTA

Nigeria age profiles, 2004 and 2009
Source: NTA
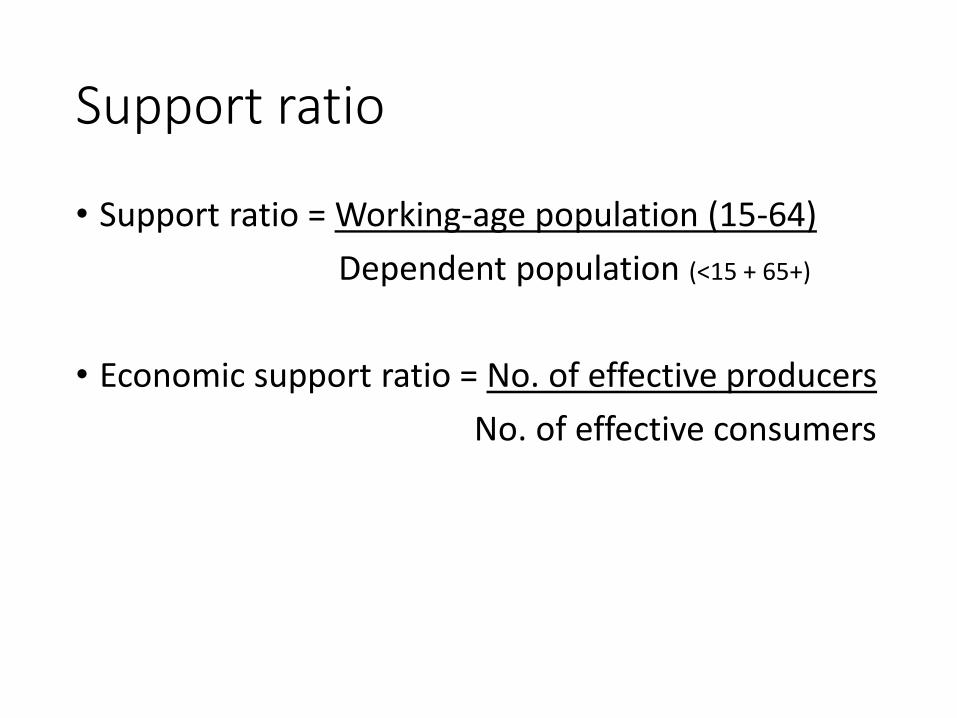
Support ratio
• Support ratio = Working-age population (15-64)
Dependent population (<15 + 65+)
• Economic support ratio = No. of effective producers
No. of effective consumers

Comparing the two for Nigeria
0.3
0.35
0.4
0.45
0.5
0.55
0.6
0.65
1950 2000 2050 2100
Economic Support Ratio
0.8
1.2
1.6
2
2.4
1950 2000 2050 2100
Support Ratio

Mechanical and behavioral sources of potential growth
Source: NTA manual

First and second dividend in Nigeria
Source: Mason, Lee, Jiang (2015)

DemDiv: Demographic sub-model
Source: DemDiv technical guide

DemDiv: Economic sub-model
Source: DemDiv technical guide

Source: DemDiv

DemDiv: Kenya example
Source: DemDiv

DemDiv: Kenya example
Source: DemDiv

DemDiv: Kenya example
Source: DemDiv

DemDiv: Kenya and Uganda output
• Kenya • Uganda Vision 2040
Source: DemDiv briefs
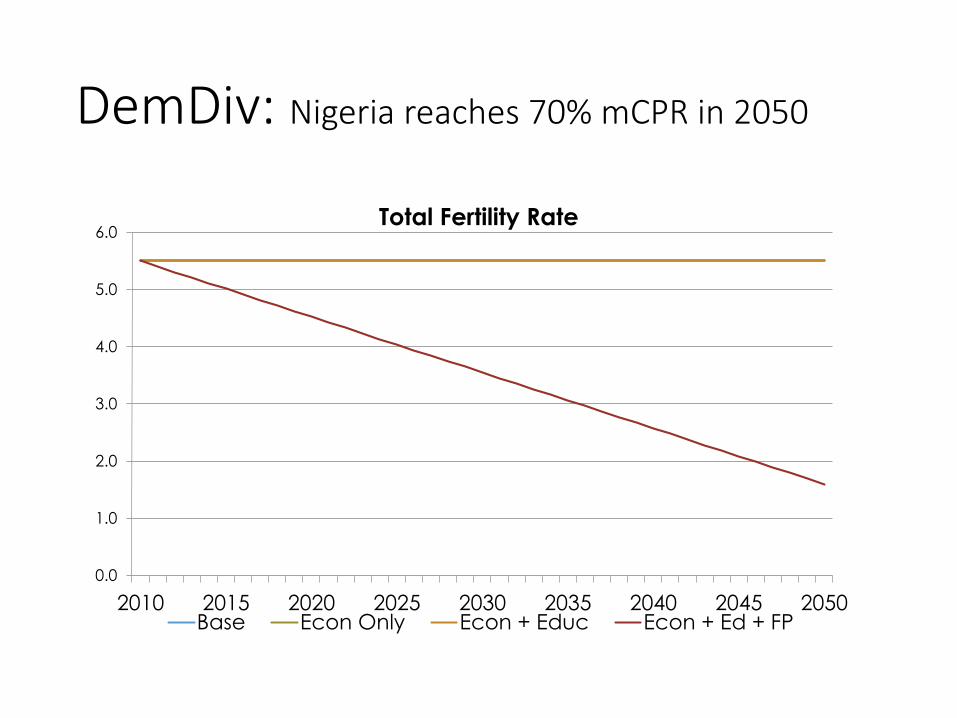
DemDiv: Nigeria reaches 70% mCPR in 2050
0.0
1.0
2.0
3.0
4.0
5.0
6.0
2010 2015 2020 2025 2030 2035 2040 2045 2050
Total Fertility Rate
Base Econ Only Econ + Educ Econ + Ed + FP
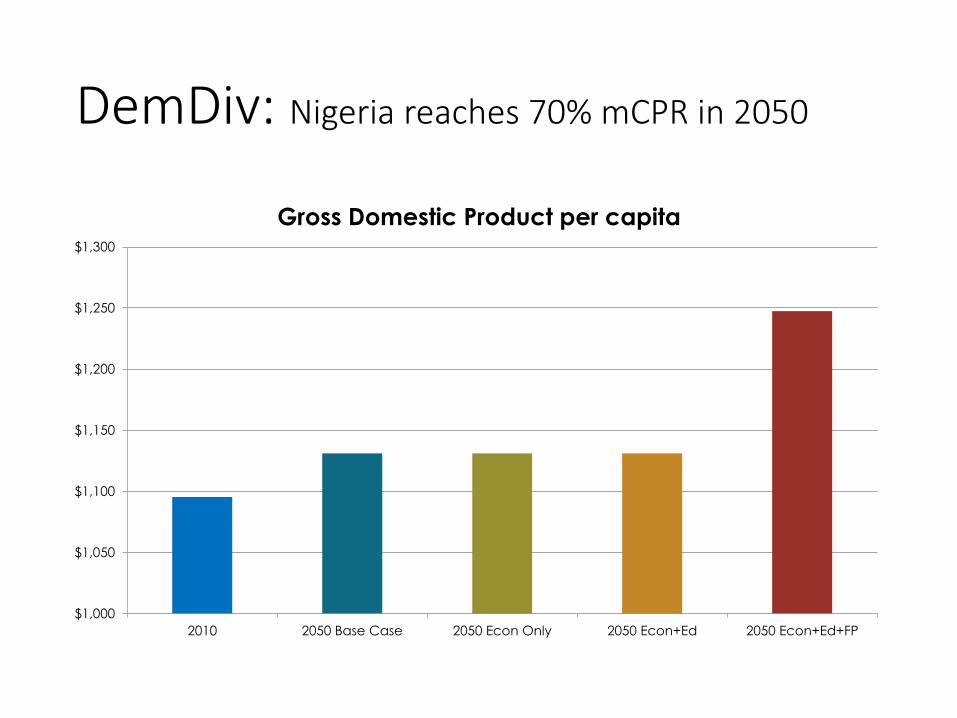
DemDiv: Nigeria reaches 70% mCPR in 2050
$1,000
$1,050
$1,100
$1,150
$1,200
$1,250
$1,300
2010 2050 Base Case 2050 Econ Only 2050 Econ+Ed 2050 Econ+Ed+FP
Gross Domestic Product per capita

DemDiv
• intended for practical use with concrete policy levers and connections
• relationships “stylized” from cross-country regressions
• policy variables for econ, education, and FP distinct and separate, so no dynamic feedback loops incorporated

CKW: Full model of production
Source: CKW (2015)

CKW: Micro-founded relationships
Source: CKW (2015)
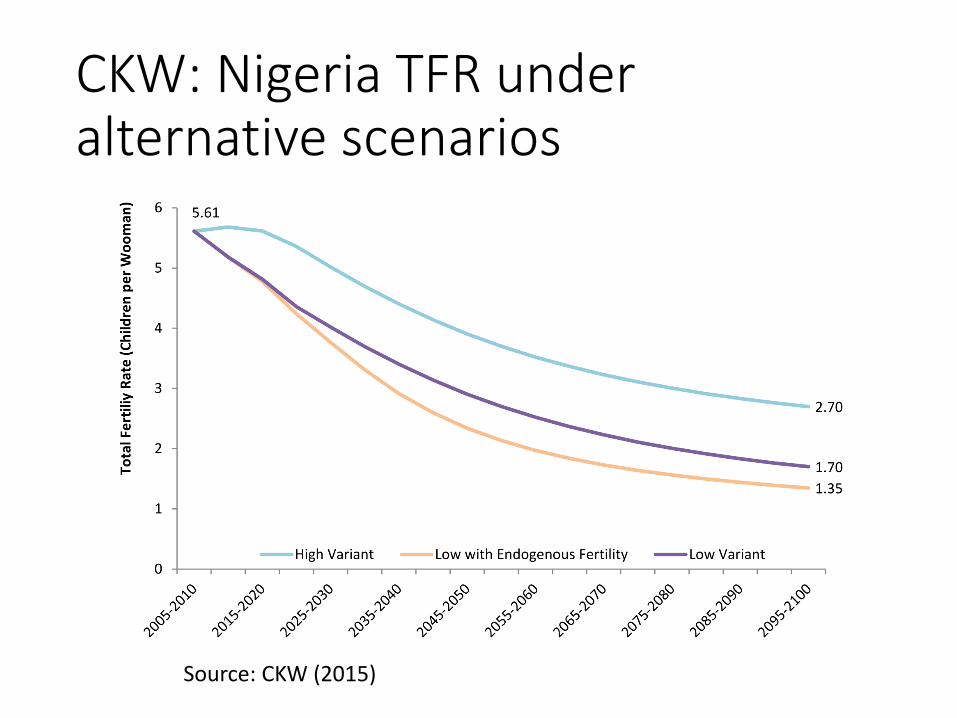
CKW: Nigeria TFR under alternative scenarios
Source: CKW (2015)

CKW: Nigeria population projected under alternative scenarios
Source: CKW (2015)

CKW: Simulated income per capita
Source: CKW (2015)

CKW: Female employment
Source: CKW (2015)
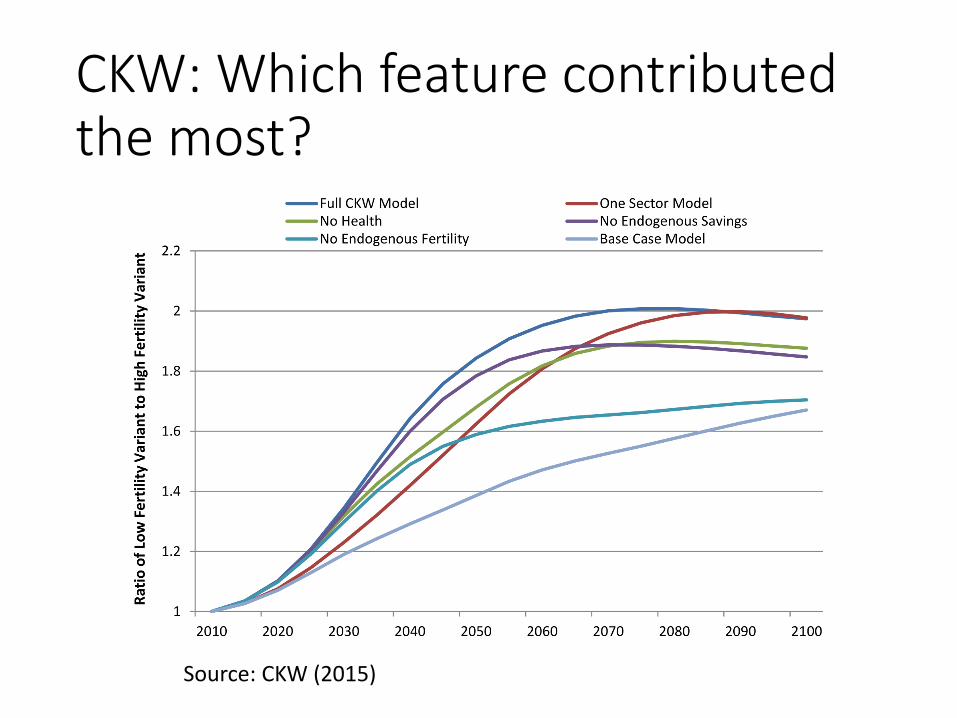
CKW: Which feature contributed the most?
Source: CKW (2015)

Summary
• NTA: support ratio a refinement of dependency ratio
• DemDiv: macro-based simulation model, policy-oriented
• CKW: micro-founded simulation model
• Schultz's take• micro experiments along the lines of Matlab
• DD benefits course through changes in time allocation/economic activity of women
• also health and productivity gains of women and their children

Summary (2)
• Complicated endeavor because of complexity involved
• Approaches highlight different features• NTA: economic lifecycle, support system; a bit static
• CKW: structural model showing channels and mechanisms; with dynamic feedback loops
• DemDiv: ease of use and relevance to policymakers
Questions/issues to be raised
• Need for system-level understanding of the economic and demographic forces that are at play
• Things change slowly, but compounding magnifies any initial change
• How does this modeling relate to the often-mentioned assertion that context-specific policies are needed to realize the DD?