dp03 selected economic characteristics 2011-2013 american …
TRANSCRIPT

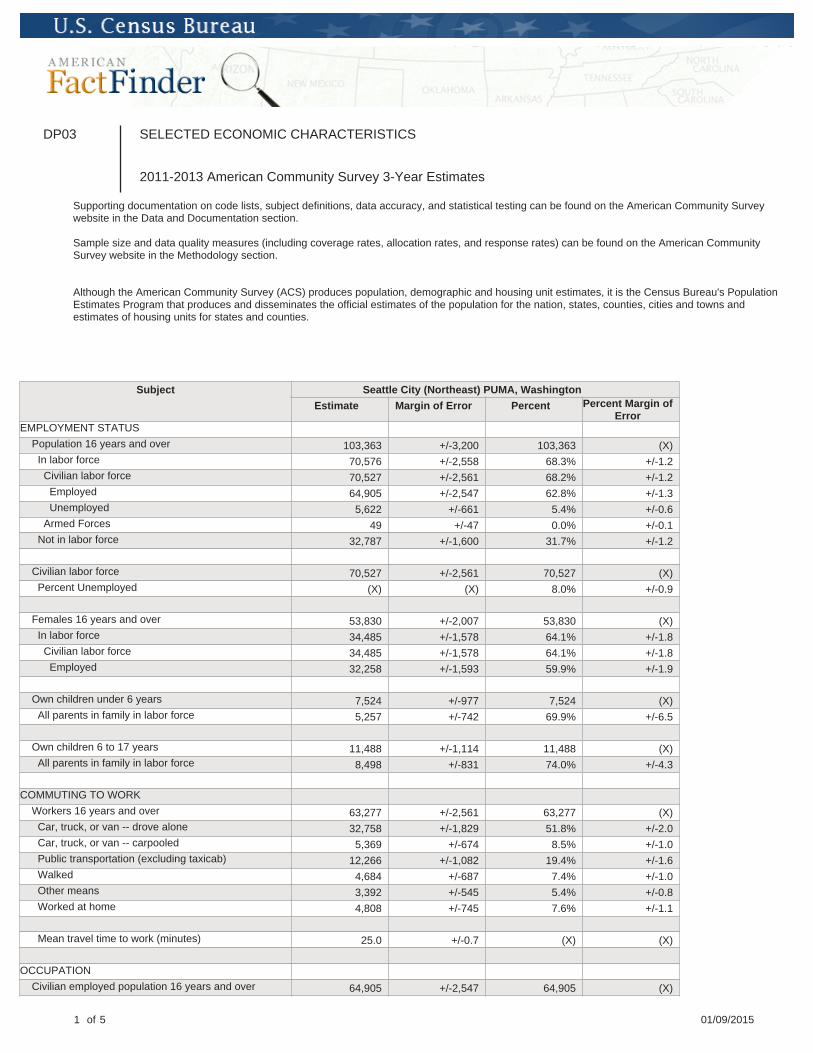
DP03 SELECTED ECONOMIC CHARACTERISTICS
2011-2013 American Community Survey 3-Year Estimates
Supporting documentation on code lists, subject definitions, data accuracy, and statistical testing can be found on the American Community Surveywebsite in the Data and Documentation section.
Sample size and data quality measures (including coverage rates, allocation rates, and response rates) can be found on the American CommunitySurvey website in the Methodology section.
Although the American Community Survey (ACS) produces population, demographic and housing unit estimates, it is the Census Bureau's PopulationEstimates Program that produces and disseminates the official estimates of the population for the nation, states, counties, cities and towns andestimates of housing units for states and counties.
Subject Seattle city, Washington
Estimate Margin of Error Percent Percent Margin ofError
EMPLOYMENT STATUS
Population 16 years and over 544,732 +/-2,302 544,732 (X) In labor force 394,495 +/-3,014 72.4% +/-0.4 Civilian labor force 393,184 +/-3,073 72.2% +/-0.5 Employed 368,199 +/-3,504 67.6% +/-0.5 Unemployed 24,985 +/-1,702 4.6% +/-0.3 Armed Forces 1,311 +/-322 0.2% +/-0.1 Not in labor force 150,237 +/-2,510 27.6% +/-0.4
Civilian labor force 393,184 +/-3,073 393,184 (X) Percent Unemployed (X) (X) 6.4% +/-0.4
Females 16 years and over 274,999 +/-2,515 274,999 (X) In labor force 187,403 +/-2,487 68.1% +/-0.7 Civilian labor force 187,226 +/-2,475 68.1% +/-0.7 Employed 176,320 +/-2,704 64.1% +/-0.8
Own children under 6 years 38,575 +/-1,428 38,575 (X) All parents in family in labor force 25,070 +/-1,597 65.0% +/-3.3
Own children 6 to 17 years 58,277 +/-2,188 58,277 (X) All parents in family in labor force 42,629 +/-2,179 73.1% +/-2.4
COMMUTING TO WORK
Workers 16 years and over 361,163 +/-3,533 361,163 (X) Car, truck, or van -- drove alone 184,349 +/-3,531 51.0% +/-0.8 Car, truck, or van -- carpooled 30,882 +/-1,804 8.6% +/-0.5 Public transportation (excluding taxicab) 69,979 +/-2,639 19.4% +/-0.7 Walked 33,500 +/-2,083 9.3% +/-0.6 Other means 18,231 +/-1,293 5.0% +/-0.4 Worked at home 24,222 +/-1,444 6.7% +/-0.4
Mean travel time to work (minutes) 25.8 +/-0.4 (X) (X)
OCCUPATION
Civilian employed population 16 years and over 368,199 +/-3,504 368,199 (X)
1 of 5 01/09/2015

Subject Seattle city, Washington
Estimate Margin of Error Percent Percent Margin ofError
Management, business, science, and artsoccupations
203,340 +/-3,661 55.2% +/-1.0
Service occupations 59,720 +/-3,297 16.2% +/-0.8 Sales and office occupations 71,088 +/-2,795 19.3% +/-0.7 Natural resources, construction, and maintenanceoccupations
12,619 +/-1,390 3.4% +/-0.4
Production, transportation, and material movingoccupations
21,432 +/-1,228 5.8% +/-0.3
INDUSTRY
Civilian employed population 16 years and over 368,199 +/-3,504 368,199 (X) Agriculture, forestry, fishing and hunting, and mining 1,639 +/-418 0.4% +/-0.1
Construction 10,938 +/-1,063 3.0% +/-0.3 Manufacturing 25,757 +/-1,425 7.0% +/-0.4 Wholesale trade 7,283 +/-774 2.0% +/-0.2 Retail trade 41,073 +/-2,192 11.2% +/-0.6 Transportation and warehousing, and utilities 10,989 +/-1,152 3.0% +/-0.3 Information 14,492 +/-1,005 3.9% +/-0.3 Finance and insurance, and real estate and rentaland leasing
21,859 +/-1,327 5.9% +/-0.4
Professional, scientific, and management, andadministrative and waste management services
72,541 +/-2,538 19.7% +/-0.7
Educational services, and health care and socialassistance
87,812 +/-2,494 23.8% +/-0.7
Arts, entertainment, and recreation, andaccommodation and food services
42,689 +/-2,652 11.6% +/-0.7
Other services, except public administration 18,996 +/-1,269 5.2% +/-0.3 Public administration 12,131 +/-1,024 3.3% +/-0.3
CLASS OF WORKER
Civilian employed population 16 years and over 368,199 +/-3,504 368,199 (X) Private wage and salary workers 292,489 +/-4,216 79.4% +/-0.7 Government workers 51,987 +/-2,097 14.1% +/-0.6 Self-employed in own not incorporated businessworkers
23,183 +/-1,369 6.3% +/-0.4
Unpaid family workers 540 +/-274 0.1% +/-0.1
INCOME AND BENEFITS (IN 2013 INFLATION-ADJUSTED DOLLARS) Total households 289,153 +/-1,972 289,153 (X) Less than $10,000 23,637 +/-1,490 8.2% +/-0.5 $10,000 to $14,999 11,720 +/-943 4.1% +/-0.3 $15,000 to $24,999 21,569 +/-1,415 7.5% +/-0.5 $25,000 to $34,999 23,607 +/-1,453 8.2% +/-0.5 $35,000 to $49,999 32,650 +/-1,594 11.3% +/-0.5 $50,000 to $74,999 47,473 +/-2,178 16.4% +/-0.7 $75,000 to $99,999 35,239 +/-1,486 12.2% +/-0.5 $100,000 to $149,999 45,435 +/-1,831 15.7% +/-0.6 $150,000 to $199,999 21,656 +/-1,338 7.5% +/-0.5 $200,000 or more 26,167 +/-1,206 9.0% +/-0.4 Median household income (dollars) 65,454 +/-1,353 (X) (X) Mean household income (dollars) 92,113 +/-1,640 (X) (X)
With earnings 239,373 +/-1,919 82.8% +/-0.4 Mean earnings (dollars) 94,192 +/-1,775 (X) (X) With Social Security 56,238 +/-1,461 19.4% +/-0.5 Mean Social Security income (dollars) 17,063 +/-371 (X) (X) With retirement income 32,253 +/-1,252 11.2% +/-0.4 Mean retirement income (dollars) 28,766 +/-2,269 (X) (X)
With Supplemental Security Income 10,898 +/-1,086 3.8% +/-0.4 Mean Supplemental Security Income (dollars) 8,546 +/-456 (X) (X) With cash public assistance income 9,840 +/-861 3.4% +/-0.3
2 of 5 01/09/2015

Subject Seattle city, Washington
Estimate Margin of Error Percent Percent Margin ofError
Mean cash public assistance income (dollars) 3,231 +/-383 (X) (X) With Food Stamp/SNAP benefits in the past 12months
31,076 +/-1,626 10.7% +/-0.6
Families 127,803 +/-2,333 127,803 (X) Less than $10,000 4,884 +/-717 3.8% +/-0.6 $10,000 to $14,999 2,929 +/-525 2.3% +/-0.4 $15,000 to $24,999 5,621 +/-727 4.4% +/-0.6 $25,000 to $34,999 6,874 +/-936 5.4% +/-0.7 $35,000 to $49,999 10,986 +/-993 8.6% +/-0.8 $50,000 to $74,999 18,002 +/-1,254 14.1% +/-0.9 $75,000 to $99,999 16,738 +/-1,149 13.1% +/-0.9 $100,000 to $149,999 27,648 +/-1,337 21.6% +/-1.0 $150,000 to $199,999 14,437 +/-1,005 11.3% +/-0.8 $200,000 or more 19,684 +/-1,036 15.4% +/-0.8 Median family income (dollars) 96,251 +/-2,828 (X) (X) Mean family income (dollars) 125,141 +/-3,077 (X) (X)
Per capita income (dollars) 42,929 +/-803 (X) (X)
Nonfamily households 161,350 +/-2,546 161,350 (X) Median nonfamily income (dollars) 47,503 +/-1,415 (X) (X) Mean nonfamily income (dollars) 63,568 +/-1,717 (X) (X)
Median earnings for workers (dollars) 39,059 +/-1,097 (X) (X) Median earnings for male full-time, year-round workers(dollars)
63,554 +/-1,991 (X) (X)
Median earnings for female full-time, year-roundworkers (dollars)
51,711 +/-803 (X) (X)
HEALTH INSURANCE COVERAGE
Civilian noninstitutionalized population 630,183 +/-540 630,183 (X) With health insurance coverage 558,122 +/-3,287 88.6% +/-0.5 With private health insurance 482,864 +/-4,799 76.6% +/-0.8 With public coverage 129,690 +/-4,303 20.6% +/-0.7 No health insurance coverage 72,061 +/-3,316 11.4% +/-0.5
Civilian noninstitutionalized population under 18years
100,205 +/-2,321 100,205 (X)
No health insurance coverage 4,926 +/-1,071 4.9% +/-1.0
Civilian noninstitutionalized population 18 to 64 years 460,095 +/-2,533 460,095 (X)
In labor force: 378,348 +/-3,086 378,348 (X) Employed: 354,588 +/-3,444 354,588 (X) With health insurance coverage 310,324 +/-3,585 87.5% +/-0.7 With private health insurance 302,535 +/-3,659 85.3% +/-0.7 With public coverage 13,020 +/-1,550 3.7% +/-0.4 No health insurance coverage 44,264 +/-2,608 12.5% +/-0.7 Unemployed: 23,760 +/-1,605 23,760 (X) With health insurance coverage 14,473 +/-1,218 60.9% +/-3.6 With private health insurance 11,626 +/-1,041 48.9% +/-3.8 With public coverage 3,334 +/-676 14.0% +/-2.5 No health insurance coverage 9,287 +/-1,114 39.1% +/-3.6 Not in labor force: 81,747 +/-2,130 81,747 (X) With health insurance coverage 68,714 +/-1,948 84.1% +/-1.2 With private health insurance 50,437 +/-2,048 61.7% +/-2.1 With public coverage 21,707 +/-1,628 26.6% +/-1.9 No health insurance coverage 13,033 +/-1,106 15.9% +/-1.2
3 of 5 01/09/2015
Subject Seattle city, Washington
Estimate Margin of Error Percent Percent Margin ofError
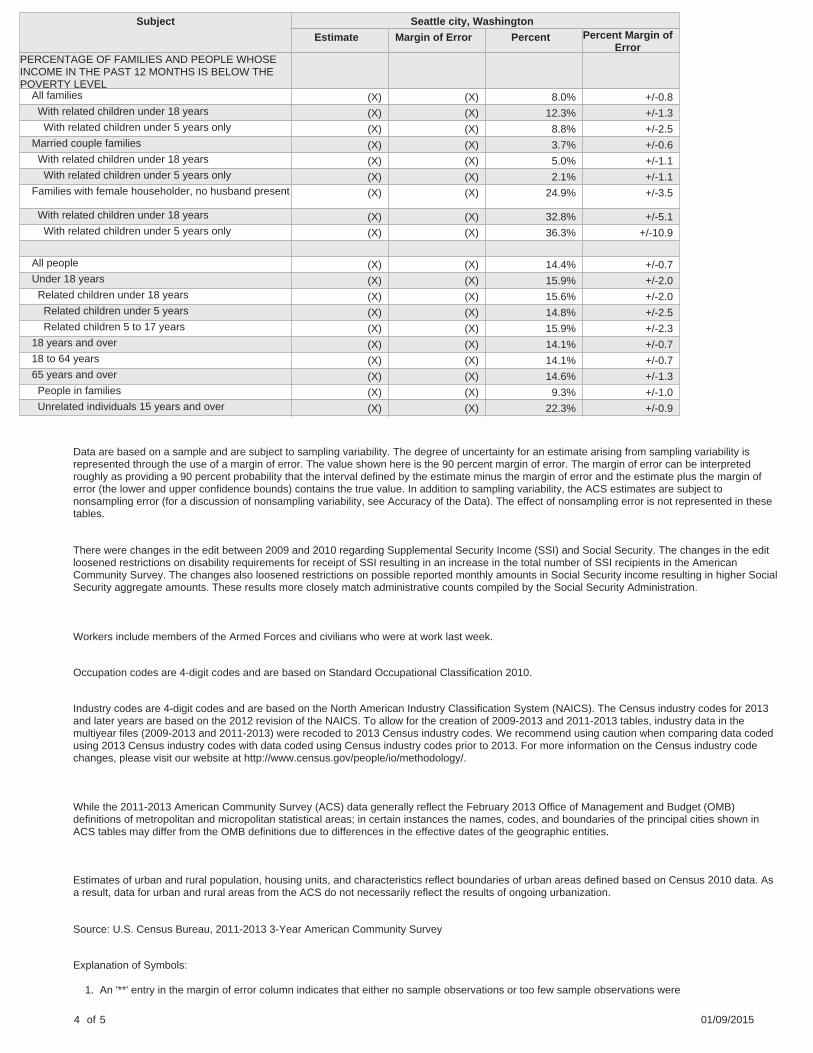
PERCENTAGE OF FAMILIES AND PEOPLE WHOSEINCOME IN THE PAST 12 MONTHS IS BELOW THEPOVERTY LEVEL All families (X) (X) 8.0% +/-0.8 With related children under 18 years (X) (X) 12.3% +/-1.3 With related children under 5 years only (X) (X) 8.8% +/-2.5 Married couple families (X) (X) 3.7% +/-0.6 With related children under 18 years (X) (X) 5.0% +/-1.1 With related children under 5 years only (X) (X) 2.1% +/-1.1 Families with female householder, no husband present (X) (X) 24.9% +/-3.5
With related children under 18 years (X) (X) 32.8% +/-5.1 With related children under 5 years only (X) (X) 36.3% +/-10.9
All people (X) (X) 14.4% +/-0.7 Under 18 years (X) (X) 15.9% +/-2.0 Related children under 18 years (X) (X) 15.6% +/-2.0 Related children under 5 years (X) (X) 14.8% +/-2.5 Related children 5 to 17 years (X) (X) 15.9% +/-2.3 18 years and over (X) (X) 14.1% +/-0.7 18 to 64 years (X) (X) 14.1% +/-0.7 65 years and over (X) (X) 14.6% +/-1.3 People in families (X) (X) 9.3% +/-1.0 Unrelated individuals 15 years and over (X) (X) 22.3% +/-0.9
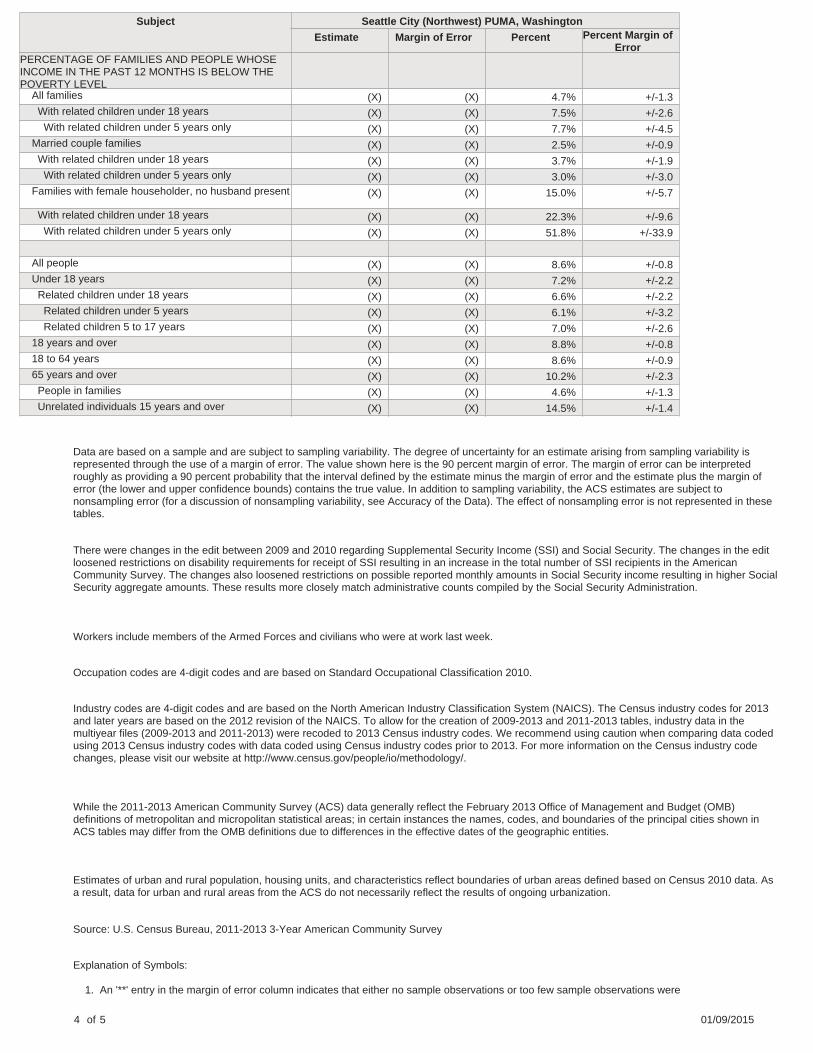
Data are based on a sample and are subject to sampling variability. The degree of uncertainty for an estimate arising from sampling variability isrepresented through the use of a margin of error. The value shown here is the 90 percent margin of error. The margin of error can be interpretedroughly as providing a 90 percent probability that the interval defined by the estimate minus the margin of error and the estimate plus the margin oferror (the lower and upper confidence bounds) contains the true value. In addition to sampling variability, the ACS estimates are subject tononsampling error (for a discussion of nonsampling variability, see Accuracy of the Data). The effect of nonsampling error is not represented in thesetables.
There were changes in the edit between 2009 and 2010 regarding Supplemental Security Income (SSI) and Social Security. The changes in the editloosened restrictions on disability requirements for receipt of SSI resulting in an increase in the total number of SSI recipients in the AmericanCommunity Survey. The changes also loosened restrictions on possible reported monthly amounts in Social Security income resulting in higher SocialSecurity aggregate amounts. These results more closely match administrative counts compiled by the Social Security Administration.
Workers include members of the Armed Forces and civilians who were at work last week.
Occupation codes are 4-digit codes and are based on Standard Occupational Classification 2010.
Industry codes are 4-digit codes and are based on the North American Industry Classification System (NAICS). The Census industry codes for 2013and later years are based on the 2012 revision of the NAICS. To allow for the creation of 2009-2013 and 2011-2013 tables, industry data in themultiyear files (2009-2013 and 2011-2013) were recoded to 2013 Census industry codes. We recommend using caution when comparing data codedusing 2013 Census industry codes with data coded using Census industry codes prior to 2013. For more information on the Census industry codechanges, please visit our website at http://www.census.gov/people/io/methodology/.
While the 2011-2013 American Community Survey (ACS) data generally reflect the February 2013 Office of Management and Budget (OMB)definitions of metropolitan and micropolitan statistical areas; in certain instances the names, codes, and boundaries of the principal cities shown inACS tables may differ from the OMB definitions due to differences in the effective dates of the geographic entities.
Estimates of urban and rural population, housing units, and characteristics reflect boundaries of urban areas defined based on Census 2010 data. Asa result, data for urban and rural areas from the ACS do not necessarily reflect the results of ongoing urbanization.
Source: U.S. Census Bureau, 2011-2013 3-Year American Community Survey
Explanation of Symbols:
1. An '**' entry in the margin of error column indicates that either no sample observations or too few sample observations were
4 of 5 01/09/2015

available to compute a standard error and thus the margin of error. A statistical test is not appropriate. 2. An '-' entry in the estimate column indicates that either no sample observations or too few sample observations were available to compute anestimate, or a ratio of medians cannot be calculated because one or both of the median estimates falls in the lowest interval or upper interval of anopen-ended distribution. 3. An '-' following a median estimate means the median falls in the lowest interval of an open-ended distribution. 4. An '+' following a median estimate means the median falls in the upper interval of an open-ended distribution. 5. An '***' entry in the margin of error column indicates that the median falls in the lowest interval or upper interval of an open-ended distribution. Astatistical test is not appropriate. 6. An '*****' entry in the margin of error column indicates that the estimate is controlled. A statistical test for sampling variability is not appropriate. 7. An 'N' entry in the estimate and margin of error columns indicates that data for this geographic area cannot be displayed because the number ofsample cases is too small. 8. An '(X)' means that the estimate is not applicable or not available.

DP03 SELECTED ECONOMIC CHARACTERISTICS
2011-2013 American Community Survey 3-Year Estimates
Supporting documentation on code lists, subject definitions, data accuracy, and statistical testing can be found on the American Community Surveywebsite in the Data and Documentation section.
Sample size and data quality measures (including coverage rates, allocation rates, and response rates) can be found on the American CommunitySurvey website in the Methodology section.
Although the American Community Survey (ACS) produces population, demographic and housing unit estimates, it is the Census Bureau's PopulationEstimates Program that produces and disseminates the official estimates of the population for the nation, states, counties, cities and towns andestimates of housing units for states and counties.
Subject Seattle City (Downtown)--Queen Anne & Magnolia PUMA, Washington
Estimate Margin of Error Percent Percent Margin ofError
EMPLOYMENT STATUS
Population 16 years and over 115,789 +/-3,669 115,789 (X) In labor force 85,571 +/-3,177 73.9% +/-1.4 Civilian labor force 85,045 +/-3,180 73.4% +/-1.4 Employed 80,806 +/-3,173 69.8% +/-1.5 Unemployed 4,239 +/-740 3.7% +/-0.6 Armed Forces 526 +/-180 0.5% +/-0.2 Not in labor force 30,218 +/-1,837 26.1% +/-1.4
Civilian labor force 85,045 +/-3,180 85,045 (X) Percent Unemployed (X) (X) 5.0% +/-0.9
Females 16 years and over 54,145 +/-2,450 54,145 (X) In labor force 38,554 +/-2,000 71.2% +/-1.8 Civilian labor force 38,491 +/-1,999 71.1% +/-1.8 Employed 36,652 +/-2,021 67.7% +/-2.0
Own children under 6 years 4,233 +/-772 4,233 (X) All parents in family in labor force 2,825 +/-588 66.7% +/-9.1
Own children 6 to 17 years 6,100 +/-869 6,100 (X) All parents in family in labor force 4,691 +/-741 76.9% +/-6.5
COMMUTING TO WORK
Workers 16 years and over 80,116 +/-3,034 80,116 (X) Car, truck, or van -- drove alone 33,890 +/-2,233 42.3% +/-2.1 Car, truck, or van -- carpooled 4,459 +/-874 5.6% +/-1.1 Public transportation (excluding taxicab) 16,699 +/-1,596 20.8% +/-1.8 Walked 16,801 +/-1,449 21.0% +/-1.7 Other means 3,581 +/-765 4.5% +/-0.9 Worked at home 4,686 +/-564 5.8% +/-0.7
Mean travel time to work (minutes) 23.5 +/-0.7 (X) (X)
OCCUPATION
1 of 5 01/09/2015
Subject Seattle City (Downtown)--Queen Anne & Magnolia PUMA, Washington
Estimate Margin of Error Percent Percent Margin ofError
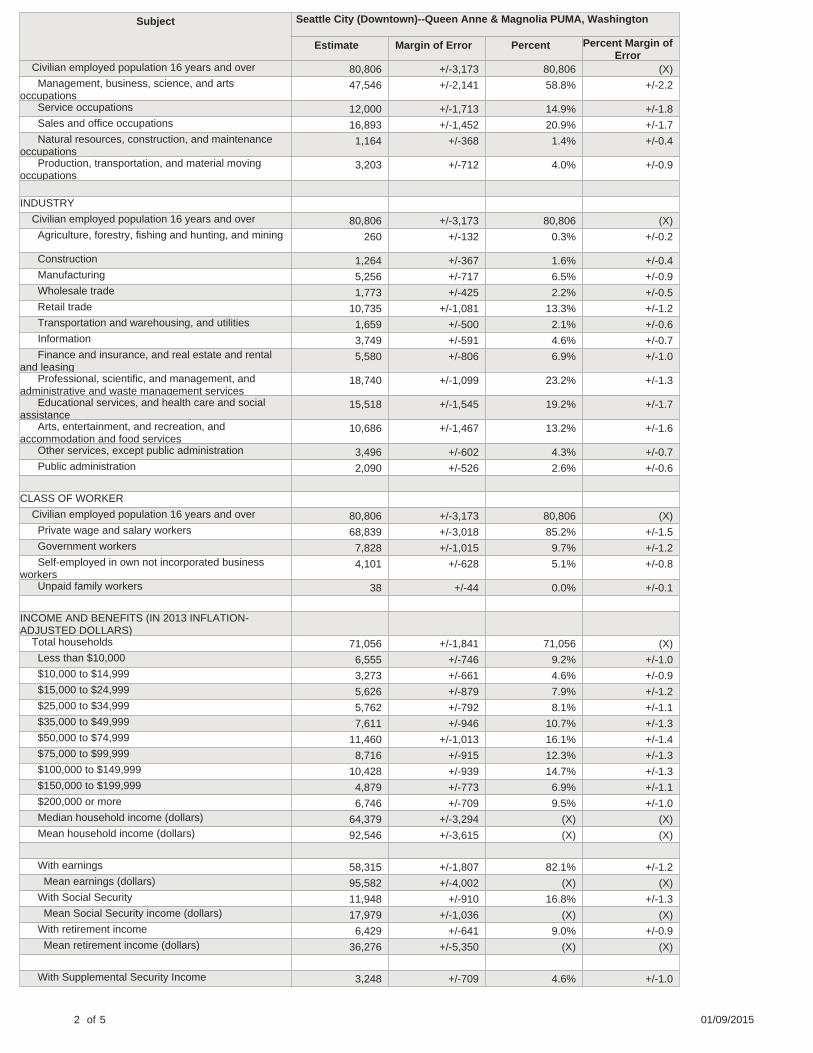
Civilian employed population 16 years and over 80,806 +/-3,173 80,806 (X) Management, business, science, and artsoccupations
47,546 +/-2,141 58.8% +/-2.2
Service occupations 12,000 +/-1,713 14.9% +/-1.8 Sales and office occupations 16,893 +/-1,452 20.9% +/-1.7 Natural resources, construction, and maintenanceoccupations
1,164 +/-368 1.4% +/-0.4
Production, transportation, and material movingoccupations
3,203 +/-712 4.0% +/-0.9
INDUSTRY
Civilian employed population 16 years and over 80,806 +/-3,173 80,806 (X) Agriculture, forestry, fishing and hunting, and mining 260 +/-132 0.3% +/-0.2
Construction 1,264 +/-367 1.6% +/-0.4 Manufacturing 5,256 +/-717 6.5% +/-0.9 Wholesale trade 1,773 +/-425 2.2% +/-0.5 Retail trade 10,735 +/-1,081 13.3% +/-1.2 Transportation and warehousing, and utilities 1,659 +/-500 2.1% +/-0.6 Information 3,749 +/-591 4.6% +/-0.7 Finance and insurance, and real estate and rentaland leasing
5,580 +/-806 6.9% +/-1.0
Professional, scientific, and management, andadministrative and waste management services
18,740 +/-1,099 23.2% +/-1.3
Educational services, and health care and socialassistance
15,518 +/-1,545 19.2% +/-1.7
Arts, entertainment, and recreation, andaccommodation and food services
10,686 +/-1,467 13.2% +/-1.6
Other services, except public administration 3,496 +/-602 4.3% +/-0.7 Public administration 2,090 +/-526 2.6% +/-0.6
CLASS OF WORKER
Civilian employed population 16 years and over 80,806 +/-3,173 80,806 (X) Private wage and salary workers 68,839 +/-3,018 85.2% +/-1.5 Government workers 7,828 +/-1,015 9.7% +/-1.2 Self-employed in own not incorporated businessworkers
4,101 +/-628 5.1% +/-0.8
Unpaid family workers 38 +/-44 0.0% +/-0.1
INCOME AND BENEFITS (IN 2013 INFLATION-ADJUSTED DOLLARS) Total households 71,056 +/-1,841 71,056 (X) Less than $10,000 6,555 +/-746 9.2% +/-1.0 $10,000 to $14,999 3,273 +/-661 4.6% +/-0.9 $15,000 to $24,999 5,626 +/-879 7.9% +/-1.2 $25,000 to $34,999 5,762 +/-792 8.1% +/-1.1 $35,000 to $49,999 7,611 +/-946 10.7% +/-1.3 $50,000 to $74,999 11,460 +/-1,013 16.1% +/-1.4 $75,000 to $99,999 8,716 +/-915 12.3% +/-1.3 $100,000 to $149,999 10,428 +/-939 14.7% +/-1.3 $150,000 to $199,999 4,879 +/-773 6.9% +/-1.1 $200,000 or more 6,746 +/-709 9.5% +/-1.0 Median household income (dollars) 64,379 +/-3,294 (X) (X) Mean household income (dollars) 92,546 +/-3,615 (X) (X)
With earnings 58,315 +/-1,807 82.1% +/-1.2 Mean earnings (dollars) 95,582 +/-4,002 (X) (X) With Social Security 11,948 +/-910 16.8% +/-1.3 Mean Social Security income (dollars) 17,979 +/-1,036 (X) (X) With retirement income 6,429 +/-641 9.0% +/-0.9 Mean retirement income (dollars) 36,276 +/-5,350 (X) (X)
With Supplemental Security Income 3,248 +/-709 4.6% +/-1.0
2 of 5 01/09/2015
Subject Seattle City (Downtown)--Queen Anne & Magnolia PUMA, Washington
Estimate Margin of Error Percent Percent Margin ofError
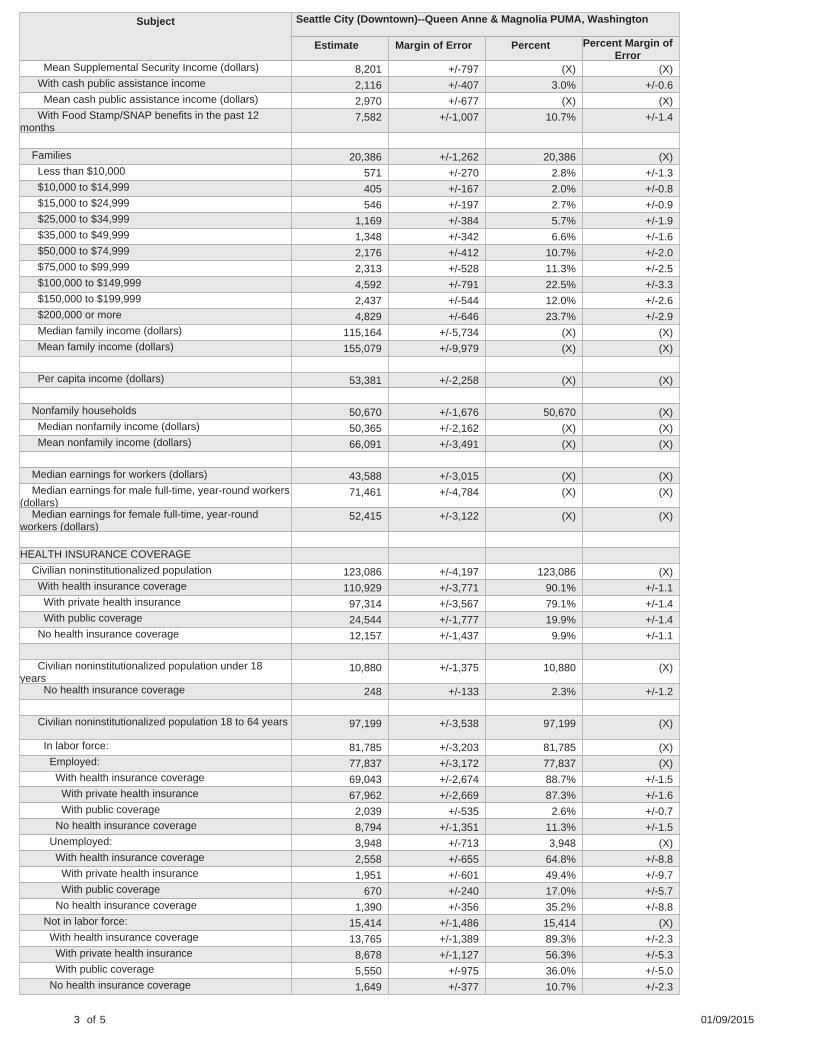
Mean Supplemental Security Income (dollars) 8,201 +/-797 (X) (X) With cash public assistance income 2,116 +/-407 3.0% +/-0.6 Mean cash public assistance income (dollars) 2,970 +/-677 (X) (X) With Food Stamp/SNAP benefits in the past 12months
7,582 +/-1,007 10.7% +/-1.4
Families 20,386 +/-1,262 20,386 (X) Less than $10,000 571 +/-270 2.8% +/-1.3 $10,000 to $14,999 405 +/-167 2.0% +/-0.8 $15,000 to $24,999 546 +/-197 2.7% +/-0.9 $25,000 to $34,999 1,169 +/-384 5.7% +/-1.9 $35,000 to $49,999 1,348 +/-342 6.6% +/-1.6 $50,000 to $74,999 2,176 +/-412 10.7% +/-2.0 $75,000 to $99,999 2,313 +/-528 11.3% +/-2.5 $100,000 to $149,999 4,592 +/-791 22.5% +/-3.3 $150,000 to $199,999 2,437 +/-544 12.0% +/-2.6 $200,000 or more 4,829 +/-646 23.7% +/-2.9 Median family income (dollars) 115,164 +/-5,734 (X) (X) Mean family income (dollars) 155,079 +/-9,979 (X) (X)
Per capita income (dollars) 53,381 +/-2,258 (X) (X)
Nonfamily households 50,670 +/-1,676 50,670 (X) Median nonfamily income (dollars) 50,365 +/-2,162 (X) (X) Mean nonfamily income (dollars) 66,091 +/-3,491 (X) (X)
Median earnings for workers (dollars) 43,588 +/-3,015 (X) (X) Median earnings for male full-time, year-round workers(dollars)
71,461 +/-4,784 (X) (X)
Median earnings for female full-time, year-roundworkers (dollars)
52,415 +/-3,122 (X) (X)
HEALTH INSURANCE COVERAGE
Civilian noninstitutionalized population 123,086 +/-4,197 123,086 (X) With health insurance coverage 110,929 +/-3,771 90.1% +/-1.1 With private health insurance 97,314 +/-3,567 79.1% +/-1.4 With public coverage 24,544 +/-1,777 19.9% +/-1.4 No health insurance coverage 12,157 +/-1,437 9.9% +/-1.1
Civilian noninstitutionalized population under 18years
10,880 +/-1,375 10,880 (X)
No health insurance coverage 248 +/-133 2.3% +/-1.2
Civilian noninstitutionalized population 18 to 64 years 97,199 +/-3,538 97,199 (X)
In labor force: 81,785 +/-3,203 81,785 (X) Employed: 77,837 +/-3,172 77,837 (X) With health insurance coverage 69,043 +/-2,674 88.7% +/-1.5 With private health insurance 67,962 +/-2,669 87.3% +/-1.6 With public coverage 2,039 +/-535 2.6% +/-0.7 No health insurance coverage 8,794 +/-1,351 11.3% +/-1.5 Unemployed: 3,948 +/-713 3,948 (X) With health insurance coverage 2,558 +/-655 64.8% +/-8.8 With private health insurance 1,951 +/-601 49.4% +/-9.7 With public coverage 670 +/-240 17.0% +/-5.7 No health insurance coverage 1,390 +/-356 35.2% +/-8.8 Not in labor force: 15,414 +/-1,486 15,414 (X) With health insurance coverage 13,765 +/-1,389 89.3% +/-2.3 With private health insurance 8,678 +/-1,127 56.3% +/-5.3 With public coverage 5,550 +/-975 36.0% +/-5.0 No health insurance coverage 1,649 +/-377 10.7% +/-2.3
3 of 5 01/09/2015
Subject Seattle City (Downtown)--Queen Anne & Magnolia PUMA, Washington
Estimate Margin of Error Percent Percent Margin ofError
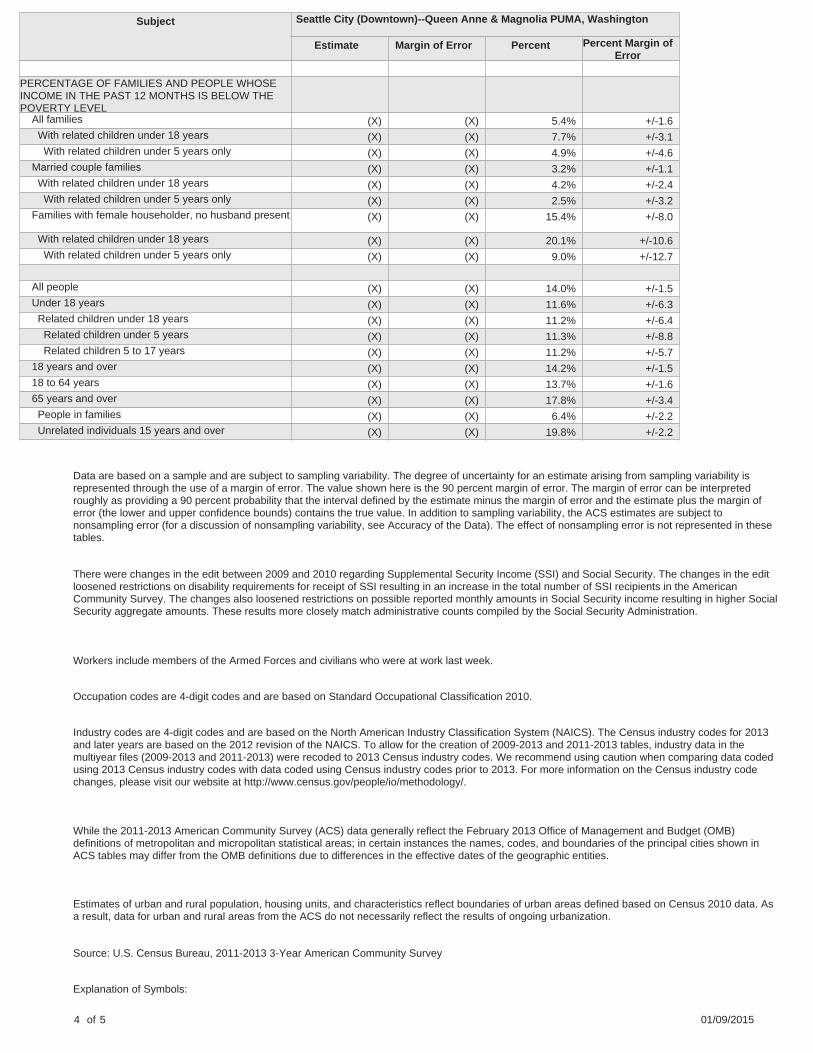
PERCENTAGE OF FAMILIES AND PEOPLE WHOSEINCOME IN THE PAST 12 MONTHS IS BELOW THEPOVERTY LEVEL All families (X) (X) 5.4% +/-1.6 With related children under 18 years (X) (X) 7.7% +/-3.1 With related children under 5 years only (X) (X) 4.9% +/-4.6 Married couple families (X) (X) 3.2% +/-1.1 With related children under 18 years (X) (X) 4.2% +/-2.4 With related children under 5 years only (X) (X) 2.5% +/-3.2 Families with female householder, no husband present (X) (X) 15.4% +/-8.0
With related children under 18 years (X) (X) 20.1% +/-10.6 With related children under 5 years only (X) (X) 9.0% +/-12.7
All people (X) (X) 14.0% +/-1.5 Under 18 years (X) (X) 11.6% +/-6.3 Related children under 18 years (X) (X) 11.2% +/-6.4 Related children under 5 years (X) (X) 11.3% +/-8.8 Related children 5 to 17 years (X) (X) 11.2% +/-5.7 18 years and over (X) (X) 14.2% +/-1.5 18 to 64 years (X) (X) 13.7% +/-1.6 65 years and over (X) (X) 17.8% +/-3.4 People in families (X) (X) 6.4% +/-2.2 Unrelated individuals 15 years and over (X) (X) 19.8% +/-2.2
Data are based on a sample and are subject to sampling variability. The degree of uncertainty for an estimate arising from sampling variability isrepresented through the use of a margin of error. The value shown here is the 90 percent margin of error. The margin of error can be interpretedroughly as providing a 90 percent probability that the interval defined by the estimate minus the margin of error and the estimate plus the margin oferror (the lower and upper confidence bounds) contains the true value. In addition to sampling variability, the ACS estimates are subject tononsampling error (for a discussion of nonsampling variability, see Accuracy of the Data). The effect of nonsampling error is not represented in thesetables.
There were changes in the edit between 2009 and 2010 regarding Supplemental Security Income (SSI) and Social Security. The changes in the editloosened restrictions on disability requirements for receipt of SSI resulting in an increase in the total number of SSI recipients in the AmericanCommunity Survey. The changes also loosened restrictions on possible reported monthly amounts in Social Security income resulting in higher SocialSecurity aggregate amounts. These results more closely match administrative counts compiled by the Social Security Administration.
Workers include members of the Armed Forces and civilians who were at work last week.
Occupation codes are 4-digit codes and are based on Standard Occupational Classification 2010.
Industry codes are 4-digit codes and are based on the North American Industry Classification System (NAICS). The Census industry codes for 2013and later years are based on the 2012 revision of the NAICS. To allow for the creation of 2009-2013 and 2011-2013 tables, industry data in themultiyear files (2009-2013 and 2011-2013) were recoded to 2013 Census industry codes. We recommend using caution when comparing data codedusing 2013 Census industry codes with data coded using Census industry codes prior to 2013. For more information on the Census industry codechanges, please visit our website at http://www.census.gov/people/io/methodology/.
While the 2011-2013 American Community Survey (ACS) data generally reflect the February 2013 Office of Management and Budget (OMB)definitions of metropolitan and micropolitan statistical areas; in certain instances the names, codes, and boundaries of the principal cities shown inACS tables may differ from the OMB definitions due to differences in the effective dates of the geographic entities.
Estimates of urban and rural population, housing units, and characteristics reflect boundaries of urban areas defined based on Census 2010 data. Asa result, data for urban and rural areas from the ACS do not necessarily reflect the results of ongoing urbanization.
Source: U.S. Census Bureau, 2011-2013 3-Year American Community Survey
Explanation of Symbols:
4 of 5 01/09/2015
1. An '**' entry in the margin of error column indicates that either no sample observations or too few sample observations were available tocompute a standard error and thus the margin of error. A statistical test is not appropriate. 2. An '-' entry in the estimate column indicates that either no sample observations or too few sample observations were available to compute anestimate, or a ratio of medians cannot be calculated because one or both of the median estimates falls in the lowest interval or upper interval of anopen-ended distribution. 3. An '-' following a median estimate means the median falls in the lowest interval of an open-ended distribution. 4. An '+' following a median estimate means the median falls in the upper interval of an open-ended distribution. 5. An '***' entry in the margin of error column indicates that the median falls in the lowest interval or upper interval of an open-ended distribution. Astatistical test is not appropriate. 6. An '*****' entry in the margin of error column indicates that the estimate is controlled. A statistical test for sampling variability is not appropriate. 7. An 'N' entry in the estimate and margin of error columns indicates that data for this geographic area cannot be displayed because the number ofsample cases is too small. 8. An '(X)' means that the estimate is not applicable or not available.
DP03 SELECTED ECONOMIC CHARACTERISTICS
2011-2013 American Community Survey 3-Year Estimates
Supporting documentation on code lists, subject definitions, data accuracy, and statistical testing can be found on the American Community Surveywebsite in the Data and Documentation section.
Sample size and data quality measures (including coverage rates, allocation rates, and response rates) can be found on the American CommunitySurvey website in the Methodology section.
Although the American Community Survey (ACS) produces population, demographic and housing unit estimates, it is the Census Bureau's PopulationEstimates Program that produces and disseminates the official estimates of the population for the nation, states, counties, cities and towns andestimates of housing units for states and counties.
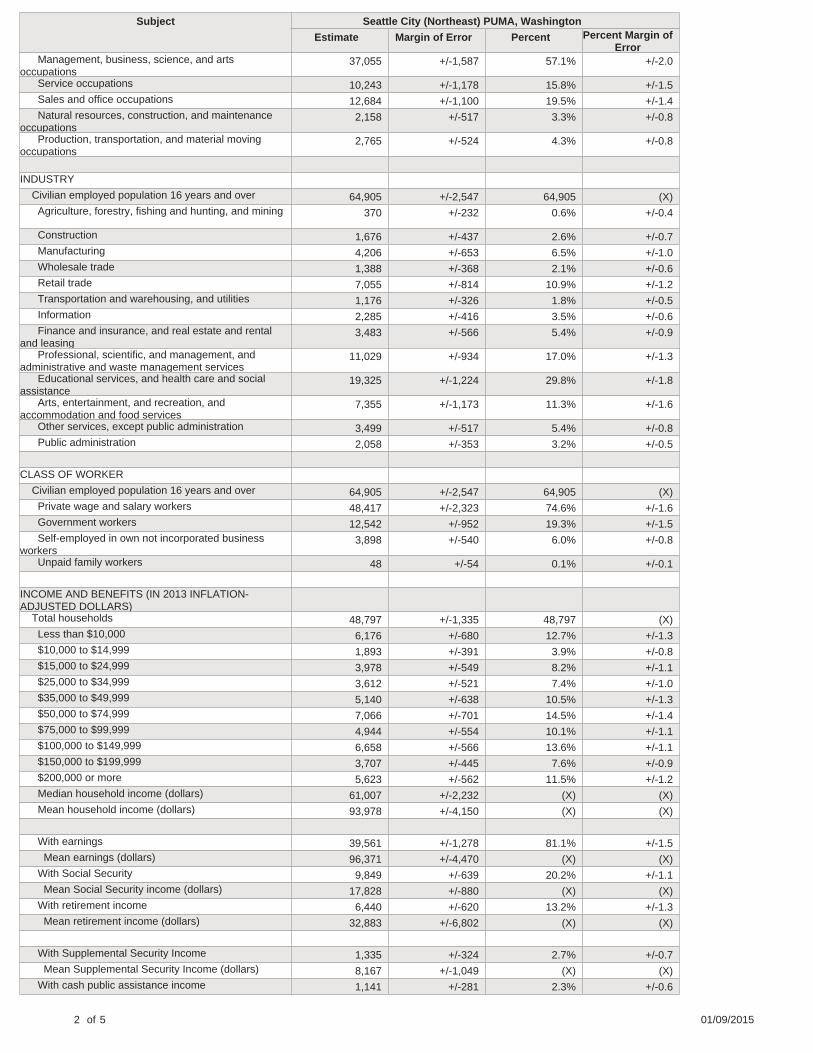
Subject Seattle City (Northeast) PUMA, Washington
Estimate Margin of Error Percent Percent Margin ofError
EMPLOYMENT STATUS
Population 16 years and over 103,363 +/-3,200 103,363 (X) In labor force 70,576 +/-2,558 68.3% +/-1.2 Civilian labor force 70,527 +/-2,561 68.2% +/-1.2 Employed 64,905 +/-2,547 62.8% +/-1.3 Unemployed 5,622 +/-661 5.4% +/-0.6 Armed Forces 49 +/-47 0.0% +/-0.1 Not in labor force 32,787 +/-1,600 31.7% +/-1.2
Civilian labor force 70,527 +/-2,561 70,527 (X) Percent Unemployed (X) (X) 8.0% +/-0.9
Females 16 years and over 53,830 +/-2,007 53,830 (X) In labor force 34,485 +/-1,578 64.1% +/-1.8 Civilian labor force 34,485 +/-1,578 64.1% +/-1.8 Employed 32,258 +/-1,593 59.9% +/-1.9
Own children under 6 years 7,524 +/-977 7,524 (X) All parents in family in labor force 5,257 +/-742 69.9% +/-6.5
Own children 6 to 17 years 11,488 +/-1,114 11,488 (X) All parents in family in labor force 8,498 +/-831 74.0% +/-4.3
COMMUTING TO WORK
Workers 16 years and over 63,277 +/-2,561 63,277 (X) Car, truck, or van -- drove alone 32,758 +/-1,829 51.8% +/-2.0 Car, truck, or van -- carpooled 5,369 +/-674 8.5% +/-1.0 Public transportation (excluding taxicab) 12,266 +/-1,082 19.4% +/-1.6 Walked 4,684 +/-687 7.4% +/-1.0 Other means 3,392 +/-545 5.4% +/-0.8 Worked at home 4,808 +/-745 7.6% +/-1.1
Mean travel time to work (minutes) 25.0 +/-0.7 (X) (X)
OCCUPATION
Civilian employed population 16 years and over 64,905 +/-2,547 64,905 (X)
1 of 5 01/09/2015
Subject Seattle City (Northeast) PUMA, Washington
Estimate Margin of Error Percent Percent Margin ofError
Management, business, science, and artsoccupations
37,055 +/-1,587 57.1% +/-2.0
Service occupations 10,243 +/-1,178 15.8% +/-1.5 Sales and office occupations 12,684 +/-1,100 19.5% +/-1.4 Natural resources, construction, and maintenanceoccupations
2,158 +/-517 3.3% +/-0.8
Production, transportation, and material movingoccupations
2,765 +/-524 4.3% +/-0.8
INDUSTRY
Civilian employed population 16 years and over 64,905 +/-2,547 64,905 (X) Agriculture, forestry, fishing and hunting, and mining 370 +/-232 0.6% +/-0.4
Construction 1,676 +/-437 2.6% +/-0.7 Manufacturing 4,206 +/-653 6.5% +/-1.0 Wholesale trade 1,388 +/-368 2.1% +/-0.6 Retail trade 7,055 +/-814 10.9% +/-1.2 Transportation and warehousing, and utilities 1,176 +/-326 1.8% +/-0.5 Information 2,285 +/-416 3.5% +/-0.6 Finance and insurance, and real estate and rentaland leasing
3,483 +/-566 5.4% +/-0.9
Professional, scientific, and management, andadministrative and waste management services
11,029 +/-934 17.0% +/-1.3
Educational services, and health care and socialassistance
19,325 +/-1,224 29.8% +/-1.8
Arts, entertainment, and recreation, andaccommodation and food services
7,355 +/-1,173 11.3% +/-1.6
Other services, except public administration 3,499 +/-517 5.4% +/-0.8 Public administration 2,058 +/-353 3.2% +/-0.5
CLASS OF WORKER
Civilian employed population 16 years and over 64,905 +/-2,547 64,905 (X) Private wage and salary workers 48,417 +/-2,323 74.6% +/-1.6 Government workers 12,542 +/-952 19.3% +/-1.5 Self-employed in own not incorporated businessworkers
3,898 +/-540 6.0% +/-0.8
Unpaid family workers 48 +/-54 0.1% +/-0.1
INCOME AND BENEFITS (IN 2013 INFLATION-ADJUSTED DOLLARS) Total households 48,797 +/-1,335 48,797 (X) Less than $10,000 6,176 +/-680 12.7% +/-1.3 $10,000 to $14,999 1,893 +/-391 3.9% +/-0.8 $15,000 to $24,999 3,978 +/-549 8.2% +/-1.1 $25,000 to $34,999 3,612 +/-521 7.4% +/-1.0 $35,000 to $49,999 5,140 +/-638 10.5% +/-1.3 $50,000 to $74,999 7,066 +/-701 14.5% +/-1.4 $75,000 to $99,999 4,944 +/-554 10.1% +/-1.1 $100,000 to $149,999 6,658 +/-566 13.6% +/-1.1 $150,000 to $199,999 3,707 +/-445 7.6% +/-0.9 $200,000 or more 5,623 +/-562 11.5% +/-1.2 Median household income (dollars) 61,007 +/-2,232 (X) (X) Mean household income (dollars) 93,978 +/-4,150 (X) (X)
With earnings 39,561 +/-1,278 81.1% +/-1.5 Mean earnings (dollars) 96,371 +/-4,470 (X) (X) With Social Security 9,849 +/-639 20.2% +/-1.1 Mean Social Security income (dollars) 17,828 +/-880 (X) (X) With retirement income 6,440 +/-620 13.2% +/-1.3 Mean retirement income (dollars) 32,883 +/-6,802 (X) (X)
With Supplemental Security Income 1,335 +/-324 2.7% +/-0.7 Mean Supplemental Security Income (dollars) 8,167 +/-1,049 (X) (X) With cash public assistance income 1,141 +/-281 2.3% +/-0.6
2 of 5 01/09/2015

Subject Seattle City (Northeast) PUMA, Washington
Estimate Margin of Error Percent Percent Margin ofError
Mean cash public assistance income (dollars) 2,312 +/-526 (X) (X) With Food Stamp/SNAP benefits in the past 12months
4,092 +/-633 8.4% +/-1.3
Families 23,484 +/-1,107 23,484 (X) Less than $10,000 966 +/-308 4.1% +/-1.2 $10,000 to $14,999 395 +/-202 1.7% +/-0.9 $15,000 to $24,999 1,155 +/-261 4.9% +/-1.1 $25,000 to $34,999 886 +/-270 3.8% +/-1.1 $35,000 to $49,999 1,951 +/-393 8.3% +/-1.6 $50,000 to $74,999 3,082 +/-463 13.1% +/-1.9 $75,000 to $99,999 2,598 +/-415 11.1% +/-1.6 $100,000 to $149,999 4,913 +/-477 20.9% +/-2.0 $150,000 to $199,999 2,872 +/-388 12.2% +/-1.6 $200,000 or more 4,666 +/-539 19.9% +/-2.0 Median family income (dollars) 105,988 +/-5,885 (X) (X) Mean family income (dollars) 135,224 +/-7,014 (X) (X)
Per capita income (dollars) 38,819 +/-1,668 (X) (X)
Nonfamily households 25,313 +/-1,410 25,313 (X) Median nonfamily income (dollars) 36,274 +/-3,481 (X) (X) Mean nonfamily income (dollars) 53,482 +/-3,584 (X) (X)
Median earnings for workers (dollars) 30,875 +/-1,547 (X) (X) Median earnings for male full-time, year-round workers(dollars)
65,934 +/-5,631 (X) (X)
Median earnings for female full-time, year-roundworkers (dollars)
52,224 +/-2,638 (X) (X)
HEALTH INSURANCE COVERAGE
Civilian noninstitutionalized population 121,007 +/-3,836 121,007 (X) With health insurance coverage 108,920 +/-3,255 90.0% +/-1.1 With private health insurance 98,291 +/-3,330 81.2% +/-1.5 With public coverage 20,602 +/-1,581 17.0% +/-1.3 No health insurance coverage 12,087 +/-1,472 10.0% +/-1.1
Civilian noninstitutionalized population under 18years
19,628 +/-1,563 19,628 (X)
No health insurance coverage 582 +/-250 3.0% +/-1.2
Civilian noninstitutionalized population 18 to 64 years 89,421 +/-3,084 89,421 (X)
In labor force: 68,210 +/-2,578 68,210 (X) Employed: 62,802 +/-2,576 62,802 (X) With health insurance coverage 55,688 +/-2,123 88.7% +/-1.6 With private health insurance 54,320 +/-2,189 86.5% +/-1.7 With public coverage 2,295 +/-609 3.7% +/-1.0 No health insurance coverage 7,114 +/-1,158 11.3% +/-1.6 Unemployed: 5,408 +/-658 5,408 (X) With health insurance coverage 3,470 +/-540 64.2% +/-7.4 With private health insurance 2,939 +/-495 54.3% +/-7.2 With public coverage 614 +/-263 11.4% +/-4.7 No health insurance coverage 1,938 +/-492 35.8% +/-7.4 Not in labor force: 21,211 +/-1,367 21,211 (X) With health insurance coverage 18,817 +/-1,248 88.7% +/-2.1 With private health insurance 16,761 +/-1,255 79.0% +/-2.9 With public coverage 2,847 +/-504 13.4% +/-2.4 No health insurance coverage 2,394 +/-487 11.3% +/-2.1
3 of 5 01/09/2015

Subject Seattle City (Northeast) PUMA, Washington
Estimate Margin of Error Percent Percent Margin ofError
PERCENTAGE OF FAMILIES AND PEOPLE WHOSEINCOME IN THE PAST 12 MONTHS IS BELOW THEPOVERTY LEVEL All families (X) (X) 7.3% +/-1.9 With related children under 18 years (X) (X) 9.9% +/-3.3 With related children under 5 years only (X) (X) 8.7% +/-5.7 Married couple families (X) (X) 3.0% +/-1.3 With related children under 18 years (X) (X) 3.8% +/-2.1 With related children under 5 years only (X) (X) 2.6% +/-2.3 Families with female householder, no husband present (X) (X) 23.9% +/-8.6
With related children under 18 years (X) (X) 35.0% +/-13.4 With related children under 5 years only (X) (X) 52.1% +/-28.0
All people (X) (X) 18.7% +/-1.7 Under 18 years (X) (X) 12.1% +/-4.2 Related children under 18 years (X) (X) 11.6% +/-4.3 Related children under 5 years (X) (X) 13.1% +/-5.6 Related children 5 to 17 years (X) (X) 10.9% +/-4.1 18 years and over (X) (X) 20.1% +/-1.5 18 to 64 years (X) (X) 21.3% +/-1.7 65 years and over (X) (X) 11.9% +/-3.3 People in families (X) (X) 7.5% +/-2.2 Unrelated individuals 15 years and over (X) (X) 37.0% +/-2.5
Data are based on a sample and are subject to sampling variability. The degree of uncertainty for an estimate arising from sampling variability isrepresented through the use of a margin of error. The value shown here is the 90 percent margin of error. The margin of error can be interpretedroughly as providing a 90 percent probability that the interval defined by the estimate minus the margin of error and the estimate plus the margin oferror (the lower and upper confidence bounds) contains the true value. In addition to sampling variability, the ACS estimates are subject tononsampling error (for a discussion of nonsampling variability, see Accuracy of the Data). The effect of nonsampling error is not represented in thesetables.
There were changes in the edit between 2009 and 2010 regarding Supplemental Security Income (SSI) and Social Security. The changes in the editloosened restrictions on disability requirements for receipt of SSI resulting in an increase in the total number of SSI recipients in the AmericanCommunity Survey. The changes also loosened restrictions on possible reported monthly amounts in Social Security income resulting in higher SocialSecurity aggregate amounts. These results more closely match administrative counts compiled by the Social Security Administration.
Workers include members of the Armed Forces and civilians who were at work last week.
Occupation codes are 4-digit codes and are based on Standard Occupational Classification 2010.
Industry codes are 4-digit codes and are based on the North American Industry Classification System (NAICS). The Census industry codes for 2013and later years are based on the 2012 revision of the NAICS. To allow for the creation of 2009-2013 and 2011-2013 tables, industry data in themultiyear files (2009-2013 and 2011-2013) were recoded to 2013 Census industry codes. We recommend using caution when comparing data codedusing 2013 Census industry codes with data coded using Census industry codes prior to 2013. For more information on the Census industry codechanges, please visit our website at http://www.census.gov/people/io/methodology/.
While the 2011-2013 American Community Survey (ACS) data generally reflect the February 2013 Office of Management and Budget (OMB)definitions of metropolitan and micropolitan statistical areas; in certain instances the names, codes, and boundaries of the principal cities shown inACS tables may differ from the OMB definitions due to differences in the effective dates of the geographic entities.
Estimates of urban and rural population, housing units, and characteristics reflect boundaries of urban areas defined based on Census 2010 data. Asa result, data for urban and rural areas from the ACS do not necessarily reflect the results of ongoing urbanization.
Source: U.S. Census Bureau, 2011-2013 3-Year American Community Survey
Explanation of Symbols:
1. An '**' entry in the margin of error column indicates that either no sample observations or too few sample observations were
4 of 5 01/09/2015

available to compute a standard error and thus the margin of error. A statistical test is not appropriate. 2. An '-' entry in the estimate column indicates that either no sample observations or too few sample observations were available to compute anestimate, or a ratio of medians cannot be calculated because one or both of the median estimates falls in the lowest interval or upper interval of anopen-ended distribution. 3. An '-' following a median estimate means the median falls in the lowest interval of an open-ended distribution. 4. An '+' following a median estimate means the median falls in the upper interval of an open-ended distribution. 5. An '***' entry in the margin of error column indicates that the median falls in the lowest interval or upper interval of an open-ended distribution. Astatistical test is not appropriate. 6. An '*****' entry in the margin of error column indicates that the estimate is controlled. A statistical test for sampling variability is not appropriate. 7. An 'N' entry in the estimate and margin of error columns indicates that data for this geographic area cannot be displayed because the number ofsample cases is too small. 8. An '(X)' means that the estimate is not applicable or not available.

DP03 SELECTED ECONOMIC CHARACTERISTICS
2011-2013 American Community Survey 3-Year Estimates
Supporting documentation on code lists, subject definitions, data accuracy, and statistical testing can be found on the American Community Surveywebsite in the Data and Documentation section.
Sample size and data quality measures (including coverage rates, allocation rates, and response rates) can be found on the American CommunitySurvey website in the Methodology section.
Although the American Community Survey (ACS) produces population, demographic and housing unit estimates, it is the Census Bureau's PopulationEstimates Program that produces and disseminates the official estimates of the population for the nation, states, counties, cities and towns andestimates of housing units for states and counties.
Subject Seattle City (Northwest) PUMA, Washington
Estimate Margin of Error Percent Percent Margin ofError
EMPLOYMENT STATUS
Population 16 years and over 123,517 +/-3,307 123,517 (X) In labor force 95,412 +/-3,062 77.2% +/-1.2 Civilian labor force 95,196 +/-3,068 77.1% +/-1.2 Employed 89,920 +/-3,085 72.8% +/-1.3 Unemployed 5,276 +/-639 4.3% +/-0.5 Armed Forces 216 +/-158 0.2% +/-0.1 Not in labor force 28,105 +/-1,557 22.8% +/-1.2
Civilian labor force 95,196 +/-3,068 95,196 (X) Percent Unemployed (X) (X) 5.5% +/-0.7
Females 16 years and over 63,756 +/-1,791 63,756 (X) In labor force 46,389 +/-1,603 72.8% +/-1.7 Civilian labor force 46,348 +/-1,604 72.7% +/-1.7 Employed 43,885 +/-1,634 68.8% +/-1.7
Own children under 6 years 9,637 +/-860 9,637 (X) All parents in family in labor force 6,310 +/-727 65.5% +/-5.1
Own children 6 to 17 years 11,915 +/-1,054 11,915 (X) All parents in family in labor force 9,160 +/-981 76.9% +/-5.1
COMMUTING TO WORK
Workers 16 years and over 87,849 +/-2,936 87,849 (X) Car, truck, or van -- drove alone 46,901 +/-1,922 53.4% +/-1.6 Car, truck, or van -- carpooled 8,492 +/-979 9.7% +/-1.1 Public transportation (excluding taxicab) 16,587 +/-1,529 18.9% +/-1.6 Walked 3,636 +/-788 4.1% +/-0.8 Other means 5,270 +/-729 6.0% +/-0.8 Worked at home 6,963 +/-817 7.9% +/-0.9
Mean travel time to work (minutes) 26.3 +/-0.7 (X) (X)
OCCUPATION
Civilian employed population 16 years and over 89,920 +/-3,085 89,920 (X)
1 of 5 01/09/2015

Subject Seattle City (Northwest) PUMA, Washington
Estimate Margin of Error Percent Percent Margin ofError
Management, business, science, and artsoccupations
54,084 +/-2,139 60.1% +/-2.0
Service occupations 12,494 +/-1,428 13.9% +/-1.4 Sales and office occupations 15,931 +/-1,549 17.7% +/-1.5 Natural resources, construction, and maintenanceoccupations
3,125 +/-571 3.5% +/-0.6
Production, transportation, and material movingoccupations
4,286 +/-644 4.8% +/-0.7
INDUSTRY
Civilian employed population 16 years and over 89,920 +/-3,085 89,920 (X) Agriculture, forestry, fishing and hunting, and mining 326 +/-175 0.4% +/-0.2
Construction 3,479 +/-588 3.9% +/-0.6 Manufacturing 6,218 +/-700 6.9% +/-0.7 Wholesale trade 1,731 +/-387 1.9% +/-0.4 Retail trade 9,508 +/-1,300 10.6% +/-1.3 Transportation and warehousing, and utilities 2,513 +/-629 2.8% +/-0.7 Information 3,872 +/-603 4.3% +/-0.7 Finance and insurance, and real estate and rentaland leasing
5,309 +/-727 5.9% +/-0.8
Professional, scientific, and management, andadministrative and waste management services
18,906 +/-1,595 21.0% +/-1.7
Educational services, and health care and socialassistance
22,229 +/-1,421 24.7% +/-1.6
Arts, entertainment, and recreation, andaccommodation and food services
7,989 +/-1,031 8.9% +/-1.1
Other services, except public administration 4,955 +/-782 5.5% +/-0.8 Public administration 2,885 +/-481 3.2% +/-0.5
CLASS OF WORKER
Civilian employed population 16 years and over 89,920 +/-3,085 89,920 (X) Private wage and salary workers 70,478 +/-2,927 78.4% +/-1.3 Government workers 12,978 +/-957 14.4% +/-1.0 Self-employed in own not incorporated businessworkers
6,382 +/-734 7.1% +/-0.8
Unpaid family workers 82 +/-84 0.1% +/-0.1
INCOME AND BENEFITS (IN 2013 INFLATION-ADJUSTED DOLLARS) Total households 67,460 +/-1,566 67,460 (X) Less than $10,000 3,181 +/-549 4.7% +/-0.8 $10,000 to $14,999 2,215 +/-439 3.3% +/-0.7 $15,000 to $24,999 3,754 +/-567 5.6% +/-0.8 $25,000 to $34,999 5,945 +/-811 8.8% +/-1.2 $35,000 to $49,999 7,803 +/-731 11.6% +/-1.0 $50,000 to $74,999 11,979 +/-1,139 17.8% +/-1.6 $75,000 to $99,999 8,870 +/-709 13.1% +/-1.0 $100,000 to $149,999 12,804 +/-1,042 19.0% +/-1.6 $150,000 to $199,999 5,773 +/-640 8.6% +/-0.9 $200,000 or more 5,136 +/-601 7.6% +/-0.8 Median household income (dollars) 72,388 +/-3,042 (X) (X) Mean household income (dollars) 91,453 +/-2,379 (X) (X)
With earnings 57,492 +/-1,586 85.2% +/-1.1 Mean earnings (dollars) 92,568 +/-2,146 (X) (X) With Social Security 12,501 +/-818 18.5% +/-1.3 Mean Social Security income (dollars) 16,797 +/-707 (X) (X) With retirement income 7,648 +/-703 11.3% +/-1.0 Mean retirement income (dollars) 25,327 +/-3,292 (X) (X)
With Supplemental Security Income 1,584 +/-368 2.3% +/-0.5 Mean Supplemental Security Income (dollars) 7,965 +/-1,438 (X) (X) With cash public assistance income 1,612 +/-417 2.4% +/-0.6
2 of 5 01/09/2015

Subject Seattle City (Northwest) PUMA, Washington
Estimate Margin of Error Percent Percent Margin ofError
Mean cash public assistance income (dollars) 3,575 +/-1,228 (X) (X) With Food Stamp/SNAP benefits in the past 12months
4,696 +/-702 7.0% +/-1.0
Families 30,883 +/-1,247 30,883 (X) Less than $10,000 816 +/-356 2.6% +/-1.1 $10,000 to $14,999 369 +/-153 1.2% +/-0.5 $15,000 to $24,999 712 +/-240 2.3% +/-0.8 $25,000 to $34,999 1,476 +/-377 4.8% +/-1.2 $35,000 to $49,999 2,297 +/-520 7.4% +/-1.6 $50,000 to $74,999 4,605 +/-680 14.9% +/-2.1 $75,000 to $99,999 4,752 +/-552 15.4% +/-1.6 $100,000 to $149,999 7,985 +/-743 25.9% +/-2.3 $150,000 to $199,999 4,087 +/-510 13.2% +/-1.6 $200,000 or more 3,784 +/-431 12.3% +/-1.4 Median family income (dollars) 101,688 +/-3,141 (X) (X) Mean family income (dollars) 118,726 +/-3,433 (X) (X)
Per capita income (dollars) 43,958 +/-1,158 (X) (X)
Nonfamily households 36,577 +/-1,441 36,577 (X) Median nonfamily income (dollars) 50,978 +/-1,868 (X) (X) Mean nonfamily income (dollars) 65,957 +/-3,153 (X) (X)
Median earnings for workers (dollars) 42,064 +/-1,191 (X) (X) Median earnings for male full-time, year-round workers(dollars)
65,173 +/-3,121 (X) (X)
Median earnings for female full-time, year-roundworkers (dollars)
51,508 +/-1,841 (X) (X)
HEALTH INSURANCE COVERAGE
Civilian noninstitutionalized population 142,677 +/-3,864 142,677 (X) With health insurance coverage 128,419 +/-3,401 90.0% +/-1.0 With private health insurance 118,023 +/-3,178 82.7% +/-1.2 With public coverage 23,772 +/-1,810 16.7% +/-1.2 No health insurance coverage 14,258 +/-1,567 10.0% +/-1.0
Civilian noninstitutionalized population under 18years
21,973 +/-1,307 21,973 (X)
No health insurance coverage 991 +/-419 4.5% +/-1.9
Civilian noninstitutionalized population 18 to 64 years 105,395 +/-3,271 105,395 (X)
In labor force: 92,074 +/-3,059 92,074 (X) Employed: 87,062 +/-3,041 87,062 (X) With health insurance coverage 77,875 +/-2,621 89.4% +/-1.1 With private health insurance 76,558 +/-2,649 87.9% +/-1.2 With public coverage 2,675 +/-683 3.1% +/-0.8 No health insurance coverage 9,187 +/-1,132 10.6% +/-1.1 Unemployed: 5,012 +/-633 5,012 (X) With health insurance coverage 2,962 +/-470 59.1% +/-7.3 With private health insurance 2,735 +/-421 54.6% +/-6.5 With public coverage 426 +/-223 8.5% +/-4.5 No health insurance coverage 2,050 +/-486 40.9% +/-7.3 Not in labor force: 13,321 +/-1,122 13,321 (X) With health insurance coverage 11,474 +/-1,037 86.1% +/-2.7 With private health insurance 9,188 +/-866 69.0% +/-3.7 With public coverage 2,962 +/-537 22.2% +/-3.5 No health insurance coverage 1,847 +/-395 13.9% +/-2.7
3 of 5 01/09/2015
Subject Seattle City (Northwest) PUMA, Washington
Estimate Margin of Error Percent Percent Margin ofError
PERCENTAGE OF FAMILIES AND PEOPLE WHOSEINCOME IN THE PAST 12 MONTHS IS BELOW THEPOVERTY LEVEL All families (X) (X) 4.7% +/-1.3 With related children under 18 years (X) (X) 7.5% +/-2.6 With related children under 5 years only (X) (X) 7.7% +/-4.5 Married couple families (X) (X) 2.5% +/-0.9 With related children under 18 years (X) (X) 3.7% +/-1.9 With related children under 5 years only (X) (X) 3.0% +/-3.0 Families with female householder, no husband present (X) (X) 15.0% +/-5.7
With related children under 18 years (X) (X) 22.3% +/-9.6 With related children under 5 years only (X) (X) 51.8% +/-33.9
All people (X) (X) 8.6% +/-0.8 Under 18 years (X) (X) 7.2% +/-2.2 Related children under 18 years (X) (X) 6.6% +/-2.2 Related children under 5 years (X) (X) 6.1% +/-3.2 Related children 5 to 17 years (X) (X) 7.0% +/-2.6 18 years and over (X) (X) 8.8% +/-0.8 18 to 64 years (X) (X) 8.6% +/-0.9 65 years and over (X) (X) 10.2% +/-2.3 People in families (X) (X) 4.6% +/-1.3 Unrelated individuals 15 years and over (X) (X) 14.5% +/-1.4
Data are based on a sample and are subject to sampling variability. The degree of uncertainty for an estimate arising from sampling variability isrepresented through the use of a margin of error. The value shown here is the 90 percent margin of error. The margin of error can be interpretedroughly as providing a 90 percent probability that the interval defined by the estimate minus the margin of error and the estimate plus the margin oferror (the lower and upper confidence bounds) contains the true value. In addition to sampling variability, the ACS estimates are subject tononsampling error (for a discussion of nonsampling variability, see Accuracy of the Data). The effect of nonsampling error is not represented in thesetables.
There were changes in the edit between 2009 and 2010 regarding Supplemental Security Income (SSI) and Social Security. The changes in the editloosened restrictions on disability requirements for receipt of SSI resulting in an increase in the total number of SSI recipients in the AmericanCommunity Survey. The changes also loosened restrictions on possible reported monthly amounts in Social Security income resulting in higher SocialSecurity aggregate amounts. These results more closely match administrative counts compiled by the Social Security Administration.
Workers include members of the Armed Forces and civilians who were at work last week.
Occupation codes are 4-digit codes and are based on Standard Occupational Classification 2010.
Industry codes are 4-digit codes and are based on the North American Industry Classification System (NAICS). The Census industry codes for 2013and later years are based on the 2012 revision of the NAICS. To allow for the creation of 2009-2013 and 2011-2013 tables, industry data in themultiyear files (2009-2013 and 2011-2013) were recoded to 2013 Census industry codes. We recommend using caution when comparing data codedusing 2013 Census industry codes with data coded using Census industry codes prior to 2013. For more information on the Census industry codechanges, please visit our website at http://www.census.gov/people/io/methodology/.
While the 2011-2013 American Community Survey (ACS) data generally reflect the February 2013 Office of Management and Budget (OMB)definitions of metropolitan and micropolitan statistical areas; in certain instances the names, codes, and boundaries of the principal cities shown inACS tables may differ from the OMB definitions due to differences in the effective dates of the geographic entities.
Estimates of urban and rural population, housing units, and characteristics reflect boundaries of urban areas defined based on Census 2010 data. Asa result, data for urban and rural areas from the ACS do not necessarily reflect the results of ongoing urbanization.
Source: U.S. Census Bureau, 2011-2013 3-Year American Community Survey
Explanation of Symbols:
1. An '**' entry in the margin of error column indicates that either no sample observations or too few sample observations were
4 of 5 01/09/2015

available to compute a standard error and thus the margin of error. A statistical test is not appropriate. 2. An '-' entry in the estimate column indicates that either no sample observations or too few sample observations were available to compute anestimate, or a ratio of medians cannot be calculated because one or both of the median estimates falls in the lowest interval or upper interval of anopen-ended distribution. 3. An '-' following a median estimate means the median falls in the lowest interval of an open-ended distribution. 4. An '+' following a median estimate means the median falls in the upper interval of an open-ended distribution. 5. An '***' entry in the margin of error column indicates that the median falls in the lowest interval or upper interval of an open-ended distribution. Astatistical test is not appropriate. 6. An '*****' entry in the margin of error column indicates that the estimate is controlled. A statistical test for sampling variability is not appropriate. 7. An 'N' entry in the estimate and margin of error columns indicates that data for this geographic area cannot be displayed because the number ofsample cases is too small. 8. An '(X)' means that the estimate is not applicable or not available.
DP03 SELECTED ECONOMIC CHARACTERISTICS
2011-2013 American Community Survey 3-Year Estimates
Supporting documentation on code lists, subject definitions, data accuracy, and statistical testing can be found on the American Community Surveywebsite in the Data and Documentation section.
Sample size and data quality measures (including coverage rates, allocation rates, and response rates) can be found on the American CommunitySurvey website in the Methodology section.
Although the American Community Survey (ACS) produces population, demographic and housing unit estimates, it is the Census Bureau's PopulationEstimates Program that produces and disseminates the official estimates of the population for the nation, states, counties, cities and towns andestimates of housing units for states and counties.
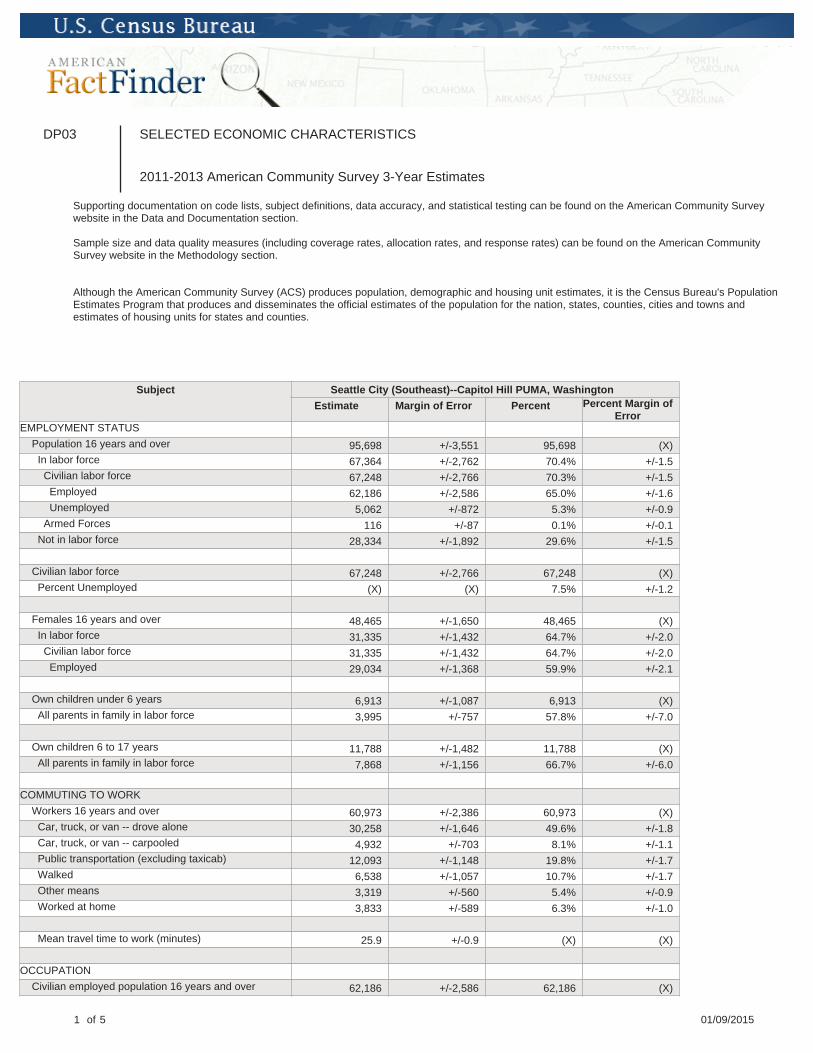
Subject Seattle City (Southeast)--Capitol Hill PUMA, Washington
Estimate Margin of Error Percent Percent Margin ofError
EMPLOYMENT STATUS
Population 16 years and over 95,698 +/-3,551 95,698 (X) In labor force 67,364 +/-2,762 70.4% +/-1.5 Civilian labor force 67,248 +/-2,766 70.3% +/-1.5 Employed 62,186 +/-2,586 65.0% +/-1.6 Unemployed 5,062 +/-872 5.3% +/-0.9 Armed Forces 116 +/-87 0.1% +/-0.1 Not in labor force 28,334 +/-1,892 29.6% +/-1.5
Civilian labor force 67,248 +/-2,766 67,248 (X) Percent Unemployed (X) (X) 7.5% +/-1.2
Females 16 years and over 48,465 +/-1,650 48,465 (X) In labor force 31,335 +/-1,432 64.7% +/-2.0 Civilian labor force 31,335 +/-1,432 64.7% +/-2.0 Employed 29,034 +/-1,368 59.9% +/-2.1
Own children under 6 years 6,913 +/-1,087 6,913 (X) All parents in family in labor force 3,995 +/-757 57.8% +/-7.0
Own children 6 to 17 years 11,788 +/-1,482 11,788 (X) All parents in family in labor force 7,868 +/-1,156 66.7% +/-6.0
COMMUTING TO WORK
Workers 16 years and over 60,973 +/-2,386 60,973 (X) Car, truck, or van -- drove alone 30,258 +/-1,646 49.6% +/-1.8 Car, truck, or van -- carpooled 4,932 +/-703 8.1% +/-1.1 Public transportation (excluding taxicab) 12,093 +/-1,148 19.8% +/-1.7 Walked 6,538 +/-1,057 10.7% +/-1.7 Other means 3,319 +/-560 5.4% +/-0.9 Worked at home 3,833 +/-589 6.3% +/-1.0
Mean travel time to work (minutes) 25.9 +/-0.9 (X) (X)
OCCUPATION
Civilian employed population 16 years and over 62,186 +/-2,586 62,186 (X)
1 of 5 01/09/2015

Subject Seattle City (Southeast)--Capitol Hill PUMA, Washington
Estimate Margin of Error Percent Percent Margin ofError
Management, business, science, and artsoccupations
33,143 +/-1,608 53.3% +/-2.6
Service occupations 10,792 +/-1,392 17.4% +/-1.9 Sales and office occupations 11,277 +/-1,287 18.1% +/-1.8 Natural resources, construction, and maintenanceoccupations
2,493 +/-661 4.0% +/-1.0
Production, transportation, and material movingoccupations
4,481 +/-686 7.2% +/-1.1
INDUSTRY
Civilian employed population 16 years and over 62,186 +/-2,586 62,186 (X) Agriculture, forestry, fishing and hunting, and mining 329 +/-214 0.5% +/-0.3
Construction 1,926 +/-558 3.1% +/-0.9 Manufacturing 4,094 +/-654 6.6% +/-1.0 Wholesale trade 942 +/-271 1.5% +/-0.4 Retail trade 6,167 +/-786 9.9% +/-1.2 Transportation and warehousing, and utilities 2,350 +/-541 3.8% +/-0.9 Information 1,953 +/-475 3.1% +/-0.7 Finance and insurance, and real estate and rentaland leasing
3,385 +/-624 5.4% +/-1.0
Professional, scientific, and management, andadministrative and waste management services
12,929 +/-1,086 20.8% +/-1.6
Educational services, and health care and socialassistance
16,023 +/-1,139 25.8% +/-1.8
Arts, entertainment, and recreation, andaccommodation and food services
6,380 +/-1,003 10.3% +/-1.4
Other services, except public administration 3,357 +/-513 5.4% +/-0.8 Public administration 2,351 +/-562 3.8% +/-0.9
CLASS OF WORKER
Civilian employed population 16 years and over 62,186 +/-2,586 62,186 (X) Private wage and salary workers 48,720 +/-2,190 78.3% +/-1.6 Government workers 8,826 +/-987 14.2% +/-1.4 Self-employed in own not incorporated businessworkers
4,425 +/-630 7.1% +/-1.0
Unpaid family workers 215 +/-161 0.3% +/-0.3
INCOME AND BENEFITS (IN 2013 INFLATION-ADJUSTED DOLLARS) Total households 48,314 +/-1,362 48,314 (X) Less than $10,000 3,974 +/-577 8.2% +/-1.2 $10,000 to $14,999 1,684 +/-297 3.5% +/-0.6 $15,000 to $24,999 3,835 +/-762 7.9% +/-1.5 $25,000 to $34,999 3,754 +/-597 7.8% +/-1.2 $35,000 to $49,999 5,090 +/-580 10.5% +/-1.2 $50,000 to $74,999 7,763 +/-827 16.1% +/-1.6 $75,000 to $99,999 6,067 +/-726 12.6% +/-1.5 $100,000 to $149,999 7,513 +/-775 15.6% +/-1.6 $150,000 to $199,999 3,302 +/-535 6.8% +/-1.1 $200,000 or more 5,332 +/-492 11.0% +/-1.0 Median household income (dollars) 67,188 +/-3,548 (X) (X) Mean household income (dollars) 101,725 +/-4,253 (X) (X)
With earnings 40,375 +/-1,365 83.6% +/-1.3 Mean earnings (dollars) 100,467 +/-4,276 (X) (X) With Social Security 9,935 +/-751 20.6% +/-1.5 Mean Social Security income (dollars) 16,571 +/-789 (X) (X) With retirement income 5,394 +/-624 11.2% +/-1.3 Mean retirement income (dollars) 28,165 +/-4,140 (X) (X)
With Supplemental Security Income 1,910 +/-317 4.0% +/-0.7 Mean Supplemental Security Income (dollars) 8,479 +/-783 (X) (X) With cash public assistance income 2,314 +/-490 4.8% +/-1.0
2 of 5 01/09/2015

Subject Seattle City (Southeast)--Capitol Hill PUMA, Washington
Estimate Margin of Error Percent Percent Margin ofError
Mean cash public assistance income (dollars) 3,641 +/-999 (X) (X) With Food Stamp/SNAP benefits in the past 12months
6,646 +/-695 13.8% +/-1.4
Families 23,208 +/-1,196 23,208 (X) Less than $10,000 1,367 +/-377 5.9% +/-1.6 $10,000 to $14,999 498 +/-166 2.1% +/-0.7 $15,000 to $24,999 1,206 +/-382 5.2% +/-1.6 $25,000 to $34,999 1,508 +/-426 6.5% +/-1.8 $35,000 to $49,999 1,920 +/-418 8.3% +/-1.8 $50,000 to $74,999 3,246 +/-476 14.0% +/-1.8 $75,000 to $99,999 2,971 +/-586 12.8% +/-2.4 $100,000 to $149,999 4,450 +/-613 19.2% +/-2.4 $150,000 to $199,999 2,153 +/-398 9.3% +/-1.7 $200,000 or more 3,889 +/-447 16.8% +/-2.0 Median family income (dollars) 91,245 +/-5,768 (X) (X) Mean family income (dollars) 134,676 +/-8,883 (X) (X)
Per capita income (dollars) 44,580 +/-2,108 (X) (X)
Nonfamily households 25,106 +/-1,361 25,106 (X) Median nonfamily income (dollars) 50,924 +/-2,760 (X) (X) Mean nonfamily income (dollars) 67,754 +/-4,094 (X) (X)
Median earnings for workers (dollars) 38,648 +/-2,621 (X) (X) Median earnings for male full-time, year-round workers(dollars)
62,334 +/-5,210 (X) (X)
Median earnings for female full-time, year-roundworkers (dollars)
53,453 +/-3,655 (X) (X)
HEALTH INSURANCE COVERAGE
Civilian noninstitutionalized population 112,526 +/-4,645 112,526 (X) With health insurance coverage 98,575 +/-3,923 87.6% +/-1.6 With private health insurance 80,887 +/-2,836 71.9% +/-2.2 With public coverage 26,726 +/-2,477 23.8% +/-1.8 No health insurance coverage 13,951 +/-2,100 12.4% +/-1.6
Civilian noninstitutionalized population under 18years
19,717 +/-2,048 19,717 (X)
No health insurance coverage 746 +/-333 3.8% +/-1.7
Civilian noninstitutionalized population 18 to 64 years 79,594 +/-3,523 79,594 (X)
In labor force: 64,134 +/-2,783 64,134 (X) Employed: 59,369 +/-2,634 59,369 (X) With health insurance coverage 51,337 +/-2,115 86.5% +/-2.2 With private health insurance 49,863 +/-2,075 84.0% +/-2.1 With public coverage 2,185 +/-544 3.7% +/-0.9 No health insurance coverage 8,032 +/-1,459 13.5% +/-2.2 Unemployed: 4,765 +/-825 4,765 (X) With health insurance coverage 3,107 +/-631 65.2% +/-8.4 With private health insurance 2,235 +/-502 46.9% +/-9.5 With public coverage 959 +/-452 20.1% +/-8.0 No health insurance coverage 1,658 +/-515 34.8% +/-8.4 Not in labor force: 15,460 +/-1,536 15,460 (X) With health insurance coverage 12,118 +/-1,247 78.4% +/-3.5 With private health insurance 7,927 +/-799 51.3% +/-4.3 With public coverage 4,718 +/-861 30.5% +/-4.0 No health insurance coverage 3,342 +/-674 21.6% +/-3.5
3 of 5 01/09/2015
Subject Seattle City (Southeast)--Capitol Hill PUMA, Washington
Estimate Margin of Error Percent Percent Margin ofError
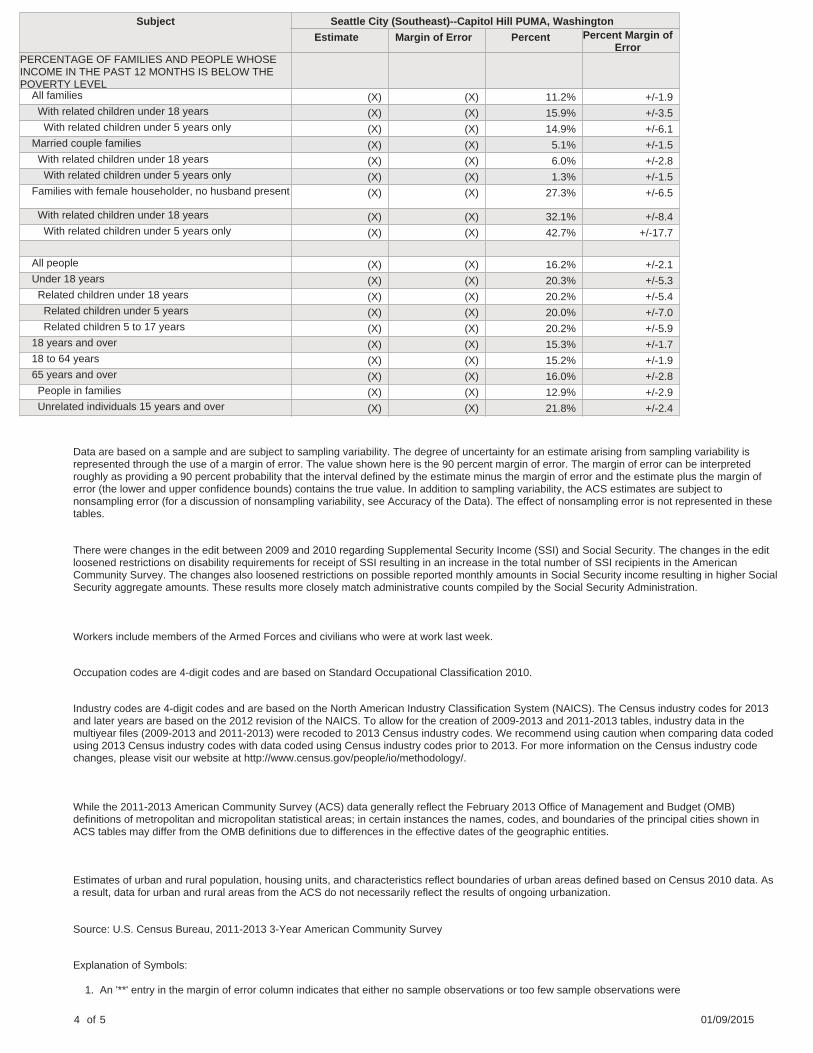
PERCENTAGE OF FAMILIES AND PEOPLE WHOSEINCOME IN THE PAST 12 MONTHS IS BELOW THEPOVERTY LEVEL All families (X) (X) 11.2% +/-1.9 With related children under 18 years (X) (X) 15.9% +/-3.5 With related children under 5 years only (X) (X) 14.9% +/-6.1 Married couple families (X) (X) 5.1% +/-1.5 With related children under 18 years (X) (X) 6.0% +/-2.8 With related children under 5 years only (X) (X) 1.3% +/-1.5 Families with female householder, no husband present (X) (X) 27.3% +/-6.5
With related children under 18 years (X) (X) 32.1% +/-8.4 With related children under 5 years only (X) (X) 42.7% +/-17.7
All people (X) (X) 16.2% +/-2.1 Under 18 years (X) (X) 20.3% +/-5.3 Related children under 18 years (X) (X) 20.2% +/-5.4 Related children under 5 years (X) (X) 20.0% +/-7.0 Related children 5 to 17 years (X) (X) 20.2% +/-5.9 18 years and over (X) (X) 15.3% +/-1.7 18 to 64 years (X) (X) 15.2% +/-1.9 65 years and over (X) (X) 16.0% +/-2.8 People in families (X) (X) 12.9% +/-2.9 Unrelated individuals 15 years and over (X) (X) 21.8% +/-2.4
Data are based on a sample and are subject to sampling variability. The degree of uncertainty for an estimate arising from sampling variability isrepresented through the use of a margin of error. The value shown here is the 90 percent margin of error. The margin of error can be interpretedroughly as providing a 90 percent probability that the interval defined by the estimate minus the margin of error and the estimate plus the margin oferror (the lower and upper confidence bounds) contains the true value. In addition to sampling variability, the ACS estimates are subject tononsampling error (for a discussion of nonsampling variability, see Accuracy of the Data). The effect of nonsampling error is not represented in thesetables.
There were changes in the edit between 2009 and 2010 regarding Supplemental Security Income (SSI) and Social Security. The changes in the editloosened restrictions on disability requirements for receipt of SSI resulting in an increase in the total number of SSI recipients in the AmericanCommunity Survey. The changes also loosened restrictions on possible reported monthly amounts in Social Security income resulting in higher SocialSecurity aggregate amounts. These results more closely match administrative counts compiled by the Social Security Administration.
Workers include members of the Armed Forces and civilians who were at work last week.
Occupation codes are 4-digit codes and are based on Standard Occupational Classification 2010.
Industry codes are 4-digit codes and are based on the North American Industry Classification System (NAICS). The Census industry codes for 2013and later years are based on the 2012 revision of the NAICS. To allow for the creation of 2009-2013 and 2011-2013 tables, industry data in themultiyear files (2009-2013 and 2011-2013) were recoded to 2013 Census industry codes. We recommend using caution when comparing data codedusing 2013 Census industry codes with data coded using Census industry codes prior to 2013. For more information on the Census industry codechanges, please visit our website at http://www.census.gov/people/io/methodology/.
While the 2011-2013 American Community Survey (ACS) data generally reflect the February 2013 Office of Management and Budget (OMB)definitions of metropolitan and micropolitan statistical areas; in certain instances the names, codes, and boundaries of the principal cities shown inACS tables may differ from the OMB definitions due to differences in the effective dates of the geographic entities.
Estimates of urban and rural population, housing units, and characteristics reflect boundaries of urban areas defined based on Census 2010 data. Asa result, data for urban and rural areas from the ACS do not necessarily reflect the results of ongoing urbanization.
Source: U.S. Census Bureau, 2011-2013 3-Year American Community Survey
Explanation of Symbols:
1. An '**' entry in the margin of error column indicates that either no sample observations or too few sample observations were
4 of 5 01/09/2015

available to compute a standard error and thus the margin of error. A statistical test is not appropriate. 2. An '-' entry in the estimate column indicates that either no sample observations or too few sample observations were available to compute anestimate, or a ratio of medians cannot be calculated because one or both of the median estimates falls in the lowest interval or upper interval of anopen-ended distribution. 3. An '-' following a median estimate means the median falls in the lowest interval of an open-ended distribution. 4. An '+' following a median estimate means the median falls in the upper interval of an open-ended distribution. 5. An '***' entry in the margin of error column indicates that the median falls in the lowest interval or upper interval of an open-ended distribution. Astatistical test is not appropriate. 6. An '*****' entry in the margin of error column indicates that the estimate is controlled. A statistical test for sampling variability is not appropriate. 7. An 'N' entry in the estimate and margin of error columns indicates that data for this geographic area cannot be displayed because the number ofsample cases is too small. 8. An '(X)' means that the estimate is not applicable or not available.
DP03 SELECTED ECONOMIC CHARACTERISTICS
2011-2013 American Community Survey 3-Year Estimates
Supporting documentation on code lists, subject definitions, data accuracy, and statistical testing can be found on the American Community Surveywebsite in the Data and Documentation section.
Sample size and data quality measures (including coverage rates, allocation rates, and response rates) can be found on the American CommunitySurvey website in the Methodology section.
Although the American Community Survey (ACS) produces population, demographic and housing unit estimates, it is the Census Bureau's PopulationEstimates Program that produces and disseminates the official estimates of the population for the nation, states, counties, cities and towns andestimates of housing units for states and counties.
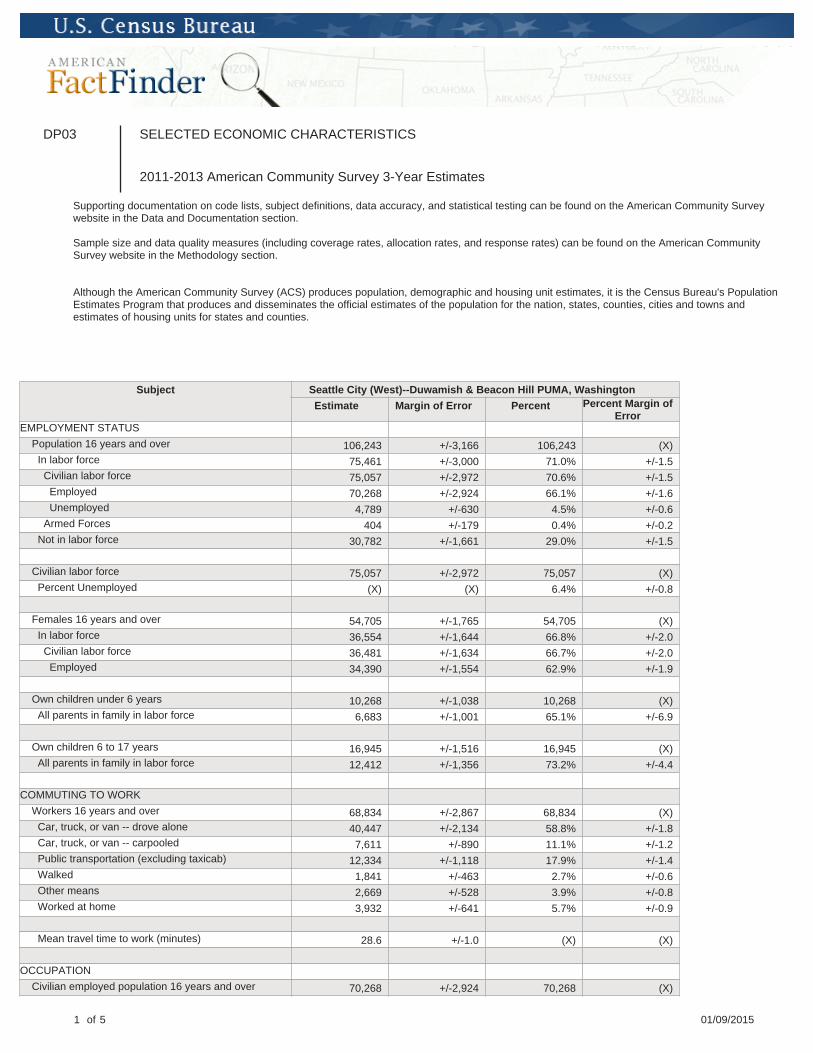
Subject Seattle City (West)--Duwamish & Beacon Hill PUMA, Washington
Estimate Margin of Error Percent Percent Margin ofError
EMPLOYMENT STATUS
Population 16 years and over 106,243 +/-3,166 106,243 (X) In labor force 75,461 +/-3,000 71.0% +/-1.5 Civilian labor force 75,057 +/-2,972 70.6% +/-1.5 Employed 70,268 +/-2,924 66.1% +/-1.6 Unemployed 4,789 +/-630 4.5% +/-0.6 Armed Forces 404 +/-179 0.4% +/-0.2 Not in labor force 30,782 +/-1,661 29.0% +/-1.5
Civilian labor force 75,057 +/-2,972 75,057 (X) Percent Unemployed (X) (X) 6.4% +/-0.8
Females 16 years and over 54,705 +/-1,765 54,705 (X) In labor force 36,554 +/-1,644 66.8% +/-2.0 Civilian labor force 36,481 +/-1,634 66.7% +/-2.0 Employed 34,390 +/-1,554 62.9% +/-1.9
Own children under 6 years 10,268 +/-1,038 10,268 (X) All parents in family in labor force 6,683 +/-1,001 65.1% +/-6.9
Own children 6 to 17 years 16,945 +/-1,516 16,945 (X) All parents in family in labor force 12,412 +/-1,356 73.2% +/-4.4
COMMUTING TO WORK
Workers 16 years and over 68,834 +/-2,867 68,834 (X) Car, truck, or van -- drove alone 40,447 +/-2,134 58.8% +/-1.8 Car, truck, or van -- carpooled 7,611 +/-890 11.1% +/-1.2 Public transportation (excluding taxicab) 12,334 +/-1,118 17.9% +/-1.4 Walked 1,841 +/-463 2.7% +/-0.6 Other means 2,669 +/-528 3.9% +/-0.8 Worked at home 3,932 +/-641 5.7% +/-0.9
Mean travel time to work (minutes) 28.6 +/-1.0 (X) (X)
OCCUPATION
Civilian employed population 16 years and over 70,268 +/-2,924 70,268 (X)
1 of 5 01/09/2015
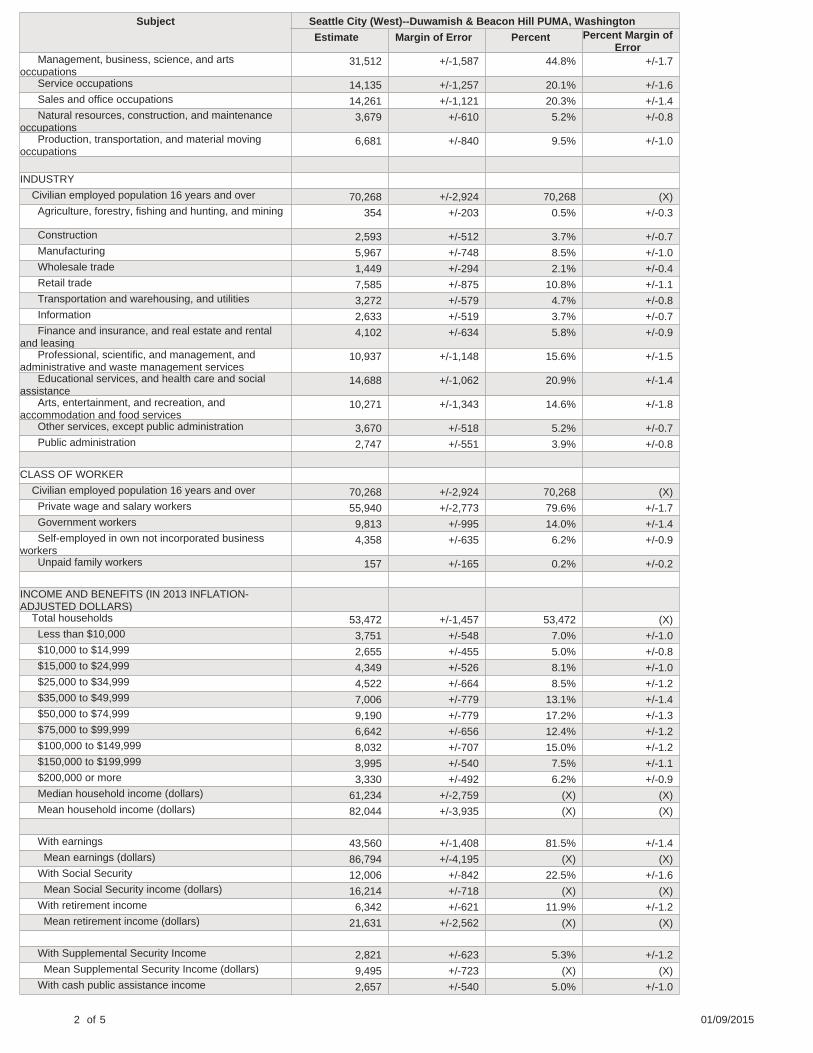
Subject Seattle City (West)--Duwamish & Beacon Hill PUMA, Washington
Estimate Margin of Error Percent Percent Margin ofError
Management, business, science, and artsoccupations
31,512 +/-1,587 44.8% +/-1.7
Service occupations 14,135 +/-1,257 20.1% +/-1.6 Sales and office occupations 14,261 +/-1,121 20.3% +/-1.4 Natural resources, construction, and maintenanceoccupations
3,679 +/-610 5.2% +/-0.8
Production, transportation, and material movingoccupations
6,681 +/-840 9.5% +/-1.0
INDUSTRY
Civilian employed population 16 years and over 70,268 +/-2,924 70,268 (X) Agriculture, forestry, fishing and hunting, and mining 354 +/-203 0.5% +/-0.3
Construction 2,593 +/-512 3.7% +/-0.7 Manufacturing 5,967 +/-748 8.5% +/-1.0 Wholesale trade 1,449 +/-294 2.1% +/-0.4 Retail trade 7,585 +/-875 10.8% +/-1.1 Transportation and warehousing, and utilities 3,272 +/-579 4.7% +/-0.8 Information 2,633 +/-519 3.7% +/-0.7 Finance and insurance, and real estate and rentaland leasing
4,102 +/-634 5.8% +/-0.9
Professional, scientific, and management, andadministrative and waste management services
10,937 +/-1,148 15.6% +/-1.5
Educational services, and health care and socialassistance
14,688 +/-1,062 20.9% +/-1.4
Arts, entertainment, and recreation, andaccommodation and food services
10,271 +/-1,343 14.6% +/-1.8
Other services, except public administration 3,670 +/-518 5.2% +/-0.7 Public administration 2,747 +/-551 3.9% +/-0.8
CLASS OF WORKER
Civilian employed population 16 years and over 70,268 +/-2,924 70,268 (X) Private wage and salary workers 55,940 +/-2,773 79.6% +/-1.7 Government workers 9,813 +/-995 14.0% +/-1.4 Self-employed in own not incorporated businessworkers
4,358 +/-635 6.2% +/-0.9
Unpaid family workers 157 +/-165 0.2% +/-0.2
INCOME AND BENEFITS (IN 2013 INFLATION-ADJUSTED DOLLARS) Total households 53,472 +/-1,457 53,472 (X) Less than $10,000 3,751 +/-548 7.0% +/-1.0 $10,000 to $14,999 2,655 +/-455 5.0% +/-0.8 $15,000 to $24,999 4,349 +/-526 8.1% +/-1.0 $25,000 to $34,999 4,522 +/-664 8.5% +/-1.2 $35,000 to $49,999 7,006 +/-779 13.1% +/-1.4 $50,000 to $74,999 9,190 +/-779 17.2% +/-1.3 $75,000 to $99,999 6,642 +/-656 12.4% +/-1.2 $100,000 to $149,999 8,032 +/-707 15.0% +/-1.2 $150,000 to $199,999 3,995 +/-540 7.5% +/-1.1 $200,000 or more 3,330 +/-492 6.2% +/-0.9 Median household income (dollars) 61,234 +/-2,759 (X) (X) Mean household income (dollars) 82,044 +/-3,935 (X) (X)
With earnings 43,560 +/-1,408 81.5% +/-1.4 Mean earnings (dollars) 86,794 +/-4,195 (X) (X) With Social Security 12,006 +/-842 22.5% +/-1.6 Mean Social Security income (dollars) 16,214 +/-718 (X) (X) With retirement income 6,342 +/-621 11.9% +/-1.2 Mean retirement income (dollars) 21,631 +/-2,562 (X) (X)
With Supplemental Security Income 2,821 +/-623 5.3% +/-1.2 Mean Supplemental Security Income (dollars) 9,495 +/-723 (X) (X) With cash public assistance income 2,657 +/-540 5.0% +/-1.0
2 of 5 01/09/2015
Subject Seattle City (West)--Duwamish & Beacon Hill PUMA, Washington
Estimate Margin of Error Percent Percent Margin ofError
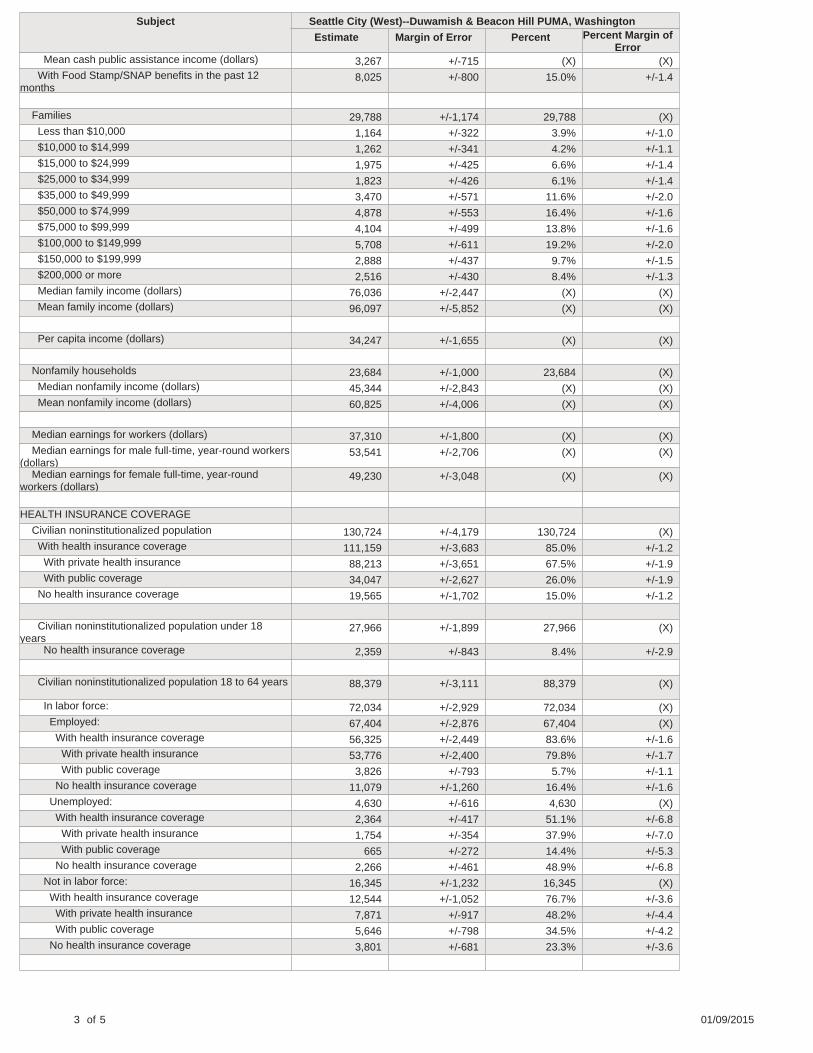
Mean cash public assistance income (dollars) 3,267 +/-715 (X) (X) With Food Stamp/SNAP benefits in the past 12months
8,025 +/-800 15.0% +/-1.4
Families 29,788 +/-1,174 29,788 (X) Less than $10,000 1,164 +/-322 3.9% +/-1.0 $10,000 to $14,999 1,262 +/-341 4.2% +/-1.1 $15,000 to $24,999 1,975 +/-425 6.6% +/-1.4 $25,000 to $34,999 1,823 +/-426 6.1% +/-1.4 $35,000 to $49,999 3,470 +/-571 11.6% +/-2.0 $50,000 to $74,999 4,878 +/-553 16.4% +/-1.6 $75,000 to $99,999 4,104 +/-499 13.8% +/-1.6 $100,000 to $149,999 5,708 +/-611 19.2% +/-2.0 $150,000 to $199,999 2,888 +/-437 9.7% +/-1.5 $200,000 or more 2,516 +/-430 8.4% +/-1.3 Median family income (dollars) 76,036 +/-2,447 (X) (X) Mean family income (dollars) 96,097 +/-5,852 (X) (X)
Per capita income (dollars) 34,247 +/-1,655 (X) (X)
Nonfamily households 23,684 +/-1,000 23,684 (X) Median nonfamily income (dollars) 45,344 +/-2,843 (X) (X) Mean nonfamily income (dollars) 60,825 +/-4,006 (X) (X)
Median earnings for workers (dollars) 37,310 +/-1,800 (X) (X) Median earnings for male full-time, year-round workers(dollars)
53,541 +/-2,706 (X) (X)
Median earnings for female full-time, year-roundworkers (dollars)
49,230 +/-3,048 (X) (X)
HEALTH INSURANCE COVERAGE
Civilian noninstitutionalized population 130,724 +/-4,179 130,724 (X) With health insurance coverage 111,159 +/-3,683 85.0% +/-1.2 With private health insurance 88,213 +/-3,651 67.5% +/-1.9 With public coverage 34,047 +/-2,627 26.0% +/-1.9 No health insurance coverage 19,565 +/-1,702 15.0% +/-1.2
Civilian noninstitutionalized population under 18years
27,966 +/-1,899 27,966 (X)
No health insurance coverage 2,359 +/-843 8.4% +/-2.9
Civilian noninstitutionalized population 18 to 64 years 88,379 +/-3,111 88,379 (X)
In labor force: 72,034 +/-2,929 72,034 (X) Employed: 67,404 +/-2,876 67,404 (X) With health insurance coverage 56,325 +/-2,449 83.6% +/-1.6 With private health insurance 53,776 +/-2,400 79.8% +/-1.7 With public coverage 3,826 +/-793 5.7% +/-1.1 No health insurance coverage 11,079 +/-1,260 16.4% +/-1.6 Unemployed: 4,630 +/-616 4,630 (X) With health insurance coverage 2,364 +/-417 51.1% +/-6.8 With private health insurance 1,754 +/-354 37.9% +/-7.0 With public coverage 665 +/-272 14.4% +/-5.3 No health insurance coverage 2,266 +/-461 48.9% +/-6.8 Not in labor force: 16,345 +/-1,232 16,345 (X) With health insurance coverage 12,544 +/-1,052 76.7% +/-3.6 With private health insurance 7,871 +/-917 48.2% +/-4.4 With public coverage 5,646 +/-798 34.5% +/-4.2 No health insurance coverage 3,801 +/-681 23.3% +/-3.6
3 of 5 01/09/2015

Subject Seattle City (West)--Duwamish & Beacon Hill PUMA, Washington
Estimate Margin of Error Percent Percent Margin ofError
PERCENTAGE OF FAMILIES AND PEOPLE WHOSEINCOME IN THE PAST 12 MONTHS IS BELOW THEPOVERTY LEVEL All families (X) (X) 11.3% +/-1.7 With related children under 18 years (X) (X) 18.0% +/-3.2 With related children under 5 years only (X) (X) 7.1% +/-4.2 Married couple families (X) (X) 4.8% +/-1.4 With related children under 18 years (X) (X) 7.1% +/-2.9 With related children under 5 years only (X) (X) 0.6% +/-0.9 Families with female householder, no husband present (X) (X) 31.9% +/-6.4
With related children under 18 years (X) (X) 40.2% +/-8.3 With related children under 5 years only (X) (X) 28.1% +/-16.0
All people (X) (X) 16.1% +/-1.8 Under 18 years (X) (X) 24.0% +/-4.7 Related children under 18 years (X) (X) 23.8% +/-4.7 Related children under 5 years (X) (X) 22.4% +/-6.4 Related children 5 to 17 years (X) (X) 24.4% +/-5.1 18 years and over (X) (X) 13.9% +/-1.4 18 to 64 years (X) (X) 13.4% +/-1.5 65 years and over (X) (X) 16.9% +/-2.8 People in families (X) (X) 13.6% +/-2.3 Unrelated individuals 15 years and over (X) (X) 22.4% +/-2.1
Data are based on a sample and are subject to sampling variability. The degree of uncertainty for an estimate arising from sampling variability isrepresented through the use of a margin of error. The value shown here is the 90 percent margin of error. The margin of error can be interpretedroughly as providing a 90 percent probability that the interval defined by the estimate minus the margin of error and the estimate plus the margin oferror (the lower and upper confidence bounds) contains the true value. In addition to sampling variability, the ACS estimates are subject tononsampling error (for a discussion of nonsampling variability, see Accuracy of the Data). The effect of nonsampling error is not represented in thesetables.
There were changes in the edit between 2009 and 2010 regarding Supplemental Security Income (SSI) and Social Security. The changes in the editloosened restrictions on disability requirements for receipt of SSI resulting in an increase in the total number of SSI recipients in the AmericanCommunity Survey. The changes also loosened restrictions on possible reported monthly amounts in Social Security income resulting in higher SocialSecurity aggregate amounts. These results more closely match administrative counts compiled by the Social Security Administration.
Workers include members of the Armed Forces and civilians who were at work last week.
Occupation codes are 4-digit codes and are based on Standard Occupational Classification 2010.
Industry codes are 4-digit codes and are based on the North American Industry Classification System (NAICS). The Census industry codes for 2013and later years are based on the 2012 revision of the NAICS. To allow for the creation of 2009-2013 and 2011-2013 tables, industry data in themultiyear files (2009-2013 and 2011-2013) were recoded to 2013 Census industry codes. We recommend using caution when comparing data codedusing 2013 Census industry codes with data coded using Census industry codes prior to 2013. For more information on the Census industry codechanges, please visit our website at http://www.census.gov/people/io/methodology/.
While the 2011-2013 American Community Survey (ACS) data generally reflect the February 2013 Office of Management and Budget (OMB)definitions of metropolitan and micropolitan statistical areas; in certain instances the names, codes, and boundaries of the principal cities shown inACS tables may differ from the OMB definitions due to differences in the effective dates of the geographic entities.
Estimates of urban and rural population, housing units, and characteristics reflect boundaries of urban areas defined based on Census 2010 data. Asa result, data for urban and rural areas from the ACS do not necessarily reflect the results of ongoing urbanization.
Source: U.S. Census Bureau, 2011-2013 3-Year American Community Survey
Explanation of Symbols:
1. An '**' entry in the margin of error column indicates that either no sample observations or too few sample observations were
4 of 5 01/09/2015
available to compute a standard error and thus the margin of error. A statistical test is not appropriate. 2. An '-' entry in the estimate column indicates that either no sample observations or too few sample observations were available to compute anestimate, or a ratio of medians cannot be calculated because one or both of the median estimates falls in the lowest interval or upper interval of anopen-ended distribution. 3. An '-' following a median estimate means the median falls in the lowest interval of an open-ended distribution. 4. An '+' following a median estimate means the median falls in the upper interval of an open-ended distribution. 5. An '***' entry in the margin of error column indicates that the median falls in the lowest interval or upper interval of an open-ended distribution. Astatistical test is not appropriate. 6. An '*****' entry in the margin of error column indicates that the estimate is controlled. A statistical test for sampling variability is not appropriate. 7. An 'N' entry in the estimate and margin of error columns indicates that data for this geographic area cannot be displayed because the number ofsample cases is too small. 8. An '(X)' means that the estimate is not applicable or not available.