water quality, selected chemical characteristics, and ... · term spmd sample indica ted evidence...
TRANSCRIPT

Water Quality, Selected Chemical Characteristics, and Toxicity of Base Flow and Urban Stormwater in the Pearson Creek and Wilsons Creek Basins, Greene County, Missouri, August 1999 to August 2000
By Joseph M. Richards and B. Thomas Johnson
Abstract
The chemistry and toxicity of base flow and urban stormwater were characterized to determine if urban stormwater was degrading the water qual-ity of the Pearson Creek and Wilsons Creek Basins in and near the city of Springfield, Greene County, Missouri. Potentially toxic components of storm-water (nutrients, trace metals, and organic com-pounds) were identified to help resource managers identify and minimize the sources of toxicants.
Nutrient loading to the James River from these two basins (especially the Wilsons Creek Basin) is of some concern because of the potential to degrade downstream water quality. Toxicity related to dissolved trace metal constituents in stormwater does not appear to be a great concern in these two basins. Increased heterotrophic activ-ity, the result of large densities of fecal indicator bacteria introduced into the streams after storm events, could lead to associated dissolved oxygen stress of native biota. Analysis of stormwater sam-ples detected a greater number of polycyclic aro-matic hydrocarbons (PAHs) and volatile organic compounds (VOCs) than were present in base-flow samples. The number and concentrations of pesticides detected in both the base-flow and stormwater samples were similar.
Genotoxicity tests were performed to deter-mine the bioavilability of chemical contaminants and determine the potential harmful effects on aquatic biota of Pearson Creek and Wilsons Creek.
Genotoxicity was determined from dialysates from both long-term (approximately 30 days) and storm-event (3 to 5 days) semipermeable mem-brane device (SPMD) samples that were collected in each basin. Toxicity tests of SPMD samples indicated evidence of genotoxins in all SPMD samples. Hepatic activity assessment of one long-term SPMD sample indicated evidence of contam-inant uptake in fish. Chemical analyses of the SPMD samples found that relatively few pesti-cides and pesticide metabolites had been seques-tered in the lipid material of the SPMD; however, numerous PAHs and VOCs were detected in both the long-term and the storm-event exposures. It is suspected, based on the compounds detected in the SPMDs and the water samples, that the observed genotoxicity is largely the result of PAHs and VOCs that were probably derived from petroleum inputs or combustion sources. Therefore the water quality and thus the aquatic environments in the Pearson Creek and Wilsons Creek Basins are being degraded by urban derived contaminants.
INTRODUCTION
Urban areas affect the hydrologic characteristics and water quality of streams in many ways. The large amounts of impervious surface (for example, roof tops, parking lots, and roads) in urban areas increases the amount of runoff to urban streams because of the decreased infiltration capacity of the surface and
Introduction 1

because of the lack of obstructions to block the flow of water. In addition, the large population concentrated in urban areas means more automobiles with correspond-ing emissions, more construction, industrial effluent, wastewater effluent, more chemicals used for pest con-trol, maintenance of road sides, golf courses, and utility rights of way. Because of the accumulation of chemi-cals on impervious surfaces, home lawns and gardens, golf courses, parks, and recreation areas, storm events could potentially move large amounts of chemicals into surface waters and degrade the water quality of those surface waters. Storm events can improve water quality by diluting point sources such as wastewater treatment plants or industrial effluents. Water-resource managers need reliable information on the effects of urban areas on water quality to manage those resources wisely.
Springfield is the third largest city in Missouri with a 2000 population of 151,580, and has grown 7.9 percent during the last 10 years (U.S. Census Bureau, 2001a). The surrounding Greene County has a 2000 population of 240,391 and has grown 15.6 percent since 1990 (U.S. Census Bureau, 2001b). Greene County is expected to have a population increase of about 65,000 by the year 2020 (Vision 20/20, City of Springfield, written commun., 1996). Springfield is located in southwest Missouri and lies mostly within the James River Basin (fig. 1). Pearson Creek and Wil-sons Creek, both tributaries of the James River, receive most of the Springfield urban stormwater runoff. Based on the expansion in urban areas and the increasing pop-ulation in the Springfield area, streams and rivers receiving stormwater and other discharges may show adverse water-quality effects.
Section 303(d) of the Federal Clean Water Act requires that each state identify those stream segments with documented pollution problems for which exist-ing required pollution controls are not adequate to implement the state water-quality standards. For these impaired stream segments, states are required to estab-lish total maximum daily loads (TMDLs) of the identi-fied pollutant. A TMDL specifies the maximum amount of the identified pollutant allowed to be present in a water body, allocates allowable pollutant loads among sources, and provides the basis for attaining or maintaining water-quality standards within the affected water body. Pearson Creek, Wilsons Creek, and the James River are listed on Missouri's 303 (d) list for development of TMDLs. Pearson Creek and Wilsons Creek are listed as having unknown toxicity with affected reach lengths of 1.5 and 14 river miles, respec-
tively, and are major contributors to the James River water budget. If these streams carried a substantial load of contaminants this could lead to serious water-quality concerns for the James River. The James River is one of the main water sources for Table Rock Lake and has been implicated as a source of increased nutrient load-ing to the lake (D. Sheridan, James River Basin Partner-ship, oral commun., 2000). A 57-river-mile reach of the James River is considered a high priority by the Mis-souri Department of Natural Resources for establishing TMDLs for nutrients and other unknown toxic constit-uents.
Pearson Creek is on the eastern side of Spring-field in an area of growing urbanization. Because of the karst nature of the area, runoff from the commercial-ized areas to the west is captured by sinkholes and routed through complex natural conduits to Jones Spring, which becomes a tributary to Pearson Creek. Studies of the diversity of macroinvertibrate fauna in Pearson Creek suggest a decline in overall ecosystem health (N.W. Youngsteadt, City Utilities of Springfield, written commun., 1995, 1999). Whereas the sensitivity of this stream has been noted, no studies have been done to directly assess the water quality of Pearson Creek and to determine the nature of the alleged unknown toxicity.
Wilsons Creek and its tributaries drain a large part of Springfield and have shown adverse water-qual-ity effects over the last several decades. Harvey and Skelton (1968) described the hydrology of Wilsons Creek and its relation to Rader Spring during base-flow and stormflow conditions. Results of this study indicate that a substantial part of the discharge from Rader Spring contains effluent from the Southwest Wastewa-ter Treatment Plant (SWWWTP). This study also notes that seismic testing indicates numerous caves and fis-sures not apparent from topography that can carry and store large quantities of water and contaminants. A Federal Water Pollution Control Administration (now known as the U.S. Environmental Protection Agency) report (1969) stated that the initial runoff during a storm event contained inorganic chemicals, nutrients, and oxygen consuming material from urbanized areas that contributed to odor problems and fish kills in Wil-sons Creek. A study by Emmett and others (1978) found that summer storms combined with the wastewa-ter effluent resulted in severe depletion of dissolved oxygen in Wilsons Creek and the James River down-stream from Wilsons Creek. The results of the investi-gation also concluded that the upstream reach of
2 Water Quality, Selected Chemical Characteristics, and Toxicity of Base Flow and Urban Stormwater in Greene County, MO

93°4
5'93
°15'
92°4
5'
37°1
5'
36°4
5'
Sprin
gfie
ld
Tabl
eR
ock
Lak
e
Finl
ey
Cre
ek
Crane
Cre
ek
Creek
Flat
Bul
lSho
als
Lak
e
Lak
eTa
neyc
omo
River
RiverWilsons
Cre
ekPe
arso
nCr
James
Jam
es
MIS
SOUR
I
ARKA
NSA
S
Stud
yar
ea
Jam
esRi
verB
asin
Stud
yar
ea
MIS
SOUR
I Map
area
ARKA
NSA
S
BARR
Y
STON
E
CHRI
STIA
N TAN
EY
DOUG
LAS
DADE
GREE
NE
WEB
STER
WRIGHT
OZAR
K
CARR
OLL
BOON
EM
ARIO
NBE
NTO
N
LAW
REN
CE
Base
from
U.S.
Geol
ogic
alSu
rvey
digi
tal
data
1:10
0,00
0,19
900
1020
30M
ILES
Un
iver
salT
rans
vers
eM
erca
torp
roje
ctio
n Zo
ne15
0
1020
30KI
LOM
ETER
S
Figu
re1.
Loca
tion
ofst
udy
area
.
Introduction 3

Wilsons Creek is affected by runoff from the city of Springfield; the downstream reach is additionally affected by wastewater effluent. Upgrades were per-formed to the SWWWTP in 1977 and improvements in dissolved oxygen concentrations downstream were reported by the U.S. Geological Survey (USGS; Ber-kas, 1980, 1982). A study in 1989 by the National Park Service determined that chronic toxicity as indicated both by community studies and by toxicity tests was confirmed in tributaries and springs in the Wilsons Creek Basin (D.R. Nimmo, National Park Service, written commun., 1993). It further concluded that the chronic toxicity was from unknown contaminants from both point sources such as the SWWWTP and nonpoint sources such as urban stormwater. Since that time, little has been done to address water-quality conditions of the urban stormwater to Wilsons Creek.
From August 1, 1999, through August 1, 2000, the USGS, in cooperation with the Missouri Depart-ment of Natural Resources, conducted a water-quality investigation that focused on nutrients, indicator bacte-ria, trace metal constituents, organic compounds, and toxicity in Pearson Creek and Wilsons Creek. The data were used to calculate loads of selected constituents in Pearson Creek and Wilsons Creek. The toxicity part of the study was designed to determine the bioavailability of organic chemical constituents and determine their potential harmful effects on aquatic biota of Pearson Creek and Wilsons Creek. This report presents results of the study. These results provide needed information to the regulatory community for implementing sound resource management practices.
STUDY AREA
The study area includes most of the Pearson Creek Basin and the Wilsons Creek Basin (fig. 2). The following sections describe the data collection stations, and the physiography, geology, land use/land cover, and climate of the study area.
Data Collection Stations
Six sampling sites were chosen in two different basins (Pearson Creek and Wilsons Creek) to evaluate the base-flow and stormwater quality (fig. 2, table 1). Two sites were chosen in the Pearson Creek Basin, and four sites were chosen in the Wilsons Creek Basin. All sampling sites are located in Greene County, Missouri,
and in hydrologic unit 11010002. Gaging stations were collocated at the sampling sites to provide the neces-sary flow information needed to calculate the constitu-ent loads.
The Jones Branch continuous streamflow gaging station (hereinafter referred to as gaging station) (07050680, fig. 2, table 1) was established July 22, 1999. The control is a concrete dam at the outlet of the pond. Jones Spring provides most of the flow that passes the Jones Branch gage.
The Pearson Creek gaging station (07050690, fig. 2, table 1) was established July 21, 1999. During low flow the channel is split and is composed of rocks and gravel. The control is a gravel riffle, and both banks are low and subject to overflow.
The Wilsons Creek at Scenic Drive in Spring-field gaging station (07052000, fig. 2, table 1) was established May 6, 1932, discontinued in November 1939, re-established June 28, 1973, discontinued Sep-tember 23, 1982, and re-established May 27, 1998. Wastewater from commercial plants enters the creek upstream from the gaging station. The low water con-trol is a gravel riffle downstream from the gaging sta-tion. The channel is the control for medium and high stages. The left bank is forested and sufficiently high to prevent overflow onto the road; the right bank is culti-vated, and water will overflow at an extremely high stage.
The Wilsons Creek near Springfield gaging sta-tion (07052100, fig. 2, table 1) was established Septem-ber 21, 1972, discontinued September 20, 1982, and re-established May 27, 1998. The gaging station is approximately 1 river mile upstream from the SWW-WTP. The low water control is a solid rock riffle about 100 ft (feet) downstream from the gaging station, and the channel is the control for medium and high stages. The left bank is high, brush covered, and is not subject to overflow; the right bank is low with scattered trees, and water will overflow at about an 8-ft stage.
The South Creek gaging station (07052120, fig. 2, table 1) was established May 29, 1998. The low water control is a gravel riffle, and the channel is the control for medium and high stages. The left bank is high and is not subject to overflow; the right bank is low with some trees, and water will overflow at about an 8-ft stage.
4 Water Quality, Selected Chemical Characteristics, and Toxicity of Base Flow and Urban Stormwater in Greene County, MO

01
23
45
MIL
ES
01
23
45
KILO
MET
ERS
Sink
hole
loca
tions
from
Wai
tean
dTh
omps
on(1
993)
Jone
sSp
ring
rech
arge
area
from
K.C.
Thom
pson
(Sou
thw
estM
isso
uriS
tate
Univ
ersi
ty,
writ
ten
com
mun
.,19
87)
Sprin
gfie
ld
Broo
klin
e
Will
ard
Battl
efie
ld
Stra
fford
JON
ESSP
RIN
GRE
CHAR
GEAR
EA
BASI
NBO
UNDA
RY
SUBB
ASIN
BOUN
DARY
U.S.
GEOL
OGIC
ALSU
RVEY
GAGI
NG
STAT
ION
AND
IDEN
TIFI
ER
PREC
IPIT
ATIO
NDA
TACO
LLEC
TION
SITE
0705
2100
EXPL
ANAT
ION
Base
from
U.S.
Geol
ogic
alSu
rvey
digi
tald
ata,
1:10
0,00
0,19
90Un
iver
salT
rans
vers
eM
erca
torp
roje
ctio
nZo
ne15
City
boun
darie
sfro
mU.
S.Ce
nsus
data
,200
0
SIN
KHOL
E
93°2
2'30
"
37°1
5'
37°0
7'30
"
93°1
5'93
°07'
30"
160
60
65
60
44
44
13
Pear
son
Creek
Sout
hC
reek
Sout
hD
ry
Sac
Rive
r
JonesB
r James
Riv
er
Lak
eSp
ring
field
Creek
Wilson
s
Jone
sSp
ring
0705
0680
0705
0690
0705
2000
0705
2100
0705
2120
Sout
hwes
tW
aste
wat
erTr
eatm
entP
lant
0705
2160
Sprin
gfie
ld-
Bran
son
Regi
onal
Airp
ort
Study Area 5

Table 1. Location, drainage area, and dominant land cover type for the sampling sites in the Pearson Creek and Wilsons Creek Basins
Station nameStation number
Latitude (degrees-minutes-seconds)
Longitude(degrees-minutes-seconds)
Drainage area
(square miles)
Dominant land cover type
(fig. 3)
Jones Branch 07050680 37º11'12" 93º12'04" 1.29 Cool-season grassland
Pearson Creek 07050690 37º10'40" 93º11'53" 20.9 Cool-season grassland
Wilsons Creek at Scenic Drive 07052000 37º11'12" 93º19'52" 19.4 Urban impervious
Wilsons Creek near Springfield 07052100 37º10'06" 93º22'14" 35.3 Cool-season grassland
South Creek 07052120 37º09'16" 93º21'51" 10.5 Cool-season grassland
Wilsons Creek near Battlefield 07052160 37º07'02" 93º24'14" 58.2 Cool-season grassland
The Wilsons Creek near Battlefield gaging sta-tion (07052160, fig. 2, table 1) was established March 14, 1968, discontinued October 14, 1970, re-estab-lished September 20, 1972, discontinued September 16, 1982, and re-established July 22, 1999. It is down-stream from the SWWWTP. The low water control is a gravel riffle in a rock bottom channel, and the channel is the control for medium and high stages. The left bank is high and is not subject to overflow; the right bank is low with some trees, and water will overflow at about a 6-ft stage.
Physiography and Geology
The study area lies on the eastern edge of the Springfield Plateau physiographic province (Fenne-man, 1938). Mississippian-age carbonate rocks (mainly limestone) dominate the surficial geology of the Springfield Plateau in the study area. Small, iso-lated, erosional remnants of Pennsylvanian-age sand-stone and shale crop out in the southwest part of the study area. Land-surface altitudes range from near 1,095 ft above sea level to more than 1,500 ft. A topo-graphic ridge that trends from east-central Greene County to western Christian County and passes through Springfield forms a main drainage divide (figs. 1 and 2). Streams in the study area generally follow courses that trend to the southwest. The headwaters of Wilsons Creek are in the city of Springfield, and the headwaters of Pearson Creek are east of Springfield near the city of Strafford.
The bedrock limestones and cherty limestones are fractured and extensively weathered. Photolinea-ment interpretations suggest probable joint structure
and fracture patterns in a northwest to southeast and northeast to southwest orientation (Waite and Thomp-son, 1993). Locally, these joint patterns have been observed to have some solutional enlargement and are suspected to be conduits for subsurface water (K.C. Thompson, Southwest Missouri State University, writ-ten commun., 1987).
Surface expressions of the weathering of the car-bonate rocks are most prominently displayed as karst topography. The karst topography in the study area consists of features such as springs, sinkholes, caves, solution enlarged fractures, and losing streams. An area with a sinkhole density of greater than 10 sinkholes per 100 mi2 (square miles) is classified by Harvey (1980) as an area of primary karst, such as the Pearson and Wilsons Creek Basins. Sinkholes are so prevalent in the Springfield urbanized area that they are sometimes used as stormwater conduits. All of the subbasins in the study area contain sinkholes (fig. 2) and have the poten-tial of rerouting surface flow from one surface drainage to another through the ground-water system.
An example of this phenomenon was identified by a study conducted on the Jones Spring recharge area (K.C. Thompson, Southwest Missouri State University, written commun., 1987, 1988). Most of the surface flow in the Jones Branch subbasin of the Pearson Creek Basin (fig. 2), comes from Jones Spring. The surface drainage area of Jones Branch determined from a topographic map is 1.29 mi2. The approximate recharge area of Jones Spring (fig. 2) determined from dye trace experiments was 3.95 mi2 (K.C. Thompson, Southwest Missouri State University, written commun., 1987, 1988). As a result of the karst recharge to Jones Spring, Jones Branch captures some runoff from the adjacent Pearson Creek, Wilsons Creek, and James River Basins.
6 Water Quality, Selected Chemical Characteristics, and Toxicity of Base Flow and Urban Stormwater in Greene County, MO

Land Use/Land Cover and Climate
The study area consists of most of two main Basins (Pearson Creek and Wilsons Creek) that drain the city of Springfield and surrounding rural areas. In 1999, the National Aeronautics and Space Administra-tion contracted Positive Systems, of Whitefish, Mon-tana, to collect 1-m (meter)-resolution multispectral imagery using the Airborne Data Acquisition and Reg-istration (ADAR) 5500 system as part of a scientific data purchase. Part of the acquired data is for the met-ropolitan area of Springfield. The impervious features in the study area were mapped using the ADAR imag-ery in combination with Landsat thematic mapper sat-ellite imagery acquired between 1991 and 1993 and classified by Missouri Resource Assessment Partner-ship (MoRAP) (1999). To supplement the Landsat data outside the ADAR data area, 1:24,000-scale digital road data were buffered to a width of 10 m (32.8 ft) and added as impervious surface to the final map. The majority of the urban area was mapped using the ADAR data, and the surrounding rural area was mapped with the lower resolution (30-m) Landsat data supplemented with the digital road data. The Landsat data were used to provide a general land use/land cover classification (fig. 3) and to determine the approximate relative percentage of the various land cover classes in each subbasin (table 2). An impervious surface map using the higher resolution ADAR data in the urban area of the city is shown in figure 4. The proportion of impervious surface for each basin derived from the combination of the ADAR and Landsat data is shown at the bottom of table 2. On table 2, two additional col-umns (Jones Spring and Jones Spring plus Jones Branch) were added to account for the capture of sur-face runoff by the sinkhole recharge area of Jones Spring.
The four dominant land cover classes (fig. 3) in the study area are urban impervious, urban vegetated, cool-season grassland, and deciduous forest. The sub-basin with the largest percentage of impervious surface derived from a combination of ADAR and Landsat data is the Wilsons Creek at Scenic Drive site (32.0 percent). The Jones Spring recharge area is approximately 3.95 mi2 and is 32.9 percent impervious surface. When com-bined, the Jones Branch drainage area and the Jones Spring recharge area collectively are 31.1 percent impervious surface. The least urbanized subbasin is the Pearson Creek site (14.7 percent impervious surface).
The area is located in a temperate region that is characterized by moderate temperatures and rainfall. The mean annual rainfall is approximately 40 in/yr (inches per year), the mean annual runoff for the area is approximately 12 in/yr, and the estimated mean annual evapotranspiration is approximately 29 in/yr (Missouri Department of Natural Resources, 1997).
DATA COLLECTION METHODS
Samples were collected during base-flow condi-tions and during storm events at six sites (table 3, fig. 2) between August 1999 and August 2000. All streams were measured for physical properties such as dis-solved oxygen, pH, specific conductance, and temper-ature; samples were analyzed for major inorganic constituents, nutrients, fecal indicator bacteria densi-ties, selected trace metal constituents, and selected organic constituents using a total ion chromatogram (TIC) scan (tables 4 and 5, at the back of this report). Two sites, Pearson Creek and Wilsons Creek near Bat-tlefield, were sampled, and the samples were analyzed for selected pesticides and pesticide degradation prod-ucts or metabolites (table 6, at the back of this report). Additionally at these two sites, toxicity was determined using sample dialysates from semipermeable mem-brane devices (SPMD) that were deployed in the creeks. The SPMD sequesters lipophilic compounds from the environment immediately and continuously on exposure to those compounds. The SPMD dialy-sates also were analyzed for selected general pesticides and selected metabolites (table 7, at the back of this report), selected organochlorine pesticides, selected organochlorine pesticide metabolites, total polychlori-nated biphenyls (PCBs) (table 8, at the back of this report), polycyclic aromatic hydrocarbons (PAHs), and selected volatile organic compounds (VOCs) (table 9, at the back of this report).
Base-Flow Samples
Site visits during base flow and storm events involved obtaining quantitative stream data. Gage height was recorded by a gaging station that is referenced to a wire weight suspended from the bridge, a staff gage on the stream bank, or a reference point cut into a perma-nent structure near the gage control structure.
Data Collection Methods 7

8 Water Quality, Selected Chemical Characteristics, and Toxicity of Base Flow and Urban Stormwater in Greene County, MO

Figu
re4.
Impe
rvio
ussu
rface
inth
ePe
arso
nCr
eek
and
Wils
ons
Cree
kBa
sins
.
01
23
45
MIL
ES
01
23
45
KILO
MET
ERS
EXPL
ANAT
ION
Impe
rvio
ussu
rface
data
mod
ified
from
the
Mis
sour
iRes
ourc
eAs
sess
men
tPar
tner
ship
(199
9)an
dda
taon
file
atth
eU.
S.Ge
olog
ical
Surv
eyof
fice,
Rolla
,Mis
sour
i
IMPE
RVIO
USSU
RFAC
E
JON
ESSP
RIN
GRE
CHAR
GEAR
EA
BASI
NBO
UNDA
RY
SUBB
ASIN
BOUN
DARY
U.S.
GEOL
OGIC
ALSU
RVEY
GAGI
NG
STAT
ION
AND
IDEN
TIFI
ER07
0521
00
Base
from
U.S.
Geol
ogic
alSu
rvey
digi
tal
data
1:10
0,00
0,19
90Un
iver
salT
rans
vers
eM
erca
torp
roje
ctio
nZo
ne15
93°2
2'30
"
37°1
5'
37°0
7'30
"
93°1
5'93
°07'
30"
Pear
son
Creek
Sout
hC
reek
Sout
hD
ry
Sac
Rive
r
James
Riv
er
Lak
eSp
ring
field
Creek
Wilson
s
Jone
sSp
ringB
r
Jones07
0506
80
0705
0690
0705
2000
0705
2100
0705
2120
0705
2160
Data Collection Methods 9
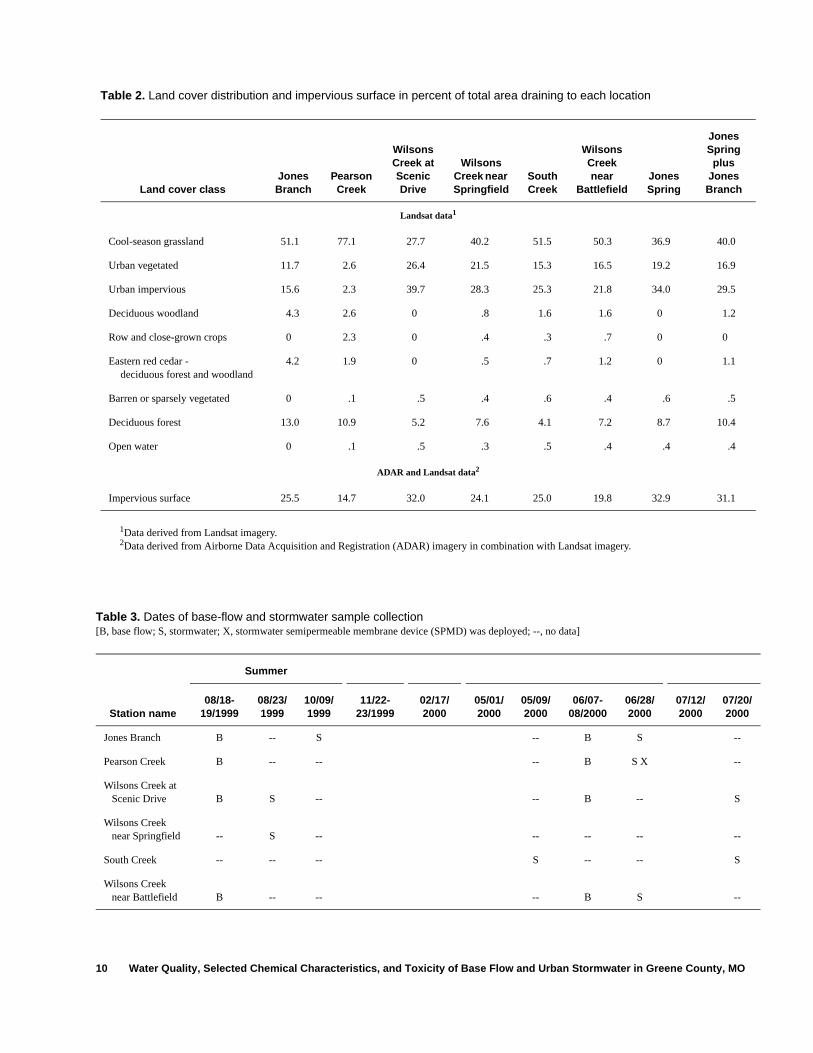
Table 2. Land cover distribution and impervious surface in percent of total area draining to each location
Land cover classJones Branch
Pearson Creek
Wilsons Creek at Scenic Drive
Wilsons Creek near Springfield
South Creek
Wilsons Creek near
BattlefieldJones Spring
Jones Spring
plus Jones Branch
Landsat data1
Cool-season grassland 51.1 77.1 27.7 40.2 51.5 50.3 36.9 40.0
Urban vegetated 11.7 2.6 26.4 21.5 15.3 16.5 19.2 16.9
Urban impervious 15.6 2.3 39.7 28.3 25.3 21.8 34.0 29.5
Deciduous woodland 4.3 2.6 0 .8 1.6 1.6 0 1.2
Row and close-grown crops 0 2.3 0 .4 .3 .7 0 0
Eastern red cedar - deciduous forest and woodland
4.2 1.9 0 .5 .7 1.2 0 1.1
Barren or sparsely vegetated 0 .1 .5 .4 .6 .4 .6 .5
Deciduous forest 13.0 10.9 5.2 7.6 4.1 7.2 8.7 10.4
Open water 0 .1 .5 .3 .5 .4 .4 .4
ADAR and Landsat data2
Impervious surface 25.5 14.7 32.0 24.1 25.0 19.8 32.9 31.1
1Data derived from Landsat imagery.2Data derived from Airborne Data Acquisition and Registration (ADAR) imagery in combination with Landsat imagery.
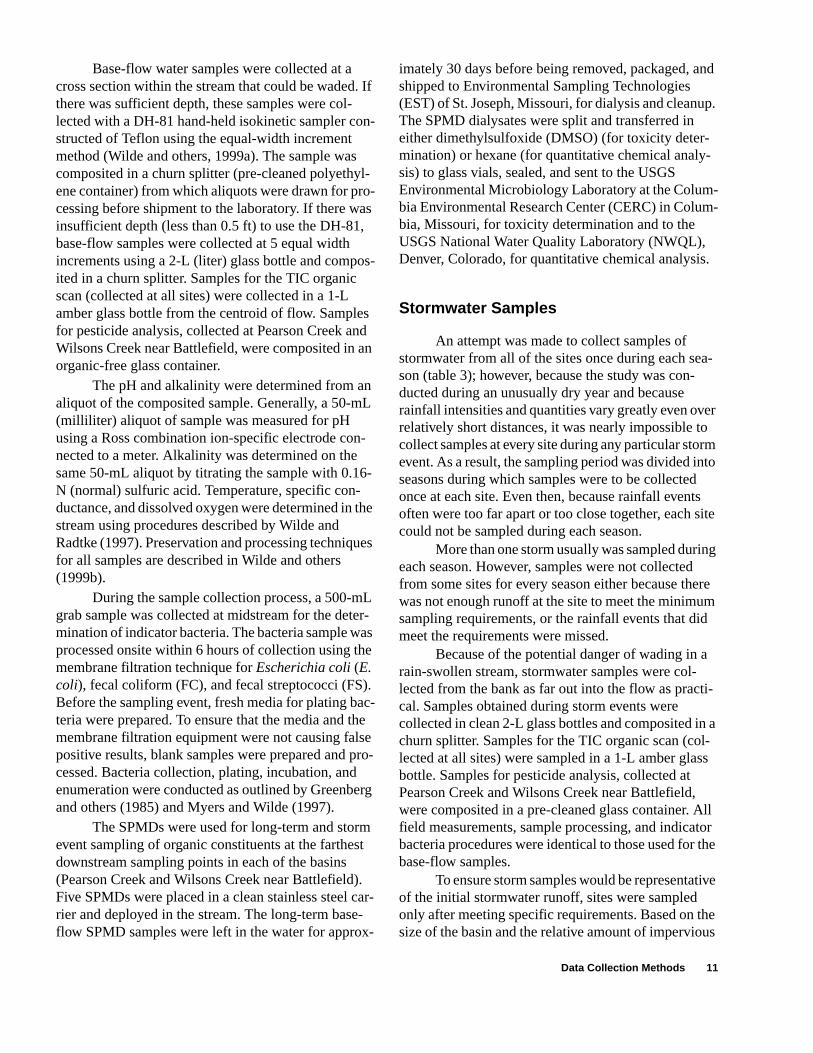
Table 3. Dates of base-flow and stormwater sample collection[B, base flow; S, stormwater; X, stormwater semipermeable membrane device (SPMD) was deployed; --, no data]
Station name
Summer Fall Winter Spring Summer
08/18-19/1999
08/23/1999
10/09/1999
11/22-23/1999
02/17/2000
05/01/2000
05/09/2000
06/07-08/2000
06/28/2000
07/12/2000
07/20/2000
Jones Branch B -- S S -- -- -- B S S --
Pearson Creek B -- -- S -- -- -- B S X S X --
Wilsons Creek at Scenic Drive B S -- S S S -- B -- -- S
Wilsons Creek near Springfield -- S -- S S S -- -- -- S --
South Creek -- -- -- S S -- S -- -- -- S
Wilsons Creek near Battlefield B -- -- S S X -- -- B S S X --
10 Water Quality, Selected Chemical Characteristics, and Toxicity of Base Flow and Urban Stormwater in Greene County, MO
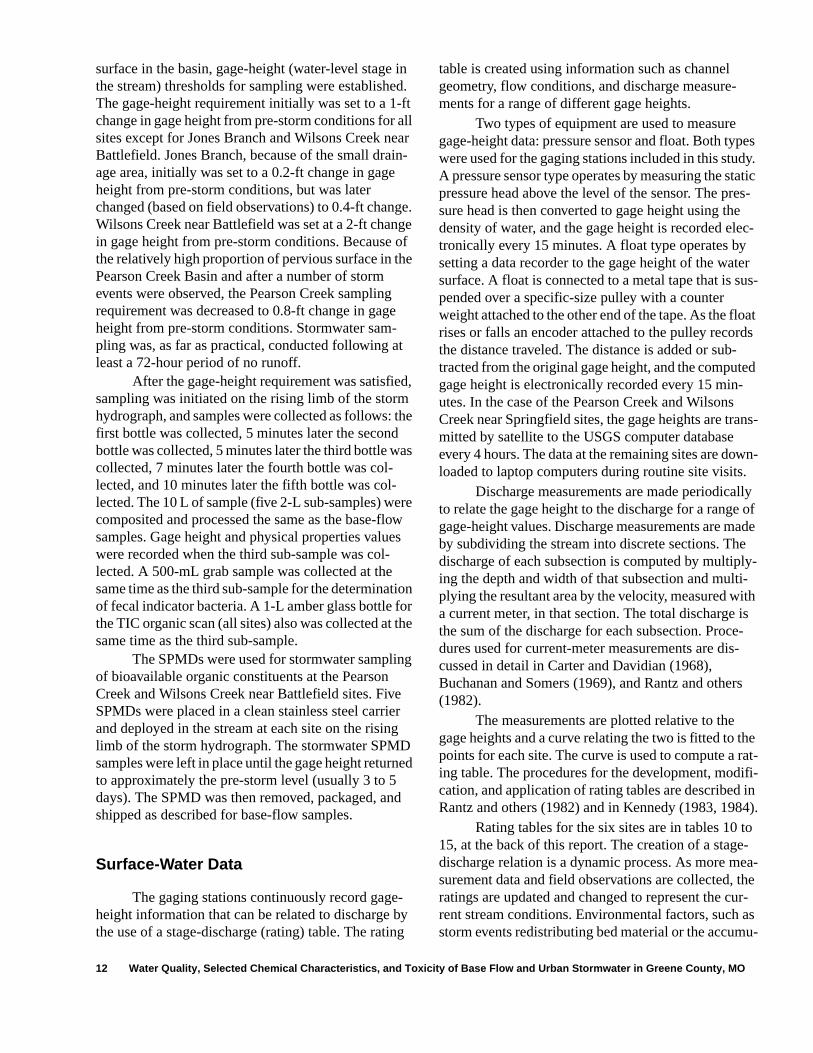
Base-flow water samples were collected at a cross section within the stream that could be waded. If there was sufficient depth, these samples were col-lected with a DH-81 hand-held isokinetic sampler con-structed of Teflon using the equal-width increment method (Wilde and others, 1999a). The sample was composited in a churn splitter (pre-cleaned polyethyl-ene container) from which aliquots were drawn for pro-cessing before shipment to the laboratory. If there was insufficient depth (less than 0.5 ft) to use the DH-81, base-flow samples were collected at 5 equal width increments using a 2-L (liter) glass bottle and compos-ited in a churn splitter. Samples for the TIC organic scan (collected at all sites) were collected in a 1-L amber glass bottle from the centroid of flow. Samples for pesticide analysis, collected at Pearson Creek and Wilsons Creek near Battlefield, were composited in an organic-free glass container.
The pH and alkalinity were determined from an aliquot of the composited sample. Generally, a 50-mL (milliliter) aliquot of sample was measured for pH using a Ross combination ion-specific electrode con-nected to a meter. Alkalinity was determined on the same 50-mL aliquot by titrating the sample with 0.16-N (normal) sulfuric acid. Temperature, specific con-ductance, and dissolved oxygen were determined in the stream using procedures described by Wilde and Radtke (1997). Preservation and processing techniques for all samples are described in Wilde and others (1999b).
During the sample collection process, a 500-mL grab sample was collected at midstream for the deter-mination of indicator bacteria. The bacteria sample was processed onsite within 6 hours of collection using the membrane filtration technique for Escherichia coli (E. coli), fecal coliform (FC), and fecal streptococci (FS). Before the sampling event, fresh media for plating bac-teria were prepared. To ensure that the media and the membrane filtration equipment were not causing false positive results, blank samples were prepared and pro-cessed. Bacteria collection, plating, incubation, and enumeration were conducted as outlined by Greenberg and others (1985) and Myers and Wilde (1997).
The SPMDs were used for long-term and storm event sampling of organic constituents at the farthest downstream sampling points in each of the basins (Pearson Creek and Wilsons Creek near Battlefield). Five SPMDs were placed in a clean stainless steel car-rier and deployed in the stream. The long-term base-flow SPMD samples were left in the water for approx-
imately 30 days before being removed, packaged, and shipped to Environmental Sampling Technologies (EST) of St. Joseph, Missouri, for dialysis and cleanup. The SPMD dialysates were split and transferred in either dimethylsulfoxide (DMSO) (for toxicity deter-mination) or hexane (for quantitative chemical analy-sis) to glass vials, sealed, and sent to the USGS Environmental Microbiology Laboratory at the Colum-bia Environmental Research Center (CERC) in Colum-bia, Missouri, for toxicity determination and to the USGS National Water Quality Laboratory (NWQL), Denver, Colorado, for quantitative chemical analysis.
Stormwater Samples
An attempt was made to collect samples of stormwater from all of the sites once during each sea-son (table 3); however, because the study was con-ducted during an unusually dry year and because rainfall intensities and quantities vary greatly even over relatively short distances, it was nearly impossible to collect samples at every site during any particular storm event. As a result, the sampling period was divided into seasons during which samples were to be collected once at each site. Even then, because rainfall events often were too far apart or too close together, each site could not be sampled during each season.
More than one storm usually was sampled during each season. However, samples were not collected from some sites for every season either because there was not enough runoff at the site to meet the minimum sampling requirements, or the rainfall events that did meet the requirements were missed.
Because of the potential danger of wading in a rain-swollen stream, stormwater samples were col-lected from the bank as far out into the flow as practi-cal. Samples obtained during storm events were collected in clean 2-L glass bottles and composited in a churn splitter. Samples for the TIC organic scan (col-lected at all sites) were sampled in a 1-L amber glass bottle. Samples for pesticide analysis, collected at Pearson Creek and Wilsons Creek near Battlefield, were composited in a pre-cleaned glass container. All field measurements, sample processing, and indicator bacteria procedures were identical to those used for the base-flow samples.
To ensure storm samples would be representative of the initial stormwater runoff, sites were sampled only after meeting specific requirements. Based on the size of the basin and the relative amount of impervious
Data Collection Methods 11
surface in the basin, gage-height (water-level stage in the stream) thresholds for sampling were established. The gage-height requirement initially was set to a 1-ft change in gage height from pre-storm conditions for all sites except for Jones Branch and Wilsons Creek near Battlefield. Jones Branch, because of the small drain-age area, initially was set to a 0.2-ft change in gage height from pre-storm conditions, but was later changed (based on field observations) to 0.4-ft change. Wilsons Creek near Battlefield was set at a 2-ft change in gage height from pre-storm conditions. Because of the relatively high proportion of pervious surface in the Pearson Creek Basin and after a number of storm events were observed, the Pearson Creek sampling requirement was decreased to 0.8-ft change in gage height from pre-storm conditions. Stormwater sam-pling was, as far as practical, conducted following at least a 72-hour period of no runoff.
After the gage-height requirement was satisfied, sampling was initiated on the rising limb of the storm hydrograph, and samples were collected as follows: the first bottle was collected, 5 minutes later the second bottle was collected, 5 minutes later the third bottle was collected, 7 minutes later the fourth bottle was col-lected, and 10 minutes later the fifth bottle was col-lected. The 10 L of sample (five 2-L sub-samples) were composited and processed the same as the base-flow samples. Gage height and physical properties values were recorded when the third sub-sample was col-lected. A 500-mL grab sample was collected at the same time as the third sub-sample for the determination of fecal indicator bacteria. A 1-L amber glass bottle for the TIC organic scan (all sites) also was collected at the same time as the third sub-sample.
The SPMDs were used for stormwater sampling of bioavailable organic constituents at the Pearson Creek and Wilsons Creek near Battlefield sites. Five SPMDs were placed in a clean stainless steel carrier and deployed in the stream at each site on the rising limb of the storm hydrograph. The stormwater SPMD samples were left in place until the gage height returned to approximately the pre-storm level (usually 3 to 5 days). The SPMD was then removed, packaged, and shipped as described for base-flow samples.
Surface-Water Data
The gaging stations continuously record gage-height information that can be related to discharge by the use of a stage-discharge (rating) table. The rating
table is created using information such as channel geometry, flow conditions, and discharge measure-ments for a range of different gage heights.
Two types of equipment are used to measure gage-height data: pressure sensor and float. Both types were used for the gaging stations included in this study. A pressure sensor type operates by measuring the static pressure head above the level of the sensor. The pres-sure head is then converted to gage height using the density of water, and the gage height is recorded elec-tronically every 15 minutes. A float type operates by setting a data recorder to the gage height of the water surface. A float is connected to a metal tape that is sus-pended over a specific-size pulley with a counter weight attached to the other end of the tape. As the float rises or falls an encoder attached to the pulley records the distance traveled. The distance is added or sub-tracted from the original gage height, and the computed gage height is electronically recorded every 15 min-utes. In the case of the Pearson Creek and Wilsons Creek near Springfield sites, the gage heights are trans-mitted by satellite to the USGS computer database every 4 hours. The data at the remaining sites are down-loaded to laptop computers during routine site visits.
Discharge measurements are made periodically to relate the gage height to the discharge for a range of gage-height values. Discharge measurements are made by subdividing the stream into discrete sections. The discharge of each subsection is computed by multiply-ing the depth and width of that subsection and multi-plying the resultant area by the velocity, measured with a current meter, in that section. The total discharge is the sum of the discharge for each subsection. Proce-dures used for current-meter measurements are dis-cussed in detail in Carter and Davidian (1968), Buchanan and Somers (1969), and Rantz and others (1982).
The measurements are plotted relative to the gage heights and a curve relating the two is fitted to the points for each site. The curve is used to compute a rat-ing table. The procedures for the development, modifi-cation, and application of rating tables are described in Rantz and others (1982) and in Kennedy (1983, 1984).
Rating tables for the six sites are in tables 10 to 15, at the back of this report. The creation of a stage-discharge relation is a dynamic process. As more mea-surement data and field observations are collected, the ratings are updated and changed to represent the cur-rent stream conditions. Environmental factors, such as storm events redistributing bed material or the accumu-
12 Water Quality, Selected Chemical Characteristics, and Toxicity of Base Flow and Urban Stormwater in Greene County, MO

lation of debris on the control, change the stage-dis-charge relation periodically. The rating tables presented in this report are the most up-to-date (April 2001) rep-resentation of the stage-discharge relation that existed for these six sites.
Toxicity
The SPMD is designed to mimic the key aspects of the bioconcentration process and to passively sample bioavailable organic compounds. Short-term toxicity tests can rapidly detect substances potentially harmful to the aquatic biota that are sequestered in SPMDs (Johnson, 1998; Johnson and others, 2000).
Fluoroscan
The fluoroscan is a test that can help to identify the compounds that may be present in SPMD sample dialysates. If the sample fluoresces when it is exposed to ultraviolet light, then aromatic organic compounds are likely present in the sample. In a darkened room, SPMD sample dialysates were placed about 3 centime-ters from a portable light with emissions at wavelengths of 280 nanometers. To detect the presence of fluores-cent compounds, each sample was viewed under ultra-violet light for about 1 minute, and then compared with solvent controls, trip blanks, and positive controls. The appearance of a distinctive glow was considered a “positive” response and evidence of aromatic com-pounds, probably a PAH with three or more rings. Two-ringed PAHs do not fluoresce under ultraviolet light of this wavelength.
Acute Toxicity
Acute toxicity was determined using the Micro-tox acute toxicity test according to the standard proto-col described in Microbics Corporation (1992). Validation of Microtox acute toxicity test in single and complex mixtures of pesticides, PCBs, petroleum prod-ucts, and PAHs has been previously reported by Kaiser and Palabrica (1991) and Johnson and Long (1998).
The carrier solvent, DMSO, used by EST of St. Joseph, Missouri, for the SPMD dialysates for use in toxicity determinations was contaminated. The values of the solvent blanks were “toxic” with values several orders of magnitude less than those of the normal trip blank and SPMD controls. The dialysates contami-nated with DMSO negated the Microtox acute toxicity test.
Genotoxicity
In the last few decades, genetic toxicology has emerged with the generally accepted view that some chemicals (genotoxins) can induce deoxyribonucleic acid (DNA) damage in cells that may result in lethality, mutagenesis, and carcinogenesis (Wurgler and Kram-ers, 1992). The Mutatox bioassay is a method to mea-sure the genotoxicity of an environmental sample. Mutatox bioassays were conducted according to the protocol described by Johnson (1992a, 1992b, 1993, 2000). For the Mutatox bioassay, a nonglowing or dark mutant strain of luminescent bacteria is exposed to a test substance, and the amount of light emitted is mea-sured with a luminometer; sample-induced reversion from the nonglowing to glowing type bacteria is used to indicate the genotoxicity of the sample. Because most simple organism cells, such as the dark mutant strain of Vibrio bacteria, fail to duplicate vertebrate metabolism of contaminants into potential DNA-damaging agents, a mammalian metabolic activation system was incorpo-rated (Johnson, 1992a, 1992b, 1993, 2000). Mamma-lian S9 is the post-mitochondrial supernatant fraction obtained after centrifugation of a cellular homogenate (usually livers of rats; which is a mammalian surrogate for humans) at 9,000 times gravity (S9). The subcellu-lar fraction contains enzymes that are important in detoxification reactions in mammals. Mammalian S9 is used frequently to activate promutants to the active mutant forms in genotoxicity tests. Validation of Muta-tox in single and complex mixtures of pesticides, PCBs, petroleum products, and PAHs has been previ-ously reported by Johnson and Long (1998). Test sam-ples were serially diluted in a mixture of bacteria—1 percent mammalian S9—buffer over a 100-fold dose range, incubated in a water bath at 37 ºC (degrees Cel-sius) for 15 minutes to activate the mammalian S9, and then incubated at 27 ºC overnight. DMSO, a known compatible carrier solvent with Mutatox (Johnson, 1992a), was used as the standard solvent in this study. Benzo[a]pyrene was used as the standard positive con-trol and DMSO was used as the negative control. A genotoxic response of the luminescent bacteria was determined by measuring the light intensity. A positive response was defined as a light value of at least three times the light intensity of the solvent control blank. The dose-response number was defined as the number of positive responses recorded at different concentra-tions per dilution series. A dilution series that con-tained two or more positive responses at two or more different concentrations was designated as “geno-
Data Collection Methods 13

toxic”. When the series contained only one positive response, it was designated “suspect”. When the series contained no positive response, it was designated “neg-ative”. Each test sample was determined to be geno-toxic, suspect, or negative only after replicate dilution series were performed on different days.
Hepatic Activity Assessment
Hepatic activity assessment, a measure of the simulation of specific enzyme production in the livers of living organisms, can be used to indicate the pres-ence and amounts of foreign substances in environmen-tal samples and their potential role in toxic effects. Mixed function oxygenase, a liver enzyme that is part of the S9 fraction, is essential for the metabolism of PAHs and PCBs in living organisms. Exposure of fish to PAHs and PCBs stimulates the production of these enzymes. Cytochrome P450-dependent 7-ethoxyre-sorufin-O-deethylase (EROD) activity is a highly sen-sitive indicator of contaminant uptake in fish and provides evidence of the stimulation of the production of specific enzymes, cytochrome P450-dependent monooxygenases, by foreign compounds (Whyte and others, 2000).
Channel catfish (Ictalurus punctatus), obtained from a commercial source, were maintained in a flow-through raceway at 15 ºC and cultured according to the methods of Brauhn and Schoettger (1975). The fish were mixed sexes, healthy, and vigorous; each weighed between 750 and 1,000 grams. Water conditions were pH of 7.8, alkalinity of 255 mg/L (milligrams per liter), and total hardness 283 mg/L. To increase liver enzy-matic activity, catfish were injected once intraperito-neally with a dialysate from the long-term SPMD that was deployed on August 19, 1999, at Wilsons Creek near Battlefield. The dialysate was dissolved in corn oil, warmed, and sonicated a few minutes to increase solubility before injection. After injection, each fish was segregated for 5 days in a flow-through aquarium at 20 ºC without feeding. Control fish received either a corn oil injection or no injection.
After 5 days, the S9 fraction was prepared from each fish. The liver was immediately removed through a ventral incision avoiding gut and bile contamination, placed on a cold pre-weighed beaker, covered with alu-minum foil, and weighed. The fish S9 fraction was pre-pared as described by Johnson (1989), who modified the rodent activation method of Maron and Ames (1983). All steps of the procedures were carried out at 0 to 3 ºC: cold solutions, chilled glassware, and refrig-
erated equipment. The liver was minced with sterile scissors and washed 5 to 6 times with 0.15-M (molar) potassium chloride (KCl) solution to remove pooled nucleated red blood cells and hemoglobin. The minced liver was covered with 0.15-M KCl at a ratio of 2 to 1 (KCl volume to liver volume) and rapidly homoge-nized. Tissue grinding was minimal to avoid excessive heat production and possible loss of enzymatic activity. The homogenate was centrifuged 10 minutes, and the supernatant, the S9 fraction, saved. This fraction was immediately placed in sterile disposable cryogenic tubes, labeled, frozen, and stored in liquid nitrogen. The standard EROD method (Pohl and Fouts, 1980) was used to measure the changes in mixed function oxygenase activity of the S9 fraction.
Quality Assurance/Quality Control
The components of analytical variability (uncer-tainty) can be estimated when quality-assurance (QA) and quality-control (QC) samples of the correct types and quantities are incorporated into measurement pro-cedures. The USGS NWQL incorporates numerous QA/QC samples to ensure that the measurement sys-tem is functioning properly. In addition to the labora-tory QA/QC procedures, QA/QC samples were collected onsite.
The most common error attributable to field pro-cedures is contamination of the sample matrix. Two general forms of contamination occur—systematic and erratic. The goal of the QA program is to decrease the systematic component and provide evidence of the erratic component by collecting replicate samples and filtration, equipment, field, and trip blank samples. The QA/QC samples made up approximately 10 percent of all samples collected for the study.
Replicate Samples
Replicate samples were collected and analyzed to determine the precision of sampling, processing, and onsite analysis. Generally, a replicate sample was col-lected immediately after an environmental sample using the same equipment and sampling techniques. Both the replicate and environmental samples were analyzed at the NWQL using identical analytical tech-niques. Analysis of the replicate samples indicated that the laboratory analysis and the sampling procedure were producing consistent results.
14 Water Quality, Selected Chemical Characteristics, and Toxicity of Base Flow and Urban Stormwater in Greene County, MO

Blank Samples
Water-quality blank samples were collected to determine the cleanliness of the filtration and sampling equipment and to ensure that the sample collection pro-cedures were free from contamination. Analysis of all water-quality blank samples indicated that minimal contamination occurred during the base-flow and stormwater sampling process.
Blank SPMD samples were collected onsite to ensure that the SPMDs were not affected by atmo-spheric contamination. The nature of the SPMD device allows it to sequester lipophilic compounds from the environment immediately on exposure to those com-pounds. The device can sequester compounds from any environmental media (air, water, and/or sediment) that it contacts. During the deployment and recovery of a base-flow or stormwater SPMD, a blank SPMD was exposed to the atmosphere onsite. A total of seven SPMD blank samples were collected.
Because of the sensitivity of the SPMD sampling device and the precision of the analysis, target com-pounds were detected in some of the blank samples. Most all of the detections were less than the reporting limits of the analyses, and the concentrations were esti-mated by the laboratory. The pesticide 1,1-dichloro-2,2-bis(p-chlorophenyl)ethylene (DDE) was detected twice in the blank samples at concentrations of 1.24 and 1.98 µg/kg (micrograms per kilogram; reporting limit 1.0 µg/kg). Cis-chlordane was detected twice in blank samples at concentrations of 2.9 and 3.1 µg/kg (reporting limit 5.0 µg/kg). Trans-chlordane was detected three times in blank samples at concentrations from 2.9 to 4.0 µg/kg (reporting limit 5.0 µg/kg). Acri-dine was detected once in blank samples at a concentra-tion of 76.9 µg/kg (reporting limit 250 µg/kg). Bis(2-ethylhexyl)phthalate and di-n-butylphthalate were detected in every blank sample, and concentrations ranged from 65.6 to 221 µg/kg and 30.4 to 113 µg/kg, respectively (reporting limit 250 µg/kg). Butylben-zylphthalate was detected twice in blank samples at concentrations of 87.8 and 90.1 µg/kg (reporting limit 250 µg/kg). Diethylphthalate was detected twice in blank samples at concentrations of 85.6 and 91.3 µg/kg (reporting limit 250 µg/kg). 4,5-Methylenephenanath-rene was detected once in blank samples at a concentra-tion of 47.6 µg/kg (reporting limit 250 µg/kg). Phenanthrene was detected twice in blank samples at concentrations of 73.8 and 74.3 µg/kg (reporting limit 250 µg/kg). With the exception of di-n-butylphthalate and bis(2-ethylhexyl)phthalate, which were detected in
every blank sample and every environmental sample, the compounds detected in the SPMD blank samples do not negate detections in environmental samples. How-ever, because DDE was detected in two blank samples at concentrations larger than the reporting limit, detec-tions in environmental samples could be suspect.
Surface-Water Data
The surface-water data are checked, reviewed, and subjected to QC procedures before the data are published. A complete analysis of data collected, pro-cedures used in processing the data, and the logic on which the computations were based is documented for each year of record for each station to provide a basis for review and as a reference for questions about the records in the future. The station analysis includes a description of equipment, hydrologic conditions, gage-height record, datum corrections, rating, discharge, special computations, remarks, and recommendations. Discharge measurement notes are checked before the values are entered into the database. Rating curves are reviewed and revised before the discharge data are computed and accepted into the database.
WATER-QUALITY, SURFACE-WATER, AND PRECIPITATION DATA
The water was clear and colorless in appearance during base-flow sampling events at all sites sampled. This contrasts greatly with the opaque, nearly black in color, initial runoff that was observed at the Wilsons Creek sites (Wilsons Creek at Scenic Drive, Wilsons Creek near Springfield, South Creek, and Wilsons Creek near Battlefield) during storm events. The black color probably was from oil and grease, particulates from ground-up tires, or other sources. The runoff from the Pearson Creek sites (Jones Branch and Pearson Creek) usually was opaque and brownish-red during storm events. The color at these sites probably was from the brownish-red sediment that is washed out of the karst system through springs during high flow, and from sediment picked up by overland flow. Storm events that were sampled generally were high-intensity, short-duration storms that usually produced about 1 to 2 in. (inches) of rain. One storm event on July 12, 2000, produced more than 5 in. of rainfall in about 6 hours. Much of the city of Springfield and the surrounding area of Greene County were flooded, causing extensive property damage.
Water-Quality, Surface-Water, and Precipitation Data 15

Inorganic Constituent, Nutrient, Bacteria, and Trace Metal Data
Base-Flow Samples
Base-flow samples were collected at four sites (Jones Branch, Pearson Creek, Wilsons Creek at Scenic Drive, and Wilsons Creek near Battlefield, fig. 2) twice during the study (tables 3 to 5). Two sites (Wilsons Creek near Springfield and South Creek) had zero flow and were not sampled. The concentrations of the inor-ganic constituents calcium, magnesium, potassium, sodium, chloride, fluoride, and sulfate are shown on table 4. The concentrations of calcium ranged from 60.1 to 91.6 mg/L, magnesium ranged from 2.53 to 8.12 mg/L, potassium ranged from 1.4 to 13.1 mg/L, sodium ranged from 8.7 to 137 mg/L, chloride ranged from 18.6 to 143 mg/L, fluoride ranged from less than 0.1 to 0.6 mg/L, and sulfate ranged from 9.1 to 78.2 mg/L.
Nutrient concentrations in the base-flow samples generally were greatest at the Wilsons Creek near Bat-tlefield site. The concentrations of the nitrite plus nitrate as nitrogen (because the majority of nitrite plus nitrate is nitrate, nitrite plus nitrate as nitrogen will hereinafter be referred to as nitrate), dissolved phos-phorus, orthophosphorus, and total phosphorus were several times the concentrations of the base-flow sam-ples from other sites. The concentrations of nitrate ranged from 0.786 to 8.29 mg/L, dissolved phosphorus ranged from less than 0.05 to 1.916 mg/L, orthophos-phorus ranged from less than 0.01 to 1.84 mg/L, and total phosphorus ranged from less than 0.05 to 2.03 mg/L.
Indicator bacteria densities in base-flow samples for E. coli ranged from 23 to greater than 1,600 col/100 mL (colonies per 100 milliliters), for FC ranged from 20 to 12,000 col/100 mL, and for FS ranged from 37 to 1,340 col/100 mL. All sites sampled except for Jones Branch exceeded the FC whole-body-contact state standard of 200 col/100 mL (Missouri Department of Natural Resources, 1996) in both base-flow samples.
The dissolved trace metal concentrations gener-ally were less than the detection limit, with the excep-tion of iron, which ranged from less than 10 to 40 µg/L (micrograms per liter) and manganese, which ranged from 4 to 107 µg/L. Total metal concentrations of cad-mium, lead, mercury, and zinc were mostly less than their respective detection limits. The concentration of total aluminum ranged from an estimated 16 to 136 µg/L, and total lead ranged from less than 1 to 2 µg/L.
Stormwater Samples
The median concentrations of the inorganic con-stituents (calcium, magnesium, potassium, sodium, chloride, fluoride, and sulfate) in stormwater samples generally were less than the median concentrations of base-flow samples. In stormwater samples, the concen-trations of calcium ranged from 19.3 to 92.9 mg/L, magnesium ranged from 1.06 to 8.47 mg/L, potassium ranged from 1.6 to 8.1 mg/L, sodium ranged from 2.4 to 58.5 mg/L, chloride ranged from less than 0.3 to 102 mg/L, fluoride ranged from less than 0.1 to 0.3 mg/L, and sulfate ranged from 3 to 36.2 mg/L.
The nitrogen species median concentrations gen-erally were greater than the median concentrations of the base-flow samples, and the median concentrations of the phosphorus species generally were less than the median concentrations of the base-flow samples. The largest concentrations (ammonia plus organic nitrogen as nitrogen, 5.9 mg/L, and ammonia as nitrogen, 0.544 mg/L) of the reduced nitrogen species occurred at the Wilsons Creek at Scenic Drive site. That site had con-sistently larger concentrations of reduced nitrogen spe-cies than the other sites. The largest concentration (4.62 mg/L) of nitrate occurred at the Wilsons Creek near Battlefield site. However, the concentrations of nitrate were much lower at that site than the concentrations in base-flow samples. In Jones Branch, nitrate concentra-tions were larger in stormwater samples than base-flow samples. The largest stormwater total phosphorus con-centration occurred at Wilsons Creek near Battlefield on November 23, 1999, with a value of 1.57 mg/L.
Fecal indicator bacteria densities generally were several orders of magnitude greater in stormwater sam-ples than in base-flow samples. E. coli densities ranged from less than 1,000 (South Creek) to 140,000 (Wil-sons Creek at Scenic Drive) col/100 mL. Fecal coliform densities ranged from 1,000 (South Creek) to 150,000 (Wilsons Creek at Scenic Drive) col/100 mL. Fecal streptococcus densities ranged from 1,980 to 290,000 col/100 mL at Jones Branch.
The concentrations of the dissolved metals gen-erally were less than the detection limit with the excep-tion of iron, which ranged from less than 10 to 60 µg/L; manganese, which ranged from an estimated 2 to 322 µg/L; and zinc, which ranged from an estimated 10 to 24 µg/L. Total mercury concentrations were mostly below the detection limit of 0.3 µg/L. The concentra-tion of total aluminum ranged from an estimated 133 to
16 Water Quality, Selected Chemical Characteristics, and Toxicity of Base Flow and Urban Stormwater in Greene County, MO

12,500 µg/L, total cadmium ranged from an estimated 0.1 to 2.9 µg/L, total lead ranged from 1 to 245 µg/L, and total zinc ranged from an estimated 19 to 472 µg/L.
Organic Constituent Data
Base-Flow Samples
A sample for the TIC scan was collected for each base-flow sample. The TIC scan can be used as an organic compound screening tool. The TIC scan tech-nique is useful for detecting compounds that are ame-nable to extraction by dichloromethane and detection by gas chromatograph-mass spectrometer. These com-pounds may include certain pesticides, industrial pol-lutants, petroleum products, and natural organic compounds. Compounds not usually determined by this technique include highly volatile or nonvolatile compounds, and very polar or thermally labile com-pounds (including many pesticides and their metabo-lites). A total of 13 compounds were detected in the TIC scans of the base-flow samples (table 5). The com-pounds isophorone, phenanthrene, and anthracene were the most frequently detected in base-flow sam-ples. These 3 compounds were detected in more than 63 percent of the base-flow samples.
Samples collected at Pearson Creek and Wilsons Creek near Battlefield were analyzed for an extensive list of general pesticides and pesticide metabolites (table 6). Pesticides detected in the base-flow samples included atrazine, carbaryl, chlorpyrifos, cyanazine, diazinon, diuron, lindane, metolachlor, prometon, and tebuthiuron. Prometon was detected at both sites during both base-flow sampling periods and ranged from 0.056 to 0.225 µg/L. More pesticides were detected during the June 2000 base-flow sampling period (5 at Pearson Creek, 8 at Wilsons Creek) than during the August 1999 sampling period (2 at Pearson Creek, 2 at Wilsons Creek). Most of the pesticide concentrations were near the detection limits. The highest base-flow concentrations for cyanazine (0.554 µg/L), diuron (0.13 µg/L), and prometon (0.225 µg/L) occurred at the Wilsons Creek near Battlefield site during the June 2000 sampling period. For the protection of aquatic life, the Missouri Department of Natural Resources (1996) established a state standard (0.04 µg/L) on the concentration of chlorpyrifos in water. The chlorpyri-fos concentration at the Wilsons Creek near Battlefield site was 0.035 µg/L during the June 2000 sampling period. Chlorpyrifos, an insecticide often applied to
turf, is not a restricted-use pesticide and approximately 50 percent of its use is in agricultural settings and 50 percent is in non-agricultural settings (U.S. Environ-mental Protection Agency, October 2001). All of the pesticide concentrations detected were less than their respective state standards for the protection of aquatic life (Missouri Department of Natural Resources, 1996).
Stormwater Samples
A TIC scan sample was collected for each storm-water sample. A total of 27 compounds were detected in the TIC scans of the stormwater samples (table 5). Seventeen of these compounds were detected in more than one-half of the samples collected. Isophorone, flu-oranthene, pyrene, and chrysene were detected in more than 75 percent of the stormwater samples. The Pear-son Creek Basin had a maximum of 17 compounds detected by the TIC scan, whereas the Wilsons Creek Basin had a maximum of 25 compounds detected.
Stormwater samples collected at Pearson Creek and Wilsons Creek near Battlefield were analyzed for an extensive list of general pesticides and metabolites (table 6). Those detected in the stormwater samples included 2,4-dichlorophenoxyacetic acid (2,4-D), atra-zine, carbaryl, chlorpyrifos, deethyl atrazine, diazinon, diuron, malathion, metolachlor, molinate, pendimetha-lin, picloram, prometon, simazine, and tebuthiuron. Diazinon was detected in 86 percent of the stormwater samples; atrazine and prometon were detected in 71 percent of the stormwater samples. The concentration of diazinon ranged from less than 0.002 to 0.384 µg/L, atrazine ranged from less than 0.001 to 0.017 µg/L, and prometon ranged from less than 0.018 to 0.408 µg/L. Diuron was detected once in stormwater samples at a concentration of 8.03 µg/L.
Semipermeable Membrane Device (SPMD) Chemical Data
Long-Term Samples
Three long-term (30-day) SPMD samples were collected, and the dialysates analyzed for selected gen-eral and organochlorine pesticides (and metabolites), total PCBs, PAHs, and VOCs (tables 6 to 8). Toxicity was determined for the dialysates in addition to the analysis of the water-quality constituents. The long-term samples were collected at Wilsons Creek near
Water-Quality, Surface-Water, and Precipitation Data 17

Battlefield (fig. 2) from August 19 to September 19, 1999, and from June 11 to July 11, 2000, and at Pearson Creek near Springfield from May 12 to June 12, 2000.
Numerous compounds were detected in the long-term SPMD samples (tables 7 to 9). The general pesti-cides (table 7) benfluralin, DDE, and lindane were detected in the base-flow samples. DDE was detected in all long-term SPMD samples, but because of detec-tions in SPMD blanks, its environmental detections are suspect. Eleven organochlorine pesticides and metabo-lites (table 8) were detected in the long-term SPMD samples. Of those 11, 10 were detected in the Pearson Creek sample and 8 were detected in each of the Wil-sons Creek samples. Seven organochlorine pesticides and metabolites (cis-chlordane, trans-chlordane, dield-rin, p,p’-DDE, heptachlor epoxide, cis-nonachlor, and pentachloroanisole) were consistently detected in the long-term SPMD samples. A total of 26 PAH and VOC compounds (table 9) were detected in the long-term SPMD samples. Wilsons Creek had the greatest num-ber of detections (24) of PAH and VOC compounds in the long-term sample collected from June 11 to July 11, 2000, while the Pearson Creek long-term sample had 8 detections. Eight PAH and VOC compounds [acenaph-thene, diethylphthalate, di-n-butylphthalate, bis(2-eth-ylhexyl)phthalate, fluoranthene, 9h-fluorene, phenanthrene, and pyrene] were consistently detected in the long-term SPMD samples. Because of detections in every SPMD blank sample, di-n-butylphthalate and bis(2-ethylhexyl)phthalate detections were not consid-ered reliable.
Storm-Event Samples
Storm-event SPMD samples were collected at Pearson Creek from June 28 to July 1, 2000, and July 12 to July 17, 2000, and at Wilsons Creek near Battle-field (fig. 2) from February 17 to February 21, 2000, and July 12 to July 17, 2000. The general pesticides (table 7) that were detected in storm-event SPMD sam-ples were chlorpyrifos (once at Pearson Creek) and DDE (once at Pearson Creek and once at Wilsons Creek near Battlefield). A total of 10 organochlorine pesticides and metabolites (table 8) were detected in the storm-event SPMD samples. The pesticides and metabolites cis-chlordane, trans-chlordane, heptachlor epoxide, and pentachloroanisole were detected in three of the four storm-event SPMD samples. There were six organochlorine pesticides and metabolites detected in storm-event SPMD samples from Pearson Creek (June 28, 2000) and Wilsons Creek (July 12, 2000). The other
two SPMD samples had four or fewer organochlorine pesticides detected. Thirty-one PAHs and VOCs (table 9) were detected in storm-event SPMD samples. Nine compounds [acenaphthene, di-n-butylphthalate, chry-sene, diethylphthalate, bis(2-ethylhexyl)phthalate, flu-oranthene, naphthalene, phenanthrene, and pyrene] were consistently detected in all storm-event SPMDs. Because of detections in every SPMD blank sample, di-n-butylphthalate and bis(2-ethylhexyl)phthalate detec-tions are not considered reliable. The greatest numbers of PAH and VOC detections occurred at Wilsons Creek near Battlefield with 28 detections in the February 17, 2000, sample and 24 detections in the July 12, 2000, sample. At Pearson Creek, there were 9 PAH and VOC detections in storm event SPMD samples on June 28, 2000, and 10 on July 12, 2000.
Surface-Water and Precipitation Data
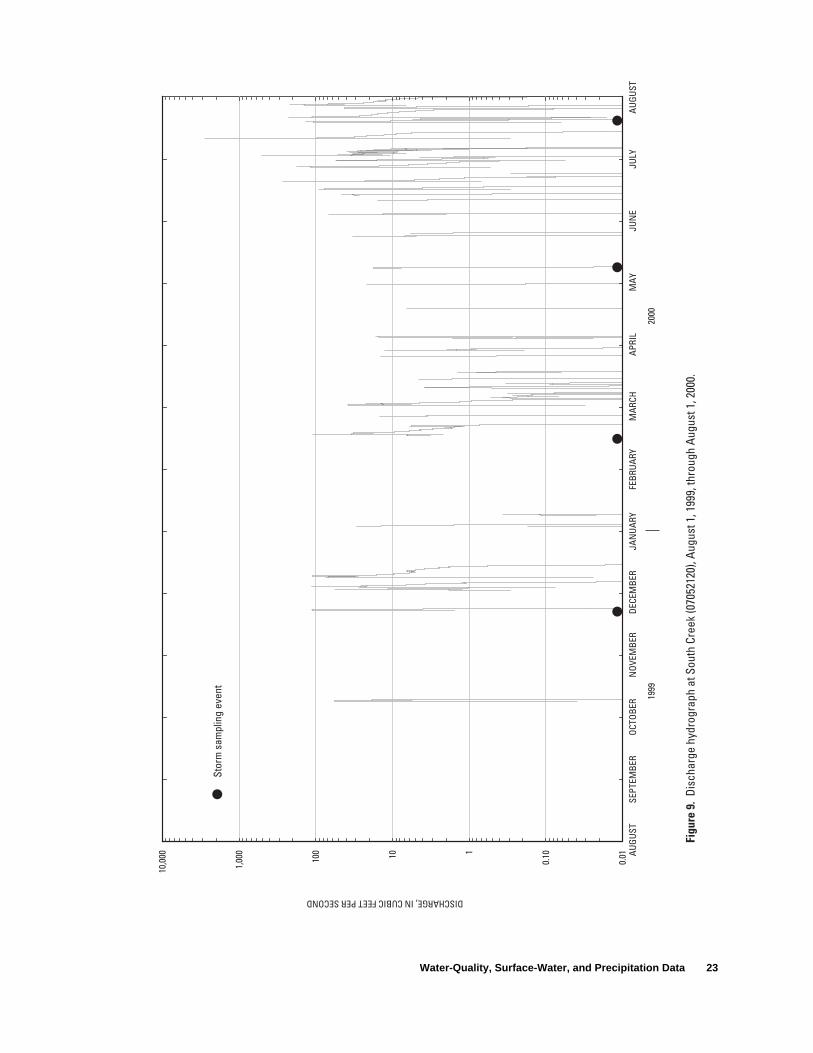
Surface-water gages were collocated at each water-quality sampling site and recorded gage-height data throughout the period of study. The discharge was computed from the gage-height record using the stage-discharge relation developed for each station. Dis-charge hydrographs for the sites sampled during the period of the study are shown in figures 5 through 10. Discharge data were used to calculate the load (mass per unit time) of a particular water-quality constituent passing a fixed point. Gage heights were recorded dur-ing water-quality sampling and were later converted to discharge using the discharge hydrographs shown in figures 5 to 10.
A flow-duration curve is a cumulative frequency curve that shows the percentage of time during which specified discharges were equaled or exceeded in a given period. It is another means of representing streamflow data combining, in one curve, the flow characteristics of a stream throughout the range of dis-charge. Flow-duration curves often are useful for esti-mating discharges for simulation purposes. The flow-duration curve for each site based on the period of record that data were collected at each site is shown in figure 11. However, the curves for Jones Branch, Pear-son Creek, and South Creek are based on less than 2 years of record.
Predicted peak discharge data often are useful for simulation purposes. Becker (1986) developed equations for urbanized basins that use the characteris-tics of drainage area and percent impervious surface to
18 Water Quality, Selected Chemical Characteristics, and Toxicity of Base Flow and Urban Stormwater in Greene County, MO
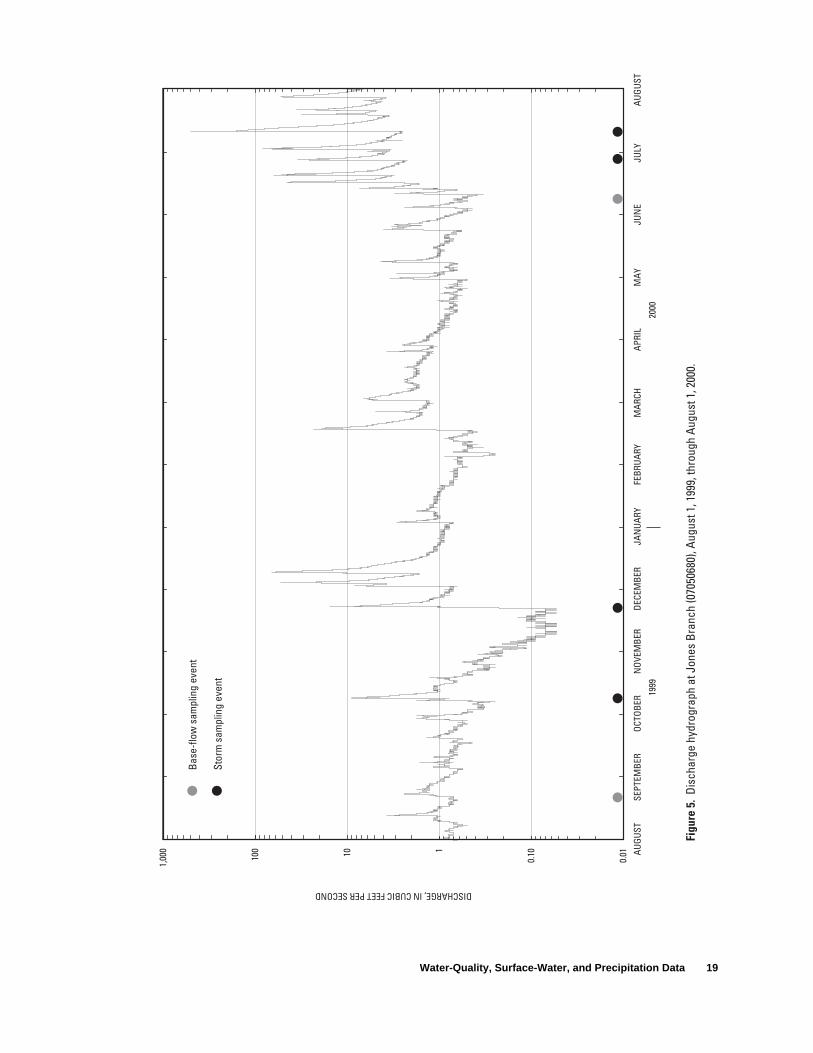
Figu
re5.
Disc
harg
ehy
drog
raph
atJo
nes
Bran
ch(0
7050
680)
,Aug
ust1
,199
9,th
roug
hAu
gust
1,20
00.
Base
-flow
sam
plin
gev
ent
Stor
msa
mpl
ing
even
t
1999
2000
0.01
0.1011010
0
1,00
0 AUGU
STSE
PTEM
BER
OCTO
BER
NOV
EMBE
RDE
CEM
BER
JAN
UARY
FEBR
UARY
MAR
CHAP
RIL
MAY
JUN
EJU
LYAU
GUST
DISCHARGE,INCUBICFEETPERSECOND
Water-Quality, Surface-Water, and Precipitation Data 19

Figu
re6.
Disc
harg
ehy
drog
raph
atPe
arso
nCr
eek
(070
5069
0),A
ugus
t1,1
999,
thro
ugh
Augu
st1,
2000
.
Base
-flow
sam
plin
gev
ent
Stor
msa
mpl
ing
even
t
Sem
iper
mea
ble
mem
bran
ede
vice
sam
ple
110100
1,00
0
10,0
00
DISCHARGE,INCUBICFEETPERSECOND
1999
2000
AUGU
STSE
PTEM
BER
OCTO
BER
NOV
EMBE
RDE
CEM
BER
JAN
UARY
FEBR
UARY
MAR
CHAP
RIL
MAY
JUN
EJU
LYAU
GUST
20 Water Quality, Selected Chemical Characteristics, and Toxicity of Base Flow and Urban Stormwater in Greene County, MO

Water-Quality, Surface-Water, and Precipitation Data 21

0.1011010
0
1,00
0
10,0
00
DISCHARGE,INCUBICFEETPERSECOND
1999
2000
AUGU
STSE
PTEM
BER
OCTO
BER
NOV
EMBE
RDE
CEM
BER
JAN
UARY
FEBR
UARY
MAR
CHAP
RIL
MAY
JUN
EJU
LYAU
GUST
Figu
re8.
Disc
harg
ehy
drog
raph
atW
ilson
sCr
eek
near
Sprin
gfie
ld(0
7052
100)
,Aug
ust1
,199
9,th
roug
hAu
gust
1,20
00.
Stor
msa
mpl
ing
even
t
22 Water Quality, Selected Chemical Characteristics, and Toxicity of Base Flow and Urban Stormwater in Greene County, MO
0.01
0.1011010
0
1,00
0
10,0
00DISCHARGE,INCUBICFEETPERSECOND
1999
2000
AUGU
STSE
PTEM
BER
OCTO
BER
NOV
EMBE
RDE
CEM
BER
JAN
UARY
FEBR
UARY
MAR
CHAP
RIL
MAY
JUN
EJU
LYAU
GUST
Stor
msa
mpl
ing
even
t
Figu
re9.
Disc
harg
ehy
drog
raph
atSo
uth
Cree
k(0
7052
120)
,Aug
ust1
,199
9,th
roug
hAu
gust
1,20
00.
Water-Quality, Surface-Water, and Precipitation Data 23

Figu
re10
.Di
scha
rge
hydr
ogra
phat
Wils
ons
Cree
kne
arBa
ttlef
ield
(070
5216
0),A
ugus
t1,1
999,
thro
ugh
Augu
st1,
2000
.
Base
-flow
sam
plin
gev
ent
Stor
msa
mpl
ing
even
t
Sem
iper
mea
ble
mem
bran
ede
vice
sam
ple
AUGU
STSE
PTEM
BER
OCTO
BER
NOV
EMBE
RDE
CEM
BER
JAN
UARY
FEBR
UARY
MAR
CHAP
RIL
MAY
JUN
EJU
LYAU
GUST
110100
1,00
0
10,0
00
DISCHARGE,INCUBICFEETPERSECOND
1999
2000
24 Water Quality, Selected Chemical Characteristics, and Toxicity of Base Flow and Urban Stormwater in Greene County, MO

90 100
Jones Branch (07050680)
Pearson Creek (07050690)
Wilsons Creek at Scenic Drive (07052000)
Wilsons Creek near Springfield (07052100)
South Creek (07052120)
0.01
0.1
1
10
100
0.01
0.1
1
10
100
1
10
100
1,000
Wilsons Creek near Battlefield (07052160)
1
10
100
1,000
10,000
0 10 20 30 40 50 60 70 800.1
1
10
100
1,000
10,000
0 10 20 30 40 50 60 70 80 90 100
0.1
1
10
100
1,000
10,000
DISC
HARG
E,IN
CUBI
CFE
ETPE
RSE
CON
D
PERCENT OF TIME INDICATED VALUE WAS EQUALED OR EXCEEDED
Figure 11. Flow-duration curves for the period of record at the gaging stations in the Pearson Creek and Wilsons Creek Basins.
Water-Quality, Surface-Water, and Precipitation Data 25
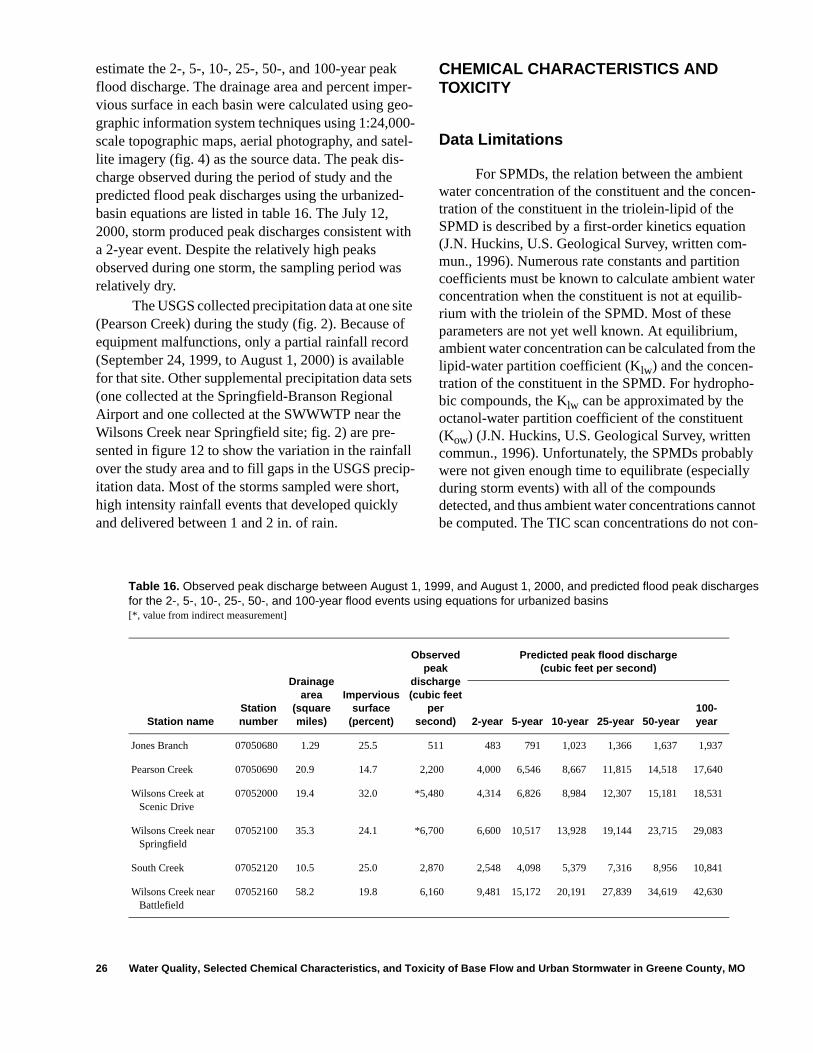
estimate the 2-, 5-, 10-, 25-, 50-, and 100-year peak flood discharge. The drainage area and percent imper-vious surface in each basin were calculated using geo-graphic information system techniques using 1:24,000-scale topographic maps, aerial photography, and satel-lite imagery (fig. 4) as the source data. The peak dis-charge observed during the period of study and the predicted flood peak discharges using the urbanized-basin equations are listed in table 16. The July 12, 2000, storm produced peak discharges consistent with a 2-year event. Despite the relatively high peaks observed during one storm, the sampling period was relatively dry.
The USGS collected precipitation data at one site (Pearson Creek) during the study (fig. 2). Because of equipment malfunctions, only a partial rainfall record (September 24, 1999, to August 1, 2000) is available for that site. Other supplemental precipitation data sets (one collected at the Springfield-Branson Regional Airport and one collected at the SWWWTP near the Wilsons Creek near Springfield site; fig. 2) are pre-sented in figure 12 to show the variation in the rainfall over the study area and to fill gaps in the USGS precip-itation data. Most of the storms sampled were short, high intensity rainfall events that developed quickly and delivered between 1 and 2 in. of rain.
CHEMICAL CHARACTERISTICS AND TOXICITY
Data Limitations
For SPMDs, the relation between the ambient water concentration of the constituent and the concen-tration of the constituent in the triolein-lipid of the SPMD is described by a first-order kinetics equation (J.N. Huckins, U.S. Geological Survey, written com-mun., 1996). Numerous rate constants and partition coefficients must be known to calculate ambient water concentration when the constituent is not at equilib-rium with the triolein of the SPMD. Most of these parameters are not yet well known. At equilibrium, ambient water concentration can be calculated from the lipid-water partition coefficient (Klw) and the concen-tration of the constituent in the SPMD. For hydropho-bic compounds, the Klw can be approximated by the octanol-water partition coefficient of the constituent (Kow) (J.N. Huckins, U.S. Geological Survey, written commun., 1996). Unfortunately, the SPMDs probably were not given enough time to equilibrate (especially during storm events) with all of the compounds detected, and thus ambient water concentrations cannot be computed. The TIC scan concentrations do not con-
26 Water Quality, Selected Chemical Characteristics, and Toxicity of Base Flow and Urban Stormwater in Greene County, MO
Table 16. Observed peak discharge between August 1, 1999, and August 1, 2000, and predicted flood peak discharges for the 2-, 5-, 10-, 25-, 50-, and 100-year flood events using equations for urbanized basins[*, value from indirect measurement]
Station nameStation number
Drainage area
(square miles)
Impervious surface
(percent)
Observed peak
discharge (cubic feet
per second)
Predicted peak flood discharge(cubic feet per second)
2-year 5-year 10-year 25-year 50-year100-year
Jones Branch 07050680 1.29 25.5 511 483 791 1,023 1,366 1,637 1,937
Pearson Creek 07050690 20.9 14.7 2,200 4,000 6,546 8,667 11,815 14,518 17,640
Wilsons Creek at Scenic Drive
07052000 19.4 32.0 *5,480 4,314 6,826 8,984 12,307 15,181 18,531
Wilsons Creek near Springfield
07052100 35.3 24.1 *6,700 6,600 10,517 13,928 19,144 23,715 29,083
South Creek 07052120 10.5 25.0 2,870 2,548 4,098 5,379 7,316 8,956 10,841
Wilsons Creek near Battlefield
07052160 58.2 19.8 6,160 9,481 15,172 20,191 27,839 34,619 42,630

AUGU
ST
6.0
5.0
4.0
3.0
2.0
1.0
PREC
IPIT
ATIO
NDA
TACO
LLEC
TION
SITE
Sprin
gfie
ld-B
rans
onRe
gion
alAi
rpor
t
Sout
hwes
tWas
tew
ater
Trea
tmen
tPla
nt
U.S.
Geol
ogic
alSu
rvey
Gagi
ngSt
atio
n(0
7050
690)
AUGU
STSE
PTEM
BER
OCTO
BER
NOV
EMBE
RDE
CEM
BER
JAN
UARY
FEBR
UARY
MAR
CHAP
RIL
MAY
JUN
EJU
LY
1999
2000
Figu
re12
.Da
ilypr
ecip
itatio
nne
arSp
ringf
ield
,bet
wee
nAu
gust
1,19
99,a
ndAu
gust
1,20
00.
RAINFALL,ININCHES
0
Chemical Characteristics and Toxicity 27
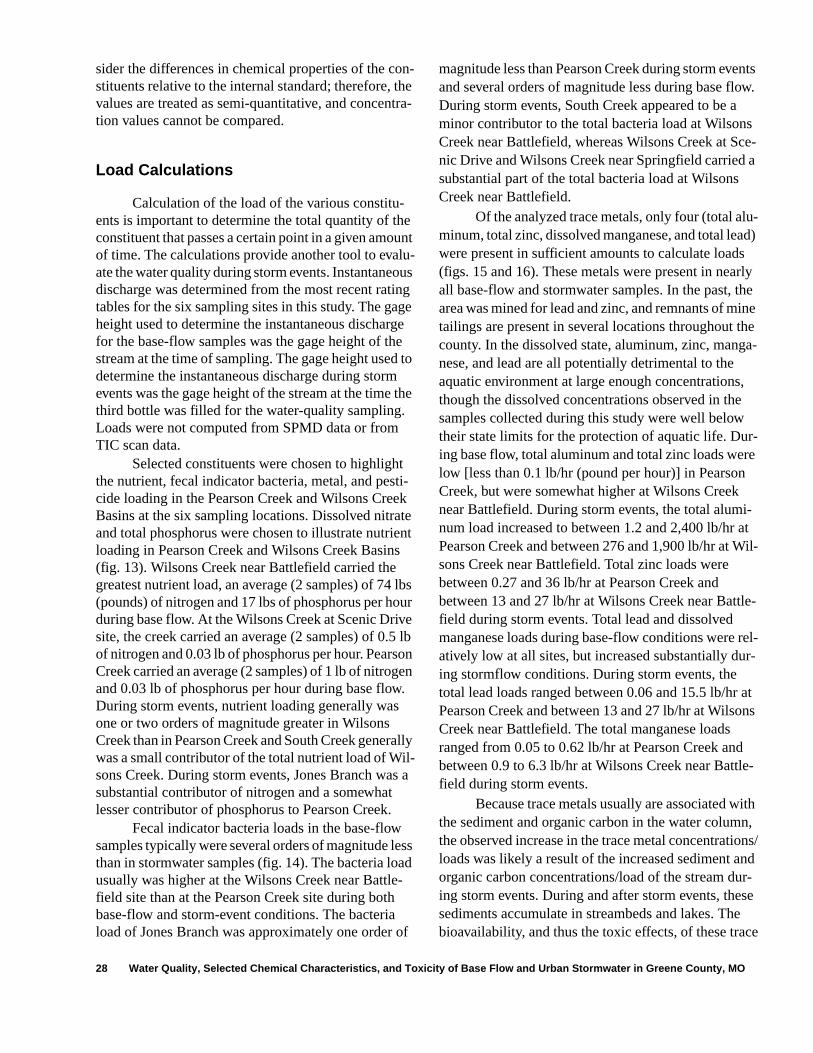
sider the differences in chemical properties of the con-stituents relative to the internal standard; therefore, the values are treated as semi-quantitative, and concentra-tion values cannot be compared.
Load Calculations
Calculation of the load of the various constitu-ents is important to determine the total quantity of the constituent that passes a certain point in a given amount of time. The calculations provide another tool to evalu-ate the water quality during storm events. Instantaneous discharge was determined from the most recent rating tables for the six sampling sites in this study. The gage height used to determine the instantaneous discharge for the base-flow samples was the gage height of the stream at the time of sampling. The gage height used to determine the instantaneous discharge during storm events was the gage height of the stream at the time the third bottle was filled for the water-quality sampling. Loads were not computed from SPMD data or from TIC scan data.
Selected constituents were chosen to highlight the nutrient, fecal indicator bacteria, metal, and pesti-cide loading in the Pearson Creek and Wilsons Creek Basins at the six sampling locations. Dissolved nitrate and total phosphorus were chosen to illustrate nutrient loading in Pearson Creek and Wilsons Creek Basins (fig. 13). Wilsons Creek near Battlefield carried the greatest nutrient load, an average (2 samples) of 74 lbs (pounds) of nitrogen and 17 lbs of phosphorus per hour during base flow. At the Wilsons Creek at Scenic Drive site, the creek carried an average (2 samples) of 0.5 lb of nitrogen and 0.03 lb of phosphorus per hour. Pearson Creek carried an average (2 samples) of 1 lb of nitrogen and 0.03 lb of phosphorus per hour during base flow. During storm events, nutrient loading generally was one or two orders of magnitude greater in Wilsons Creek than in Pearson Creek and South Creek generally was a small contributor of the total nutrient load of Wil-sons Creek. During storm events, Jones Branch was a substantial contributor of nitrogen and a somewhat lesser contributor of phosphorus to Pearson Creek.
Fecal indicator bacteria loads in the base-flow samples typically were several orders of magnitude less than in stormwater samples (fig. 14). The bacteria load usually was higher at the Wilsons Creek near Battle-field site than at the Pearson Creek site during both base-flow and storm-event conditions. The bacteria load of Jones Branch was approximately one order of
magnitude less than Pearson Creek during storm events and several orders of magnitude less during base flow. During storm events, South Creek appeared to be a minor contributor to the total bacteria load at Wilsons Creek near Battlefield, whereas Wilsons Creek at Sce-nic Drive and Wilsons Creek near Springfield carried a substantial part of the total bacteria load at Wilsons Creek near Battlefield.
Of the analyzed trace metals, only four (total alu-minum, total zinc, dissolved manganese, and total lead) were present in sufficient amounts to calculate loads (figs. 15 and 16). These metals were present in nearly all base-flow and stormwater samples. In the past, the area was mined for lead and zinc, and remnants of mine tailings are present in several locations throughout the county. In the dissolved state, aluminum, zinc, manga-nese, and lead are all potentially detrimental to the aquatic environment at large enough concentrations, though the dissolved concentrations observed in the samples collected during this study were well below their state limits for the protection of aquatic life. Dur-ing base flow, total aluminum and total zinc loads were low [less than 0.1 lb/hr (pound per hour)] in Pearson Creek, but were somewhat higher at Wilsons Creek near Battlefield. During storm events, the total alumi-num load increased to between 1.2 and 2,400 lb/hr at Pearson Creek and between 276 and 1,900 lb/hr at Wil-sons Creek near Battlefield. Total zinc loads were between 0.27 and 36 lb/hr at Pearson Creek and between 13 and 27 lb/hr at Wilsons Creek near Battle-field during storm events. Total lead and dissolved manganese loads during base-flow conditions were rel-atively low at all sites, but increased substantially dur-ing stormflow conditions. During storm events, the total lead loads ranged between 0.06 and 15.5 lb/hr at Pearson Creek and between 13 and 27 lb/hr at Wilsons Creek near Battlefield. The total manganese loads ranged from 0.05 to 0.62 lb/hr at Pearson Creek and between 0.9 to 6.3 lb/hr at Wilsons Creek near Battle-field during storm events.
Because trace metals usually are associated with the sediment and organic carbon in the water column, the observed increase in the trace metal concentrations/loads was likely a result of the increased sediment and organic carbon concentrations/load of the stream dur-ing storm events. During and after storm events, these sediments accumulate in streambeds and lakes. The bioavailability, and thus the toxic effects, of these trace
28 Water Quality, Selected Chemical Characteristics, and Toxicity of Base Flow and Urban Stormwater in Greene County, MO

LOAD
,IN
POUN
DSPE
RHO
UR
1,000
100
10
1
0.1
0.01
0.001
1,000
100
10
1
0.1
0.01
0.001
1,000
100
10
1
0.1
0.01
0.001
Jones Branch (07050680)
< <
8/19 10/9 11/23 6/7 6/28 7/12B S S B S S
1999 2000
Pearson Creek (07050690)
8/18 11/23 6/7 6/28 7/12B S B S S
1999 2000
Wilsons Creek at Scenic Drive (07052000)
8/19 8/23 11/22 2/17 5/1 6/8 7/20B S S S S B S
1999 2000
Wilsons Creek near Springfield (07052100)1,000
100
10
1
0.1
0.01
0.0018/23 11/23 2/17 5/1 7/12
S S S S S1999 2000
South Creek (07052120)1,000
100
10
1
0.1
0.01
0.00111/23 2/17 5/9 7/20
S S S S1999 2000
Wilsons Creek near Battlefield (07052160)1,000
100
10
1
0.1
0.01
0.0018/18 11/23 2/17 6/8 6/28 7/12
B S S B S S1999 2000
EXPLANATION
DISSOLVED NITRITE PLUS NITRATE B BASE-FLOW SAMPLE(AS NITROGEN)
S STORMWATER SAMPLETOTAL PHOSPHORUS
< ESTIMATED MAXIMUM LOAD VALUE COMPUTEDUSING THE REPORTING LIMIT
Figure 13. Dissolved nitrite plus nitrate (as nitrogen) and total phosphorus loads during base-flow and storm-event samplingperiods in the Pearson Creek and Wilsons Creek Basins.
Chemical Characteristics and Toxicity 29

Figure 14. Escherichia coli, fecal coliform, and fecal streptococci loads during base-flow and storm-event sampling periods inthe Pearson Creek and Wilsons Creek Basins.
103
104
105
106
107
108
109
1010
1012
1011
103
104
105
106
107
108
109
1010
1012
1011
103
104
105
106
107
108
109
1010
1012
1011
ESCHERICHIA COLI
FECAL COLIFORM
FECAL STREPTOCOCCI
8/19 10/9 11/23 6/7 6/28 7/12B BS S S S
1999 2000 1999 2000
8/23S
2/17S
11/23S
5/1S
7/12S
1999 2000
8/18B
6/8B
11/23S
6/28S
7/12S
2/17S
>
<
B BASE-FLOW SAMPLE
STORMWATER SAMPLE
ESTIMATED MINIMUM LOAD VALUE
ESTIMATED MAXIMUM LOAD VALUE
S
EXPLANATION
Jones Branch (07050680)
LOAD
,IN
COLO
NIE
SPE
RSE
CON
D
103
104
105
106
107
108
109
1010
1012
1011
8/18 11/23 6/7 6/28 7/12
1999 2000B BS S S
Pearson Creek (07050690)
103
104
105
106
107
108
109
1010
1012
1011
>
8/19 8/23 11/22 2/17 5/1 6/8 7/20
1999 2000B BS S S SS
Wilsons Creek at Scenic Drive (07052000)
Wilsons Creek near Springfield (07052100)
<
103
104
105
106
107
108
109
1010
1012
1011
2/17S
11/23
1999S
5/9
2000S
7/20S
South Creek (07052120)
Wilsons Creek near Battlefield (07052160)
30 Water Quality, Selected Chemical Characteristics, and Toxicity of Base Flow and Urban Stormwater in Greene County, MO
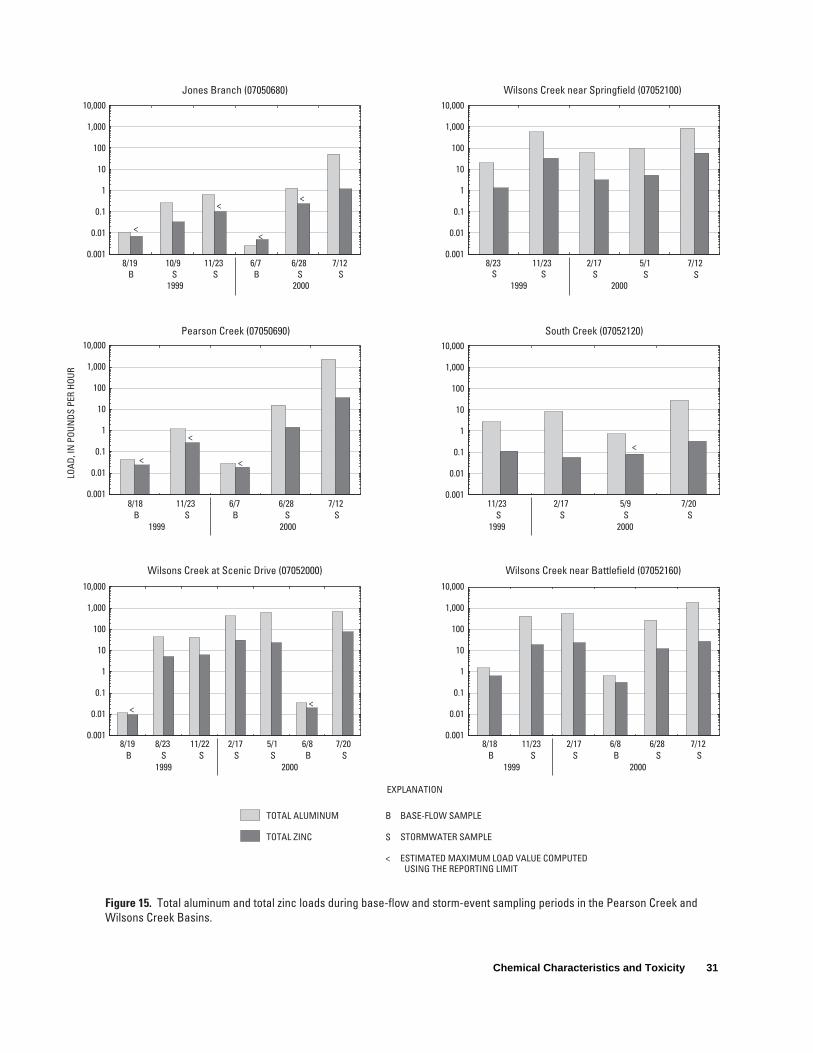
Jones Branch (07050680)
Pearson Creek (07050690)
Wilsons Creek at Scenic Drive (07052000)
Wilsons Creek near Springfield (07052100)
South Creek (07052120)
Wilsons Creek near Battlefield (07052160)
LOAD
,IN
POUN
DSPE
RHO
UR
0.001
0.01
0.1
1
10
100
1,000
10,000
Figure 15. Total aluminum and total zinc loads during base-flow and storm-event sampling periods in the Pearson Creek andWilsons Creek Basins.
0.001
0.01
0.1
1
10
100
1,000
10,000
0.001
0.01
0.1
1
10
100
1,000
10,000
0.001
0.01
0.1
1
10
100
1,000
10,000
0.001
0.01
0.1
1
10
100
1,000
10,000
0.001
0.01
0.1
1
10
100
1,000
10,000
<<
< <
<<
<<
<<
8/19 10/9 11/23 6/7 6/28 7/12 8/23 11/23 2/17 5/1 7/12B BS S S S
1999 2000 1999 2000S SS S S
8/18 11/23 6/7 6/28 7/12 11/23 2/17 5/9 7/20
1999 2000B BS S S
1999 2000SS S S
8/19 8/23 11/22 2/17 5/1 6/8 7/20 8/18 11/23 2/17 6/8 6/28 7/12
1999 2000B BS S S SS
1999 2000B BS S SS
EXPLANATION
<
B BASE-FLOW SAMPLE
STORMWATER SAMPLE
ESTIMATED MAXIMUM LOAD VALUE COMPUTEDUSING THE REPORTING LIMIT
S
TOTAL ALUMINUM
TOTAL ZINC
Chemical Characteristics and Toxicity 31

LOAD
,IN
POUN
DSPE
RHO
UR
Jones Branch (07050680)100
10
1
0.1
0.01
0.001
0.00018/19 10/9 11/23 6/7 6/28 7/12
B S S B S S1999 2000
Pearson Creek (07050690)100
10
1
0.1
0.01
0.001 < <
0.00018/18 11/23 6/7 6/28 7/12
B S B S S1999 2000
Wilsons Creek at Scenic Drive (07052000)
100
10
1
0.1
0.01
0.001<
0.00018/19 8/23 11/22 2/17 5/1 6/8 7/20
B S S S S B S1999 2000
TOTAL LEAD
DISSOLVED MANGANESE
Wilsons Creek near Springfield (07052100)100
10
1
0.1
0.01
0.001
0.00018/23 11/23 2/17 5/1 7/12
S S S S S1999 2000
South Creek (07052120)100
10
1
0.1
0.01
0.001
0.000111/23 2/17 5/9 7/20
S S S S1999 2000
Wilsons Creek near Battlefield (07052160)
100
10
1
0.1
0.01
0.001
0.00018/18 11/23 2/17 6/8 6/28 7/12
B S S B S S1999 2000
EXPLANATION
B BASE-FLOW SAMPLE
S STORMWATER SAMPLE
< ESTIMATED MAXIMUM LOAD VALUE COMPUTEDUSING THE REPORTING LIMIT
Figure 16. Total lead and dissolved manganese loads during base-flow and storm-event sampling periods in the Pearson Creekand Wilsons Creek Basins.
32 Water Quality, Selected Chemical Characteristics, and Toxicity of Base Flow and Urban Stormwater in Greene County, MO

metals is likely controlled by the solubility and the adsorption properties of the constituent on the sedi-ment.
Only four pesticides (atrazine, diazinon, metolochlor, and prometon) were present in sufficient amounts to calculate loads (fig. 17) at Pearson Creek and Wilsons Creek near Battlefield. The concentrations of all four pesticides were below their respective state limits for the protection of aquatic life in both base-flow and storm-event samples. Storm event loads of these pesticides were about 1 to 1,000 times the base-flow loads, and in general, the loads of the pesticides in the Pearson Creek Basin were less than those in the Wilsons Creek Basin.
The greatest pesticide load was for diazi-non—0.12 lb/hr at Pearson Creek and 0.24 lb/hr at Wil-sons Creek near Battlefield. Eighty percent of the use of diazinon in the United States is on turf and for resi-dential control of various insects indoors and outdoors (U.S. Environmental Protection Agency, November 2001a). Diazinon is applied at rates ranging from 0.25 lb of active ingredient per acre to 4.35 lbs of active ingredient per acre (residential turf application rate) (U.S. Environmental Protection Agency, November 2001b). The U.S. Environmental Protection Agency is in the process of phasing out certain uses of diazinon (U.S. Environmental Protection Agency, 2000).
Toxicity Evaluation
Under visible light, all samples appeared uni-formly clear and colorless. Short exposure to ultravio-let light showed that all dialysates from the long-term and storm-event SPMD samples fluoresced in a dark-ened room. The intensity of the fluorescence of the samples was similar, and neither reagent blanks nor the trip blanks fluoresced.
As mentioned earlier, the Microtox acute toxicity test results were invalid. The test showed that the sol-vent blanks were “toxic”, which indicated that the DMSO carrier solvent used by the lab was contami-nated.
Mutatox analysis of all samples with metabolic activation (rat S9) showed clear evidence of genotoxins in waterborne chemicals sequestered with SPMDs. Tests of dialysates from all samples demonstrated that the light-emitting revertant bacteria of the Mutatox test exceeded the spontaneous light values of the controls. Each sample was designated genotoxic.
Catfish injected intraperitoneally with a dialy-sate from the long-term SPMD placed at Wilsons Creek near Battlefield (fig. 2) from August 19 to Sep-tember 19, 1999, induced hepatic S9 activity as mea-sured by an increase of P450 activity in the EROD assay. The S9 enzymatic activity was heat labile, induc-ible, and cofactor dependent. Evidence of EROD activ-ity is an indicator of contaminant uptake in fish.
Evaluation of Water Quality in Base Flow and Stormflow
Analysis of the nutrient data indicate that the nutrient load from the Pearson Creek Basin can, during extremely high flow conditions, equal or exceed the load from the Wilsons Creek Basin. During normal flows or moderate storm events, the nutrient load from the Wilsons Creek Basin is much greater than the load from the Pearson Creek Basin. Overall, the effect on the water quality with respect to nutrients downstream from the study area probably is greater from the Wil-sons Creek Basin.
Base-flow fecal indicator bacteria densities were relatively low, although coliform concentrations often exceeded the limit for whole-body contact. During storm events, fecal indicator bacteria densities can increase more than 100 times the density during base-flow, which could, for short periods after storm events, pose a potential health hazard to persons exposed to the water. The oxygen consuming metabolic processes of the large densities of heterotrophic bacteria in the stormwater could cause native biota to experience dis-solved oxygen stress.
Concentrations and loads of trace metals were not determined to be of immediate concern in either the Pearson Creek or the Wilsons Creek Basin. However, this does not negate the possibility of detrimental effects of these constituents farther downstream in the James River, or when they are introduced into Table Rock Lake. Further sampling of base flow and storm-water in the rest of the James River would better indi-cate the potential for harmful effects to the basin because of trace metals.
Water sample analyses indicated the presence of pesticides or pesticide metabolites, PAHs, or VOCs at nearly every site during both base-flow and storm-event conditions. Relative concentrations, frequency of detection, and the number of organic compounds detected increased dramatically between during storm-event as compared to base-flow conditions. During
Chemical Characteristics and Toxicity 33

Pearson Creek (07050690)1
0.1
0.01
0.001
0.0001
0.00001
0.0000018/18 11/23 6/7 6/28 7/12
B S B S S1999 2000
Wilsons Creek near Battlefield (07052160)1
0.1
0.01
0.001
0.0001
0.00001<
<
<
<
<
<
<
<
<
<
<
0.0000018/18 11/23 2/17 6/8 6/28 7/12
B S S B S S1999 2000
EXPLANATION
ATRAZINE B BASE-FLOW SAMPLE
DIAZINON S STORMWATER SAMPLE
METOLACHLOR < ESTIMATED MAXIMUM LOAD VALUECOMPUTED USING THE REPORTING
PROMETON LIMIT
< < <
LOAD
,IN
POUN
DSPE
RHO
UR
Figure 17. Atrazine, diazinon, metolachlor, and prometon loads during base-flow and storm-eventsampling periods in the Pearson Creek and Wilsons Creek Basins.
34 Water Quality, Selected Chemical Characteristics, and Toxicity of Base Flow and Urban Stormwater in Greene County, MO
base-flow conditions, concentrations of organic com-pounds were not determined to exceed their respective state limits for the protection of aquatic life, though in one sample the pesticide chlorpyrifos approached the state limit of 0.04 µg/L for the protection of aquatic life. Atrazine, diazinon, metolochlor, and prometon frequently were detected at both the Pearson Creek and Wilsons Creek near Battlefield sites during storm events.
Sample fluorescence indicated the presence of aromatic organic compounds in all SPMD samples col-lected in Pearson Creek and Wilsons Creek near Battle-field. Risk assessment from Mutatox and hepatic induction data indicated evidence of genotoxins, and suggested that multiple-ringed-substituted PAHs, com-mon in petroleum or combustion sources, were the probable bioavailable agents.
The unique ability of the SPMD samplers to sim-ulate the bioconcentration of organic compounds in aquatic biota enabled the detection of a number of com-pounds that may not have been detectable by standard water analyses. The organic compounds listed in tables 8 and 9 generally are more hydrophobic (less water sol-uble) than the pesticides (and metabolites) listed in table 7, and are less likely to be detected in water sam-ples. The hydrophobic organic compounds are prefer-entially concentrated in the lipid material of the SPMD and can be detected on analysis of the dialysates. The presence of these compounds can affect the overall aquatic ecosystem health because many of them can be acutely toxic or genotoxic to aquatic biota.
Aquatic biota living in the Pearson Creek or Wil-sons Creek Basin are potentially bioaccumulating the same complex organic mixture as was detected in the SPMDs. Because every base-flow and storm-event SPMD sample was determined to be genotoxic, the compounds that contribute to the genotoxic effects are likely present in both the base flow and the stormwater. The compounds cis-chlordane, trans-chlordane, hep-tachlor epoxide, and pentachloroanisole were the most frequently detected pesticides and pesticide metabo-lites in both base-flow and storm-event SPMD samples. The PAH and VOC compounds acenaphthene, dieth-ylphthalate, fluoranthene, phenanthrene, and pyrene consistently were detected in both base-flow and storm-event SPMD samples. The petroleum hydrocar-bon series PAHs fluoranthene, phenanthrene, and pyrene were also detected in at least 67 percent of the water samples (table 5).
The combination of the detection of many man-made organic compounds in water and SPMD samples during both base-flow and storm-event conditions and the determination that every SPMD sample was geno-toxic leads to the conclusion that the water quality and thus the aquatic environments in the Pearson Creek and Wilsons Creek Basins are degraded by urban inputs. Both the Pearson Creek and Wilsons Creek Basins are affected by these organic compounds during base-flow and storm-event conditions. Based on the number and frequency of the organic compounds detected, the Wil-sons Creek Basin appears to be impaired to a greater degree than the Pearson Creek Basin. The harmful effects of long-term exposure of aquatic biota to the compounds present during base flow is compounded by the short-term exposure to the myriad of compounds present in stormwater runoff. Conditions that could increase this likelihood are extended periods between storm events causing compounds to accumulate on the land surface, flushing of the compounds from the karst system from a period of high ground-water flow, and/or improper handling, storage, or disposal (either pres-ently or in the past) of the compounds, thereby causing them to be exposed to the environment.
SUMMARY
The U.S. Geological Survey, in cooperation with the Missouri Department of Natural Resources, charac-terized the chemistry and toxicity of base flow and urban stormwater to determine if urban contaminants were degrading the water quality of the Pearson Creek and Wilsons Creek Basins in and near the city of Springfield, Missouri. Undesirable and potentially toxic phases of stormwater (nutrients, trace metals, and organic compounds) were identified to help resource managers identify and minimize the sources of these toxicants.
Selected constituents were analyzed from a total of 8 base-flow and 25 stormwater water-quality sam-ples collected from six sites in the study area. Bioavail-ability of toxicants was determined from three base-flow and four stormwater semipermeable membrane devices (SPMD) samples collected at the furthest downstream sampling point in each of the two basins.
Concentrations of nutrients were generally higher in Wilsons Creek than in Pearson Creek, except during very high-flow storm events. Nutrient loading to the James River from these two basins (especially the Wilsons Creek Basin) is of some concern and has the
Summary 35

potential to degrade the water quality. Fecal indicator bacteria densities exceeded the state limit for whole-body-contact recreation at all but one site during base-flow conditions and were orders of magnitude greater in stormwater samples. High indicator bacteria densi-ties shortly after storm events and the associated increased heterotrophic activity could be degrading the aquatic environment in the two basins and potentially the James River downstream by increasing the dis-solved oxygen stress on the native biota. Most trace metals dissolved in base-flow and stormwater samples were below the detection limits, but total recoverable trace metal concentrations were much greater, particu-larly in stormwater samples. Dissolved trace metal con-centrations do not appear to be a major concern in the two basins in either base-flow or stormwater runoff.
A maximum of 8 non-pesticide organic com-pounds were detected in base-flow water samples, and a maximum of 25 non-pesticide organic compounds were detected in stormwater samples. These com-pounds were mostly polycyclic aromatic hydrocarbons (PAHs). A maximum of 8 pesticides were detected in both base-flow and stormwater samples. All pesticide and non-pesticide concentrations in water samples were below their state standards for the protection of aquatic life. Though pesticides were present in both base-flow and stormwater runoff, the concentrations were low and not substantially different. The presence of the pesticides is of some concern, but it is not likely that their presence alone is causing the observed toxic-ity.
A maximum of 14 pesticides and pesticide metabolites, and 24 PAHs and volatile organic com-pounds (VOCs) were detected in long-term SPMD samples. A maximum of 7 pesticides and pesticide metabolites, and 28 PAH and VOC compounds were detected in storm event exposed SPMDs. Toxicity tests of SPMD dialysates indicated evidence of genotoxins in all long-term and storm-event SPMD samples. Hepatic activity assessment of one long-term SPMD sample indicated evidence of contaminant uptake in fish. It is suspected, based on the compounds detected in the SPMDs and the water samples, that the observed toxicity is largely the result of PAHs and VOCs that are probably derived from petroleum inputs or combustion sources. The pesticides and pesticide metabolites that were detected probably compound the genotoxicity pri-marily caused by the PAHs and VOCs. Based on the organic compounds detected in the stormwater samples and SPMDs and the evidence of genotoxicity, the water
quality and thus the aquatic environment in the Pearson Creek and Wilsons Creek Basins are being degraded by urban derived contaminants.
REFERENCES
Becker, L.D., 1986, Techniques for estimating flood-peak discharges from urban basins in Missouri: U.S. Geological Survey Water-Resources Investi-gations Report 86–4322, 38 p.
Berkas, W.R., 1980, Effects of urban runoff and waste-water effluent on Wilsons Creek and James River near Springfield, Missouri: U.S. Geological Sur-vey Water-Resources Investigations Report 80–27, 31 p.
———1982, Streamflow and water-quality conditions, Wilsons Creek and James River, Springfield area, Missouri: U.S. Geological Survey Water-Resources Investigations Report 82–26, 38 p.
Brauhn, J.L., and Schoettger, R.A., 1975, Acquisition and culture of research fish—Rainbow trout, flat-head minnows, channel catfish, and bluegills: Duluth, Minn., U.S. Environmental Protection Agency, EPA 660/33-75-011, 45 p.
Buchanan, T.J., and Somers, W.P., 1969, Discharge measurements at gaging stations: U.S. Geological Survey Techniques of Water-Resources Investiga-tions, book 3, chap. A8, 65 p.
Carter, R.W., and Davidian, Jacob, 1968, General pro-cedures for gaging streams: U.S. Geological Sur-vey Techniques of Water-Resources Investigations, book 3, chap. A6, 13 p.
Emmett, L.F., Skelton, John, Luckey, R.R., Miller, D.E., Thompson, T.L., and Whitfield, J.W., 1978, Water resources and geology of the Springfield area, Missouri: Rolla, Missouri Department of Natural Resources, Division of Geology and Land Survey, Water Resources Report 34, 160 p.
Federal Water Pollution Control Administration, 1969, James River-Wilsons Creek study, Springfield, Missouri: Ada, Okla., U.S. Department of the Inte-rior, Federal Water Pollution Control Administra-tion, Technical Services Program, Robert S. Kerr Water Research Center, v. 1, 60 p.
Fenneman, N.M., 1938, Physiography of the eastern United States: New York, McGraw Hill, 714 p.
Greenberg, A.E., and others, 1985, Standard methods for the examination of water and wastewater: Washington, D.C., American Public Health Asso-ciation, 16th edition, p. 886–899.
36 Water Quality, Selected Chemical Characteristics, and Toxicity of Base Flow and Urban Stormwater in Greene County, MO
Harvey, E.J., 1980, Ground water in the Springfield-Salem Plateaus of southern Missouri and northern Arkansas: U.S. Geological Survey Water-Resources Investigations Report 80–101, 66 p.
Harvey, E.J., and Skelton, John, 1968, Hydrology study of a waste-disposal problem in a karst area at Springfield, Missouri: U.S. Geological Survey Professional Paper 600–C, p. C217–C220.
Johnson, B.T., 1989, Rainbow trout liver activation sys-tems with the Ames Mutagenicity test: Environ-mental Toxicology Chemistry, v. 9, p. 1,183–1,192.
———1992a, An evaluation of genotoxicity assay with liver S9 for activation and luminescent bacte-ria for detection: Environmental Toxicology Chemistry, v. 11, p. 473–480.
———1992b, Potential genotoxicity of sediments from the Great Lakes: Environmental Toxicology Water Quality, v. 7, p. 373–390.
———1993, Activated Mutatox assay for detection of genotoxic substances: Environmental Toxicology Water Quality, v. 8, p. 103–113.
———1998, Microtox toxicity testing system—New developments and applications, in Wells, P.G., Lee, K., and Blaise, C., eds., Microscale testing in aquatic toxicology—Advances, techniques, and practice: Boca Raton, Fla., CRC Lewis Publishers, p. 201–218.
———2000, Revised—Activated Mutatox assay for detection of genotoxic substances, technical meth-ods section: Environmental Toxicology, v. 15, no. 3, p. 253–259.
Johnson, B.T., and Long, E.R., 1998, Rapid toxicity assessment of sediments from large estuarine eco-systems—A new tandem in vitro testing approach: Environmental Toxicology Chemistry, v. 17, p. 1,099–1,106.
Johnson, B.T., Petty, J.D., and Huckins, J.N., 2000, Collection and detection of lipophilic chemical contaminants in water, sediment, soil, and air, technical methods section: Environmental Toxi-cology, v. 15, no. 3, p. 248–252.
Kaiser, K.L.E., and Palabrica, V.S., 1991, Photobacte-rium phosphoreum toxicity data index: Water Pol-lution Research Journal, v. 26, p. 361–431.
Kennedy, E.J., 1983, Computation of continuous records of streamflow: U.S. Geological Survey Techniques of Water-Resources Investigations, book 3, chap. A13, 53 p.
———1984, Discharge ratings at gaging stations: U.S. Geological Survey Techniques of Water-Resources Investigations, book 3, chap. A10, 59 p.
Maron, D.M., and Ames, B.N., 1983, Revised methods for the Salmonella mutagenicity test: Mutation Research, v. 113, p. 173–215.
Microbics Corporation, 1992, Microtox manual—Con-densed protocol for basic test, v. III, Condensed protocols: Carlsbad, Calif., Microbics, p. 201–206.
Missouri Department of Natural Resources, 1996, Code of state regulations—Chapter 4, Contami-nant levels and monitoring: Jefferson City, Public Drinking Water Program, 18 p.
———1997, Missouri state water plan—Volume II, Groundwater resources of Missouri: Jefferson City, Water resources report number 46, 210 p.
Missouri Resource Assessment Partnership, 1999, Missouri land use land cover—Greene County: Data available on the World Wide Web, accessed December 8, 1999, at URL http://msdis.mis-souri.edu/html/Lulc2.html.
Myers, D.N., and Wilde, F.D., eds., 1997, National field manual for the collection of water-quality data—Biological indicators: U.S. Geological Sur-vey Techniques of Water-Resources Investiga-tions, book 9, chap. A7, variously paginated.
Pohl, R.J., and Fouts, J.R., 1980, A rapid method for assay of the metabolism of 7-ethoxyresorufin by microsomal subcellular fractions: Analytical Bio-chemistry, v. 107, p. 150–154.
Rantz, S.E., and others, 1982, Measurements and com-putation of streamflow: U.S. Geological Survey Water-Supply Paper 2175, v. 1 and 2, 631 p.
U.S. Census Bureau, 2001a, Ranking tables for incor-porated places of 100,000 or more, 1990 and 2000: accessed April 2001, at URL http://www.cen-sus.gov/population/cen2000/phc-t5/tab01.xls.
———2001b, Ranking tables for counties, 1990 and 2000: accessed April 2001, at URL http://www.census.gov/population/cen2000/phc-t4/tab01.xls.
U.S. Environmental Protection Agency, 2000, EPA announces elimination of all indoor uses of widely used pesticide diazinon, begins phase-out of lawn and garden uses: accessed October 2001 at URL http://yosemite.epa.gov/opa/admpress.nsf/blab9f485b098972852562e7004dc686/c8cdc9ea7d5ff585852569ac0077bd31?OpenDoc-ument.
References 37

U.S. Environmental Protection Agency, 2001, Chlo-rpyrifos summary, accessed October 2001, at URL http://www.epa.gov/pesticides/op/chlorpyrifos/summary.htm.
———2001a, Diazinon summary: accessed November 2001, at URL http://www.epa.gov/pesticides/op/diazinon/summary.htm.
———2001b, Overview of diazinon revised risk assessment: accessed November 2001, at URL http://www.epa.gov/pesticides/op/diazinon/over-view.pdf.
Waite, L.A., and Thompson, K.C., 1993, Development, description, and application of a geographic infor-mation system data base for water resources in karst terrane in Greene County, Missouri: U.S. Geological Survey Water-Resources Investiga-tions Report 93–4154, 31 p.
Whyte, J.J., Jung, R.E., Schmitt, C.J., and Tillitt, D.E., 2000, Ethoxyresorufin-O-deethylase (EROD) activity in fish as a biomarker of chemical expo-
sure: Critical Reviews of Toxicology, v. 30, p. 1–347.
Wilde, F.D., and Radtke, D.B., eds., 1997, National field manual for the collection of water-quality data—Field measurements: U.S. Geological Sur-vey Techniques of Water-Resources Investiga-tions, book 9, chap. A6, 31 p.
Wilde, F.D., Radtke, D.B., Gibs, J., and Iwatsubo, R.T., eds., 1999a, National field manual for the collec-tion of water-quality data—Collection of water samples: U.S. Geological Survey Techniques of Water-Resources Investigations, book 9, chap. A4, 160 p.
———1999b, National field manual for the collection of water-quality data—Processing of water sam-ples: U.S. Geological Survey Techniques of Water-Resources Investigations, book 9, chap. A5, 149 p.
Wurgler, F.E., and Kramers, P.G.N., 1992, Environ-mental effects of genotoxins (eco-genotoxicol-ogy): Mutagenesis, v. 7, p. 321–327.
38 Water Quality, Selected Chemical Characteristics, and Toxicity of Base Flow and Urban Stormwater in Greene County, MO