dpru - university of cape town
TRANSCRIPT

D P R U WORKING PAPERS
The Present as a Legacy of the Past:
The Labour Market, Inequality and Poverty in
South Africa
Servaas van der Berg and Haroon Bhorat
Development Policy Research Unit University of Cape Town
No 01/29 August 1999 ISBN: 0-7992-1972-X

THE PRESENT AS A LEGACY OF THE PAST: THE LABOUR MARKET, INEQUALITY AND POVERTY IN SA
1
1. Introduction
South Africa is an upper middle-income country with social indicators suggesting living standards closer though to those of lower-middle income or even low-income countries. This difference between its economic status and social development can largely be ascribed to high levels of material inequality that have left inordinately large numbers of people outside the economic mainstream. This implies that the society is highly inefficient in converting economic resources into social welfare. As is well known, the cause of this lies mainly in the long history of segregation and discrimination that has left a legacy of inequality and poverty and also, in more recent decades, low economic growth.
This paper is part of a larger research project, funded by the African Economic Research Consortium (AERC), that looks at poverty in South Africa mainly through the lens of the labour market. In order to understand present-day inequalities and how these are reflected in poverty, it is necessary to analyse the main forces that generated present socio-economic outcomes. Understanding the factors at work can also contribute to an understanding of the constraints on and possibilities for redistribution. Thus this paper acts as an introduction for the whole research project.
The next Section will provide a brief decomposition of possible sources of inequality, before we investigate the historical origins of this inequality and trends in inequality and in fiscal incidence in Sections 3 to 5. Section 6 provides a very brief overview of policy developments and Section 7 of present household poverty and labour market inequalities, while Section 8 is the conclusion.
2. Sources of inequality: A decomposition of the sources of material welfare
It is useful for such an analysis to start with the labour market as the major area of inequality. In terms of the labour market, remuneration is determined as the product of employment and wages, i.e. any analysis would have to deal with both access to employment, and the remuneration attached to such employment (hereafter referred to as wages).
But not all incomes are from remuneration. Non-remuneration income consists of income from the other factors of production (land rent, interest on capital, profits on entrepreneurship) as well as transfer incomes. Transfer incomes, because of their origin mainly as social assistance provided by the state, are a special case that will better be dealt with as part of fiscal issues. Thus the other sources of non-remuneration income can be divided between those that are a return to assets or wealth (land rent and returns to capital), and entrepreneurial income.
Formally, for any racial or other group, or any household, Y = Yw + Yn (eq.1) = W.E + Yn (eq.2)
where Y refers to the personal incomes, Yw to the portion accruing as remuneration incomes, Yn to the non-remuneration part of personal income, W to average remuneration rates, and E to the number of people in formal employment, i.e. receiving remuneration.
Expressed in per capita terms, where population is P: Y/P = W (E/P) + Yn/P (eq.3)
Thus shifts in the per capita income of a group, given its population, can be ascribed to one of three possible factors:
• changes in wage levels in the formal economy,

DPRU WORKING PAPER
2
• changes in employment relative to population1, and
• changes in non-remuneration income, mainly income from property or entrepreneurship (e.g. profits, dividends, interest receipts, farming income and income from informal businesses), as well as transfers.
As non-remuneration income is relatively slow to change, shifts in distribution are usually driven by either wage shifts or employment shifts, as will be discussed in Section 4.
Another source of material inequality lies in the fiscal incidence of government activities, both in terms of taxation and in terms of public spending, particularly social spending. Discriminatory budgets in South Africa have long been a corollary of apartheid and will be dealt with in some detail.
It is common to assume that welfare is a function of consumption. U = f(C) (eq.4)
However, welfare can more properly be seen as a function of so-called secondary income (Bromberger 1982) or command over resources, which is determined as primary or personal income minus direct taxation (i.e. disposable income) plus the value of public services consumed, i.e.
U = U(Ys) = U(Yp – Td + G) (eq.5)
where Ys = secondary income Yp = primary income Td = personal income taxes, and G = government spending/consumption of government services.
Many public spending benefits are impossible to assign to households, for instance, defence or police spending. The only major spending category that can be assigned with any degree of certainty is social spending, where the beneficiaries are in principle determinable. If this course is followed and other public expenditures are ignored, equation 2 above becomes
U = U(Ys) = U(Yp – Td + Gs) (eq.6)
where Gs = social expenditure2.
Thus, for any group, material welfare can be regarded as the sum of remuneration plus non-remuneration income, minus personal taxes plus social spending, i.e.
U = U(Yp – Td + Gs) =U(Yw + Yn - Td + Gs) (eq.7)
where Yw = remuneration income, Yn = other (non-remuneration) income.
For any group, remuneration, in turn, is the product of wage and employment (eq.2 above), thus U = U(W.E + Yn - Td + Gs) (eq.8)
If we are interested in welfare of any particular group in per capita terms, the focus should thus be on
• average wage levels for that group
• employment per capita
• non-remuneration income per capita
1 Note that this differs somewhat from the conventional focus on employment and unemployment relative to the labour force. In a purely short-term or static analysis, this difference may not seem very pertinent, but it emphasises the role of differential labour force participation rates between groups and over time. 2 As social spending includes social transfers, which are already counted in personal incomes, adjustments should be made to avoid double counting, by excluding social transfers from either primary income or social spending.

THE PRESENT AS A LEGACY OF THE PAST: THE LABOUR MARKET, INEQUALITY AND POVERTY IN SA
3
• personal income taxes per capita, and
• social spending per capita.
Given this starting point, it is appropriate to analyse the historical origin and trends of these various sources of material inequality to better understand present poverty and inequality. This will be done in Sections 3 to 5 below. From this analysis it will become clear why the focus in the broader research of which this study forms part falls on the labour force and not so much on other sources of inequality.
3. Origins of poverty and inequality in the South African labour market
Over the last one hundred years, political influences on the South African labour market were characterised by a plethora of legislation that was instrumental in maintaining, until the early 1970s, a workforce strictly divided on the basis of race3. Though particular economic interests provided the incentives for such labour market interventions, economic forces also often highlighted the inappropriateness of a racially constituted labour market. While in the early twentieth century the economy seemed to thrive on a divided workforce, industrialisation and the need for more skills meant that a segregated labour market would later become a hindrance to economic progress.
3.1 The mineral discoveries of the 1860s and 1880s
The discovery of diamonds in the 1860s and gold in the 1880s transformed South Africa from a closed, agrarian economy to one able to start out on a path of industrialisation and establish international economic linkages. The mining industry required a large, mass-based workforce. This was accomplished by coaxing black peasants to the mines and applying coercive methods such as the Glen Grey Act of 1894, which imposed a tax on all Africans who did not enter the mines on a three month contract (Ncube 1985: 14). To augment this labour tax, poll and hut taxes were imposed on the African rural population, thus increasing the incentive to earn cash on the mines. Through such legislative interventions, the mines came to rely on a cheap and steady supply of African labour from the rural areas.
3.2 1910-1922: Union and the origins of a discriminatory labour market
The Union of South Africa represented a political partnership between English-speaking and Afrikaner whites (representing at that time the mining and agricultural interests respectively) and excluded the African majority from any formal political expression (Terreblanche & Nattrass 1990:6). This minority government passed a series of laws that would deleteriously impact on the smooth functioning of the labour market:
• The Mines and Works Act essentially reserved skilled jobs on the mines for whites and thereby prevented the upward mobility of Africans on the mines.
• The Black Labour Regulation Act instituted a standard uniform wage rate for African mine workers and prevented African workers from breaking their employment contracts. This was buttressed by a provision which prevented employers from attracting workers through higher wages (Greenberg 1980:154).
• The 1913 Land Act forbade Africans from owning land in designated 'white' areas and resigned Africans to 'reserves' which accounted for 7% (later 13%) of the total land area of South Africa. The Land Act also limited the number of African families that could live on white farms, thereby forcing many African peasants out of farming and into wage labour.
3 For the purposes of the study, we use the race classification system, where the society is divided into four groups, namely African, coloured, Asian and white. African, coloured and Asian individuals are collectively referred to here as blacks.

DPRU WORKING PAPER
4
• The pass laws curtailed the free flow of African labour and served as an auxiliary weapon in the migrant labour system, forcing many workers to take whatever jobs were available, thus weakening their bargaining power and trapping many in low-wage sectors such as agriculture and domestic services (Ncube 1985:17).
Securing a steady supply of labour for the mines was the responsibility of the Witwatersrand Native Labour Association (WNLA), which sought to hire labour from Southern Africa, and the Native Recruiting Corporation (NRC), which was set the task of domestic recruitment. This control exercised over the supply of mine labour has led to this sector being characterised as an example of a 'collaborative monopsony' wherein mining interests colluded to ensure a stable, predictable flow of labour from rural areas to the fast growing industry (Marks & Rathbone 1982:88).
As a result, the labour market in this period was characterised by a growing number of migrant workers. Furthermore, an overlap between occupation and race developed, i.e. a racial division of labour, that would be carried into other sectors of the economy in the process of industrialisation, and would persist for decades.
3.3 1922-1933: The Pact government’s repressive labour policies
On the mines, almost equally poor white workers competed with Africans for jobs. Whereas African workers usually had a second source of subsistence in tribal agriculture, white mineworkers were more fully proletarianised. When the mines in the early 1920s started replacing white workers by lower paid Africans to reduce costs in the face of falling mine incomes, it culminated in a bloody conflict between white mineworkers and state forces. This 'Rand Revolt' had significant political and economic ramifications. One outcome was the passing of the Industrial Conciliation Act in 1924, that provided a legal framework for collective bargaining between workers and management. But by specifically excluding African employees from the provisions of this framework, it laid the basis for a racially discriminatory labour market, the legacy of which is still present in the labour market today.
The government response to the strike contributed to an electoral pact between the National and Labour Parties, an alliance between Afrikaner nationalists and English-speaking socialists, and played an important part in their electoral victory in 1924. Given its constituency of white farmers and white workers, the Pact government aimed to improve the position of agriculture, stimulate domestic industry to reduce the dominance of mining, improve the position of white workers, and address the poor white problem. Its economic policies included five sets of measures that were to have a lasting influence on South African economic development for at least half a century:
• The system of agricultural co-operatives
• The agricultural marketing boards and the system of controlled marketing this gave rise to
• Tariff protection to stimulate domestic industry at the expense of imports
• A major role for the state as industrial entrepreneur through state corporations such as ISCOR
• Protection of white workers against black competition by the "civilised labour" policy.
In the industrial sphere, tariff protection remarkably stimulated domestic industry and employment. In the five decades following the electoral victory of the Pact government (spanning the Great Depression), manufacturing employment expanded tenfold, i.e. at almost 5% per year (SA Statistics 1988: 12.6). As a consequence, more black workers were drawn into the urban workforce as unskilled labourers in the growing manufacturing industry. African manufacturing employment grew by one-third from 46 813 in 1916 to 69 830 in 1928, rising from 35% to 43% of total manufacturing employment. (South Africa, 1960)
Yet industrial expansion behind tariff barriers was combined with repressive labour measures that ensured that the fruits of this growth were inequitably distributed. The 1925 Wage Act extended the ‘civilised labour policy’ by further protecting remuneration to whites and ensuring a minimum wage payable to white employees (Saldru 1989). This policy also included job reservation that confined certain skilled occupations to
THE PRESENT AS A LEGACY OF THE PAST: THE LABOUR MARKET, INEQUALITY AND POVERTY IN SA
5
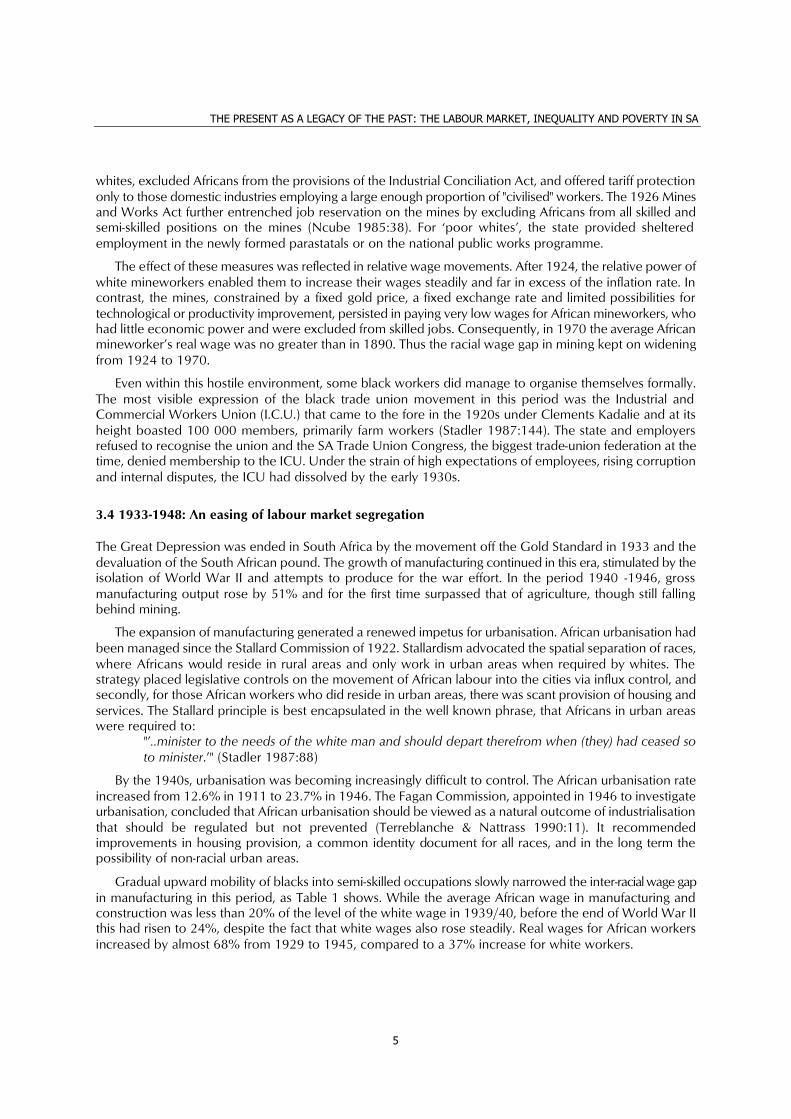
whites, excluded Africans from the provisions of the Industrial Conciliation Act, and offered tariff protection only to those domestic industries employing a large enough proportion of "civilised" workers. The 1926 Mines and Works Act further entrenched job reservation on the mines by excluding Africans from all skilled and semi-skilled positions on the mines (Ncube 1985:38). For ‘poor whites’, the state provided sheltered employment in the newly formed parastatals or on the national public works programme.
The effect of these measures was reflected in relative wage movements. After 1924, the relative power of white mineworkers enabled them to increase their wages steadily and far in excess of the inflation rate. In contrast, the mines, constrained by a fixed gold price, a fixed exchange rate and limited possibilities for technological or productivity improvement, persisted in paying very low wages for African mineworkers, who had little economic power and were excluded from skilled jobs. Consequently, in 1970 the average African mineworker’s real wage was no greater than in 1890. Thus the racial wage gap in mining kept on widening from 1924 to 1970.
Even within this hostile environment, some black workers did manage to organise themselves formally. The most visible expression of the black trade union movement in this period was the Industrial and Commercial Workers Union (I.C.U.) that came to the fore in the 1920s under Clements Kadalie and at its height boasted 100 000 members, primarily farm workers (Stadler 1987:144). The state and employers refused to recognise the union and the SA Trade Union Congress, the biggest trade-union federation at the time, denied membership to the ICU. Under the strain of high expectations of employees, rising corruption and internal disputes, the ICU had dissolved by the early 1930s.
3.4 1933-1948: An easing of labour market segregation
The Great Depression was ended in South Africa by the movement off the Gold Standard in 1933 and the devaluation of the South African pound. The growth of manufacturing continued in this era, stimulated by the isolation of World War II and attempts to produce for the war effort. In the period 1940 -1946, gross manufacturing output rose by 51% and for the first time surpassed that of agriculture, though still falling behind mining.
The expansion of manufacturing generated a renewed impetus for urbanisation. African urbanisation had been managed since the Stallard Commission of 1922. Stallardism advocated the spatial separation of races, where Africans would reside in rural areas and only work in urban areas when required by whites. The strategy placed legislative controls on the movement of African labour into the cities via influx control, and secondly, for those African workers who did reside in urban areas, there was scant provision of housing and services. The Stallard principle is best encapsulated in the well known phrase, that Africans in urban areas were required to:
"’..minister to the needs of the white man and should depart therefrom when (they) had ceased so to minister.’" (Stadler 1987:88)
By the 1940s, urbanisation was becoming increasingly difficult to control. The African urbanisation rate increased from 12.6% in 1911 to 23.7% in 1946. The Fagan Commission, appointed in 1946 to investigate urbanisation, concluded that African urbanisation should be viewed as a natural outcome of industrialisation that should be regulated but not prevented (Terreblanche & Nattrass 1990:11). It recommended improvements in housing provision, a common identity document for all races, and in the long term the possibility of non-racial urban areas.
Gradual upward mobility of blacks into semi-skilled occupations slowly narrowed the inter-racial wage gap in manufacturing in this period, as Table 1 shows. While the average African wage in manufacturing and construction was less than 20% of the level of the white wage in 1939/40, before the end of World War II this had risen to 24%, despite the fact that white wages also rose steadily. Real wages for African workers increased by almost 68% from 1929 to 1945, compared to a 37% increase for white workers.

DPRU WORKING PAPER
6
Table 1: Average real wages in manufacturing and construction by race (in 1970 Rand per worker)
Year White African Wage ratio (African as % of white level)
1929/30 R1 258 R247 19.6% 1935/36 R1 413 R263 18.6% 1939/40 R1 418 R278 19.6% 1944/45 R1 726 R414 24.0%
Source: Lipton 1986:409
The black trade union movement was revived in this era. For example, the Council of Non-European Trade Unions came to the fore, and in 1941, the African Mine Workers Union (AMWU) was formed (Webster 1986:16). The growing militancy of black miners led to the 1946 black miners' strike that affected almost half of the mines, stopped production on at least twelve mines and involved approximately 76 000 workers (Greenberg 1980:157). As a consequence, the number of workdays lost in production rose dramatically from 91 180 in 1945, to 209 350 in 1946 and to 1 378 063 the following year. Although the strike was eventually squashed by the government, it represented the first serious challenge by black workers to the existing industrial relations system and to wages and working conditions in mining.
Other reforms mooted in this period included the abolition of the pass system and the recognition of African trade unions. In concurring with the Fagan Commission, the Department of Native Affairs suggested that influx control be abolished. To this end regulations on the flow of African labour were relaxed and the number of prosecutions for pass law violations fell (Lipton 1986: 22).
The recommendations of the Fagan Commission meant that Africans would be competing for the same jobs as poor whites and would be able to undercut unskilled white workers. Occupational mobility of Africans in the manufacturing sector also increased pressures on whites in semi-skilled occupations. Together with the spectre of a large organised black workforce manifest in the strike of 1946, this exacerbated existing tensions between Afrikaner nationalists and the ruling United Party. The 1948 election was won by a Nationalist Party that was able to appeal to the economic fears and nationalist sentiments of Afrikaners under the banner of apartheid. The marginal gains attained in the labour market under Smuts’s United Party, were to be viciously reversed in the subsequent period.
3.5 1948-1973: The apartheid labour market
Political apartheid became institutionalised after 1948 and eventually operated at three levels. At the macro level, "grand apartheid" tried to create black nation-states and to give these economic content by development of the homelands and the policy of industrial decentralisation. At the intermediate or meso level, apartheid emphasised separation between race groups ("own community life") through influx control, urban settlement patterns (Group Areas), population removals, separate schools, and so on. At the micro level, "petty apartheid" emphasised separation between individuals of different race groups through separate amenities (e.g. parks, sports fields, etc.), prohibition of interracial marriages and sexual relations, etc. While macro level apartheid was fiscally the most costly, meso level apartheid measures probably had a greater detrimental economic impact through their labour market effects. As long as the economy was still relatively underdeveloped, inward looking and expanding rapidly, the costs of these measures could be borne with ease, but these costs grew with time, especially once the economic boom of the 1960s had ended.
The government aggressively promoted the employment of whites in state controlled enterprises and in the burgeoning bureaucracy, revitalised public relief programmes to ensure short term employment for whites, gave assistance to Afrikaner business, and supported commercial (white) agriculture through a variety of measures.
The onslaught on the black population is now well documented, and it is here only necessary to discuss briefly some of the policies that specifically affected the labour market. One of the first actions of the new government was to overturn the Fagan Report. The Sauer Commission witnessed a reversion to the Stallard

THE PRESENT AS A LEGACY OF THE PAST: THE LABOUR MARKET, INEQUALITY AND POVERTY IN SA
7
principle of labour control (Lipton 1986:22). Indeed, a striking feature of this period was the energy put into reaffirming and tightening up influx control. Labour Bureaux were established, through the 1968 Bantu Labour Regulation Act, to control the movement of such labour. Pass law related arrests reached 700 000 in 1968 (Lipton 1986:35), which constituted approximately one arrest for every twenty economically active Africans. Although the National Party altered influx control and increased its complexity, it was essentially a reversion to past policies. But as South Africa was by then a much more industrialised country than when Stallardism was first imposed, it was much more in conflict with labour market needs.
The Bantu Labour (Settlements of Disputes) Act of 1953 tightened the exclusion of Africans from the industrial relations system by barring African workers from registered unions and forbidding strikes by African employees (Greenberg 1980:160). Instead African workers were provided a separate system of 'works' and 'liaison' committees within which management and African workers were meant to negotiate terms of employment (Lipton 1986:27).
The upward mobility of black workers was halted by a series of complementary legislation. The Industrial Conciliation Act of 1956, for example, assured the maintenance of the racial division of labour and significantly widened the ambit of the 'civilised labour ' policy to all sectors. In reaction to employer resistance, a 1959 amendment to the Act assured that the state could overrule an Industrial Council agreement, thus giving the state almost complete control over the hiring practices of private sector employers. White workers were given preference in the public sector and in many cases black labour was substituted by white labour (Lipton 1986:24). In government services, for example, African employment fell by 12% between 1946 and 1951.
As an auxiliary to job reservation, the 1953 Bantu Education Act required that African education be largely self-funded, thus tying expenditure on African education to revenue earned in the form of taxes from Africans (Bromberger 1982). In the early years of National Party rule, expenditure on African education fell in per capita terms, and it declined from 13% of white levels in 1953 to only 10% in 1961 (SAIRR 1961).
Thus African school-leavers entered the labour market at a severe disadvantage. At the point of entry to jobs, further discrimination was evident in the form of a 'civilised labour' policy that gave first preference to white workers. If Africans were able to gain entry into a job their mobility was curtailed and their bargaining power reduced through constraints on trade union activity. Thus from pre-employment to employment, African workers faced legislation that sought to undermine their ability to accumulate human capital, to increase their wages, to gather relevant job experience, and to negotiate for better wages and working conditions.
While industrial expansion during the Second World War had improved the relative wage of blacks, the end of the war and National Party rule shifted economic power back to white workers. Thus the African to white wage ratio returned to its pre-war level by 1960. In the high-growth era of the 1960s, it was even to deteriorate somewhat (as shown later in Table 2b), as whites were the main beneficiaries of the expanding need for skills created by the economic boom.
In the midst of these dramatic changes, the South African economy experienced a decade of unprecedented growth. Economic growth in the period 1961 to 1970 exceeded 5%. Large capital inflows, a high gold price and abundant cheap labour sustained these golden years of the apartheid economy.
The boom period created a greater demand for skilled labour, thus the state resorted to encouraging immigration, upgrading the skills of employed whites and also enticing women into the labour market (Lipton 1986: 33-34). It nevertheless became increasingly difficult to rely solely on a small base of white employees. The state responded by allowing the colour bar to become de facto a 'floating bar'. This involved the reclassification of jobs to allow blacks to be trained in the less skilled components of 'white jobs'. Racial divisions were still strictly adhered to, as no black worker could supervise a white employee (Lipton 1986:33). In addition, skilled work for blacks was limited, particularly where it competed with whites. The mobility allowed by the government was constrained as it sought to maintain the rigid overlap between race and occupation (Lipton 1986:33).

DPRU WORKING PAPER
8
Thus the windfall economic gains of the 1960s heightened the tension between legislative provisions in the labour market and the economy's need for a wider skills base. The state's response was an attempt to institute concessions within the broader realm of an apartheid labour market, an approach whose bankruptcy was to become more apparent in the following two decades.
3.6 1973-1990: The origins of the post-apartheid labour market
The first oil shock began an era of prolonged recession and a structural crisis from which the South African economy is still trying to recover. Economic growth rates were below population growth for most of this period, and per capita income declined by 15% from 1974 to 1993.
Politically, during this period the National Party resorted to increasingly desperate measures to maintain power as resistance to apartheid grew. Its policy responses vacillated between oppression and reform, as reflected in, e.g., the 'total onslaught' strategy, half-hearted attempts at political reform as encapsulated in the tricameral parliament, and more fundamental labour and urbanisation policy reforms (discussed below). Explosive examples of the clash between oppression and resistance include the 1976 Soweto uprising and numerous struggles by communities in the 1980s. Faced with a chronic crisis, a hostile international community and the obvious anachronism of apartheid, political reforms ensued in 1990, resulting in a democratically elected government in April 1994.
In the labour market, perhaps the most important events of this period were the 1973 wild cat strikes, which were as spontaneous as they were widespread. It forced both government and employers to rethink their industrial relations strategies. Their responses were embodied in the Wiehahn and Riekert Commissions of 1979.
The Wiehahn Commission recommended the legalisation of black trade unions and the scrapping of job reservation. This led to the Industrial Conciliation Amendment Act of 1979, which widened the definition of an employee to include African workers, although migrant workers initially remained excluded and the Act still barred non-racial trade unions (this provision was to be omitted two years later) (Saldru 1991). Notably also, agricultural and domestic workers remained excluded from the ambit of the 1979 Act. One of the results of these reforms was a more than threefold growth in trade union membership, from 701 758 in 1979 to 2 458 712 in 1990. Thus the upshot of the Wiehahn Commission was a black workforce with greater bargaining power and increasingly drawn into the regulated labour market, where they were now covered by legislation on minimum conditions of employment.
The Riekert Commission investigated the issue of African labour mobility. It argued for the relaxation of controls on workers who held rights of urban residence or employment, to allow for a freer flow of labour to the cities. Given the mining industry's increased reliance on local labour and pressure from the manufacturing industry for a stable workforce, influx control was abolished in 1986. This eradicated one of the last pillars of the apartheid labour market.
3.6.1. Wage and income inequality
Between the Second World War and the late 1960s, African wages across all sectors had remained fairly stagnant. However, from the 1970s onwards, wages rose rapidly for all groups but whites. Indeed, this rise in wages is considered to be one of the most important factors explaining the change in income distribution patterns over the last twenty years, and its cause can to a large extent be found in an important shift in relative economic power.
In mining, there was a dramatic turnaround in trends in the racial wage gap, which had widened consistently until the early 1970s, but then started narrowing from both sides as African real wages rose startlingly in the 1970s, while white wages often lagged behind inflation (Table 2a). Black wages in mining were only 6% of white wages in 1960, but by 1985 this figure had risen to 19% (Table 2b). Indeed, from

THE PRESENT AS A LEGACY OF THE PAST: THE LABOUR MARKET, INEQUALITY AND POVERTY IN SA
9
1972 to 1980, mean African wages in mining increased almost threefold (by 184%). In manufacturing and construction, too, the wage gap narrowed considerably, if not as spectacularly. The major causes of these changing wage trends of the 1970s and beyond were the increased bargaining power of particularly African workers, their access to higher occupational levels due to the growth of the skills scarcity in the 1960s, and rising educational levels.
Table 2a: Real growth of wages of whites and Africans by industry/sector, 1945-93 (% p.a.)
Sector Race 1945-60 1960-72 1972-75 1975-80 1980-85 1985-93 Manufacturing Whites 3,05 3,35 0,92 1,16 0,08 -0,80 Africans 0,44 2,57 7,57 3,62 1,59 1,21 Construction Whites 1,89 4,18 -1,63 1,42 -0,56 -2,68 Africans 0,07 3,38 6,07 -0,38 2,16 -2,67
Mining* Whites 2,35 2,48 4,44 -1,59 0,36 Africans 0,31 1,32 29,59 5,44 3,12 All races 1,57 1,51 15,74 2,51 1,65 1,17 Formal sector* Whites 0,83 -0,79 1,79 Africans 10,47 3,29 2,88 All races 2,42 0,75 1,75 1.38 Non-primary Whites -0,74 1,22 -0,28 Sectors Africans 2.85 2,28 3,12 All races 0,58 1,76 1,26
* The 1980-85 period is replaced by 1980-84 for the White and African groups as a racial breakdown was not provided after 1984.
Source: Hofmeyr 1999, Table 2
Table 2b: Real growth of black wages and black: white wage gap by industry, 1960-94
Mining Manufac-turing
Con-struction
Annual growth of real black wage: 1961-70 0.72% 2.69% 2.96% 1971-80 13.18% 4.61% 2.83% 1981-85 -0.14% 0.81% 1.15% 1985-94 .. 1.21% -0.29% Black wages as % of white levels: 1960 6% 19% 18% 1970 5% 17% 15% 1980 17% 23% 19% 1985 19% 25% 21% 1994 .. 29% 30% Source: Fallon 1992, SA Labour Statistics 1995
Econometric investigation confirm that higher levels of education and training amongst blacks, a decline in wage discrimination and the rise of powerful black trade unions had all contributed to this rise in black wages in the 1970s (Hofmeyr 1990). As Tables 3a and 3b illustrate, greater occupational mobility amongst African workers was evident in the labour market. Hence, in all occupations from manager to semi-skilled manual workers, African workers' representation improved from 1969 to 1977. Though definitional differences make Tables 3a and 3b not strictly comparable, it is also clear that this major shift in the occupational distribution of the African population has continued, as is evident by comparing, e.g., the 40% in elementary occupations in 1995 with the 71% in manual unskilled occupations in 1969 and the 62% in 1977.

DPRU WORKING PAPER
10
Table 3a: Share of white and African employment by occupation, 1969 & 1977
White 1969 White 1977 African 1969 African 1977
Managers 8.22% 11.28% 0.39% 0.46% Professional/semi-professional 10.11% 11.52% 1.89% 2.53% Clerical, white collar 42.74% 43.29% 6.29% 9.17% Supervisors 4.71% 5.24% 0.48% 1.15% Skilled manual 22.98% 22.72% 2.86% 4.97% Semi-skilled manual 8.68% 4.91% 16.73% 19.67% Unskilled manual 2.56% 1.06% 71.37% 62.04% Total economically active 100% 100% 100% 100%
Due to rounding, figures may not all add up to exactly 100% Source: Simkins & Hindson 1979
Table 3b: Share of white and African employment by occupation, 1995
Whites Africans Legislators, senior officials, managers 14.62% 2.91% Professionals 8.41% 2.00% Technicians, related professionals 18.51% 9.65% Clerks 22.52% 7.84% Services, shop & market sales 10.57% 11.18% Skilled agriculture & fisheries 3.58% 0.65% Craft, related trades 14.97% 10.22% Plant, machine operators & assemblers 3.84% 14.04% Armed forces 1.64% 40.08% Elementary occupations 0.17% 0.22% Occupation unspecified, unknown 1.21% 1.18% Total economically active 100% 100% Due to rounding, figures may not all add up to exactly 100% Source: South Africa 1996a.
The anachronism of a racially divided labour market constructed by specific legislative interventions had thus become clear from the 1970s onwards. The urgency of promoting economic growth dictated the need to allow for occupational mobility and increased wages for black workers. In a sense, continued economic stagnation provided proof of the limitations of racist labour market provisions. Thus the labour market began to reveal a perceptible alteration from the rigid racial division of labour that had existed in the past. Increasingly, the overlap between race and occupation was blurring.
3.6.2. A segmented labour market
What is clear from the above is that the numerous obstacles faced by black workers in the labour market began to be eroded in this period. Hence black workers were given the right to organise in trade unions, real wages rose rapidly and occupational mobility was evident. However, these positive developments were counterpoised by growing unemployment in an environment of poor economic growth rates. The corollary of South Africa's economic stagnation has been unemployment. Over the years this unemployment has come to manifest as structural in nature. Rising unemployment was a result not only of inadequate economic growth but also of the relative costs of capital and labour. Apart from union action, state policy also contributed to making it cheaper to use capital. Such policies included negative real interest rates for a long period, tax concessions on capital equipment and an overvalued exchange rate.
Between 1976 and 1990 the number of those without formal sector jobs increased by 32%. By 1994, about half of the economically active population were unable to find formal sector employment. Indeed, employment growth had remained below labour force growth for almost all of the past quarter of a century.

THE PRESENT AS A LEGACY OF THE PAST: THE LABOUR MARKET, INEQUALITY AND POVERTY IN SA
11
Growing unemployment translates into a higher incidence of poverty and general social degradation amongst the affected groups.
In order to better appreciate the effect of the poor performance of the economy on the composition of employment and its impact on income distribution, it is useful to decompose the South African labour force into three groups according to their access to the modern consumer economy:
• Those employed in the core consumer economy, consisting of the dominant high-wage modern sectors manufacturing, government service, and other industry and services. Mining is for present purposes not included in this sector.
• Those employed in the marginal modern sectors. In this group we include the two low-wage sectors of commercial agriculture and domestic service, as well as mining. Although mining is not any longer a low wage sector, many mining workers are only tenuously linked to the modern economy, as the dependants of single migrants residing in mine compounds do not fully participate in modern consumer society.
• The peripheral labour force, whose existence signifies substantial job scarcity in the formal sectors. In this group we include subsistence agriculture, the informal sector, and the unemployed.
Many households, of course, have more than one earner, and earners may fall in different sectors. Nevertheless, even for households this division is pertinent. The sharp wage rises for Africans in the modern sectors since the early 1970s have sharply reduced poverty wages amongst most workers in the core modern sectors and reduced poverty amongst households dependent on their earnings, though there is still much poverty in households mainly dependent on the modern marginal sectors. Poverty in its most extreme form is most widespread in the peripheral sectors, where most potential earners are jobless or under-employed.
Table 4: Decomposition of the labour force into sectors by access to modern consumer economy
1960 1970 1985 1994 Core economy 29% 46% 40% 35%
(manufacturing, government, other industry and services) Modern marginal sectors 47% 32% 20% 15%
(commercial agricultural, domestic service, mining) Peripheral labour force 24% 22% 40% 50%
(subsistence agriculture, informal sector, unemployed) Source: Calculations based on: Van der Berg 1987; South African Labour Statistics (various years). Sadie’s relatively high labour force estimates (Sadie 1991) were used, thus leading to a larger peripheral sector than observed by the OHS1995.
By 1994, the core modern economy contained about 35% of the labour force, and the marginal modern economy about 15%, thus leaving about half the labour force (liberally estimated) without formal employment. As can be seen from Table 4, the share of the core is decreasing. Instead of expanding rapidly so as to draw increasing proportions into the mainstream consumer society, employment in the core economy is virtually stagnant. The only growing component in the last decades has been the public sector, whilst all three components of the marginal modern economy are shrinking. The brunt of the increase in the labour force thus falls upon the peripheral sectors, the unemployed, subsistence agriculture, and the informal sector - precisely those sectors experiencing most poverty. Growth of employment in the core economy is crucially affected by the overall growth rate in the economy, and the scope for a further reduction in poverty is largely determined by the ability of the core economy to create more jobs.
3.7 Conclusion
This Section has shown how the history of the South African labour market was forged by the interaction between political agendas and economic needs. As the economy developed, the state insisted on promoting and protecting white workers at the expense of both black workers and longer term economic interests. This

DPRU WORKING PAPER
12
contradiction was most starkly revealed in the period from the 1970s onwards, and only after one and a half decades of abysmal economic performance did the state seek to break from the past. In doing so it overturned the last vestiges of legislated racism in the labour market, strengthening market forces that had already sharply reduced labour market discrimination despite the effects of legislation.
We shall now turn to trends in income inequality to show how labour market trends mapped onto changes in society-wide inequality.
4. Trends in income inequality
4.1 Wages
Wage trends have largely already been discussed in Section 3 above, as part of the history of the South African labour market. As became apparent, unequal job access was historically a major source of racial wage inequality. Before its abolition, job reservation affected job access of generations of blacks and it will long have a residual effect. Though job reservation no longer applies, unofficial discrimination and cultural barriers still make it difficult for blacks to compete on an equal footing in the job market. Affirmative action policies attempting to overcome the effect of these barriers, on the other hand, may become a new source of inefficiency in the labour market.
The superior occupational profile of the white South African labour force when compared even to industrial countries can be ascribed to white upward job mobility far beyond their capacity, especially in the 1970s. "The adjustment to the scarcity of (high-level manpower) has been a dilution of skill requirements" (Sadie 1982:28) (also refer again to Table 3). Job reservation and inadequate education and training of blacks contributed greatly to artificially rapid white occupational mobility. Nevertheless, as discussed above, the pattern of wage discrimination changed from the 1970s. Within a given job grade and standardising for gender differentials, racial wage differentials have declined considerably since the mid-seventies, as shown in Table 5, i.e. the "rate for the job" is increasingly applied (though this says nothing about differential access to particular jobs). As early as 1989, African wages were barely 15 per cent lower than those of whites in a similar job grade and of the same gender, a substantial reduction in discrimination since the 43 per cent differential of 1976, and this had occurred before the apartheid era had formally come to an end. Using other data sources, Moll (1998:1 & Table 10) came to a similar conclusion: total discrimination fell from 20% of the African wage in 1980 to 12% in 1993.
Table 5: Relative wage levels by race for similar gender and job grade (% of white levels)
White Coloured Indian African 1976 100% 62.2% 67.0% 57.1% 1985 100% 78.8% 87.3% 78.2% 1989 100% 79.9% 89.4% 84.7% Source: McGrath 1990:97
4.2 Non-remuneration income
As indicated in Section 2, non-remuneration income consists of income from non-labour factors of production (capital, land, entrepreneurship) and from transfers. As social security transfers are best discussed as part of fiscal distribution, we shall confine ourselves in this section to a brief analysis of the other sources of income mentioned. For convenience, we may think of such income as being returns to wealth (capital, land) and returns to entrepreneurship.
Naturally, the poor are not able to accumulate wealth to the same extent as the rich, therefore wealth - and thus by implication also the returns to wealth - is more concentrated than is income. This is readily

THE PRESENT AS A LEGACY OF THE PAST: THE LABOUR MARKET, INEQUALITY AND POVERTY IN SA
13
apparent from the fact that wealth derives from postponed consumption, and the very poor can hardly postpone consumption. This can be illustrated from the simple Keynesian consumption function of the form
C = Ca + cY (eq.9) where
C = consumption Ca = autonomous consumption, i.e. that part of consumption that takes places even when there is
no income in the period concerned c = the marginal propensity to consume, and Y = income.
If income can be either consumed or saved, it follows that S = -Ca + (1-c)Y (eq.10) where ........................................................................................................................................................................................ S = savings
If indeed autonomous savings are negative (–Ca), it follows that the average propensity to save (S/Y) rises with the level of income. Thus it is not unexpected that wealth (accumulated savings) is more concentrated than income.
The above analysis of course applies in the short term. In the long term, changes in income over time and inter-generational transfers also become important. In South Africa, however, accumulation of assets was hardly possible for the majority of the African population in the heyday of apartheid. Moreover, the one important asset in African hands, communal land, was not marketable and did not generate much by way of returns to wealth.
Economic theory is not yet able to tell us much about the origins and diffusion of entrepreneurship. What is known, however, is that lack of education, of exposure to the modern consumer economy and modern technology, and the lack of access to entrepreneurial credit (due inter alia to the fact that communal land could not serve as collateral on loans) prevented Africans from participating in the modern economy as entrepreneurs perhaps as much as did direct restrictions on business activity. The combined effect was to leave African income from entrepreneurship at relatively low levels, despite more recent growth of the informal sector. Similar, but somewhat less stringent constraints also inhibited coloured and Indian entrepreneurial activity and accumulation of assets.
Thus non-remuneration income is more concentrated than income from remuneration, and is also likely to follow rather than to lead racial shifts in the latter. For this reason, we shall largely confine our analysis to remuneration income in this paper, and indeed for the rest of this research project. However, before leaving the labour market to hold full sway as the major source of inequality of income and source of poverty in South Africa, it is still necessary to provide a summary of the levels and trends of inter-group income inequality and then to analyse that part of material control over resources which does not come through the market, i.e. social spending, which is done in Section 5 on fiscal incidence.
4.3 Income inequality
Changing wage gaps do not in full measure lead to changes in the income gap, as wage income (the major source of income) is the result of the interaction of wages and employment opportunities relative to population. Whilst changing wage levels are important, other determinants of employment relative to population also play a role in per capita incomes, such as changing age structure, labour force participation rates, and the availability and distribution of employment. Table 6 shows estimates mainly based on various surveys since 1917 of the per capita income of the different race groups. Due to the variety of income/expenditure concepts used and the data deficiencies inherent in all the surveys, these figures should not be interpreted too finely. In particular, the October Household Survey/Income and Expenditure Survey (OHS/IES) of 1995 may have overestimated per capita African incomes through inadequately capturing some of the poorest segments amongst Africans.
Nevertheless, despite these provisos, it is still possible to draw some broad conclusions as to movements in per capita income from these data. In the first place, the mean per capita income of the poorest group –

DPRU WORKING PAPER
14
Africans – reached the poverty line around 1970 and has doubled since, but even today many members of this group are still in poverty, as will be discussed later. In the high-growth 1960s the African/white income gap actually increased, because skills scarcity, exacerbated by the industrial colour bar, led to a premium being paid on the wages of relatively skilled white workers. In the early 1970s, the shift in economic power and to a lesser degree changing skill profiles narrowed the wage gap and thereby the income gap. Thereafter, the impact on the income gap of the continued narrowing of the wage gap was partly counteracted by growing unemployment amongst those with the least skills and education.4 Economic growth best translates into a reduction of the inter-group income gap when the racial wage gap narrows and there is sufficient growth of employment.
Table 6: A compilation of estimates of per capita personal income by race group in 1995-Rand and relative to white levels, 1917-1995
White Coloured Indian African Average Per capita income in constant 1995-rand: 1917 R9 369 R2 061 R2 075 R849 R2 829 1924 R9 931 R1 986 R1 931 R788 R2 966 1936 R13 773 R2 151 R3 185 R1 048 R3 842 1946 R18 820 R3 068 R4 328 R1 671 R5 417 1956 R21 861 R3 698 R4 780 R1 883 R6 123 1959 R22 683 R3 568 R3 876 R1 746 R6 061 1960 R22 389 R3 568 R3 828 R1 815 R6 006 1970 R32 799 R5 684 R6 630 R2 246 R7 986 1975 R35 757 R6 945 R9 095 R3 075 R9 102 1980 R34 655 R6 623 R8 821 R2 931 R8 472 1987 R32 854 R6 862 R9 910 R2 781 R7 643 1993 R33 326 R6 445 R14 006 R3 637 R8 013 1995 R34 689 R6 931 R16 793 R4 678 R9 013 Relative per capita personal incomes (% of white level): 1917 100 22.0 22.1 9.1 1924 100 20.0 19.4 7.9 1936 100 15.6 23.1 7.6 1946 100 16.3 23.0 8.9 1956 100 16.9 21.9 8.6 1959 100 15.7 17.1 7.7 1960 100 15.9 17.1 8.1 1970 100 17.3 20.2 6.8 1975 100 19.4 25.4 8.6 1980 100 19.1 25.5 8.5 1987 100 20.9 30.2 8.5 1993 100 19.3 42.0 10.9 1995 100 20.0 48.4 13.5 Source: Own estimates based on McGrath 1983, official national accounts data, 1993 PSLSD, and 1995 OHS/IES.
The major recent distributional trends are the gradual narrowing of the African/white income gap concurrent with the widening income gap among Africans, mainly due to differential access to formal employment. While some benefited from a doubling of their real wages in the past two decades, unemployment, which affects mainly the poorly educated, has also increased. Unemployment and therefore also income inequality have strong geographic dimensions, with insiders being largely urban and outsiders rural. A strong rise in the income of Indians has improved their position considerably, but due to their small numbers they play a minor role in the broader picture of inequality in South Africa.
4 The narrowing income gap indicated by the last surveys may in part be the result of a better capturing of non-formal incomes in the two most recent surveys, and the already mentioned deficiencies of the 1995 OHS/IES.

THE PRESENT AS A LEGACY OF THE PAST: THE LABOUR MARKET, INEQUALITY AND POVERTY IN SA
15
5. Fiscal incidence and differential social spending
In South Africa, fiscal incidence studies have naturally focused on the racial incidence of taxation and more particularly of public spending. Until recently blacks have paid a small portion of overall taxation and the focus of fiscal incidence studies fell mainly on determining the extent of racial inequality in public expenditure amongst race groups.
Fiscal incidence studies commonly depart from the notion of equity of the net gains and the losses from public expenditure and taxation to gauge the political and policy priorities of a government. Our concern is more specifically with equity in the post-fiscal distribution, i.e. with material outcomes of all economic processes, of which the budget is but one, as a household's welfare in terms of command over goods and services depends not only upon the personal incomes members earn, but also on the taxation and the spending of government.
Just as shifting of the tax burden implies that the statutory incidence of taxation might be quite different from the actual or economic incidence, public expenditure also can have unintended consequences, e.g. means tested welfare transfers may affect decisions on labour force participation, consumption, household formation (marriage), and perhaps sometimes even fertility. Most incidence studies really only consider the static or statutory effects of the budget and not the dynamic effects or the effects of previous rounds of taxation or spending. De Wulf (1975:75) warns against the impression of preciseness left by incidence studies and points out that such estimates can at best be approximations.
Under apartheid, the division of service delivery into racially-based departments made it relatively easy to determine the financial costs of the services provided for different race groups, though it was not possible to determine how the benefits from a particular service differed among consumers in terms of where they are located and the quality of the service provided. A particularly intractable problem in apartheid South Africa was how to deal with wage differences amongst providers of services. As black teachers and health workers were paid less than their white counterparts, financial costs exaggerated differentials in actual service provision by race. No adjustment was made for this in the incidence studies discussed here.
5.1 Seventy years of fiscal incidence studies in South Africa
The first fiscal incidence study in South Africa dates back almost seventy years, when the Native Economics Commission concluded that expenditures (both directly assignable to individuals, such as social services, and an imputed value for non-assignable expenditures) of R8.3m to the benefit of Africans in 1929/30 well exceeded the R6.6m they paid in taxes (South Africa 1932: 170-178).
In the 1950s the Tomlinson Commission (South Africa 1955), in drawing up the blueprint for the homeland policy, concluded that in 1951 Africans benefited from social services of R50.3m plus a share of R32.4m in non-assignable services. This contrasted with direct taxes of R4.0m and another R15.4m in other taxes, leaving a net transfer of R63.3m to Africans through the budget (calculated from South Africa 1955: 38). If, however, only the contribution to secondary income is considered, from the total African income of somewhat more than R400m, R4.0m of direct taxes was subtracted, and they received directly assignable social services valued at R50.3m, leaving them about 11 per cent better off after the budget than before.
In 1971 Spandau showed that whites bore more than 90% of the direct tax burden in 1959/60, but that racial gaps in per capita disposable income nevertheless remained large. Even then, inequality within the African population was already startlingly large: the ratio between the per capita disposable income of African urban and African rural inhabitants, at 4.7 : 1, was almost as large as that between white and African urban dwellers (5.0 : 1).

DPRU WORKING PAPER
16
Table 7: Personal income, direct taxes and disposable income by race, 1959/60
Whites Africans Coloureds Indians Total Personal income R2 730.5m R865.5 R213.7 R75.9m R3 885.6m Minus: Direct taxes R143.0m R8.0m R1.7m R2.0m R154.7m Disposable income R2 587.6m R857.5m R212.1m R73.8m R3 730.9m Per capita disposable income: Total R838 R79 R141 R155 R234 Urban R848 R169 R173 R173 .. Rural R788 R36 R71 R66 ..
Source: Based on Spandau 1971: Vol.II, pp.146-7
Leistner’s estimates spanning four decades supported the conclusion of the Tomlinson Commission that African social expenditure benefits in the post-Second World War period far exceeded their contribution to taxes, even including indirect taxes (Table 8). Note also, however, that this had not always been the case, and that African social spending increased far more over the period covered by this table than other magnitudes shown.
Table 8: Fiscal incidence for the African population, various years
1929/30 1946/7 1956/7 1964/5 Direct taxes R3.0m R4.5m R7.6m R9.5m Indirect taxes R3.5m R8.9m R14.9m R28.5m Total taxes R6.5m R13.4m R22.5m R38.0m Admin spending* R1.4m R6.4m R24.4m R39.9m Social spending R2.5m R22.6m R78.6m R146.2m Capital expenditures R0.4m R1.4m R22.2m R29.1m Total expenditures R4.3m R30.4m R125.2m R215.2m * This presumably refers only to "African administration", i.e. of the former homelands and townships and of the departments dealing with Africans Source: Leistner 1968: p.175
In the 1970s, the Theron Commission on the socio-political position of the coloured population concluded that coloureds benefited substantially from budgetary redistribution (South Africa 1976: 56). Terreblanche (1978: Tables 1-7 & appendix) supplemented and updated these figures and pointed to a major shift favouring coloureds in the 1970s, mainly as a result of a dramatic expansion of social spending.
McGrath (1983) utilised survey data along with census results for his income distribution estimates, though his expenditure incidence estimates were mainly based on data obtained from the expenditure authorities. Apartheid bookkeeping allowed most expenditures on education, health, housing and welfare, and even food subsidies to be allocated to individuals by race. McGrath combined this with various assumptions about non-assignable expenditures and concluded that Africans gained under all sets of assumptions and that redistribution from whites increased under all but the most restrictive assumptions. Nevertheless, a massive post-budget racial gap remained in command over resources.
Bromberger (1982) considered shifts in the underlying policies to derive conclusions on the evolution of government’s distributional stance. Pertinent to this paper is his view that the retrogression in distributive policies after the National Party came to power in 1948 was reduced in the 1960s, when there were already “signs of a thaw”, and particularly since 1972, which witnessed "a trend towards re-incorporation and reduced inequality".
Van der Berg (1989) contrasted the apartheid norm for public expenditure (tax shares) with the unitary society norm (equity, approximated by population shares) and showed that actual expenditures lay somewhere between these two norms. He also showed (Van der Berg 1992a & 1992b) that the per capita social expenditure gap was so large that it would have been fiscally impossible to achieve parity at white benefit levels; in 1986 white benefit levels would have had to be reduced to about one-third their actual level
THE PRESENT AS A LEGACY OF THE PAST: THE LABOUR MARKET, INEQUALITY AND POVERTY IN SA
17
to achieve parity within the constraints of the budget. An IMF study (Lachman and Bercuson 1992) arrived at a similar conclusion and also made a strong case for policies supportive of accelerated growth to enhance fiscal resources, as available resources could not meet expectations in a simple static redistributive exercise.
Janish (1996) replicated McGrath’s earlier work, but determined social service utilisation from the 1993 Living Standards and Development Survey (PSLSD), and applied unit costs by race and/or region from public expenditure data to these. Her results showed that the 1993 budget was much more redistributory to blacks than the budgets covered by McGrath, indicating significant shifts in social spending towards blacks over the last two decades of apartheid.
5.2 Trends in expenditure incidence
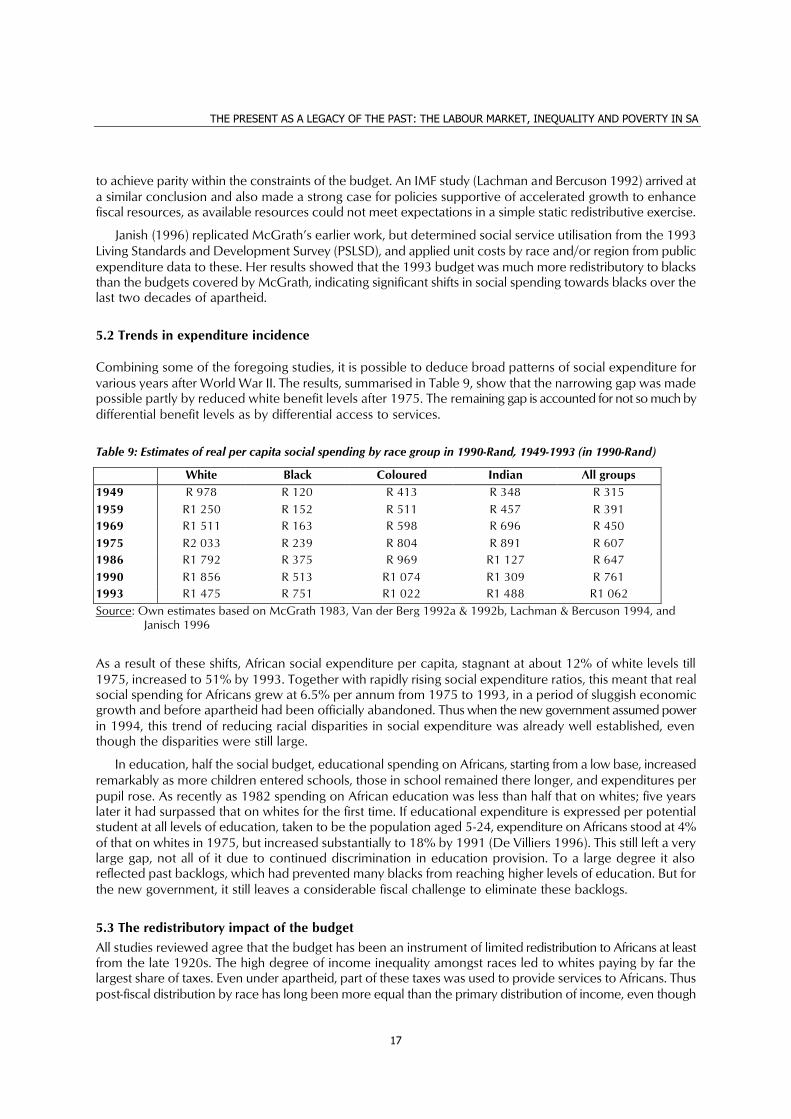
Combining some of the foregoing studies, it is possible to deduce broad patterns of social expenditure for various years after World War II. The results, summarised in Table 9, show that the narrowing gap was made possible partly by reduced white benefit levels after 1975. The remaining gap is accounted for not so much by differential benefit levels as by differential access to services.
Table 9: Estimates of real per capita social spending by race group in 1990-Rand, 1949-1993 (in 1990-Rand)
White Black Coloured Indian All groups 1949 R 978 R 120 R 413 R 348 R 315 1959 R1 250 R 152 R 511 R 457 R 391 1969 R1 511 R 163 R 598 R 696 R 450 1975 R2 033 R 239 R 804 R 891 R 607 1986 R1 792 R 375 R 969 R1 127 R 647 1990 R1 856 R 513 R1 074 R1 309 R 761 1993 R1 475 R 751 R1 022 R1 488 R1 062 Source: Own estimates based on McGrath 1983, Van der Berg 1992a & 1992b, Lachman & Bercuson 1994, and
Janisch 1996
As a result of these shifts, African social expenditure per capita, stagnant at about 12% of white levels till 1975, increased to 51% by 1993. Together with rapidly rising social expenditure ratios, this meant that real social spending for Africans grew at 6.5% per annum from 1975 to 1993, in a period of sluggish economic growth and before apartheid had been officially abandoned. Thus when the new government assumed power in 1994, this trend of reducing racial disparities in social expenditure was already well established, even though the disparities were still large.
In education, half the social budget, educational spending on Africans, starting from a low base, increased remarkably as more children entered schools, those in school remained there longer, and expenditures per pupil rose. As recently as 1982 spending on African education was less than half that on whites; five years later it had surpassed that on whites for the first time. If educational expenditure is expressed per potential student at all levels of education, taken to be the population aged 5-24, expenditure on Africans stood at 4% of that on whites in 1975, but increased substantially to 18% by 1991 (De Villiers 1996). This still left a very large gap, not all of it due to continued discrimination in education provision. To a large degree it also reflected past backlogs, which had prevented many blacks from reaching higher levels of education. But for the new government, it still leaves a considerable fiscal challenge to eliminate these backlogs.
5.3 The redistributory impact of the budget All studies reviewed agree that the budget has been an instrument of limited redistribution to Africans at least from the late 1920s. The high degree of income inequality amongst races led to whites paying by far the largest share of taxes. Even under apartheid, part of these taxes was used to provide services to Africans. Thus post-fiscal distribution by race has long been more equal than the primary distribution of income, even though

DPRU WORKING PAPER
18
the patterns of expenditure were still highly discriminatory and large post-budget racial welfare differentials remained.
Surprisingly, racial redistribution through the budget actually increased even during the apartheid years. Fiscal redistribution before the 1930s seems to have been negligible or even regressive across races, but since then rising social spending on Africans had ensured greater redistribution through the budget. This accelerated particularly during the 1970s, with the growing needs of integration into a single economy.
Limited scope remains to use the budget to meet the high expectations of the newly enfranchised poor. The major fiscal challenge now is to improve the efficiency of public resource use so as to enhance the quality of and access to services. Redistribution, on the other hand, will increasingly have to occur in terms of primary or personal incomes; a pre-condition for this is the creation of employment to draw the poor into the economic mainstream.
Table 10 shows the effect of budgetary redistribution on welfare by race group in 1993. Before the redistributive effect of the budget is considered, per capita income of Africans (excluding social pensions, which are part of social spending) was only 10.3% of white levels. After the budget, African secondary income per capita was 15.6% of white levels, due to a net gain from fiscal incidence of R895 per African person and a net loss of R3 421 per white person - more than African per capita income before the budget. Thus even though the budget redistributed considerably, the racial post-budget gap remained extremely large.
The scope for further redistribution through the budget is rather limited. The government’s macro-economic strategy, GEAR (Growth, Employment and Redistribution), acknowledges that taxation is already too high; if anything, taxes on the middle income group, including most whites, may be reduced to eliminate the effect of past fiscal drag in an inflationary environment. Political resistance by the affluent, limited capacity to deliver especially rural services by government, and the fact that unequal access to higher levels of education cannot be overcome overnight make parity in social spending per capita at best a distant goal. But even this would have a limited effect, as Table 10 shows: African post-budget command over goods and services, i.e. secondary incomes, would then still have been only 17% of white levels. This emphasises the limits to the budget as instrument of redistribution and points to the importance of the distribution of pre-budgetary or primary income. This is a key finding that reinforces our earlier conclusion that the labour market must take centre stage, as is indeed the case in this research project.
Table 10: Racial redistribution through the budget, 1993, and limits to such redistribution
White African Coloured Indian Average Income per capita (excl. social pension)
R26 850
R2 758
R5 088
R10 921
R6 305
% of white level 100.0% 10.3% 18.9% 40.7% 23.5% Minus: Income tax per capita R5 546 R187 R500 R1 320 R941 Disposable income per capita R21 304 R2 571 R4 588 R9 601 R5 364 Plus: Social spending per capita R2 125 R1 082 R1 473 R2 144 R1 278 Secondary income per capita:
Actual 1993 R23 429 R3 653 R6 061 R11 745 R6 642 % of white level 100.0% 15.6% 25.9% 50.1% 28.3% Assuming equal social spending of R1 278 p.c.
R22 582
R3 849
R5 866
R10 879
R6 642
% of white level 100.0% 17.0% 26.0% 48.2% 29.4% Per capita effect of budget:
Actual 1993 -R3 421 R895 R973 R824 R337 Assuming equal social spending of R1 278 p.c.
-R4 268
R1 091
R778
-R42
R337
Scope for redistribution -R847 +R196 -R195 -R966 R0 Source: Own recalculations based on Janisch (1996).

THE PRESENT AS A LEGACY OF THE PAST: THE LABOUR MARKET, INEQUALITY AND POVERTY IN SA
19
6. The Current Economic Policy Environment in South Africa
One of the consequences of such inequality in a developing country context is also endemic poverty. Four well-known investigations have been undertaken into aspects of South African poverty. The Carnegie Investigation considered the poor-white problem in the 1930s (cf. Le Roux 1978); the Tomlinson Commission looked at the economic situation within what later became known as the homelands in the 1950s; in the 1970s the Theron Commission investigated poverty amongst coloured people (cf. Terreblanche 1976); and the Second Carnegie Inquiry into Poverty and Development in the early 1980s looked at particularly African poverty (Wilson & Ramphele 1990). The Tomlinson Commission was unique in that its brief was to investigate ways of improving the economic situation within particular areas; for this reason, it is not fully comparable with the other investigations, as industrial decentralisation, for instance, played a large role in its findings. The other three investigations had some common features: they all saw an active role for the state in redressing poverty; all placed particular emphasis on education; and all perceived employment creation as necessary, but not sufficient unless accompanied by social upliftment on a large scale and over a substantial time period. But crucially, all three reports and the debate flowing from them emphasised the importance of political structures which would ensure that the problem of poverty cannot be ignored.
The (First) Carnegie Report’s recommendations were largely put into effect, and white poverty was largely eliminated within a generation. The state in the process reduced economic disparities between Afrikaners and English-speaking whites. Poverty amongst coloureds has also been addressed with some (although more limited) success in the quarter century since the Theron Commission. The Second Carnegie Inquiry had no direct impact on policy as it had no official standing. As African poverty is far more intractable than poverty amongst other groups, and the fiscal constraint on addressing such poverty is far more severe, one would expect the results of attention to African poverty to be less dramatic in anything but the long term.
In 1996, the government accepted a new macro-economic strategy, known as GEAR (Growth, Employment and Redistribution). It saw substantial long term economic growth rates as achievable, given improvements in education, the freeing of international trade, and possible long term capital flows to South Africa in the absence of apartheid. GEAR aimed at building a bridge towards such long term growth by establishing a medium term growth record that would attract foreign investors and raise the balance of payments constraint. To that end, it essentially involved an export-led policy, stimulated by the real exchange rate decline of early 1996. This was regarded as an opportunity to stimulate exports, if the inflationary consequences of depreciation could be staved off by anti-inflationary policies, including fiscal restraint, continued tight monetary policies, and wage restraint. All three these aspects, but particularly the last, were opposed by the ANC’s allies in the trade unions and the South African Communist Party.
A series of labour reforms introduced since the ANC came to power in 1994 received support from organised workers, but were perceived in the investor community as being in conflict with the spirit of GEAR because of the increased labour market regulation they embodied. These reforms included the Labour Relations Act (LRA) of 1995, the Basic Conditions of Employment Act of 1997, he Employment Equity Act of 1998, and the Skills Development Bill, still not passed by Parliament.
In 1998, a Poverty and Inequality Report (PIR), a study undertaken by a number of researchers on behalf of government, was made public. Its impact on policy has been limited, but that it was undertaken at all shows government’s growing concern with poverty and unemployment. This concern also led to a Job Summit at the end of 1998 between government, organised labour and the business sector. The major consensus issue to emerge from this was on occupational training and the need for job creation schemes, but details remained vague. Government also used this opportunity to reiterate its position on GEAR as the central part of its economic strategy. This was seen as an indication that the government was becoming impatient with the labour movement and was willing to reconsider some of its labour policies for fear that they were inimical to employment creation.

DPRU WORKING PAPER
20
7. Contemporary household poverty and the labour market
The concern with poverty reflected in policy developments of recent years relates to the fact that poverty has not declined with the eradication of discrimination in the labour market, as will become clear in this Section. This Section provides a brief overview of the present situation regarding poverty, material welfare and inequality in households and of inequality in the labour market, mainly at the racial level, although the role of other markers of inequality such as gender, location, occupation, and formal/informal status will also be discussed. This will serve as an introduction to other parts of this research project, which will go into further detail on these topics, and also provides a current perspective against which to judge the historical trends discussed earlier.
7.1 Racial distribution of material welfare
Table 11 presents a few differentials in living standards and privilege between races in South Africa in summary form. The fullest measure of economic and social inequality is the estimated differential of 13 years in average life expectancy at birth between whites and Africans, a measure sensitive to nutrition, health, education, sanitation, and housing conditions and that thus goes beyond the usual income poverty measures.
Table 11: Some measures of racial inequality in the 1990s
White African Coloured Indian Total Per capita income 1995 R34 689 R2 717 R6 931 R16 793 R7 062 % of households poor 1995 0.4% 38.8% 19.0% 2.3% 28.4% Monthly non-agric. wage Dec1997 R7 243 R2 711 R3 053 R4 300 R4 121 Broad unemployment 1995 35% 4% 21% 12% 27% Social spending per capita 1993 R2 125 R1 082 R1 473 R2 144 R1 530 % matriculated (age 25+) 1995 68% 19% 18% 44% 28% Life expectancy at birth 1991 73 60 66 69 63 Sources: Other tables in this paper; Central Statistical Service
Table 12 shows the economic position of the different quintiles of the household income distribution in 1993. Although household poverty is not purely a labour market phenomenon, and the mapping of earners onto households is inherently difficult (many households, for instance, have earners involved in different sectors or in different occupations), it has clearly been shown above that the labour market is a crucial element in household poverty in South Africa.
A broad picture emerges of an affluent top quintile being joined by increasing numbers of Africans (a process that undoubtedly accelerated after democratisation); a second quintile that is mainly African, earners being relatively well-established in mainly urban jobs, economically relatively secure, and strongly upwardly mobile; a third quintile whose economic position is tenuous as earners depend on highly uncertain jobs and have limited social security coverage; and two bottom quintiles who are poor, largely rural and excluded from most of the benefits of the modern consumer economy and labour market. For the bottom 60% of households, the state's transfer payments are crucial, as social assistance to the old and the disabled has come to play a unique role in South African poverty alleviation. But in other areas, the social spending shifts of the past two decades resulted in a trend to service provision to the top quintiles of all race groups. For instance, the table shows that in 1993 the better educated were mainly concentrated in the top two quintiles, while secondary and tertiary educational enrolment was also concentrated in these quintiles. The bottom three quintiles, which included many children, had extremely poor access to secondary and tertiary education. Thus

THE PRESENT AS A LEGACY OF THE PAST: THE LABOUR MARKET, INEQUALITY AND POVERTY IN SA
21
the income classes were recreating themselves. But the major difference between the bottom quintiles and the rest was access to very scarce remunerative employment.5
Table 12: Socio-economic situation of different income classes, 1993*
Income quintiles Q1 Q2 Q3 Q4 Q5:
Total
Per capita income R390 R1 056 R1 974 R4 158 R20 478 R5 611 Household income R2 406 R6 372 R11 550 R22 458 R82 536 R30 630 Remittances as % of income 27% 14% 6% 2% 1% 3% Regular wage as % of income 23% 44% 67% 79% 65% 65% Unemployment 53% 43% 30% 17% 4% 30% No education** 24% 18% 13% 7% 6% 15% Less than full primary educ.** 54% 42% 33% 21% 9% 35% Completed secondary educ.** 4% 8% 13% 23% 62% 19% Completed tertiary educ.** 0% 0% 0.2% 0.6% 10.3% 1.8% Primary net enrolment 85% 87% 88% 89% 90% 87% Secondary net enrolment 46% 57% 67% 78% 83% 60% Tertiary net enrolment 4% 5% 8% 20% 38% 11% Households rural 76% 68% 46% 33% 15% 47% Households metropolitan 10% 14% 29% 40% 58% 30% Households African 96% 93% 82% 68% 25% 73% Households white 1% 1% 3% 16% 66% 17% Household size 6.3 6.0 5.9 5.4 4.2 5.5 Shacks/traditional dwellings 39% 32% 25% 15% 2% 23% Electricity in home 15% 28% 49% 77% 98% 53% Stunting of children under 5 38% 27% 23% 18% 6% 27% * Figures are taken from different sources that are not necessarily fully comparable across different dimensions, as the criteria for the division into quintiles were not always the same (e.g. income or consumption group, quintile of households or of individuals, etc.) ** Education level obtained calculated only for population 16 years and older Sources: Compiled from World Bank/RDP 1995; Saldru 1994; Janisch 1996; Klasen 1996.
7.2 Household poverty
Table 13 below employs a household poverty line of R903 per month to determine the incidence of poverty. A first, basic national poverty measure is provided in column 4, where the incidence of poverty for all households is 28.4%. This is simply a headcount index, measuring the number of households earning less than the poverty line. There is a disproportionately high incidence of poverty amongst African households (39%) and to a lesser extent amongst coloureds (19%) compared with Asian and White households.
Close to half (48%) of rural households earn a monthly income below the poverty line, but the corresponding figure for urban areas is only 13%. Poverty is most endemic in the Eastern Cape, Free State and Northern Province, while the lowest incidence of household poverty is in Gauteng and the Western Cape. While Kwazulu-Natal has a relatively low poverty incidence, its large population size means that it houses a large proportion (17%) of the poor. 6 5 For a fuller treatment of poverty, social security and social service provision in the post-apartheid period, cf. World Bank/RDP (1995), Klasen (1996), Bhorat & Leibbrandt (1996), Lundahl & Moritz (1994), Leibbrandt et al. (1996), Saldru (1994), South Africa (1996), Kruger (1992), Lund (1993), Van der Berg (1997), Case & Deaton (1996), Whiteford et al. (1995), Whiteford & McGrath (1994), Donaldson (1992 & 1993), and PIR 1998. A historical perspective is best gained from Bromberger (1984), Iliffe (1987), Kruger (1992), and Wilson & Ramphele (1985). 6 The slightly lower poverty figures for the Northern Province compared to those reported when using the 1993 data from the Living Standards and Development Survey suggest an overstatement of poverty in this province in the past (Leibbrandt & Woolard 1999).

DPRU WORKING PAPER
22
Table 13: A profile of household poverty, 1995
% of all households
% of poor households
% of non-poor households
Incidence of poverty (5)
Relative incidence of
poverty (2)/(1) (1) (2) (3) (4) (5)
All Households 100.0% 28.4% Race African 68.7% 93.7% 58.7% 38.8% 1.37 Coloured 8.6% 5.8% 9.8% 19.0% 0.67 Asian 2.8% 0.2% 3.9% 2.3% 0.08 White 19.9% 0.3% 27.6% 0.4% 0.01 Location Urban 56.2% 26.5% 68.0% 13.4% 0.47 Rural 43.8% 73.5% 32.0% 47.7% 1.68 Province Western Cape 10.9% 3.9% 13.6% 10.3% 0.36 Eastern Cape 14.9% 25.8% 10.5% 49.3% 1.73 Northern Cape 2.1% 2.3% 2.1% 30.0% 1.06 Free State 8.1% 12.1% 6.5% 42.4% 1.49 Kwazulu/Natal 18.0% 16.7% 18.6% 26.3% 0.93 North-West 8.6% 10.8% 7.8% 35.5% 1.25 Gauteng 19.8% 4.4% 26.0% 6.3% 0.22 Mpumalanga 6.3% 8.4% 5.5% 37.5% 1.32 Northern Province 11.2% 15.7% 9.4% 39.9% 1.40 Household size 1 12.9% 2.2% 17.1% 4.9% 0.17 2 15.4% 7.9% 18.3% 14.6% 0.51 3 14.2% 11.2% 15.4% 22.4% 0.79 4 17.8% 16.6% 18.3% 26.5% 0.93 5 13.6% 16.3% 12.6% 34.0% 1.20 6 9.9% 15.0% 7.8% 43.4% 1.53 7 6.3% 10.9% 4.4% 49.6% 1.75 8 4.0% 7.6% 2.6% 53.6% 1.89 9 2.7% 5.5% 1.6% 57.3% 2.02 10+ 3.2% 6.7% 1.8% 59.4% 2.09
No. of Children under 16 0 38.5% 19.3% 46.1% 14.2% 0.50 1 19.3% 19.5% 19.3% 28.7% 1.01 2 19.2% 21.4% 18.4% 31.6% 1.11 3 12.0% 17.6% 9.8% 41.7% 1.47 4 6.6% 12.4% 4.3% 53.3% 1.88 5 2.9% 6.2% 1.5% 61.4% 2.16 6+ 1.5% 3.6% 0.6% 70.2% 2.47 Average Age of Adults 16-24 4.3% 5.3% 4.0% 34.4% 1.21 25-29 14.5% 15.4% 14.2% 30.2% 1.06

THE PRESENT AS A LEGACY OF THE PAST: THE LABOUR MARKET, INEQUALITY AND POVERTY IN SA
23
30-40 44.0% 45.1% 43.5% 29.2% 1.03 Over 40 37.2% 34.2% 38.4% 26.2% 0.92 Average Years of Education of Adults 0-3 11.6% 20.6% 8.0% 50.6% 1.78 4-7 27.9% 48.3% 19.8% 49.2% 1.73 8-11 39.0% 29.7% 42.7% 21.6% 0.76 12 11.4% 0.9% 15.5% 2.1% 0.08 12+ 9.8% 0.1% 13.7% 0.3% 0.01
Male Head or Married Male Present Yes 72.0% 59.7% 76.9% 23.6% 0.83 No 28.0% 40.3% 23.1% 40.9% 1.44
Number of Earners 0 28.4% 52.2% 19.0% 52.2% 1.84 1 43.4% 33.4% 47.4% 21.9% 0.77 2 23.2% 12.4% 27.5% 15.2% 0.53 3 5.0% 2.0% 6.2% 11.6% 0.41 Unemployment Rate of Adults 0% to 25% 57.2% 31.3% 67.5% 15.5% 0.55 25% to 50% 2.7% 2.1% 3.0% 22.4% 0.79 50% to 75% 10.8% 12.7% 10.0% 33.5% 1.18 75% to 100% 29.3% 53.9% 19.5% 52.3% 1.84
Source: Own calculations from OHS/IES95
Household size clearly is related to poverty where the latter is defined in per capita terms. Households with fewer than five members have a smaller share of the poor than of the overall population, while larger households are more likely to be poor. This is supported by the data that show that the incidence of poverty rises with the number of children.
Poverty is more concentrated in households where the average adult age within households is below 24 years (adults being defined here as 16 years or older), 34% of such households being poor. This may in part reflect a labour market life cycle phenomenon: younger households have lower levels of experience and fewer years of schooling, and therefore earn less, or are less likely to be in employment. Fortunately, though, such households are also usually smaller, thus their population share may also be smaller.
In more than two-thirds of poor households, average adult education levels are below secondary level (i.e. less than 8 years of education). Secondary schooling, especially when completed, is apparently able to pull households above the poverty line, as the incidence of poverty among households where adults have matriculated is only 2.1%, and amongst those with even higher education it is only 0.3%. The relative incidence of poverty (last column) indicates that the dividing line in terms of education and household poverty is the attainment or non-attainment of at least secondary education.
The presence of a married male or male head in the household would appear to be an important predictor of poverty. Hence, amongst the 28% of all households with no male head or married male present, the incidence of poverty is 41%, as against only 24% in all other households. This should be seen against the perspective of widespread male absence from rural areas due to migrant work
As would be expected, the addition of one more earner (employed or self-employed) in a household reduces the likelihood of living in poverty. Thus while households with no earners are 28% of all households, they constitute more than half of poor households. Note that the largest drop in poverty incidence occurs upon the provision of one job to a household with no earners. Even among households with one earner there are still many (22%) in poverty, though, i.e. the level of income earned from employment or self-employment is still insufficient to lift these households out of poverty. Thus the quality of employment is also important.

DPRU WORKING PAPER
24
The final rows of the table show that, where less than one-quarter of adults are unemployed in a household, the poverty incidence is particularly low (16%). At higher household unemployment rates, poverty becomes more pervasive.
7.3. A labour market snapshot
Table 14, loosely based on Fallon & Lucas (1996) though using a different data set, presents a broad snapshot of the South African labour market. A slight majority of the total population of working age of 23.9 million is female. Looking first at male workers, a greater share of white (78%) than African (47%) male workers is in employment. Across all race groups, formal employment (designated as ‘employee’) dominates as the main form of work activity. The share of African working-age males in unemployment is 18%, with coloured males not far better off with 13%, much higher than the 2% of white male workers. (Note that these figures refer to broad unemployment, and are expressed relative to the total population of working age rather than to the labour force. They thus differ from unemployment rates, which are discussed later.) The primary reason for males being economically inactive (out of the labour force) is enrolment in education. The exceptionally high figure for African males of 24% in part reflects the long duration and poor efficiency (in terms of pass-rates) of the education system.
Gender differences in the labour market are stark. While 43% of all African males of working age are formal employees, only 17% of African females are in the same position. There are three different explanations for this. Firstly, more African females than African males are in self-employment or domestic service. Secondly, the share of African females in unemployment is also higher. Thirdly, a larger proportion of African females are out of the labour force, the majority being enrolled in education or involved in household duties. It is interesting to note that the education figures are more differentiated according to race than gender.
Amongst female workers, there are also racial differences. While only 17% of African females are in formal employment, 45% of white females and 36% of coloured females have formal jobs. Amongst Asians, the relatively low figure of 30% is accounted for by a large proportion (34%) being outside the labour force through involvement in household duties. Note also that 8% of coloured women are in unregistered self-employment, reflecting also their involvement in domestic services. But African women are the least likely amongst all workers to have employment.

THE PRESENT AS A LEGACY OF THE PAST: THE LABOUR MARKET, INEQUALITY AND POVERTY IN SA
25
Table 14: Employment status of adults (age 16+) by race and gender, 1995
Males Females African White Coloured Asian African White Coloured Asian
Total
Population 16 years or older 8 424 476 1 796 299 1 098 972 343 145 9 016 475 1 748 318 1 161 714 352 004 23 941 403 Employees* 43% 63% 60% 59% 17% 45% 36% 30% 35% Registered self-employed 0% 11% 1% 8% 0% 3% 0% 1% 1% Unregistered self-employed 2% 2% 2% 5% 8% 2% 8% 2% 5% Employees and self-employed (hybrid)
1%
2%
1%
1%
1%
1%
0%
0%
1% Total employed 47% 78% 64% 73% 26% 52% 44% 34% 43% Unemployed & searching 9% 2% 10% 6% 9% 2% 9% 5% 8% Unemployed & not searching 9% 0% 4% 1% 12% 1% 6% 3% 8% Total unemployed 18% 2% 13% 7% 21% 3% 15% 7% 16% Enrolled in education 24% 10% 11% 11% 22% 9% 9% 11% 20% Keeping house 0% 0% 0% 0% 13% 21% 16% 34% 8% Retired 3% 8% 3% 3% 5% 8% 4% 4% 4% Disabled 3% 2% 7% 3% 2% 1% 4% 3% 3% Other 6% 1% 3% 2% 11% 6% 8% 7% 7% Total out of labour force 36% 20% 24% 20% 53% 45% 41% 59% 42% Unemployment rate (% of Labour Force): Broad 28% 3% 17% 9% 45% 6% 26% 18% 27% Narrow 13% 2% 12% 8% 19% 4% 16% 11% 13%
* Domestic workers not included with employees, but with self-employed Totals do not all add up to 100% due to rounding Source: Own calculations from OHS95

DPRU WORKING PAPER
26
Unemployment rates are presented at the bottom of the table, according to both the strict and expanded definitions. Race and gender are very important determinants of unemployment. African unemployment rates are higher than for all other race groups, while the coloured unemployment rates are also fairly high. The gender effect is strong among all race groups, female broad unemployment levels being almost double that of their male counterparts. Differentials are smaller (though still large) when the narrow unemployment rate is considered, indicative of the preponderance of women among discouraged work seekers.
8. Conclusion
This paper has shown that poverty and inequality are still widespread in South Africa, and that it mainly has its origins in the labour market. Solutions to these problems would also have to be found in the labour market. An understanding of labour market outcomes is thus essential for understanding contemporary household poverty in South Africa. This, in turn, cannot be done in isolation from the historical forces that have shaped the South African labour market, as discussed in this paper. Poverty and inequality in the present are very much the legacy of South Africa’s discriminatory past.
This paper serves as an introduction to the wider research project on poverty and the labour market in South Africa. The rest of this research project will provide a detailed analysis of contemporary poverty and inequality dynamics within households and within the labour market. The final research report will then combine this contemporary analysis with the historical backdrop in order to arrive at some policy conclusions.
THE PRESENT AS A LEGACY OF THE PAST: THE LABOUR MARKET, INEQUALITY AND POVERTY IN SA
27
Bibliography
Bhorat, Haroon. 1996 . Inequality in the South African labour market. Unpublished Masters dissertation.
Stellenbosch: University of Stellenbosch. Bhorat, Haroon & Leibbrandt, Murray. 1996. Understanding unemployment. In: Baskin, Jeremy (Ed.)
Against the current: Labour and economic policy in South Africa. Randburg: Ravan Press Bromberger Norman. 1982. Government policies affecting the distribution of income, 1940-1980. In:
Schrire, Robert (Ed.) 1982. South Africa: Public policy perspectives. Cape Town: Juta Case, Anne & Deaton, Angus. 1996. Large cash transfers to the elderly in South Africa. Discussion Paper
176. Princeton: Research program in Development Studies De Villiers, A.P. 1996. Effektiwiteit van Suid-Afrika se onderwysstelsel: ’n Ekonomiese analise. Unpublished
Ph.D thesis. Stellenbosch: University of Stellenbosch De Wulf, Luc. 1975. Fiscal incidence studies in developing countries: Survey and critique. IMF Staff
Working Papers 22(1). March Donaldson, Andrew R. 1992. Restructuring the social services. In: Howe, Graham & Le Roux, Pieter (Eds.)
1992. Transforming the economy: Policy options for South Africa. Durban: Indicator South Africa Donaldson, Andrew R. 1993. Basic needs and social policy: The role of the state in education, health and
welfare. In: Lipton, Merle & Simkins, Charles (Eds.) 1993. State and market in post apartheid South Africa. Johannesburg: University of Witwatersrand Press: 271-320
Fallon, P. 1992. An analysis of employment and wage behaviour in South Africa. Informal discussion paper No.3 on aspects of the economy of South Africa. Unpublished paper. Washington, D.C.: World Bank
Fallon, Peter & Lucas, Robert. 1996. South African labor markets: Adjustment and inequalities. Informal discussion paper No.12 on aspects of the economy of South Africa. Washington, D.C.: World Bank
Greenberg, S. 1980. Race and state in capitalist development. Johannesburg: Ravan. Hofmeyr, J.F. 1990. Black wages: The post-war experience. In: Nattrass, N. & Ardington, E. (eds.) The
political economy of South Africa. Cape Town: Oxford University Press Hofmeyr, J.F. 1999. Segmentation in the South African labour market. SANER Working Paper (in
preparation). Cape Town: South African Network for Economic Research Iliffe, John. 1987. The African poor: a history. Cambridge: Cambridge University Press Institute of Race Relations. Various years. Race Relations Survey/South Africa Survey. Johannesburg: South
African Institute of Race Relations Janisch, Catherine Ann. 1996. An analysis of the burdens and benefits of taxes and government expenditure
in the South African economy for the year 1993/94. Unpublished Masters dissertation. Pietermaritzburg: University of Natal
Klasen, Stefan. 1996. Poverty and inequality in South Africa. Mimeo. Cambridge: Centre for History and Economics, King’s College
Kruger, J.J. (John). 1992. State provision of social security: some theoretical, comparative and historical perspectives with reference to South Africa. Masters thesis. Stellenbosch: University of Stellenbosch
Lachman, Desmond & Bercuson, Kenneth. (Eds.) 1992. Economic policies for a new South Africa. IMF Occasional Paper (91). Washington, D.C.: International Monetary Fund
Le Roux, Pieter. 1978. The poor white problem - an economist's perspective. Social Work, 14(1&2). March & June
Leibbrandt, Murray V & Woolard, Inrgid. 1999. A comparison of poverty in South Africa’s nine provinces. Development Southern Africa (forthcoming).

DPRU WORKING PAPER
28
Leibbrandt, Murray V.; Woolard, Christopher D.; & Woolard, Ingrid D. 1996. The contribution of income components to income inequality in South Africa. LSMS Working Paper 125. Washington, D.C.: World Bank
Leistner, G.M.E. 1968. Table insert. Africa Institute Bulletin VI, No.6, pp.175-7 Lipton, Merle. 1986. Capitalism and apartheid: South Africa, 1910-1984. Second revised print. Aldershot:
Gower Lund, F.J. 1993. State social benefits in South Africa. International Social Security Review 46(1): 5-25 Lundahl, Mats & Moritz, Lena. 1994. The quest for equity in South Africa - Redistribution and growth. In:
Odén, B. & Ohlson, T. (Eds.) 1994. The South African tripod: Studies on economics, politics and conflict. Uppsala: Scandinavian Institute of African Studies
Marks, Shula & Rathbone, Richard (Eds.)1982. Industrialisation and social change in South Africa: African class formation, culture, and consciousness, 1870-1930. New York: Longman
McGrath, Michael D. 1983. The distribution of personal income in South Africa in selected years over the period from 1945 to 1980. Unpublished doctoral thesis. Durban: University of Natal
McGrath, Michael D. 1990. Income redistribution: the economic challenge of the 1990s. In Schrire, Robert (ed.). 1990. Critical choices for South Africa: An agenda for the 1990s. Cape Town: Oxford University Press
Moll, Peter. 1998. Discrimination is declining in South Africa but inequality is not. SANER Working Paper 5. Cape Town: South African Network for Economic Research
Ncube, D. 1985. Black trade unions in South Africa. Johannesburg: Skotaville. Poverty and Inequality Report. 1998. Poverty and inequality in South Africa. Report prepared for the Office
of the Executive Deputy President and the Inter-Ministerial Committee for Poverty and Inequality. Pretoria: Government Printer
Sadie, J.L. Circa 1982. The performance of labour in South Africa during the sixties and seventies. Stellenbosch: unpublished report to the National Manpower Commission
Sadie, J.L. 1991. The South African labour force, 1960-2005. BMR Report 178. Pretoria: Unisa, Bureau of Market Research
Saldru. 1989. Wage determinations in South Africa, Vol.II: 1978-1988. Cape Town: Saldru Saldru. 1991. Directory of South African trade unions. Fifth edition. Cape Town: Saldru Saldru. 1994. South Africans Rich and Poor: Baseline Household Statistics. Cape Town: Saldru Simkins, C.E.W. and Hindson, D. 1979. The division of labour in South Africa, 1969-1977. Social Dynamics
5 South Africa, Central Statistical Service. Various years. South African Statistics. Pretoria: Government
Printer South Africa, Central Statistical Service. Various years. South African Labour Statistics. Pretoria:
Government Printer South Africa, Central Statistical Services. 1998. Living in South Africa: Selected findings of the 1995
October household survey. Pretoria: Central Statistical Services South Africa, Central Statistical Services. 1995. The October Household Survey. Pretoria: Government Printer South Africa, Dept of Statistics. 1960. Union statistics for 50 years, 1910-1960. Pretoria: Government
Printer South Africa, Central Statistical Service 1996a. October Household Survey 1995. Statistical Release P0317.
Pretoria: Central Statistical Service South Africa, Central Statistical Service. 1996b. Living in South Africa: Selected findings of the 1995
October Household Survey. Pretoria: Central Statistical Service South Africa, Native Economic Commission. 1932. Report of the Native Economic Commission 1930-32.
Government Printer: Pretoria South Africa, Theron Commission. 1976. Verslag van die Kommissie van Ondersoek na Aangeleenthede
rakende die Kleurlingbevolkingsgroep. RP38/1976. Pretoria: Government Printer

THE PRESENT AS A LEGACY OF THE PAST: THE LABOUR MARKET, INEQUALITY AND POVERTY IN SA
29
South Africa, Tomlinson Commission. 1955. Summary of the Report of the Commission for the Socio-Economic Development of the Bantu Areas within the Union of South Africa. UG61/1955. Pretoria: Government Printer
Spandau, A.M.K.M. 1971. Income distribution and economic growth in South Africa. Doctoral thesis. Pretoria: University of South Africa
Stadler, Alf. 1987. The political economy of modern South Africa. Cape Town: David Philip Terreblanche, S.J. & Nattrass, N. 1990. A periodisation of the political economy from 1910. In: Nattrass, N.
and Ardington, E. (Eds.) The political economy of South Africa. Cape Town: Oxford University Press
Terreblanche, S.J. 1978. Moontlike fiskale strukture in ’n alternatiewe konstitusionele model in Suid-Afrika. In: Benyon, J.A. (Ed.) Constitutional change in South Africa. Pietermaritzburg: University of Natal: pp.190-224
Terreblanche, Sampie. 1977. Gemeenskapsarmoede: Perspektief op chroniese armoede in the Kleurlinggemeenskap na aanleiding van die Theron-verslag. Cape Town: Tafelberg
Van der Berg, Servaas. 1987. Die verband tussen die aard en omvang van ekonomiese groei en die bevrediging van basiese behoeftes in Suid-Afrika. Unpublished Ph.D.-thesis. Stellenbosch: University of Stellenbosch
Van der Berg, Servaas. 1989. Long term economic trends and development prospects in South Africa. African Affairs
Van der Berg, Servaas. 1992a. Fiscal dilemmas over popular aspirations. In: Howe, Graham & Le Roux, Pieter (Eds.) 1992. Transforming the economy: Policy options for South Africa. Papers from the 1989 Lausanne Colloquium. Durban: Indicator Project South Africa
Van der Berg, Servaas. 1992b. Social reform and the reallocation of social expenditures. In: Schrire, Robert (Ed.) 1992. Wealth or poverty? Critical choices for South Africa. Cape Town: Oxford
Van der Berg, Servaas. 1997. South African social security under apartheid and beyond. Development Southern Africa 14(4)
Whiteford, A.; Posel, D.; & Kelawang, T. 1995. A profile of poverty, inequality and human development. Pretoria: Human Sciences Research Council
Whiteford, Andrew & McGrath, Michael D. 1994. Inequality in the size distribution of income in South Africa. Occasional Papers 10. Stellenbosch: Stellenbosch Economic Project
Wilson, Francis & Ramphele, Mamphela. 1989. Uprooting poverty: The South African challenge. Cape Town & Johannesburg: David Philip
World Bank/RDP Office. 1995. Key indicators of poverty in South Africa. Prepared for the Reconstruction and Development Programme Office. Pretoria: Government Printer