dr. uri mahlab. introduction and goals each member of the class of analog modulation systems is...
TRANSCRIPT

Dr. Uri Mahlab

Dr. Uri Mahlab

Dr. Uri Mahlab
Introduction and GoalsEach member of the class of analog modulation systems is characterized by five basic properties:
1. Time-domain representation of the modulated signal;
2. Frequency-domain representation of the modulated signal;
3. Bandwidth of the modulated signal;
4.Power content of the modulated signal;
5. Signal to noise ratio (SNR) after demodulation.

Dr. Uri Mahlab
Amplitude modulation(AM) ,which is frequently referred to as linear modulation, is the family of modulation schemes in which the sinusoidal carrier is changed as a function of the modulating signal
Amplitude Modulation(AM)

Dr. Uri Mahlab
DSB-AMIn DSB-AM, the amplitude of the modulated signal is proportional to the message signal. This means that the time-domain representation of the modulated signal is given by
where
Is the carrier and m(t) is the message signal. The frequency-domain representation of DSB-AM signal is obtained by taking the Fourier transform of u(t) and results in
Where M(f) is the Fourier transform of m(t). The transmission bandwidth denoted by BT is twice the bandwidth of message signal:

Dr. Uri Mahlab
M(f)
f
A
WW-A
2
fcfc-
Figure3.1: Spectrum of DSB-AM modulated signal

Dr. Uri Mahlab
The power content of the modulated signal is given by:

Dr. Uri Mahlab
The SNR for DSB-AM system is equal to the baseband SNR; it is given by:
Where PR is the received power (the power in the modulated (signal at the receiver), N0/2 is the noise power spectral density (assuming white noise),and W is the message bandwidth.

Dr. Uri Mahlab
Example 3.1[DSB-AM modulation] The message signal m(t) is defined as
m t( )
,
,
1
0
0 tt
3
2, t
3t
2t
3 otherwise
0
0 0
This message DSB-AM modulates the carrier c(t)=cos2fct, and the resulting modulated signal is denoted by u(t).it is assumed that t0=0.15 s and fc=250Hz.
1. Obtain the expression for u(t)
2. Derive the spectra of m(t) and u(t).
3.assuming that the message signal is periodic T0=t0, determine the power in the modulated signal.
4. If a noise is added to the modulated signal in part(3) such that the resulting SNR is 10 dB, find the noise power. Answer
DSB1.m
MATLAB.lnk

Dr. Uri Mahlab
Example 3.2[DSB-AM modulation for an almost bandlimited signal] The message signal m(t) is given by
m tc t
( )sin ( ),
,
100
0
t t
otherwiseo
Where t0 =0.1. This message modulates the carrier c(t)=cos(2fct), where fc=250Hz.
1. Determine the modulated signal u(t).
2.Determine the spectra of m(t) and u(t)
3. If the message signal is periodic with period T0=0.2,s determine the power in the modulated signal.
4. If gaussian noise is added to the modulated signal such that the resulting SNR is 10 dB, find the noise power.
AnswerDSB2.mMATLAB.lnk

Dr. Uri Mahlab
Conventional AM
A is the index modulation
and
The bandwidth is equal to the bandwidth of DSB-AM and is given by
Typical frequency-domain plots of the message and the corresponding conventional AM signal are shown in figure 3.4

Dr. Uri Mahlab
M(f)
f
A
WW-A
2
fcfc-
figure 3.4

Dr. Uri Mahlab
The power content of the modulated signal, assuming that the message signal is a zero mean signal is given by
Modulation efficiency and
The signal-to-noise ratio is given by
Where is the modulation efficiency

Dr. Uri Mahlab
Example 3.3:[conventional AM] The message signal
m t tt
( )
,
,
1
2
30
0
0 <t
3
- 2, t
3 otherwish
0
0
Modulates the carrier c(t)= cos(2fct) using a conventional AM scheme. It is assumed that fc=250Hz and t0=0.15; the modulation index is a 0.85
1. Derive an expression for the modulated signal
2. Determine the spectra of the message and the signals.
3.if the message signal is periodic with a periodic with a period equal t0,
determine the power in the modulated signal and the modulation efficiency
4.if a noise signal is added to the message signal such that the SNR at the output of the demodulator is 10 dB, find the power
content of the noise signal Answeram.mMATLAB.lnk

Dr. Uri Mahlab
SSB-AM is derived from DSB-AM by eliminating one of the sidebands.the time representation for these signals is given by
Where the minus sign corresponds to USSB-AM and the plus sign corresponds to LSSB-AM. The signal denoted m^(t) is the Hilbert transform of m(t), defined by m^(t)=m^(t)* 1/t, or, in the frequency domain, by M^(f)=-j sgn(f) M(f).
SSB-AM

Dr. Uri Mahlab
In other words, the Hilbert transform of a signal represents a /2 phase shift in all signal components. In the frequency domain, we have
end

Dr. Uri Mahlab

Dr. Uri Mahlab
The bandwidth of SSB signal is half the bandwidth of DSB and conventional AM and so is equal to the bandwidth of message signal I.e.,
The power in the SSB signal is given by

Dr. Uri Mahlab
M(f)
f
A
WW-A
2
fcfc-
Figure 3.7: Spectra of the message and the USSB-AM signal.

Dr. Uri Mahlab
Example 3.4:[ single-sideband example] The message signal
m t tt
( )
,
,
1
2
30
0
0 <t
3
- 2, t
3 otherwish
0
0
Modulates the carrier c(t)= cos(2fct) using an LSSB-AM scheme. It is assumed that t0=0.15 s and fc=250Hz.
1.Plot the Hilbert transform of the message signal and the modulated signal u(t)
2.Find the spectrum of the modulated signal.
3. Assuming the message signal periodic with period t0, determine the power in the modulated signal .
4.If a noise is added to the modulated signal such that the SNR after demodulation is 10 dB, determine the power in the noise
Answerlssb.mMATLAB.lnk

Dr. Uri Mahlab
Demodulation of AM signalDSB-AM Demodulation
In the DSB case the modulated signal is given by Acm(t) cos(2fct), which when multiplied by cos(2fct) (or mixed with cos(2fct)) results in
Where y(t) denotes the mixer output, and its Fourier transform is given by

Dr. Uri Mahlab
t0=.15; % signal durationts=0.001; % sampling intervalfc=250; % carrier frequencysnr=10; % SNR in dB (logarithmic)fs=1/ts; % sampling frequencydf=0.25; % desired freq. resolutiont=[0:ts:t0]; % time vectorsnr_lin=10^(snr/10); % SNR% the message vectorm=[ones(1,t0/(3*ts)),-2*ones(1,t0/(3*ts)),zeros(1,t0/(3*ts)+1)];c=cos(2*pi*fc.*t); % carrier vectorudsb=m.*c; % DSB modulated signal[UDSB,udssb,df1]=fftseq(udsb,ts,df); % Fourier transformUDSB=UDSB/fs; % scalingf=[0:df1:df1*(length(udssb)-1)]-fs/2; % frequency vectorn2=ceil(fc/df1); % location of carrier in freq. vector% remove the upper sideband from DSBUDSB(n2:length(UDSB)-n2)=zeros(size(UDSB(n2:length(UDSB)-n2)));ULSSB=UDSB; % generate LSSB-AM spectrum[M,m,df1]=fftseq(m,ts,df); % Fourier transformM=M/fs; % scalingu=real(ifft(ULSSB))*fs; % generate LSSB signal from spectrum

Dr. Uri Mahlab
)U(t
cos(2fct)
)y(tLowpass filter
Am tc
2( )
Figure 3.9: Demodulation of DSB-AM signal.

Dr. Uri Mahlab
Example 3.5:[DSB-AM demodulation] The message signal m(t) is defined
otherwise ,03
t2t
3
t 2,-
3
t<t0 ,1
)t(m 00
0
This message DSB-AM modulates the carrier c(t)= cos(2fct), and the resulting modulated signal is denoted by u(t). It is that t0=0.15 s and
f c=250 Hz.
1.Obtain the expression for u(t).
2. Derive the spectra of m(t) and u(t).
3.demodulate the modulated signal u(t) and recover m(t). Plot the results in the time and frequency. Answer
dsb_dem.mMATLAB.lnk

Dr. Uri Mahlab
Example 3.6:[Effect of phase error on DSB-AM demodulation]
In the demodulation of DSB-AM signals we assumed that the phase of the local oscillator is equal to the phase of carrier. If that is not case-I.e., if there exist a phase shift between the local oscillator and the carrier- how would the demodulation process change?
Answerlssb_dem.m
MATLAB.lnk

Dr. Uri Mahlab
The demodulation process of SSB-AM signals in basically the same as the demodulation process for DSB-AM signals, I,e., mixing followed by lowpass filtering. In this case
where the minus sign corresponds to the USSB and the plus sign corresponds to the LSSB. Mixing u(t) with the local oscillator output, we obtain.
Which contains bandpass components at+ 2fc and a lowpass component proportional to the message signal. The lowpass component can be filtered out using a lowpass filter to recover the message signal. This process for the USSB-AM case is depicted in Figure 3.13.

Dr. Uri Mahlab
U(f)
f Fc+Wf
Figure 3.13:Demodulation of USSB-AM signals
Y(f)
2fc 2Fc+Wf
-W W
Dr. Uri Mahlab
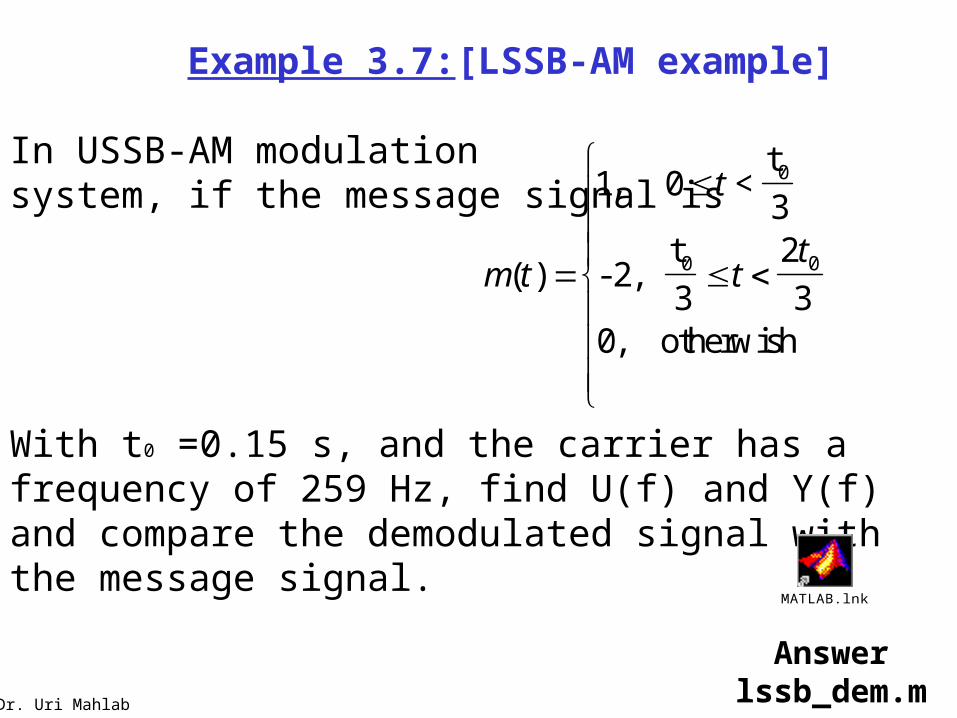
Example 3.7:[LSSB-AM example]
In USSB-AM modulationsystem, if the message signal is
m t
t
tt
( )
,
,
1
2
30
0
0 <t
3
- 2, t
3 otherwish
0
0
With t0 =0.15 s, and the carrier has a frequency of 259 Hz, find U(f) and Y(f) and compare the demodulated signal with the message signal.
Answerlssb_dem.m
MATLAB.lnk

Dr. Uri Mahlab
Example 3.8:[Effect of phase error on SSB-AM]
what is the effect error in the SSB-AM?

Dr. Uri Mahlab
Conventional AM DemodulationIn envelope detection the envelope of the modulated signal is detected via a simple circuit consisting of diode, a resistor, and capacitor,as shown in Figure 3.17.

Dr. Uri Mahlab
Figure 3.17: A simple envelope detector
Mathematically, the envelope detector generates the envelope of the conventional AM signal, which is
Because 1+mn(t)>0, we conclude that

Dr. Uri Mahlab
Where mn(t) is proportional to the message signal ,m(t) and 1 corresponds to the carrier component that can be separated by a dc-block circuit.
There is no need for knowledge of ,the phase of the carrier signal. That is why such a demodulation scheme is called noncoherent,or asynchronous, demodulation.
Recall from chapter 1 that the envelope of a bandpass signal. Thus if u(t) is the bandpass signal with central frequency fc and the lowpass equivalent to u(t) is denoted by ul(t), than the envelope of u(t), denoted by V(t),can be expressed as

Dr. Uri Mahlab
•Where uc(t) and us(t) represent the in-phase and the quadrate components of the bandpass signal u(t).
•Therefore, in order to obtain the envelope, it is enough to obtain the lowpass equivalent of bandpass signal.
•The envelope is simply the magnitude of the lowpass equivalent of the bandpass signal.

Dr. Uri Mahlab
Example 3.9:[Envelope detection] The message signal
Answeram_dem.m
MATLAB.lnk
m t
t
tt
( )
,
,
1
2
30
0
0 <t
3
- 2, t
3 otherwish
0
0
Modulates the carrier c(t)=cos(2 fct)using a conventional AM modulation scheme. It is assumed that fc=250Hz and t0=0.15 s, and the modulation index is a=0.85
1. Using envelope detection, demodulate the message signal.
2. If the message signal is periodic with a period to t0 and if an AWGN process is added to the modulated signal, use an envelope demodulator to demodulate the received signal. Compare this case with the case where is no noise present.

Dr. Uri Mahlab
•Angle-modulation schemes, which include frequency modulation(FM) and phase modulation(PM), belong to the class of nonlinear modulation schemes.
Angle-modulation
•The time-domain representation of angle-modulated signals, when the carrier is c(t)= Accos(2pifct) and the message signal is m(t) is given by

Dr. Uri Mahlab
Where kf and kp represent the deviation constants of FM and PM, respectively. The modulated signal is of the from
where

Dr. Uri Mahlab
And p and f are the modulation indices PM and FM, respectively. In general, for a non sinusoidal m(t) the modulation indices are defined as
Where W is the bandwidth of the message signal m(t).

Dr. Uri Mahlab
In case of a sinusoidal message signal the modulated signal can be represented by
Where Jn ( ) is the bessel function of the first kind and of order n and is either or depending on whether we are dealing with PM FM. In the frequency domain we have
p
fp
Dr. Uri Mahlab
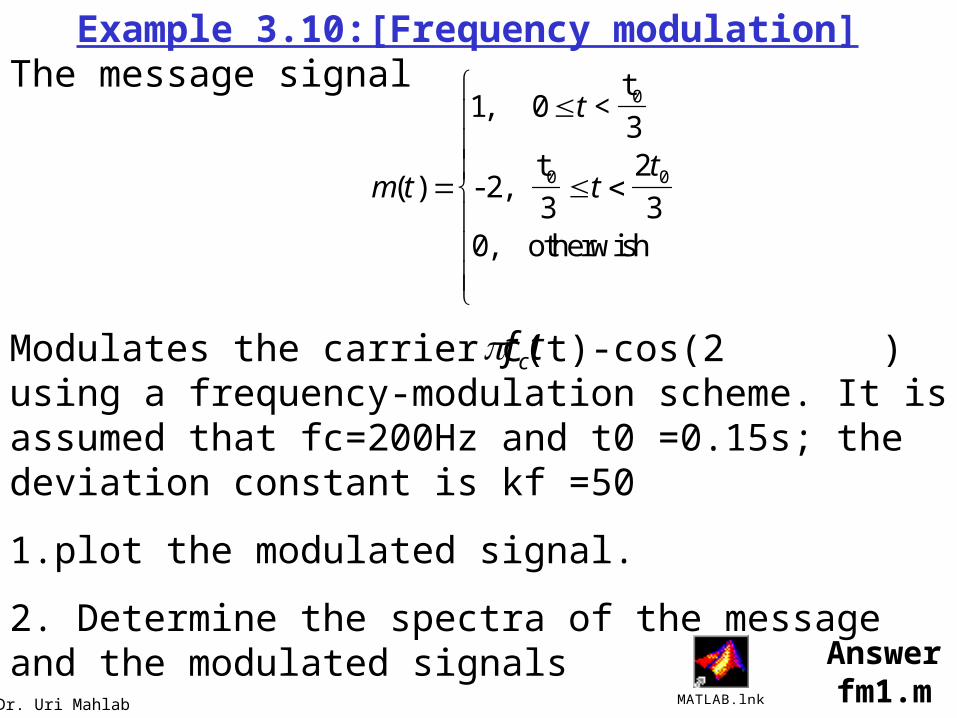
Example 3.10:[Frequency modulation] The message signal
m t
t
tt
( )
,
,
1
2
30
0
0 <t
3
- 2, t
3 otherwish
0
0
Modulates the carrier c(t)-cos(2 ) using a frequency-modulation scheme. It is assumed that fc=200Hz and t0 =0.15s; the deviation constant is kf =50
1.plot the modulated signal.
2. Determine the spectra of the message and the modulated signals
f tc
Answerfm1.mMATLAB.lnk

Dr. Uri Mahlab
t0=.15; % signal durationts=0.0005; % sampling intervalfc=200; % carrier frequencykf=50; % Modulation indexfs=1/ts; % sampling frequencyt=[0:ts:t0]; % time vectordf=0.25; % required frequency resolution% message signalm=[ones(1,t0/(3*ts)),-2*ones(1,t0/(3*ts)),zeros(1,t0/(3*ts)+1)];int_m(1)=0;for i=1:length(t)-1 % Integral of m int_m(i+1)=int_m(i)+m(i)*ts;end[M,m,df1]=fftseq(m,ts,df); % Fourier transform M=M/fs; % scalingf=[0:df1:df1*(length(m)-1)]-fs/2; % frequency vectoru=cos(2*pi*fc*t+2*pi*kf*int_m); % modulated signal[U,u,df1]=fftseq(u,ts,df); % Fourier transform U=U/fs; % scaling

Dr. Uri Mahlab
Example 3.11:[Frequency modulation] The message signal be
m tc t
( )sin ( )
,
100
0
t t
otherwish0
Where t0=0.1.
This message modulates the carrier
where fc=250 Hz. The deviation constant is kf=100.
1. Plot the modulated signal in the time and frequency domain
2. Compare the demodulator output and the original message signal.
)tf2cos(2)t(c c
Answerfm2.mMATLAB.lnk

Dr. Uri Mahlab

Dr. Uri Mahlab
t0=.2; % signal durationts=0.001; % sampling intervalfc=250; % carrier frequencysnr=20; % SNR in dB (logarithmic)fs=1/ts; % sampling frequencydf=0.3; % required freq. resolutiont=[-t0/2:ts:t0/2]; % time vectorkf=100; % deviation constantdf=0.25; % required frequency resolutionm=sinc(100*t); % the message signalint_m(1)=0;for i=1:length(t)-1 % Integral of m int_m(i+1)=int_m(i)+m(i)*ts;end[M,m,df1]=fftseq(m,ts,df); % Fourier transform M=M/fs; % scalingf=[0:df1:df1*(length(m)-1)]-fs/2; % frequency vectoru=cos(2*pi*fc*t+2*pi*kf*int_m); % modulated signal[U,u,df1]=fftseq(u,ts,df); % Fourier transform U=U/fs; % scaling[v,phase]=env_phas(u,ts,250); % demodulation, find phase of uphi=unwrap(phase); % restore original phasedem=(1/(2*pi*kf))*(diff(phi)/ts); % demodulator output, differentiate and scale phasepause % Press any key to see a plot of the message and the modulated signal