draft black ross (townsville) water quality improvement … · townsville city council also...
TRANSCRIPT

Draft for public consultation
Draft Black Ross (Townsville) Water Quality Improvement Plan
Improving Water Quality from Creek to Coral
June 2009

Black and Ross River Basins WQIP
This publication was funded by the Australian Government’s Coastal Catchments Initiative through the
Department of Environment, Water, Heritage and the Arts.
Document disclaimer statement
Townsville City Council advises that this publication contains information based on
scientific research, knowledge and understanding as well as perceptions and
interpretations of the authors. The reader is advised that such information may be
incomplete or unsuitable to be used in certain situations. While all care has been
taken in the preparation of this document, Townsville City Council accepts no
liability for any decisions or actions taken on the basis of the information contained
in this document, or from conclusions drawn from interpreting the information.
Readers should also be aware that some information might be superseded as a
result of further scientific studies and evolving technology and industry practices.
Cover photo courtesy of J Gunn
This document can be cited as:
Gunn, J. and Manning, C. 2009, Draft Black Ross (Townsville) Water Quality Improvement Plan: Improving Water
Quality from Creek to Coral, Townsville City Council/Creek to Coral Program, Townsville.

Draft Black and Ross River Basins WQIP
CONTENTS
Section Page
1. Introduction 1 1.1 Why We Need to Protect Water Quality 1 1.2 Water Quality Protection Initiatives 2 1.3 Water Quality Improvement Plan Development 4
2. Characteristics of the Black/Ross WQIP Area 8 2.1 Background 8 2.2 Land Use 10 2.3 People and Place 13
3. Know the Issues, Pressures and Threats 16 3.1 Some Background and Assumptions 16 3.2 Issues and Development Stage 17 3.3 Population Growth 19 3.4 Water Quality Pollutants and Sources 21 3.5 Land Use Contribution 21 3.6 Urban Specific and Point Source Pollutants 23 3.7 Urban Diffuse 26 3.8 Peri-urban Diffuse 29 3.9 Diffuse Source Pollutants - Rural 29 3.10 Atmospheric Deposition 31 3.11 Climate Change 33
4. Catchment Condition and Environmental Values 35 4.1 State of the Black/Ross Basins 35 4.2 Determining Environmental Values 35 4.3 Science and Community Consultation 37 4.4 Environmental Values for the Black/Ross WQIP Area 39
5. Water Quality Objectives and Targets 48 5.1 Introduction 48 5.2 Water Quality Guidelines Relevant to the Dry Tropics 48 5.3 Water Quality Condition Indicators 48 5.4 Water Quality Objectives 49 5.5 Environmental Flow 64 5.6 Aquatic Ecosystem Health 68
6. Water Quality Improvement Management Actions 70 6.1 Introduction 70 6.2 Priority Management Actions 70 6.3 Urban Management Actions 73 6.4 Peri-urban Management Actions 78 6.5 Rural Management Actions 80 6.6 Enabling Management Actions 81 6.7 Management Action Targets 89 6.8 Cost of Improved Water Quality and Ecosystem Health 92 6.9 Roles and Responsibilities 93 6.10 Integration With Other Processes 93 6.11 Are We Confident? 94
7. Progress Reporting and Adaptation 95

Draft Black and Ross River Basins WQIP
CONTENTS
7.1 WQIP Monitoring and Evaluation 95 7.2 WQIP Effectiveness 95 7.3 Water Quality Monitoring and Modelling 96 7.4 Bayesian Belief Networks 100 7.5 Adaptive Management Strategy - Learning and Doing 102 7.6 Conclusion 104
8. Bibliography 106
Tables Page
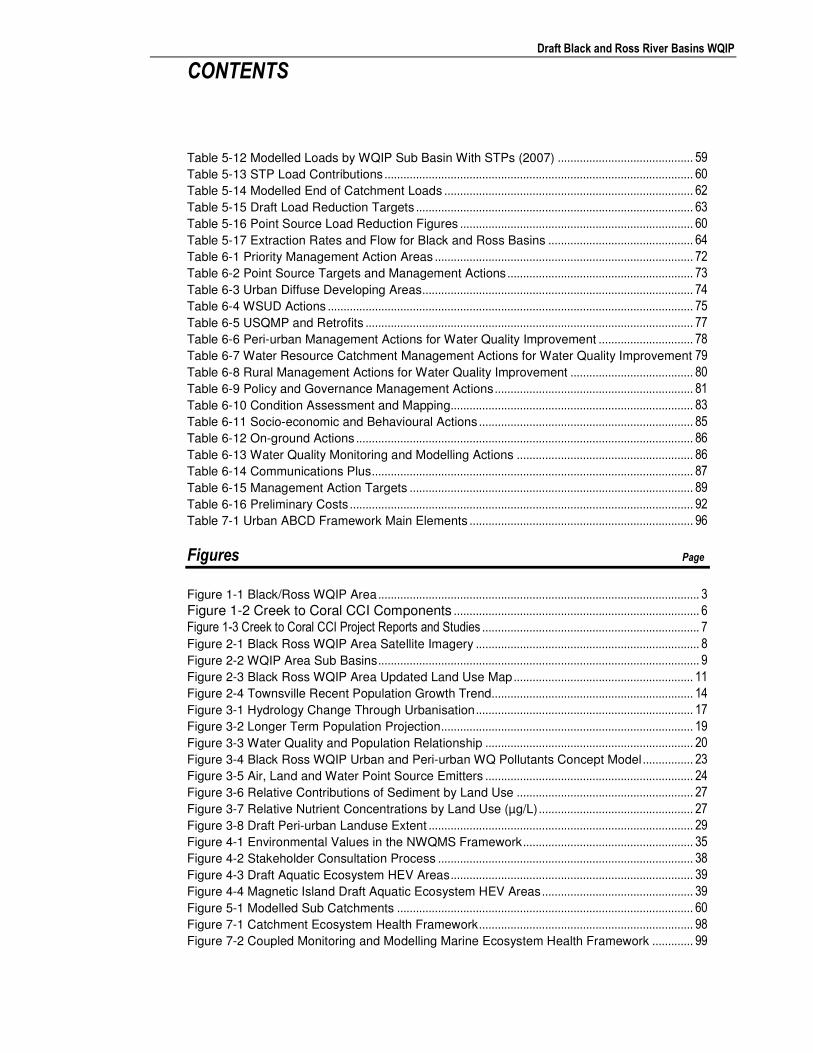
Table 2-1 Black/Ross WQIP River Basin and Catchment Areas .................................................... 9 Table 2-2 Sub Basins of the Black/Ross WQIP Area ..................................................................... 10 Table 2-3 Principal Land Use Categories (2005) ............................................................................ 10 Table 2-4 Land Use Summary by Sub Basin................................................................................... 12 Table 2-5 Initial Land Use Divisions by Study ................................................................................. 13 Table 2-6 Estimated Resident Population Growth Trends............................................................. 14 Table 3-1 Land Use Divisions for Urban WQIP Purposes ............................................................. 18 Table 3-2 Population Growth Projections for Townsville................................................................ 19 Table 3-3 Relative Pollutant Contribution by Land Use ................................................................. 21 Table 3-4 Recalculated EMC Values ................................................................................................ 22 Table 3-5 Point Source Pollutant Load Contributions..................................................................... 25 Table 3-6 Comparison of Cleveland Bay STP Contribution Pre and Post Upgrade .................. 25 Table 3-7 Urban Diffuse Water Quality Pollutants .......................................................................... 26 Table 3-8 Main Pollutants and Sources............................................................................................ 30 Table 3-9 Other Rural Pollutants ....................................................................................................... 31 Table 3-10 Estimated Atmospheric Deposition Contributions to Main Catchments................... 32 Table 3-11 Atmospheric Deposition Contributions Using Modelled EOC Loads........................ 33 Table 4-1 Environmental Values Definitions .................................................................................... 36 Table 4-2 Draft Environmental Values Black Basin ........................................................................ 40 Table 4-3 Draft Environmental Values Upper Ross River Catchment (Ross Basin) ................. 42 Table 4-4 Draft Environmental Values Ross River Basin (exc. Upper Ross River Catchment)
....................................................................................................................................................... 43 Table 4-5 Draft Environmental Values for Magnetic Island ........................................................... 45 Table 4-6 Draft Environmental Values Mainland Estuaries (Black and Ross Basins) ............... 46 Table 4-7 Draft Environmental Values Magnetic Island Estuaries and Coastal and Marine .... 47 Table 5-1 Condition Indicators ........................................................................................................... 48 Table 5-2 Draft Ambient Physico-chemical Water Quality Objectives Freshwater and Estuaries
....................................................................................................................................................... 50 Table 5-3 Draft Marine Physico-chemical Water Quality Objectives............................................ 50 Table 5-4 Draft Pesticide Water Quality Objectives........................................................................ 51 Table 5-5 Draft Heavy Metal Water Quality Objectives.................................................................. 51 Table 5-6 Draft Heavy Metals in Sediment Objectives ................................................................... 52 Table 5-7 Event Based Water Quality Objectives ........................................................................... 52 Table 5-8 Freshwater Ambient WQOs and Targets (µg/L) ............................................................ 53 Table 5-9 Estuarine Ambient WQOs and Targets (µg/L) ............................................................... 56 Table 5-10 Marine Ambient WQOs and 2021 Targets (µg/L)........................................................ 58 Table 5-11 Modelled Loads by WQIP Sub Basin (No STPs) ........................................................ 59
Draft Black and Ross River Basins WQIP
CONTENTS
Table 5-12 Modelled Loads by WQIP Sub Basin With STPs (2007) ........................................... 59 Table 5-13 STP Load Contributions .................................................................................................. 60 Table 5-14 Modelled End of Catchment Loads ............................................................................... 62 Table 5-15 Draft Load Reduction Targets ........................................................................................ 63 Table 5-16 Point Source Load Reduction Figures .......................................................................... 60 Table 5-17 Extraction Rates and Flow for Black and Ross Basins .............................................. 64 Table 6-1 Priority Management Action Areas .................................................................................. 72 Table 6-2 Point Source Targets and Management Actions ........................................................... 73 Table 6-3 Urban Diffuse Developing Areas...................................................................................... 74 Table 6-4 WSUD Actions .................................................................................................................... 75 Table 6-5 USQMP and Retrofits ........................................................................................................ 77 Table 6-6 Peri-urban Management Actions for Water Quality Improvement .............................. 78 Table 6-7 Water Resource Catchment Management Actions for Water Quality Improvement 79 Table 6-8 Rural Management Actions for Water Quality Improvement ....................................... 80 Table 6-9 Policy and Governance Management Actions ............................................................... 81 Table 6-10 Condition Assessment and Mapping............................................................................. 83 Table 6-11 Socio-economic and Behavioural Actions .................................................................... 85 Table 6-12 On-ground Actions ........................................................................................................... 86 Table 6-13 Water Quality Monitoring and Modelling Actions ........................................................ 86 Table 6-14 Communications Plus...................................................................................................... 87 Table 6-15 Management Action Targets .......................................................................................... 89 Table 6-16 Preliminary Costs ............................................................................................................. 92 Table 7-1 Urban ABCD Framework Main Elements ....................................................................... 96
Figures Page
Figure 1-1 Black/Ross WQIP Area ...................................................................................................... 3 Figure 1-2 Creek to Coral CCI Components .............................................................................. 6 Figure 1-3 Creek to Coral CCI Project Reports and Studies ..................................................................... 7 Figure 2-1 Black Ross WQIP Area Satellite Imagery ....................................................................... 8 Figure 2-2 WQIP Area Sub Basins...................................................................................................... 9 Figure 2-3 Black Ross WQIP Area Updated Land Use Map ......................................................... 11 Figure 2-4 Townsville Recent Population Growth Trend................................................................ 14 Figure 3-1 Hydrology Change Through Urbanisation ..................................................................... 17 Figure 3-2 Longer Term Population Projection................................................................................ 19 Figure 3-3 Water Quality and Population Relationship .................................................................. 20 Figure 3-4 Black Ross WQIP Urban and Peri-urban WQ Pollutants Concept Model ................ 23 Figure 3-5 Air, Land and Water Point Source Emitters .................................................................. 24 Figure 3-6 Relative Contributions of Sediment by Land Use ........................................................ 27 Figure 3-7 Relative Nutrient Concentrations by Land Use (µg/L) ................................................. 27 Figure 3-8 Draft Peri-urban Landuse Extent .................................................................................... 29 Figure 4-1 Environmental Values in the NWQMS Framework ...................................................... 35 Figure 4-2 Stakeholder Consultation Process ................................................................................. 38 Figure 4-3 Draft Aquatic Ecosystem HEV Areas............................................................................. 39 Figure 4-4 Magnetic Island Draft Aquatic Ecosystem HEV Areas ................................................ 39 Figure 5-1 Modelled Sub Catchments .............................................................................................. 60 Figure 7-1 Catchment Ecosystem Health Framework.................................................................... 98 Figure 7-2 Coupled Monitoring and Modelling Marine Ecosystem Health Framework ............. 99

Draft Black and Ross River Basins WQIP
CONTENTS
Figure 7-3 Initial BBN Concept for the Bohle River Catchment .................................................. 101 Figure 7-4 Double Open Loop Adaptive Management and Planning Model............................. 103 Figure 7-5 Adaptive Management Strategy Main Pathways ................................................................. 105
Document Control
Document ID:
Version Date Revision Details Typist Author Verifier Approver
12a June 09 Draft for comment during public
consultation period
JG John
Gunn and
Chris
Manning
CM/GB TCC

Draft Black and Ross River Basins WQIP
Forward To be added after incorporation of comments from the public consultation phase.

Draft Black and Ross River Basins WQIP
Acknowledgements
The Black Ross Water Quality Improvement Plan (WQIP) was developed by the Townsville City
Council, through its Creek to Coral initiative, which is a partnership between Council, Government and
the community. The WQIP was developed with funding assistance from the Australian Government’s
Coastal Catchments Initiative (CCI), through the Department of Environment, Water, Heritage and the
Arts.
Development of the WQIP was guided by a Steering Committee of key stakeholders from government,
industry, non-government organisations and the scientific community. Members contributed their time
and expertise, and provided valuable information and feedback throughout the development process.
Members of the Steering Committee were Jon Brodie (ACTFR), Niall Connolly (DERM/EPA), Melinda
Louden/Anna Skillington (TPA), Peter Verwey/Ian Sinclair (DERM/NRW), Jane Waterhouse (CSIRO),
Alan Walker/Clint Burgess (TCC), Jos Hill/Marie-Lise Schlappy (Reef Check Australia), Allan McManus
(Defence), Adam Sadler/Ben Daniel (TCC), Margaret Gooch (JCU), Evan Kruckow/Greg Willcox (CVA),
Scott Crawford/Ian Dight/Sarah Connor (NQDT) and Iony Woolaghan (DPI&F)
Significant in-kind support from the Queensland Government was gratefully received throughout the
WQIP development process with particular mention for Niall Connolly, John Bennett, Dane Moulton,
Fiona Watson, Mark Kelton and Peter Curley from the Department of Environment and Resource
Management (formerly the Environmental Protection Agency).
Zoe Bainbridge and Steve Lewis from Australian Centre of Tropical Freshwater Research (ACTFR)
deserve special mention for their commitment to our event water quality monitoring program often in
trying conditions. Theirs and Jon Brodie’s advice, expertise and support during the WQIP development
process was greatly appreciated.
Townsville City Council also provided significant in-kind assistance to this project through the valuable
assistance and expertise of many staff members, including Alastair McHarg, Brian Bailey, Leif Hickey,
Julie Cardiff, Karen Bird, Sonia Muller, Edgar Salvador, Anna Whelan, Daryl Antat, Rob Hunt, Renee
Craft, Neil Davies and Denise Hinneberg. Thanks also to Greg Bruce and the team in Integrated
Sustainability for their continued support, expertise and patience throughout this project, particularly
through the challenging times of local government amalgamations. DJ Mackenzie is also acknowledged
for his early work in securing funding for and initiating the CCI project.
Finally special mention and acknowledgment is reserved for John Gunn for his commitment and
professionalism throughout, and in particular for his contribution to the writing of the WQIP and many of
its supporting documents.
Other acknowledgements:
GIS layers were provided by Townsville City Council, Great Barrier Reef Marine Park Authority, North
Queensland Dry Tropics, CSIRO and Department of Environment and Resource Management.
Water quality data and other information was provided by Townsville City Council, Department of
Environment and Resource Management, Townsville Port Authority, Great Barrier Reef Marine Park
Authority, Australian Institute of Marine Science, Department of Defence, BHP Billiton (Yabulu) and
Conservation Volunteers Australia. Special mention to Mick Brady (CVA) and the members of our
Creekwatch Groups who volunteered their valuable time to collect some of the water quality data used
in background reports and the WQIP.
Photos are acknowledged as Townsville City Council unless otherwise stated.
Chris Manning

Draft Black and Ross River Basins WQIP
Have Your Say - Comments Please The Draft Black Ross Water Quality Improvement Plan (WQIP) isn’t finished yet because we don’t have your comments. Townsville City Council, through the Creek to Coral initiative, has developed the draft WQIP with the to inform the draft Black Ross WQIP, but we don’t think that we know it all. Your comments on the draft WQIP and the background reports will help us finish this part of the process to improve water quality in our streams, estuaries and the Great Barrier Reef lagoon. The background reports and the draft WQIP can be viewed on the Creek to Coral website at:
www.creektocoral.org/draftwqip Please take the time to look at the draft documents and provide comments so we can improve the final products. As you will see from the adaptive planning and management approach in the draft WQIP this is not the final WQIP rather the start of an ongoing process that can only work effectively with community input and ongoing action. That includes continually updating the WQIP and actions as we learn about what works and what doesn’t. To make commenting a bit easier we have prepared a feedback form for your use which is available to download from the Creek to Coral website. Feel free to add supporting information or additional notes and please provide your contact details so that we can discuss any comments with you if necessary. Please address all comments to Chris Manning at: Email: [email protected] (best option) Post: PO Box 1268, Townsville 4810 Delivered: TCC Administration Building, Walker Street (Integrated Sustainability Services office) If you have any questions please contact Chris on 47279000 Feel free to add supporting information or additional notes and please provide your contact details so that we can discuss any comments with you if necessary.

Draft Black and Ross River Basins WQIP
Abbreviations ANZECC Australian and New Zealand Environment and Conservation Council ARI Annual recurrence interval ARMCANZ Agriculture and Resource Management Council of Australia and New
Zealand AWQG Australian and New Zealand Guidelines for Fresh and Marine Water
Quality 2000 AWR Australian Water Resources (Council) – River basins C2C Creek to Coral DERM Department of Environment and Resource Management (combined
DNRW and EPA)
DNRW Department of Natural Resources and Water (Queensland Government)
DPIF Department of Primary Industries and Fisheries (Queensland Government)
ESD Ecologically Sustainable Development EPA Environmental Protection Agency (Queensland Government) EPP Water Environmental Protection (Water) Policy 1997 EP Act Environmental Protection Act 1994 ERA Environmentally Relevant Activity EVs Environmental Values GBR Great Barrier Reef GBRC Great Barrier Reef Catchment GBRMP Great Barrier Reef Marine Park GBRMPA Great Barrier Reef Marine Park Authority HEV High Ecological Value IDAS Integrated Development Assessment System IP ACT Integrated Planning Act 1997 LGAQ Local Government Association of Queensland NPI National Pollutant Inventory NRM Natural resource management QA Quality Assurance TBL Triple Bottom Line TCC Townsville City Council WG Working Group WQ Water Quality WQG Water Quality Guideline WQOs Water Quality Objectives WSUD Water sensitive urban design

Draft Black and Ross River Basins WQIP
Page 1
1. Introduction
1.1 Why We Need to Protect Water Quality
There are many pressures impacting water quality throughout Australia with some of the more
intense pressures arising from the relatively concentrated human population and associated industry
and infrastructure in our coastal areas. Where does the rainwater go after it leaves your backyard in
Townsville? It usually finds it way to the nearest creek and then heads downstream and flows to
meet the waters of the Great Barrier Reef.
The quality of water in the GBR lagoon is important to the maintenance of the habitats and amazing
biodiversity of the GBRMP, and especially of the near shore areas. The water quality of the GBR is
impacted by the quality of water entering the GBRMP from the catchments stretching the 14 degrees
of latitude from Cape York to the Burnett-Mary catchment. Collectively known as the GBR
catchments, the activities that take place on this land mass ultimately have significant impacts on the
quality of water of the GBR. The Black and Ross River Basins are part of the GBR catchment and
Townsville is home to the largest urban population in the GBR catchments.
A report released by the Great Barrier Reef Marine Park Authority in 2001 significantly raised the
profile of water quality issues associated with the GBR. The report, Great Barrier Reef catchment
water quality action plan: A report to Ministerial Council on targets for pollutant loads (Brodie et al
2001), generated a great deal of debate opening with the statement “Decades of scientific research
and evaluation has now clearly and unequivocally established that land use activities in the
catchments adjacent to the Great Barrier Reef are directly contributing to a decline in water quality”
(Brodie et al 2001, p.i). We are all part of that land use activity.
The Great Barrier Reef – Worth Protecting
The Great Barrier Reef Marine Park (GBRMP) is almost 350,000 square kilometres in area and
is located along 2,100 kilometres of the Queensland coastline, spanning 14 degrees of latitude.
The Great Barrier Reef (GBR) is a complex maze of about 2900 separate coral reefs accounting
for around 6% of the area of the Great Barrier Reef Marine Park.
“The Great Barrier Reef is renowned internationally for its ecological importance and the beauty
of its seascapes and landscapes. These natural values also provide important ecosystem
services, which underpin Australian $6.9 billion worth of economic activity and incalculable social
values. In combination, the social-ecological system centred on the reef is extraordinary in its
importance, and in its complexity”
“About 36 percent of the Great Barrier Reef Marine Park is continental slope, where the water is
between 150 and 2000 metres deep. The remaining 64 percent is continental shelf, including the
coral reefs, which is anywhere from 1 to 150 metres deep. The other main geographical
components of the continental shelf are the inter-reef areas (25% of the Marine Park) and the
lagoon (33%)”.
“Within these major geographic divisions of the Great Barrier Reef are many different types of
habitat and biological community. The best known of these are the coral reefs, but there are also
seagrass beds, algal meadows, sponge and soft coral gardens, sandy and muddy areas,
mangrove forests and islands. This array of habitats supports an amazing biodiversity” (Johnson
and Marshall (eds) 2007, pp.2-3).

Draft Black and Ross River Basins WQIP
Page 2
1.2 Water Quality Protection Initiatives
To manage water quality in our populated coastal regions requires a joint effort at all levels of
government in partnership with industry and the community. A variety of water quality improvement
initiatives are being implemented throughout Queensland and Australia at different scales and with a
range of objectives. The health of the Great Barrier Reef (GBR) has been the focus of water quality
improvement for the GBR catchments in recent times with support from the Commonwealth
government, State agencies and an array of land managers and community members within the
catchments of the Great Barrier Reef.
1.2.1 Reef Plan – It’s About the Reef and the Land
The Reef Water Quality Protection Plan (Reef Plan) is an initiative of the Australian and Queensland
governments, in partnership with industry and the community. The Plan was released in 2003 in
response to concerns over declining Great Barrier Reef (Reef) water quality resulting from land-
based activities in the Reef catchment. The goal is to halt and reverse the decline in water quality
entering the Reef within ten years.
The objectives of the Reef Plan are:
• A reduction of the load of pollutants from diffuse sources in the water entering the Reef;
• Rehabilitated and conserved areas of the Reef catchment that have a role in removing water
borne pollutants.
To achieve these objectives the Reef Plan focuses on the following:
• Provide priorities for actions and investment based on the best available science and a risk
management approach to achieve the greatest improvement in Reef water quality;
• Provide a foundation for Regional NRM bodies and other stakeholders to develop and
achieve water quality improvement targets for rivers discharging into the Reef;
• Promote and facilitate the adoption of sustainable production systems that improve the
quality of water entering the Reef;
• Enhance co-operative partnerships to develop cost effective short and longer-term measures
that can improve the quality of water entering the Reef; and
• Establish a science-based performance monitoring and evaluation program to support a
responsive and adaptive management regime for the Reef Plan.
The Reef Plan is an umbrella plan designed to integrate and coordinate action on Reef water quality
by government agencies and a wide range of industry and community groups. It consists of nine
main strategies and sixty-four subservient actions. One such action (Reef Plan Action D4), promotes
the development of water quality improvement plans by local governments and regional NRM
bodies.
1.2.2 Coastal Catchments Initiative and Water Quality Improvement Plans
The Coastal Catchments Initiative (CCI) is an Australian Government funded program aimed at
achieving targeted reductions in pollution discharges to coastal water quality ‘hot spots’. Hot spots, in
this context are coastal waters with high conservation value and are threatened by pollution from
various sources. The receiving waters of the Great Barrier Reef lagoon are considered to be one
such hot spot.
The CCI supports the development and implementation of Water Quality Improvement Plans (WQIP)
in accordance with the Australian Government’s Framework for Marine and Estuarine Water Quality
Protection. The Framework is based on the National Water Quality Management Strategy and the
National Principles for the Provision of Water for Ecosystems; both approved by Australian
Government/State Ministerial Councils.

Draft Black and Ross River Basins WQIP
Page 3
WQIPs will identify the most cost-effective and timely projects for investment by all parties, including
the Australian, State and Local Governments, industry and the community. The Australian
Government targets projects that are most likely to deliver cost-effective water quality improvements
and through an assurance from the respective jurisdictions, ensure that these improvements are
sustained into the future.
The development of WQIPs in the Great Barrier Reef catchment will help local governments and
regional Natural Resource Management (NRM) bodies determine environmental values and water
quality objectives for waterways in their catchment. Once developed, WQIPs will be integrated with
regional NRM plans and other relevant planning processes to ensure ongoing implementation and
achievement of objectives, including water quality objectives for the GBR lagoon (Source:
www.environment.gov.au/coasts/pollution/cci/index.html).
1.2.3 WQIPs in the Great Barrier Reef catchment
WQIPs have been developed for the (former) Douglas Shire, the Mackay Whitsunday NRM region,
the Tully and Murray River Basins, and the Burdekin and Haughton Basins (draft). WQIPs are also
being prepared for parts of the Burnett/Mary NRM region and the Barron River Basin (Cairns).
1.2.4 Black and Ross Basins WQIP Area
The Black/Ross WQIP area covers most waterways within the Townsville City local government area
with the exception of the Reid River and Major Creek catchments, which are part of the Haughton
River Basin.
Figure 1-1 Black/Ross WQIP Area
Inset: AWR Basins

Draft Black and Ross River Basins WQIP
Page 4
The WQIP area includes the Black River (No. 17) and Ross River (No. 18) Australian Water
Resource Council (AWR) Basins and a small part of the Haughton River Basin (No. 19) where the
waterways flow to Cleveland Bay. It also includes Magnetic Island, as well as the coastal and marine
waters of Cleveland Bay and Halifax Bay (see Figure 1-1 and Figure 2-1).
1.2.5 Creek to Coral
Creek to Coral is managing the CCI project for the Black and Ross River Basins and, with the
assistance of its many partners, is responsible for the preparation of a Water Quality Improvement
Plan (WQIP).
Townsville and Thuringowa City Councils established the Creek to Coral initiative in 2003 in
partnership with the Queensland Environmental Protection Agency (EPA) and supported by the
Great Barrier Reef Marine Park Authority (GBRMPA). The Creek to Coral initiative is a locally
adapted version of the South East Queensland (SEQ) Healthy Waterways Program and emphasises
local concerns and issues in an environmental context that is relevant to the Townsville Dry Tropics
adjacent to the Great Barrier Reef.
The Creek to Coral concept is simple and all encompassing whereby creek applies to the top of the
catchment and relates to freshwater, all the way through to more estuarine waterways which
ultimately lead to the Great Barrier Reef, hence the choice of the word coral (For further information
visit www.creektocoral.org.au).
1.3 Water Quality Improvement Plan Development
The development of the Black/Ross WQIP by Creek to Coral was guided by a Steering group
comprising representatives from the main stakeholder groups in the Townsville region (see
Acknowledgement page). Consultation involved the Steering group, technical panels and working
groups, and community involvement (see Figure 4-2). The key components of the WQIP, involving
the preparation of background reports and consultation included (see Figure 1-2):
• Gathering background information including identifying issues and threats;
• Defining draft environmental values and water quality guidelines;
• Setting water quality objectives (targets) for protecting environmental values;
• Identifying management options to achieve targets and determining the most cost effective
actions;
• Preparing an implementation plan with a reasonable assurance statement; and
• Developing agreed adaptive management strategies and WQIP evaluation frameworks.
1.3.1 Complementary Components of the Black/Ross WQIP
The development of the Black/Ross Water Quality Improvement Plan (WQIP) was underpinned by a
number of complementary components of the ongoing Creek to Coral program. The two main
components are briefly described below.
I. Water quality monitoring and modelling program
Results from the water quality monitoring and modelling program have been used as input to inform
the WQIP.
• An integrated water quality monitoring programme including event monitoring in 2006/2007
and 2007/2008 ‘wet seasons’;
• Sediment monitoring post 2007/2008 wet season;
• Modelling to establish pollutant loading;
• Identification of complementary elements between the WQIP, the Stormwater Management
Framework for Townsville and Water Sensitive Urban Design (WSUD);
• Establishment of a report card format outlining catchment condition.

Draft Black and Ross River Basins WQIP
Page 5
II. Support for the Strategic Partnership Approach and the Community Based Education and
Involvement (CBEI) Network
The main elements of this task included:
• Establishment of a central communication and information exchange forum based web portal;
• Support for the Creek to Coral Community Based Education and Involvement (CBEI) program
and network including Citischools, Creekwatch, Reefcheck, Seagrass Watch, and Reef
Guardian Schools through the Sustainable Education Network (SEN). Community involvement
opportunities (e.g. catchment tours), community events and school curriculum input;
• Development of a stakeholder consultation strategy;
• Behaviour change investigations and training.
Another key initiative that emerged during the development of the WQIP was the desire by partner
organisations and Council departments to develop Water Sensitive Urban Design (WSUD)
Guidelines for the Townsville region. A set of WSUD technical design guidelines for Townsville were
developed and the testing, refinement, adoption and delivery of the WSUD concept has been
incorporated into the WQIP as an integral management action for long term water quality
improvement in the ‘mature’ (developed) urban environment.

Draft Black and Ross River Basins WQIP
Page 6
Figure 1-2 Creek to Coral CCI Components
Source: Black Ross CCI Project Communication Strategy Jan 08
C2C Coastal Catchments Initiative Project
1 Water Quality Im
prove
men
t Plan
Background
Information
GIS and Mapping
Waterway
Pressures
Waterway
Condition
Environmental
Values
Water Quality
Objectives
Water Quality and
Flow Targets
Management
Options Analysis
Operational
Components
Implementation
Plan
2 Water Quality Monitoring and
Modelling (Pollutant Loads)
3 On-ground Infrastructure and Design Guidelines
(WSUD)
4 Community Based
Education and In
volvem
ent

Draft Black and Ross River Basins WQIP
Page 7
Figure 1-3 Creek to Coral CCI Project Reports and Studies
Pollutant Sources Report (JWP/WP)
Riparian Condition Reports 1 & 2(C and R)
Water Quality (WQ) Database Compilation
(Connell Wagner)
WQ Condition Report (Connell Wagner)
WQ Report Card (Connell Wagner)
2006/07 Event WQ Monitoring Report (ACTFR 07-09)
2007/08 Event WQ Monitoring and Synthesis Report (ACTFR 08-04) 2008 Sediment
Monitoring Report (ACTFR 08-20)
Townsville Stormwater Quality Improvement Devices (SQID) Report
(Zingspace)
Catchment Modelling Report
(BMT/WBM)
Legislation Review Report
(Connell Wagner) IP
GIS and Mapping (TCC, CSIRO, EPA and
Connell Wagner)
Climate Change Projections for Townsville (CSIRO)
Climate Change and Water Quality in
Townsville (SEAO2)
Townsville Catchments Demographic Statistics(Office of Economic & Statistical Research – Queensland Treasury)
Bayesian Belief Network and Social Learning Report (CSIRO and C2C)
Community Based Education and Involvement CCI
Summary (Creek to Coral) IP
Community Based Social Marketing, Thematic
Interpretation and Social Learning CCI Summary (Earth Environmental and Creek to Coral) IP
Townsville Population Growth and Urban
Expansion Scenarios (Townsville City
Council) IP
Stuart Creek Hydrology Assessment
(C and R)
Stuart Creek Geomorphological
Assessment (Hydrobiology)
Black Ross CCI Project Communication
Strategy (Creek to Coral)
Draft Basins, Sub Basins, Catchments and Receiving Waters Background Report
(Creek to Coral and Earth Environmental)
Draft Pollutant Types, Sources and Water Quality Impacts Background Report (Earth
Environmental and Creek to Coral)
Draft Environmental Values and Water Quality Objectives Background Report
(Earth Environmental and Creek to Coral)
Human Use Environmental Values Background Report (Earth Environmental
and Zingspace)
Creek to Coral CCI Project WQIP Synthesis Reports

Draft Black and Ross River Basins WQIP
Page 8
2. Characteristics of the Black/Ross WQIP Area
2.1 Background
This section provides a brief summary of the main characteristics of the Black Ross WQIP area. For
more detailed information please refer to the main background report - Basins, Catchments and
Receiving Waters of the Black and Ross River Basins Water Quality Improvement Plan Area (Gunn,
Manning, and Connolly 2009).
The coastline of the Black Ross WQIP area (including Magnetic Island) is approximately 130
kilometres, which is equivalent to approximately 6% of the total GBR catchments coastline.
Figure 2-1 Black Ross WQIP Area Satellite Imagery
Note: The Ross River Dam is a prominent feature of the Ross River Basin and is the main water supply for
Townsville.
The total land area of the catchments in the Black and Ross Basins that flow to Cleveland and
Halifax Bays is 270,065 hectares (2,700 square kilometers). This represents approximately 0.6% of
the total area of the GBR catchments. The individual areas of the river Basins and Magnetic Island
are listed in Table 2-1.

Draft Black and Ross River Basins WQIP
Page 9
Table 2-1 Black/Ross WQIP River Basin and Catchment Areas
Basin/Catchment Land area
(hectares)
Square kilometres % of WQIP land
area
Black River Basin (AWR) 106,284 1062.84 39.4
Ross River Basin (AWR) 132,092 1320.92 48.9
Haughton Basin (AWR) (part) 26,541 265.41 9.8
Magnetic Island 5,148 51.48 1.9
WQIP area total 270,065 2,700.65 100
Note: The Black Ross WQIP uses the AWR Basins. Drainage Basins as defined by the predecessors of the
Queensland Department of Natural Resources and Water (DNRW) are not the same as the AWR Basins i.e.
DNRW Ross Basin is larger and includes part of the AWR Haughton Basin (DNRW Ross Basin is 1,707 sq km
compared to AWR Ross Basin 1,321 sq km. Difference = 386 sq km).
The Black/Ross WQIP area (see section 1.2.4) has been further divided into 10 sub basins (Figure
2-2) and 47 catchments and sub catchments. These divisions have been established to assist with
condition assessment, monitoring, modelling and reporting. Profiles of the Black River and Ross
River Basins, catchments, sub catchments and associated waterways and wetlands are provided in
the main background report (Gunn, Manning, and Connolly 2009).
Figure 2-2 WQIP Area Sub Basins
Draft Black and Ross River Basins WQIP
Page 10
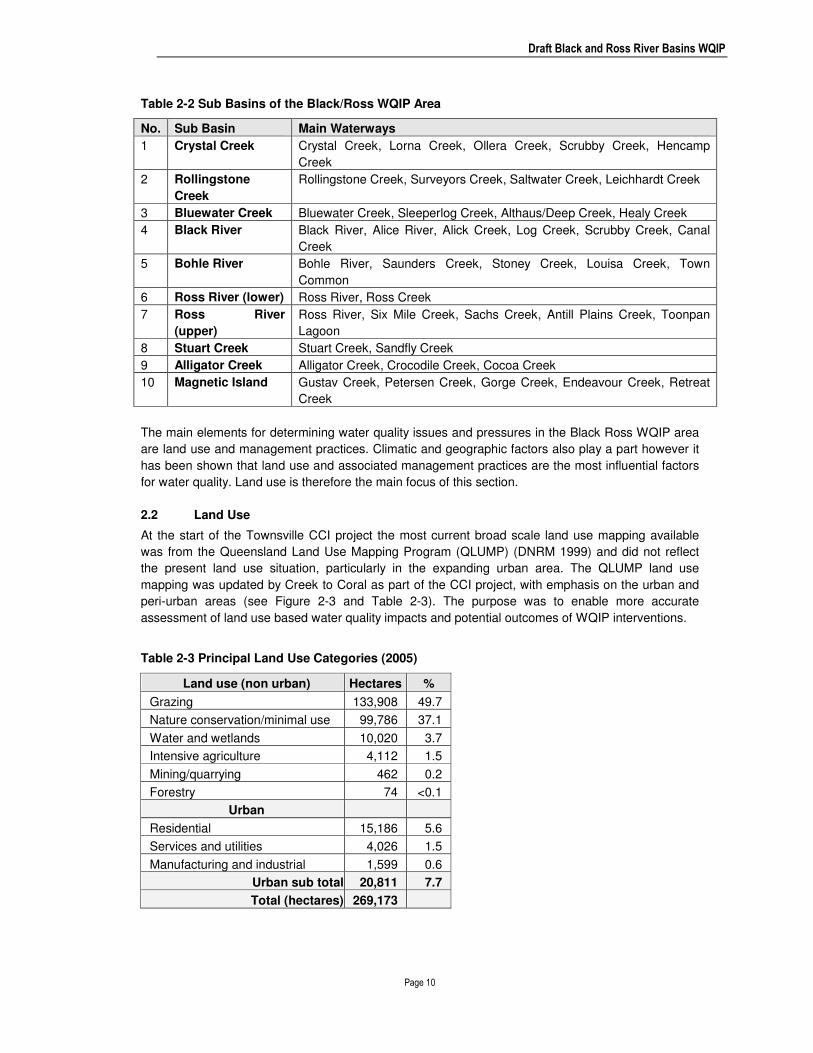
Table 2-2 Sub Basins of the Black/Ross WQIP Area
No. Sub Basin Main Waterways
1 Crystal Creek Crystal Creek, Lorna Creek, Ollera Creek, Scrubby Creek, Hencamp
Creek
2 Rollingstone
Creek
Rollingstone Creek, Surveyors Creek, Saltwater Creek, Leichhardt Creek
3 Bluewater Creek Bluewater Creek, Sleeperlog Creek, Althaus/Deep Creek, Healy Creek
4 Black River Black River, Alice River, Alick Creek, Log Creek, Scrubby Creek, Canal
Creek
5 Bohle River Bohle River, Saunders Creek, Stoney Creek, Louisa Creek, Town
Common
6 Ross River (lower) Ross River, Ross Creek
7 Ross River
(upper)
Ross River, Six Mile Creek, Sachs Creek, Antill Plains Creek, Toonpan
Lagoon
8 Stuart Creek Stuart Creek, Sandfly Creek
9 Alligator Creek Alligator Creek, Crocodile Creek, Cocoa Creek
10 Magnetic Island Gustav Creek, Petersen Creek, Gorge Creek, Endeavour Creek, Retreat
Creek
The main elements for determining water quality issues and pressures in the Black Ross WQIP area
are land use and management practices. Climatic and geographic factors also play a part however it
has been shown that land use and associated management practices are the most influential factors
for water quality. Land use is therefore the main focus of this section.
2.2 Land Use
At the start of the Townsville CCI project the most current broad scale land use mapping available
was from the Queensland Land Use Mapping Program (QLUMP) (DNRM 1999) and did not reflect
the present land use situation, particularly in the expanding urban area. The QLUMP land use
mapping was updated by Creek to Coral as part of the CCI project, with emphasis on the urban and
peri-urban areas (see Figure 2-3 and Table 2-3). The purpose was to enable more accurate
assessment of land use based water quality impacts and potential outcomes of WQIP interventions.
Table 2-3 Principal Land Use Categories (2005)
Land use (non urban) Hectares %
Grazing 133,908 49.7
Nature conservation/minimal use 99,786 37.1
Water and wetlands 10,020 3.7
Intensive agriculture 4,112 1.5
Mining/quarrying 462 0.2
Forestry 74 <0.1
Urban
Residential 15,186 5.6
Services and utilities 4,026 1.5
Manufacturing and industrial 1,599 0.6
Urban sub total 20,811 7.7
Total (hectares) 269,173

Draft Black and Ross River Basins WQIP
Page 11
Figure 2-3 Black Ross WQIP Area Updated Land Use Map
Note: The 1999 QLUMP land use data was updated using 2004/2005 aerial photography provided by Townsville
City Council, and SPOT satellite imagery provided by NQ Dry Tropics (formerly Burdekin Dry Tropics NRM).
The dominant land use in the Black Ross WQIP area (see Table 2-3) is grazing (approximately half
of the area) with another 37% being minimal use and conservation. The urban land use extent, at
7.7%, is well above the average for more rural based WQIPs e.g. Mackay Whitsunday 1% and
Burdekin 0.09%. The peri-urban zone ‘surrounds’ the urban areas and is comprised of parts of the
‘non-urban’ land uses. The peri-urban zone covers approximately 30% of the total Black Ross WQIP
area. A summary of land use by sub basins in the Black Ross WQIP is provided in Table 2-4. Peri-
urban areas are ‘disguised’ as rural type land uses.

Draft Black and Ross River Basins WQIP
Page 12
Table 2-4 Land Use Summary by Sub Basin
Crystal
Rollingston
e Bluewater Black Bohle
Lower
Ross
Upper
Ross Stuart Alligator Magnetic Is Land Use
Ha % Ha % Ha % Ha % Ha % Ha % Ha % Ha % Ha % Ha %
Channel/Aquaduct 7 0.0
Cropping 10 0.0 28 0.1 103 0.3 4 0.0 43 0.2
Grazing Natural Vegetation 2,287 9.5 2,382 10.8 21,912 75.3 23,295 76.2 19,965 61.9 316 2.3 54,437 71.7 5,203 50.2 4,111 15.5
Intensive Animal Production 40 0.2 105 0.4 90 0.3 23 0.2
Irrigated Cropping 1,697 7.1 52 0.2 7 0.0 254 0.8 63 0.1 234 2.3 26 0.1
Irrigated Perennial
Horticulture 88 0.4 70 0.3 77 0.3 58 0.2 323 0.4 56 0.5 184 0.7
Irrigated Seasonal Horticulture 178 0.7 215 1.0 35 0.0 15 0.1
Manufacturing and industrial 119 0.4 837 2.6 268 2.0 11 0.0 359 3.5 5 0.1
Marsh/Wetland 205 0.9 96 0.4 352 1.2 165 0.5 529 1.6 516 3.8 1,033 10.0 1,755 6.6
Mining 4 0.0 169 0.6 95 0.3 21 0.2 53 0.1 109 1.1 11 0.0
Nature Conservation 11,786 49.2 15,865 72.1 1,682 5.8 1,963 6.4 3,185 9.9 944 7.0 8,367 11.0 1,366 13.2 14,229 53.6 2,639 52.9
Other minimal use 7,365 30.7 2,863 13.0 3,185 10.9 2,284 7.5 2,115 6.6 5,016 37.2 7,580 10.0 1,753 16.9 3,676 13.9 1,924 38.6
Perennial Horticulture 4 0.0 27 0.1 3 0.0
Plantation Forestry 70 0.3
Production Forestry 1 0.0 2 0.0
Reservoir/Dam 2 0.0 5 0.0 27 0.1 183 0.6 3 0.0 149 1.1 4,335 5.7 16 0.2
Residential 171 0.7 253 1.1 1,473 5.1 1,979 6.5 3,944 12.2 3,737 27.7 647 0.9 173 1.7 2,427 9.2 383 7.7
River 61 0.3 10 0.0 58 0.2 343 1.1 16 0.0 92 0.7 27 0.0 43 0.2
Services 25 0.1 34 0.2 45 0.2 53 0.2 694 2.2 2,017 15.0 75 0.1 33 0.3 27 0.5
Transport and Communication 85 0.4 15 0.1 7 0.0 443 1.4 390 2.9 14 0.1
Utilities 17 0.1 9 0.1 2 0.0
Waste treatment and disposal 5 0.0 4 0.0 12 0.0 13 0.3
Total (hectares) 23,969 22,003 29,096 30,559 32,230 13,475 75,953 10,374 26,523 4,990
Note: The dominant landuse is shaded as: 1st Yellow, 2nd Blue, 3rd Green, 4th Pink. More detailed land use has been described for the Bohle catchment for use in modelled
sub catchments (results in Modelling Report (BMT/WBM 2009) and BBN Modelling and Social Learning Report (Lynam et al 2008) – draft only/not for distribution). Dominant
land use –.

Draft Black and Ross River Basins WQIP
Page 13
Land use categories have been grouped and subdivided for different studies as part of the process
of developing the Black Ross WQIP. This was seen as necessary as the urban component of the
study area is a significant factor in determining water quality condition and pollutant loads. Various
land use divisions adopted for elements of the Black Ross WQIP, and their relationship to each
other, are shown in Table 2-5.
Table 2-5 Initial Land Use Divisions by Study
Pollutant source
identification
E2 Catchment Modelling Bayesian Belief Network
(BBN)
Rural
Natural areas/minimal use * Minimal Use/Natural Areas Greenspace (includes forestry)
Forestry
Intensive agriculture Agriculture (intensive) Intensive
agriculture/Horticulture
Rural (with rural residential) Grazing Grazing
Urban
Urban/residential Traditional i.e. houses
Dense i.e. units etc
Traditional residential *
High density residential
Commercial Commercial Commercial/Light industrial *
Industry (includes ports and
railways)
Industry (includes
manufacturing, services,
utilities, transport and waste
treatment and disposal)
Heavy industry (includes
manufacturing, some services,
some utilities, ports, railways,
airports and waste disposal)
Low urban
Formal parkland
Rural residential Peri-urban/Rural residential *
Mining Mining
Bare ground (developing
urban) *
Water (Water to be separated from
natural areas/minimal category)
Note: Separate rows are assigned to the landuse category adopted for each of the studies. The BBN project has
adopted three primary land use categories i.e. rural, urban and low urban, and placed the sub categories within
these. Low urban is conceptualised as the zone between urban and rural areas where the next ‘wave’ of
development is likely to take place. *Primary land use categories used by ACTFR in event monitoring 2006-
2008 – Established urban, developing urban, light industrial, urban industrial, rural residential, minimal use and
conservation.
2.3 People and Place
A more detailed picture of the socio-economic characteristics of the Black Ross WQIP area is
provided in the Catchment Profiles report (Gunn, Manning and Connolly 2009). A brief snapshot is
provided below.
The amalgamated City of Townsville covers an area of 3,736 square kilometres, encompassing the
Black Ross Water Quality Improvement Plan (WQIP) area. In 2005 (the base year for the Black Ross
WQIP relative to updated land use mapping) the Estimated Resident Population (ERP) for
Townsville stood at 160,220 people representing an annual increase of 3.1% from 2004. Estimated
resident population (ERP) trends are shown in Table 2-6 and Figure 2-4.

Draft Black and Ross River Basins WQIP
Page 14
Table 2-6 Estimated Resident Population Growth Trends
Growth Year at 30 June Number
Year to 30
June Number Percentage
2003 151,720
2004 155,367 2004 3,647 2.40%
2005 160,220 2005 4,853 3.10%
2006 165,278 2006 5,058 3.20%
2007r 170,408 2007r 5,130 3.10%
2008p 175,542 2008p 5,134 3.00%
2003-2008p 23,822 3.00%
Source: Australian Bureau of Statistics Catalogue Number: 3218.0 - Regional Population Growth, Australia,
2007-08; released 23 April 2009.
Note: Population estimates are final for 2003 to 2006 and revised for 2007 (2007r) to align with new June 2007
state totals released in September 2008. Estimates for 2008 are preliminary (denoted 2008p).
Figure 2-4 Townsville Recent Population Growth Trend
Estimated Resident Population Townsville City
151,720
155,367
160,220
165,278
170,408
175,542
135,000
140,000
145,000
150,000
155,000
160,000
165,000
170,000
175,000
180,000
2003 2004 2005 2006 2007r 2008p
Years
Peo
ple Estimates of Resident
Population
Source: Australian Bureau of Statistics Catalogue Number: 3218.0 - Regional Population Growth,
Australia, 2007-08; released 23 April 2009.

Draft Black and Ross River Basins WQIP
Page 15
During the years 2004-2006, Townsville experienced strong population growth. The rate of growth
has tapered slightly since that time. As at 30 June 2008, the estimated resident population was
175,542 people, which represents 4.1% of Queensland’s population. Townsville’s annual increase of
5,134 people over the year to June 2008 represents a 3% growth rate. This compares with an
increase of 5,130 people, or 3.1% growth rate, for the year to 30 June 2007.
Between 2007-2008, the growth rate for the state of Queensland was 2.3%. This was the slowest
annual growth for Queensland in the five years to June 2008. The average annual rate of change in
population in the Townsville local government area, over the five years between 30 June 2003 and
30 June 2008 was 3%, compared with 2.4% for the State.
Residential land activity is a strong potential indicator of both population growth and expansion of the
urban footprint. In the year to the June quarter 2005, Townsville produced 1743 residential lots. Lot
production has continued to be strong through the years to 2008, however the economic downturn
has acted to dampen the volume of recent land sales. Land sales for the year to June 2008 were
down significantly from previous years while lot consumption i.e. dwellings being constructed,
continued to record strong growth during 2008.
New household formation is an important indicator for population growth. If there is a downturn or
upswing in new household formation there is likely to be a corresponding movement in the annual
percentage population change.
The 2006 Census showed the average household size for Townsville City to be 2.8 people per
dwelling. This is high in comparison with the average household size for Queensland (2.6 people)
and for Australia (2.6 people). It is likely that the young population profile for Townsville, which
includes significant numbers of families with children, is a factor contributing to the higher than
average household occupancy.
Coupled with residential land activity, Building Approval data offers a key indicator for population
growth. In the year ended March 2009, there were 1,575 residential dwelling approvals in Townsville
City Council. These approvals were valued at $495.8 million and represented 5.0% of the overall
total for the State.
The labour force in the Northern labour force region, encompassing the City of Townsville, grew by
3.2% in the 2005 calendar year, while the labour force participation rate was generally higher than
overall participation rates for Queensland and Australia. At the time of the 2006 Census of
Population and Housing in Townsville City Council, there were 3,523 unemployed persons. With a
labour force consisting of 79,849 persons, this corresponded to an unemployment rate of 4.4 per
cent. The unemployment rate in Queensland as a whole was 4.7 per cent.
The median weekly income for Townsville at the 2006 Census for individual income was $ 531.00,
household income $1,101.00 and family income $ 1,237.00. Median household income levels in
Townsville were significantly higher than the medians for Queensland and Australia.
The 1996 Census indicated a median age for Townsville of 31 years. At the 2006 Census, the
median age for Townsville increased to 33 years, still significantly younger than the median age for
Queensland (36 years) and for Australia (37 years). Projections from the Queensland Department of
Infrastructure and Planning indicate the median age of Townsville City Council's population will
increase to 39 by 2031 (an increase of 6 years from the 2006 median age.

Draft Black and Ross River Basins WQIP
Page 16
3. Know the Issues, Pressures and Threats
3.1 Some Background and Assumptions
Pressures and threats to water quality are assumed to be those things resulting from human actions
(past, current and future), which have potential to impact water quality, as well as natural
phenomena. Issues includes the whole range of pressures and threats, which may be natural
phenomena, or natural phenomena exacerbated by human interaction and any other relevant and
unresolved matters. It is assumed that the majority of water quality issues are associated with land
based human activities, which can be defined in terms of pollutant type and source i.e. associated
with a particular land use.
It is recognised that not all pressures are threats, and that pressures and threats may not be
translated to actual impacts on water quality. Determining the level of impact is a function of
observation over time usually through water quality monitoring and analysis of the collected data. In
the absence of adequate resources to collect water quality data, catchment modelling is used to
predict the theoretical impact of pressures. This is an iterative learning process of monitoring and
modeling in order to better understand the correlation between pressures and water quality impacts
is still being determined for many situations in our region.
Where information is available to observe or predict a correlation between pressures and impacts it
is then possible to develop appropriate management measures with reasonable assurance that the
cause of the water quality issue will be addressed. Where the link between a pressure and a water
quality impact is still uncertain additional investigations may be required to ensure that we have
enough understanding of the situation to design meaningful and effective interventions.
We need to be mindful of the idea that for most situations we are not directly managing the
environment rather we are assisting the people who inhabit the environment to manage their
behaviour so that it doesn’t adversely impact the environment i.e. their life support system.
Within the Black Ross WQIP area the principal pressure impacting water quality, and other
environmental parameters, is land use intensification resulting from population growth. Threats to
water quality from land use intensification are generally due to inappropriate planning, design and/or
management. It follows that improvements in planning; design and management practices can have
a positive impact on water quality compared to the ‘business as usual’ scenario.
3.1.1 Issues by location
Land use type is the primary geographic division used when identifying and locating pressures and
threats, determining natural asset condition, and subsequently when implementing management
actions. Along with the general land use divisions e.g. residential and commercial, the urban and
per-urban environment can be classified as being either developed (brownfield) or developing
(greenfield). As with different types of rural land use this is significant in terms of the type and
amount of pollutants generated i.e. pressures and threats. While land use type and development
stage are the main points of reference one or more of the following geographic divisions may also be
appropriate for condition assessment, monitoring, modelling and reporting purposes:
• The whole WQIP study area;
• Terrestrial areas;
• Waterways (freshwater, estuarine or marine);
• Basin, sub basin, catchment and sub catchment units; and
• Specific physical features e.g. escarpments.

Draft Black and Ross River Basins WQIP
Page 17
Marina Alberti, 2008
3.2 Issues and Development Stage
Water quality issues vary across catchments as a function of land use, management regime and the
level or stage of development. Issues associated with developed urban areas are significantly
different to those of developing areas and relatively undeveloped and rural areas.
In addition to an increase in pollutants in run off, the conversion of natural areas to urban land uses
alters the hydrology of sub catchments due to physical intervention, including the installation of
stormwater systems, and through an increase in impervious services i.e. less infiltration and more
stormwater run off. This increase in run-off and flow has implications for in-stream health as an
increase in bank and bed erosion may result (see Figure 3-1).
Figure 3-1 Hydrology Change Through Urbanisation
The variability of water quality issues also applies to rural areas where development is often
associated with land use transitions from a relatively natural state to more intensive production
systems. This change can be gradual with relatively low potential water quality impacts e.g. bushland
to grazing, or more sudden with potential for greater impacts as with conversion from bushland to
intensive agriculture. Management practices associated with each land use type, and development
activity, also have a critical role in the magnitude of water quality impacts.

Draft Black and Ross River Basins WQIP
Page 18
The different pressures and threats in both urban and rural areas require appropriate management
measures to address any associated water quality impacts. To assist with the definition of relevant
water quality issues and impacts, and the subsequent development of appropriate management
measures, land use has been aggregated into urban, peri-urban and rural groupings (see Table 3-1).
It is recognised that there will be areas that fall somewhere between urban and rural land uses i.e.
peri-urban. It is generally the peri-urban areas that are under the most pressure from the
intensification of land use i.e. urban expansion and development. This has been identified in the
functional state column where peri-urban constitutes the main proportion of the ‘Developing’
functional state.
Table 3-1 Land Use Divisions for Urban WQIP Purposes
Broad land use Principal land uses Functional state New land use
distribution
Developed/Operational
Urban
Residential - traditional
housing
Residential - high density
Commercial
Light industrial
Heavy industrial
Formal parks
Minimal Use
Natural areas
Urban
Peri-urban
Natural Areas
Minimal Use
Forestry
Rural residential
Grazing
Intensive agriculture
Mining/Quarrying
Developing
Peri-urban
Rural
Grazing
Natural Areas/Minimal Use
Forestry
Intensive agriculture
Mining/Quarrying
Dam catchment Developed/Operational Rural
Note: Developing includes change to a more intensive land use e.g. grazing to horticulture. The catchment area
of the Ross River Dam is classed as a separate land use as it requires special management attention to ensure
that existing land uses within the catchment do not compromise water quality of the urban water supply storage.
Appropriate management actions for water quality improvement will be based on the identified
threats to water quality (current and potential future) associated with the general land use divisions
described above and their associated water quality pollutants identified from existing literature and
the experience of stakeholders involved in the development of the Black/Ross WQIP. Additional
investigations are required for peri-urban areas.
Draft Black and Ross River Basins WQIP
Page 19
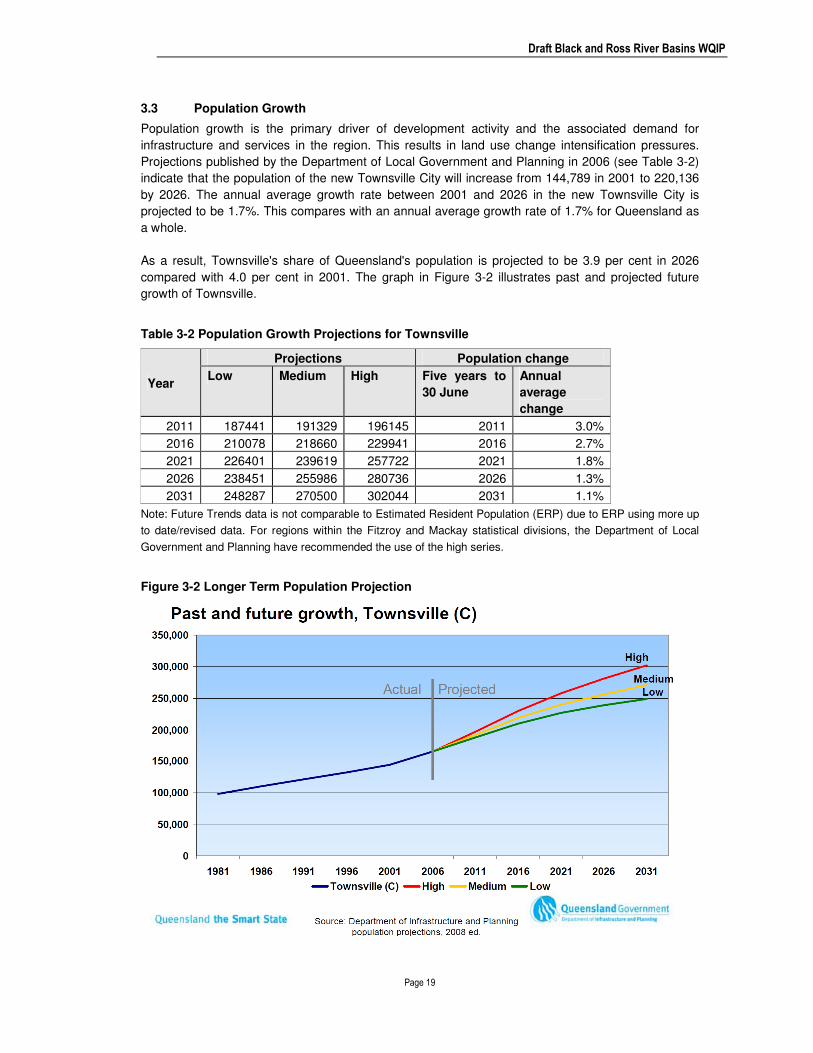
3.3 Population Growth
Population growth is the primary driver of development activity and the associated demand for
infrastructure and services in the region. This results in land use change intensification pressures.
Projections published by the Department of Local Government and Planning in 2006 (see Table 3-2)
indicate that the population of the new Townsville City will increase from 144,789 in 2001 to 220,136
by 2026. The annual average growth rate between 2001 and 2026 in the new Townsville City is
projected to be 1.7%. This compares with an annual average growth rate of 1.7% for Queensland as
a whole.
As a result, Townsville's share of Queensland's population is projected to be 3.9 per cent in 2026
compared with 4.0 per cent in 2001. The graph in Figure 3-2 illustrates past and projected future
growth of Townsville.
Table 3-2 Population Growth Projections for Townsville
Projections Population change
Year Low Medium High Five years to
30 June
Annual
average
change
2011 187441 191329 196145 2011 3.0%
2016 210078 218660 229941 2016 2.7%
2021 226401 239619 257722 2021 1.8%
2026 238451 255986 280736 2026 1.3%
2031 248287 270500 302044 2031 1.1%
Note: Future Trends data is not comparable to Estimated Resident Population (ERP) due to ERP using more up
to date/revised data. For regions within the Fitzroy and Mackay statistical divisions, the Department of Local
Government and Planning have recommended the use of the high series.
Figure 3-2 Longer Term Population Projection

Draft Black and Ross River Basins WQIP
Page 20
Notes: A 1.1% growth rate for the medium forecast was used to project the growth beyond the life of the current
Planning Scheme(s) i.e. beyond PIFU 2031 projections in Table 3-2. The current planning scheme(s) population
of 361,338 is achieved in 2057.
Population growth estimates used in the Black Ross WQIP have been generated using a population
growth model developed by TCC for the Townsville Strategic Road Network Planning process to
guide Councils twenty-year timeframe for capital works. The model uses population growth
projection figures from the Population Information and Forecasting Unit (PIFU) to generate
population increase estimates across the various planning scheme zones. These estimates were
then used to generate predicted land use extent in the modelling sub catchments used by Creek to
Coral to determine pollutant loads across a range of scenarios.
Predicted population growth was coupled with known dwelling occupancy rates, known and
anticipated urban expansion areas, planning scheme zonings, the Townsville-Thuringowa Strategy
Plan and land use mapping to produce population and development growth maps across the
following scenario horizons: 2005 (base case), 2012 (Wastewater upgrades), 2021 (achievable
management practice adoption timeframe) and 2045 (measurable water quality outcomes
timeframe).
Following the collation of this information a number of scenarios were examined using the
WaterCAST catchment model, principally for the urban and peri-urban catchments of the Black Ross
WQIP area. The scenarios were designed to predict the likely water quality outcomes, with and
without the proposed urban water quality improvement measures, and to help verify the need to
implement these actions to alleviate the impact of the anticipated population growth in the region.
Figure 3-3 Water Quality and Population Relationship
Note: This is not the final illustration. The concept will be adapted to include local load information
Draft Black and Ross River Basins WQIP
Page 21
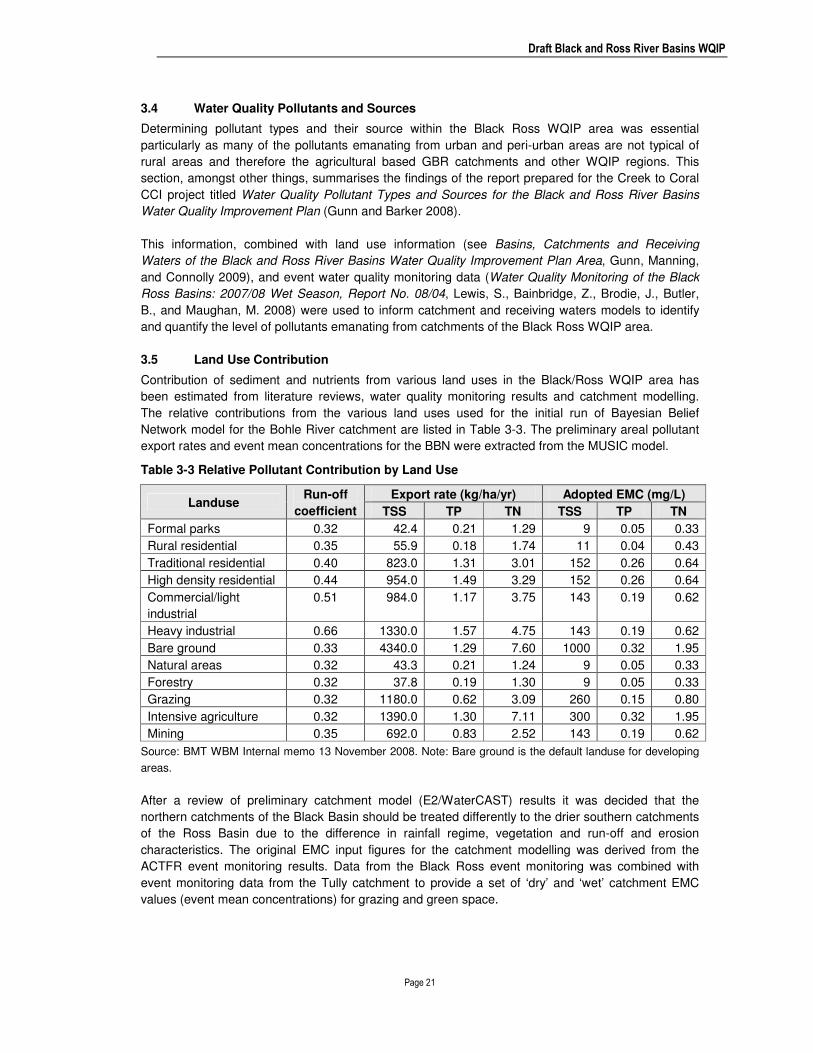
3.4 Water Quality Pollutants and Sources
Determining pollutant types and their source within the Black Ross WQIP area was essential
particularly as many of the pollutants emanating from urban and peri-urban areas are not typical of
rural areas and therefore the agricultural based GBR catchments and other WQIP regions. This
section, amongst other things, summarises the findings of the report prepared for the Creek to Coral
CCI project titled Water Quality Pollutant Types and Sources for the Black and Ross River Basins
Water Quality Improvement Plan (Gunn and Barker 2008).
This information, combined with land use information (see Basins, Catchments and Receiving
Waters of the Black and Ross River Basins Water Quality Improvement Plan Area, Gunn, Manning,
and Connolly 2009), and event water quality monitoring data (Water Quality Monitoring of the Black
Ross Basins: 2007/08 Wet Season, Report No. 08/04, Lewis, S., Bainbridge, Z., Brodie, J., Butler,
B., and Maughan, M. 2008) were used to inform catchment and receiving waters models to identify
and quantify the level of pollutants emanating from catchments of the Black Ross WQIP area.
3.5 Land Use Contribution
Contribution of sediment and nutrients from various land uses in the Black/Ross WQIP area has
been estimated from literature reviews, water quality monitoring results and catchment modelling.
The relative contributions from the various land uses used for the initial run of Bayesian Belief
Network model for the Bohle River catchment are listed in Table 3-3. The preliminary areal pollutant
export rates and event mean concentrations for the BBN were extracted from the MUSIC model.
Table 3-3 Relative Pollutant Contribution by Land Use
Export rate (kg/ha/yr) Adopted EMC (mg/L) Landuse
Run-off
coefficient TSS TP TN TSS TP TN
Formal parks 0.32 42.4 0.21 1.29 9 0.05 0.33
Rural residential 0.35 55.9 0.18 1.74 11 0.04 0.43
Traditional residential 0.40 823.0 1.31 3.01 152 0.26 0.64
High density residential 0.44 954.0 1.49 3.29 152 0.26 0.64
Commercial/light
industrial
0.51 984.0 1.17 3.75 143 0.19 0.62
Heavy industrial 0.66 1330.0 1.57 4.75 143 0.19 0.62
Bare ground 0.33 4340.0 1.29 7.60 1000 0.32 1.95
Natural areas 0.32 43.3 0.21 1.24 9 0.05 0.33
Forestry 0.32 37.8 0.19 1.30 9 0.05 0.33
Grazing 0.32 1180.0 0.62 3.09 260 0.15 0.80
Intensive agriculture 0.32 1390.0 1.30 7.11 300 0.32 1.95
Mining 0.35 692.0 0.83 2.52 143 0.19 0.62
Source: BMT WBM Internal memo 13 November 2008. Note: Bare ground is the default landuse for developing
areas.
After a review of preliminary catchment model (E2/WaterCAST) results it was decided that the
northern catchments of the Black Basin should be treated differently to the drier southern catchments
of the Ross Basin due to the difference in rainfall regime, vegetation and run-off and erosion
characteristics. The original EMC input figures for the catchment modelling was derived from the
ACTFR event monitoring results. Data from the Black Ross event monitoring was combined with
event monitoring data from the Tully catchment to provide a set of ‘dry’ and ‘wet’ catchment EMC
values (event mean concentrations) for grazing and green space.
Draft Black and Ross River Basins WQIP
Page 22
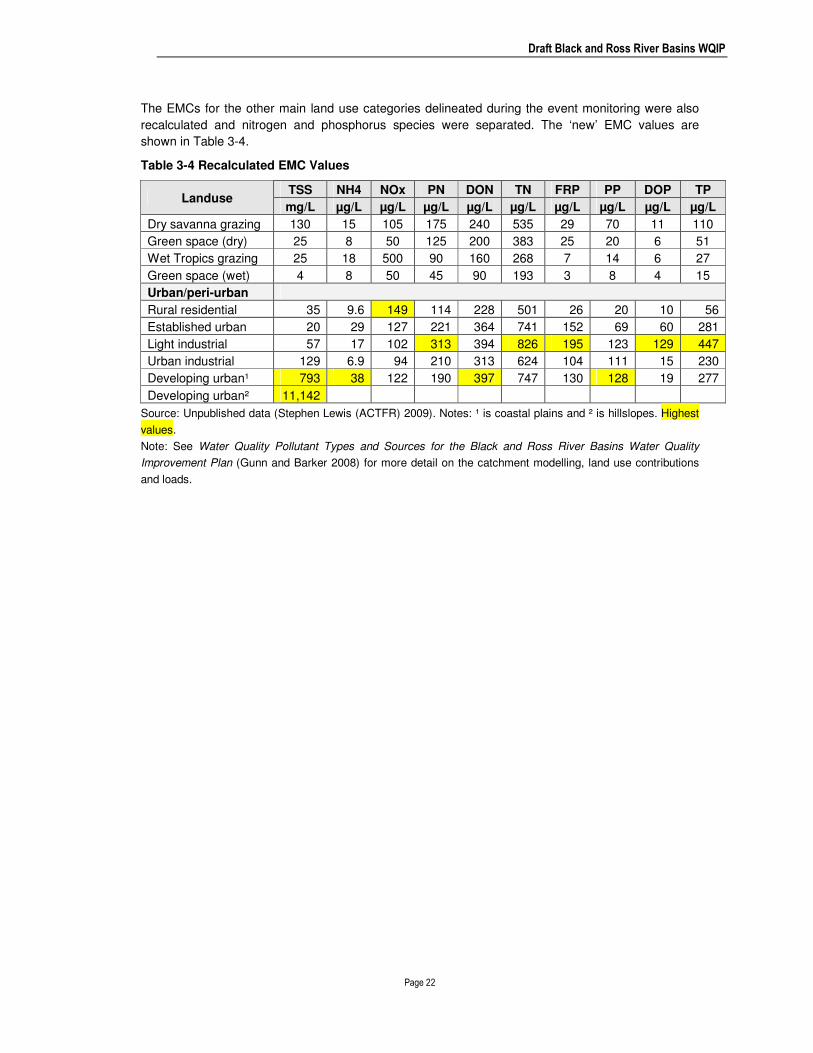
The EMCs for the other main land use categories delineated during the event monitoring were also
recalculated and nitrogen and phosphorus species were separated. The ‘new’ EMC values are
shown in Table 3-4.
Table 3-4 Recalculated EMC Values
TSS NH4 NOx PN DON TN FRP PP DOP TP Landuse
mg/L µg/L µg/L µg/L µg/L µg/L µg/L µg/L µg/L µg/L
Dry savanna grazing 130 15 105 175 240 535 29 70 11 110
Green space (dry) 25 8 50 125 200 383 25 20 6 51
Wet Tropics grazing 25 18 500 90 160 268 7 14 6 27
Green space (wet) 4 8 50 45 90 193 3 8 4 15
Urban/peri-urban
Rural residential 35 9.6 149 114 228 501 26 20 10 56
Established urban 20 29 127 221 364 741 152 69 60 281
Light industrial 57 17 102 313 394 826 195 123 129 447
Urban industrial 129 6.9 94 210 313 624 104 111 15 230
Developing urban¹ 793 38 122 190 397 747 130 128 19 277
Developing urban² 11,142
Source: Unpublished data (Stephen Lewis (ACTFR) 2009). Notes: ¹ is coastal plains and ² is hillslopes. Highest
values.
Note: See Water Quality Pollutant Types and Sources for the Black and Ross River Basins Water Quality
Improvement Plan (Gunn and Barker 2008) for more detail on the catchment modelling, land use contributions
and loads.
Draft Black and Ross River Basins WQIP
Page 23
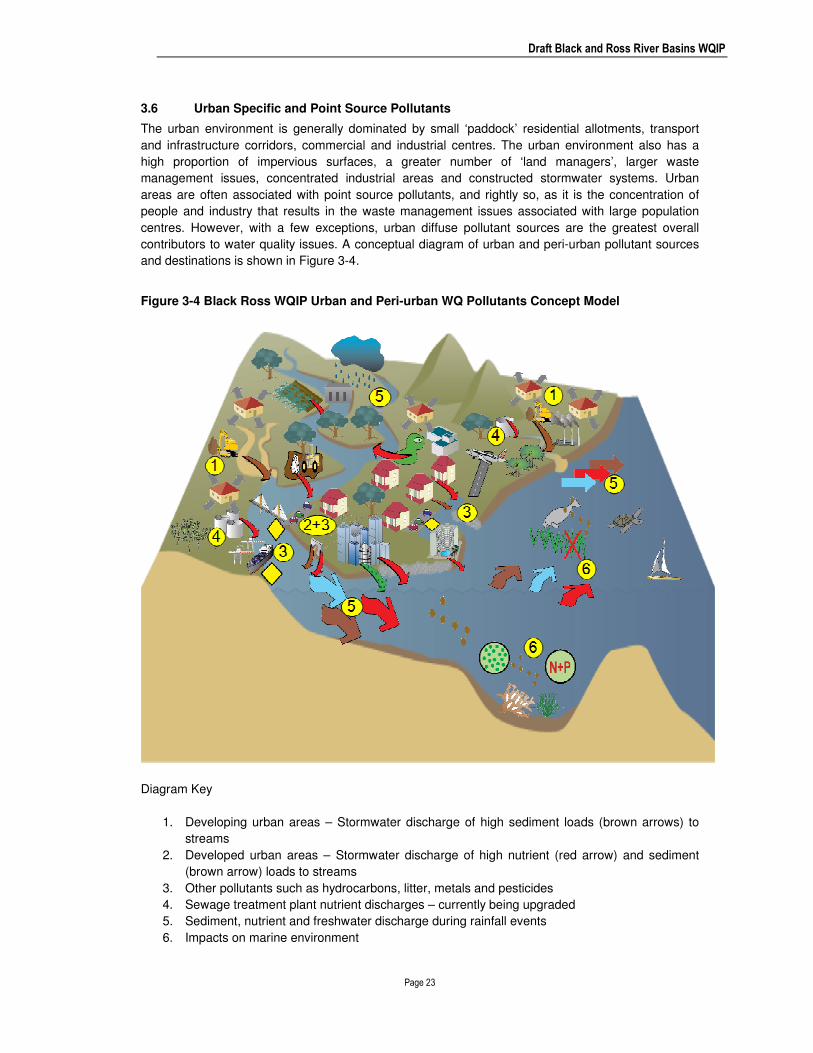
3.6 Urban Specific and Point Source Pollutants
The urban environment is generally dominated by small ‘paddock’ residential allotments, transport
and infrastructure corridors, commercial and industrial centres. The urban environment also has a
high proportion of impervious surfaces, a greater number of ‘land managers’, larger waste
management issues, concentrated industrial areas and constructed stormwater systems. Urban
areas are often associated with point source pollutants, and rightly so, as it is the concentration of
people and industry that results in the waste management issues associated with large population
centres. However, with a few exceptions, urban diffuse pollutant sources are the greatest overall
contributors to water quality issues. A conceptual diagram of urban and peri-urban pollutant sources
and destinations is shown in Figure 3-4.
Figure 3-4 Black Ross WQIP Urban and Peri-urban WQ Pollutants Concept Model
Diagram Key
1. Developing urban areas – Stormwater discharge of high sediment loads (brown arrows) to
streams
2. Developed urban areas – Stormwater discharge of high nutrient (red arrow) and sediment
(brown arrow) loads to streams
3. Other pollutants such as hydrocarbons, litter, metals and pesticides
4. Sewage treatment plant nutrient discharges – currently being upgraded
5. Sediment, nutrient and freshwater discharge during rainfall events
6. Impacts on marine environment

Draft Black and Ross River Basins WQIP
Page 24
3.6.1 Point sources and industry
Point source pollution is easily identified as it involves intensive land use in a relatively small area,
usually involving an industrial activity. The pollutants, generally waste products, are discharged from
the facility at a specific point or points e.g. pipe or chimney, hence the term point source discharge.
The main point source pollutant emitters in Townsville have been identified and described detail in
the Water Quality Pollutant Types and Sources report (Gunn and Barker 2008). The locations of
point source pollutant emitters in the Black Ross WQIP area are illustrated Figure 3-5.
Figure 3-5 Air, Land and Water Point Source Emitters
The only significant point source pollutant emitters identified in terms of water quality impacts in the
Townsville region were the wastewater treatment plants as most of them discharge direct to
receiving waters. Other industrial activities generally emitted pollutants to air or land (contained) and
as such did not have a direct and measurable impact on water quality. The emissions to air were
taken into account as diffuse sources of pollution and are considered in the section on atmospheric
deposition (see section 3.10).
Current average annual point source pollutant contributions, from wastewater/sewage treatment
plants (STPs), have been estimated and are shown in Table 3-5. The percentage contribution from
point sources will vary from year to year depending on rainfall, run off and subsequent river flow. By
contrast discharge volumes from STPs remain relatively constant, with predictable incremental
increases associated with population growth.

Draft Black and Ross River Basins WQIP
Page 25
Table 3-5 Point Source Pollutant Load Contributions
Receiving
Waters
Facilities Total N
(t/yr)
% Total P
(t/yr)
%
Bohle River Condon, Deeragun, Mt St John 131 ~60% 21 ~50%
Black River Mt Low 1.9 ~3% 1.3 ~8%
Cleveland Bay¹ Cleveland Bay 126 ~40% 40 ~63%
Note: Percentage is the proportional average annual contribution to the end of catchment load from point
sources. ¹Cleveland Bay was calculated by adding the discharge loads for the Ross River, Stuart / Sandfly
Creeks (estimate) and Alligator Creek and expressing the point source input as a proportion of the aggregated
loads i.e. point source load divided by the combined waterway loads plus the point source load, to give a
Cleveland Bay receiving waters load contribution rather than end of catchment. This has since been
recalculated using Stuart Creek sub basin discharge figures provided from modelling results (see Table 5-13).
Cleveland Bay load contribution based on average 2004 to 2006 discharge figures.
Table 3-6 Comparison of Cleveland Bay STP Contribution Pre and Post Upgrade
Nutrient/Year Alligator Stuart Ross CBay STP Total Percentage
TN 2006/07 (Pre) 9,440 6,560 173,000 126,000 315,000 40
TN 2007/08
(Post)
9,440 4,300 149,700 27,300 190,740 14
TP 2006/07 (Pre) 1,540 960 20,800 40,000 63,300 63
TP 2007/08
(Post)
1,540 940 22,300 5,900 30,680 19
Source: Lewis et al 2008 and BMT WBM initial modelling results
The wastewater treatment plants servicing Townsville are being progressively upgraded over the
next three years to provide capacity for the expected population growth up to 2025 (Maunsell
Australia 2008). These upgrades will result in significant reductions in the nutrient concentration and
loads (at current population levels) being discharged to receiving waters. Upgrade of the Cleveland
Bay plant has been completed and this is reflected in the nutrient load reduction as illustrated in
Table 3-6.
However, with the expected population increases the amount of wastewater requiring treatment also
increases. Regardless of the improved efficiency of treatment plants and nutrient concentration
reductions this will inevitably result in increased nutrient loads as additional volumes of wastewater is
treated and subsequently released from the STPs. Alternative options to the release of treated
wastewater to receiving waters need to be implemented if this significant source of nutrients is to be
adequately addressed in the longer term e.g. water reuse over land.
There are no other significant industrial (point source) activities that have been identified as
adversely impacting water quality in the Black/Ross WQIP area.

Draft Black and Ross River Basins WQIP
Page 26
3.7 Urban Diffuse
Principal pollutants of urban areas are; sediments, nutrients (principally nitrogen and phosphorus),
oxygen demanding materials (biodegradable organic material), metals, toxic organic wastes (garden
and household chemicals), pathogenic micro-organisms (bacteria, viruses etc), hydrocarbons and
litter.
Some pollutants can be carried relatively long distances by wind and rain before being deposited
(distributed sources) while others have local origins. Some of the more significant local sources of
pollutants in developed areas are associated with motor vehicles and roadways. The main urban
diffuse pollutants are listed in Table 3-7.
Table 3-7 Urban Diffuse Water Quality Pollutants
Local Sources Water Quality Issue
Leaf litter, grass clippings and other vegetation BOD, N, P
Dog and other domesticated animal faeces P, N, BOD, biological
pathogens
Pesticides, herbicides and fertilisers Pesticide, N, P
Sewer overflows N, P, biological pathogens
Sewer outlets illegally connected to stormwater systems N, P, biological pathogens
Septic tank leakage N, P, biological pathogens
Leakage and spillage of materials from; vehicles, storage tanks
and bins
Hydrocarbons, chemicals,
litter
Seepage from land fill waste disposal sites Metals, biological pathogens
Waste water from cleaning operations Hydrocarbons, chemicals, P
Corrosion of roofing and other metallic materials Metals
Industrial emissions PM, NO2, SO2, NH4
Vehicle emissions PM, NO2,
Vehicle component wear e.g. tyres and brakes PM, metals
Wear of road surfaces PM, metals, hydrocarbons
Erosion from construction activity and vegetation removal SS, P, N
Litter – plastic, glass and metal containers, plastic, foam etc Gross pollutants
Ash and smoke from fires PM, nutrients, VOC, metals
Windblown pollen, insects and micro-organisms PM, N, P, VOC
Notes: BOD is biochemical oxygen demand, P is phosphorus, N is nitrogen, PM is particulate matter, SS is
suspended solids, NO2 is nitrogen dioxide, VOC is volatile organic compounds, SO2 is sulphur dioxide, NH4 is
ammonia.
It should be noted that the majority of the pollutants listed are associated with developed urban
areas. The main local source of pollutants from developing areas is listed as “Erosion from
construction activity and vegetation removal”. Additional information on the main groupings of urban
pollutants is provided in the sections below.
3.7.1 Sediment
Sediment generated from developed urban areas is relatively low and, depending on how figures
have been calculated, can be comparable to natural areas. Sediment (total suspended solids)
generation from developing areas however, is at the other end of the spectrum. This is graphically
illustrated in Figure 3-6. As can be seen the sediment concentration from developing areas is
significantly higher per hectare than for any other land use.

Draft Black and Ross River Basins WQIP
Page 27
Figure 3-6 Relative Concentrations of Sediment by Land Use
3.7.2 Nutrients
Nutrient concentrations in stormwater from developed urban areas are generally less than
concentrations from areas of intensive agriculture and are significantly greater than from forested
catchments (phosphorus is two to ten times greater) and undeveloped catchments (nitrogen is two to
five times greater). There are a number of sources of nutrients in developed urban areas (see Table
3-7) with initial analysis of water quality monitoring showing urban and light industrial areas being
higher contributors of nutrients than non-urban land uses. Relative land use concentrations of total
phosphorus and total nitrogen are illustrated in Figure 3-7.
Figure 3-7 Relative Nutrient Concentrations by Land Use (µg/L)

Draft Black and Ross River Basins WQIP
Page 28
Nutrient concentrations generated from developing areas can be as high as those from intensive
agriculture (see Table 3-3) due in part to activities associated with development such as vegetation
removal and soil disturbance. This disturbance can lead to higher erosion rates and the mobilisation
of near surface nutrient stores in the soils with potential for transport of the nutrients to waterways in
both particulate and soluble forms.
3.7.3 Metals
Heavy metals are often found to be more highly concentrated in urban areas than in rural areas, as a
result of higher densities of source emissions such as wear of tyres and brakes, vehicle emissions,
road and pavement degradation, water pipes, roof corrosion and industrial activity e.g. spillages and
dust from the handling of metal ores at Townsville Port. Metals (Cadmium, Chromium, Copper,
Nickel, Lead, Zinc) and their compounds are therefore a potential pollutant issue in the Black Ross
WQIP area. Excessive levels of metals can be toxic to aquatic organisms and can bioaccumulate
and be passed along the food chain. Metals are known to accumulate in sediments and can be
remobilised and return to the water column under certain conditions.
3.7.4 Hydrocarbons (Fossil fuels, oil and grease)
Hydrocarbons are generally liquid fuels and oils e.g. diesel and petroleum, however there is a wide
range of hydrocarbons in everyday use e.g. cleaning fluids. Many are highly volatile and readily
evaporate when exposed to air. Hydrocarbons with higher oil content are more likely to persist in the
environment. Hydrocarbon derivatives stem from oil and grease used in lubricants, protective
coatings, combustible fuels and detergents.
Spills of such oils can exceed recommended levels and result in short term toxicity. Further,
surfactants found in detergents can impact on aquatic flora and fauna by damaging biological
membranes. Excessive hydrocarbons can result in smothering of aquatic habitats. They can also
increase morbidity and mortality in freshwater species, and impact upon reproductive cycles.
3.7.5 Other chemicals
Detergents, acids and other chemicals used in the urban environment can contribute to water quality
issues especially when they are used on impervious surfaces and are washed directly into urban
stormwater systems. While most chemicals do not enter waterways in large enough quantities to
have an impact chemicals that add to the load of other pollutants are a water quality issue e.g.
phosphates in detergents.
3.7.6 Gross pollutants
Gross pollutants are relatively large pieces of debris flushed through urban catchments and
stormwater systems. Gross pollutants include plastics and other packaging, garden waste (lawn
clippings, leaves and other plant material) and coarse sediment. While the litter component of gross
pollutants is an aesthetic water quality detractor there can also be deleterious impacts on aquatic
animals from plastic litter in waterways through ingestion and entanglement. Organic material i.e.
leaves, twigs and grass clippings, constitute the largest proportion of gross pollutant load (by mass)
carried by urban stormwater. Organic gross pollutants can lead to oxygen depletion during
decomposition (biochemical oxygen demand - BOD), and also release nutrients, albeit relatively
slowly.
If unmanaged gross pollutants also have the potential to obstruct stormwater systems and contribute
to localised flooding.

Draft Black and Ross River Basins WQIP
Page 29
3.8 Peri-urban Diffuse
While the peri-urban land use area has not been extensively investigated it is recognised as an
important landscape component being the transition zone between rural and urban areas. Peri-urban
areas are typified by ‘small’ rural blocks, industry located away from mainstream urban areas e.g.
quarries, and outlier or ‘village’ communities. The peri-urban land use area is where the majority of
development takes place and as such is a principal source of ‘intensive’ short term diffuse pollutants
as well as the normal range of rural pollutants.
Given the larger number of properties and land managers per unit area compared to rural areas, it is
likely that the pollutant output from peri-urban areas is greater than that for rural areas on a per unit
area basis. Further work is required to determine the relationship between peri-urban areas and
pollutant outputs. A preliminary map of peri-urban areas is provided in Figure 3-8.
Figure 3-8 Draft Peri-urban Landuse Extent
3.9 Diffuse Source Pollutants - Rural
Diffuse source pollutants are those that cannot be identified as emanating from a particular point e.g.
pipe or chimney stack. In terms of water quality, air quality pollutants emanating from a chimney
stack, or similar, are considered to be diffuse source pollutants as they are dispersed through the
atmosphere and may eventually settle on land and water surfaces.

Draft Black and Ross River Basins WQIP
Page 30
Typical diffuse source pollutants include sediment, nutrients (nitrogen and phosphorus) and
pesticides, which are eroded and/or collected from land surfaces, typically in rainfall run-off, and
carried to receiving waters e.g. streams, lakes, reservoirs and wetlands. In terms of catchment scale
modelling this diffuse source is classed as hillslope erosion with gully erosion and streambank
erosion being the other sources of pollutants contributing to total pollutant loads. Small quantities of
diffuse source pollutants are also transported by wind.
Movement of sediment and nutrients in rainfall run-off is a normal component of natural weathering
and erosion processes. Additional inputs of bioavailable/soluble nutrients combined with land
disturbance and inappropriate management practices often results in accelerated run off and erosion
rates and the subsequent transport of sediment and nutrients to receiving waters, well above normal
background levels. It is the delivery of sediment and nutrients to receiving waters at elevated levels
(and for nutrients in forms that are bioavailable) that creates threats to aquatic habitats and
biodiversity and, in some cases, human health.
Pesticides are an input not measured against natural background levels. Inappropriate management
practices, increased stormwater run off and accelerated erosion rates also affect the amount of
pesticides reaching receiving waters. Pesticides that do not remain in the place they were intended
for become a water quality threat with a range of impacts depending on the pesticide type and
concentration.
Rural land uses are generally grouped into minimal use/conservation, grazing and intensive
agriculture. Intensive agriculture is often subdivided by crop type and irrigated versus dryland.
Sediment, nutrients and pesticides are the main diffuse source pollutants emanating from the rural
environment. These pollutants and their sources, as identified for the Burdekin WQIP, are listed in
Table 3-8.
Table 3-8 Main Pollutants and Sources
Pollutant Source Rating Notes
Nutrients
Nitrate (NO3) Fertiliser 5 Low natural levels
Ammonia (NH4) Fertiliser 2 Low natural levels
DON Fertiliser 2 Moderate natural levels, slow turnover
PN Fertiliser and erosion 4 Moderate natural levels, loss to sediments
Phosphate (PO4) Fertiliser, salt licks 2 Low natural levels
DOP Fertiliser 1 Moderate natural levels, slow turnover
PP Fertiliser and erosion 3 Moderate natural levels, loss to sediments
Silicate (Si(OH)4) Erosion 0
Sewage STP discharge,
septics
5 Contains all N, P forms at high levels
Suspended sediment
Coarse (>63 µm) Erosion 0 No likely impact, forms delta fans
Medium (2-63 µm) Erosion 2 Carried only short distance
Fine (< 2µm) Erosion 4 Carried widely over shelf, especially after
dry year
Source: Mitchell et al 2007 (p.7) Note: Suspended sediment varies between sub-catchments and is greatly
increased by grazing. Urban specific sources, other than STPs, have not been included as there are a variety of
chemicals that may contribute to N and P levels but there is little water quality monitoring evidence available for
Townsville to be specific. Rating is potential threat posed by the pollutant where 5 is greatest threat and 0 is no
threat.

Draft Black and Ross River Basins WQIP
Page 31
In addition to sediment, nutrients and pesticides a range of pollutant groupings relevant to rural areas
were identified by Mitchell et al (2007)(see Table 3-9).
Table 3-9 Other Rural Pollutants
Pollutant
Group
Specific Pollutant and Comments
DO reducing
materials
(organic
material)
Sucrose, dunder, mill effluent – are products of sugar cane production and are limited
to the Lower Burdekin. Manure principally from cattle grazing. Sewage from urban
areas. Plant litter occurs naturally and is increased as by products of intensive
agriculture and urban park and garden maintenance
Herbicides Diuron, Atrazine, Ametryn, Hexazinone and 2,4-D are principally used in the sugar
industry. Simazine used in forestry. Tebuthiuron used in grazing industry. Glyphosate
and paraquat used broadly in sugar cane, horticulture and urban areas
Insecticides Organochlorines e.g. endosulfan, and a variety of others are used principally in
horticulture and to a lesser extent sugar cane and the urban setting. Chlorpyrifos
used in sugar cane for cane grubs
Fungicides Methoyetholmercuric chloride (MEMC) used in the sugar industry
Non insecticide
organochlorines
PCB’s from industry (reduced use but residues may persist) and Dioxins from
agriculture and industry
PAH’s (polcyclic aromatic hydrocarbons) from cane firing, forest fires and oil spills
Heavy metals Cadmium and potassium from fertiliser and mercury from fungicide. Other trace
elements
Oil or
hydrocarbons
Primarily from liquid fossil fuels and oil spills
Salinity Both dryland and irrigation salinity resulting from land clearing (dryland) and irrigation
activities
Antifoulants Used primarily in the fishing industry at mooring sites (TBT now banned)
Acid Principally associated with disturbance of acid sulphate soils
Source: Mitchell et al 2007, pp.7-8
3.10 Atmospheric Deposition
The principal pollutants by volume associated with atmospheric deposition are particulate matter and
oxides of nitrogen. Background deposition levels of both these pollutants are not known specifically
for the Townsville area and current air quality monitoring is principally associated with airborne
concentrations as a function of human health. Contributions from atmospheric deposition of both
particulate matter and oxides of nitrogen are a combination of natural background levels and any
additional contributions from human sources.
An estimate of average atmospheric deposition of particulate matter (PM10) from all sources for the
Townsville urban footprint (250 square kilometres) is 15 kg/ha/year (equivalent to a depth of 0.0015
millimetres). The average annual contribution of particulate matter from atmospheric deposition to
the sediment load of waterways in the Black Ross WQIP area is considered to be minimal across the
region although it may be locally significant, in relative terms, in the vicinity of industrial sites such as
loading facilities at Townsville Port.
The main source of nitrogen dioxide (NO2) is a by-product of the combustion of fossil fuels from
industrial facilities and motor vehicles. Background levels of atmospheric nitrogen deposition are in
the order of 2-3 kg/ha/year. Potential deposition of NO2 from human sources is estimated to be
approximately 5-6 kg/ha/year in the urban footprint, to give a total NO2 deposition of 8 kg/ha/yr. This
is considered to be a significant overestimate as the atmospheric deposition rate has been
overestimated and there has been no attempt to convert NO2 mass to N mass.

Draft Black and Ross River Basins WQIP
Page 32
There are two components to atmospheric deposition i.e. direct deposition to water and deposition to
land. Deposition to land becomes a potential component of run-off from different land uses while
deposition to water is a direct contribution. Deposition to water has been calculated by determining
the area of water in each catchment and multiplying this by the deposition rate to give a load that can
be used to determine the overall contribution in terms of end of catchment loads. The results by sub
basin and/or catchment are displayed in Table 3-10. The elevated deposition rates for the urban
footprint have only been applied to the lower Ross, Bohle and Stuart Creek sub basins. ACTFR
event water quality monitoring end of catchment load estimates were used to calculate atmospheric
deposition load contributions.
Table 3-10 Estimated Atmospheric Deposition Contributions to Main Catchments
Sub basin River
(ha)
Water
(ha)
PM10
(kg)
% TN (kg) % TP (kg) %
Crystal Creek 61 268 [1] 2,144 536 54
Rollingstone
Ck
10 110 [0.5]
880
220
22
Bluewater Ck 58 426 [1.5] 3,408 0.17 852 5.68 85 7.10
Black River 343 513 [1.7] 4,104 0.01 1,026 1.37 103 0.64
Bohle River 16 532 [1.7] 7,980 0.03 2,128 2.66 213 0.89
Ross River
(btd)
91 754 [5.6]
11,310 3,016
302
Ross River
(atd)
27 4,372
[5.8] 34,976 8,744
874
Ross River 118 5,126 [6] 46,286 0.31 11,760 7.84 1,176 5.6
Stuart Creek 0 1,047 [10] 15,705 4,188 419
Alligator
Creek
43 1,798
[6.8] 14,384
2.40
3,596 39.96 360 23.97
Magnetic
Island
0 0
Totals 649 9,820 94,891 24,306 2,431
Notes: The Water primary land use category was used to determine the area for calculating atmospheric
deposition contributions to water. The Water primary land use category includes the secondary land use
categories; Marsh/wetland, River, Channel/aqueduct and Reservoir/dam.
Atmospheric deposition rates used: Urban footprint - PM10 15 kg/ha/year, N 4kg/ha/yr (2kg/ha/yr background
and 2kg/ha/yr anthropogenic), and P 0.4 kg/ha/year (equivalent to double the figure from a South Australian
study). Non-urban footprint - PM10 8 kg/ha/year, N 2kg/ha/yr and P 0.2 kg/ha/year.
For Ross River bdt is below the dam and atd is above the dam. These were added to provide figures for the
whole Ross River catchment. % is percentage contribution. In the Water column the figures in square brackets
indicate the percentage of the sub basin comprised of the Water land use category. End of river load figures to
calculate % contributions were sourced from ACTFR event monitoring data and initial results of the modelling
prepared by BMT WBM.
There is considerable variation in the percentage contribution from atmospheric deposition to water
across the sub basins. The Alligator Creek figures are significantly different to the other sub basins
even allowing for the high percentage of water land use within the sub basin. Atmospheric deposition
contributions were recalculated using preliminary end of catchment load estimates from WaterCAST
modelling (see Table 3-11). Most atmospheric deposition percentage contributions were significantly
lower using the modelled EOC loads showing the sensitivity of the calculations to EOC load and river
flow estimates.

Draft Black and Ross River Basins WQIP
Page 33
Table 3-11 Atmospheric Deposition Contributions Using Modelled EOC Loads
Sub basin River
(ha)
Water (ha) PM10
(kg)
% TN (kg) % TP (kg) %
Crystal Creek 61 268 [1] 2,144 0.02 536 0.37 54 0.26
Rollingstone Ck 10 110 [0.5] 880 0.02 220 0.30 22 0.23
Bluewater Ck 58 426 [1.5] 3,408 0.02 852 0.81 85 0.55
Black River 343 513 [1.7] 4,104 0.03 1,026 1.25 103 0.85
Bohle River 16 532 [1.7] 7,980 0.06 2,128 2.18 213 1.30
Ross River (btd) 91 754 [5.6] 11,310 0.26 3,016 7.27 302 3.75
Ross River (atd) 27 4,372 [5.8] 34,976 8,744 874
Ross River 118 5,126 [6] 46,286 (0.31) 11,760 (7.84) 1,176 (5.6)
Stuart Creek 0 1,047 [10] 15,705 0.87 4,188 19.70 419 13.44
Alligator Ck 43 1,798 [6.8] 14,384 1.23 3,596 7.93 360 7.07
Magnetic Island 0 0
Totals 649 9,820 94,891 0.14 24,306 3.90 2,431 2.63
Notes: Atmospheric deposition rates used: Urban footprint - PM10 15 kg/ha/year, N 4kg/ha/yr (2kg/ha/yr
background and 2kg/ha/yr anthropogenic), and P 0.4 kg/ha/year (equivalent to double the figure from a South
Australian study).
Non-urban footprint - PM10 8 kg/ha/year, N 2kg/ha/yr and P 0.2 kg/ha/year.
End of river load figures to calculate % contributions were sourced from initial results of the modelling prepared
by BMT WBM. Percentages in brackets for Ross River are taken from Table 3-10.
From the information assessed in the Water Quality Pollutant Types and Sources report (Gunn and
Barker 2008) atmospheric deposition of sediment, phosphorus, heavy metals, pesticides and sulphur
dioxide is not found to contribute measurably to water quality issues. This is confirmed in Table 3-11
with the exception of Stuart Creek and Alligator Creek for phosphorus.
The atmospheric deposition contribution of nitrogen was also elevated for Ross River, Alligator
Creek and Stuart Creek. As phosphorus levels were also elevated for the same waterways these
figures may be anomalies associated with load and flow calculations and is not an accurate measure
of actual deposition rates. The calculated atmospheric deposition figures need to be tested to
determine whether they are plausible.
3.11 Climate Change
Creek to Coral commissioned local sustainability consultant SEA O2 to compile a report on the
potential impacts of climate change in Townsville on water quality to inform the WQIP. While
collating information for the report it was recognised that climate models had not been run
specifically for the Townsville region. Townsville is part of the Dry Tropics and has a significantly
different climate regime to neighbouring regions i.e. Wet Tropics (north) and Central Queensland
Coast (south), and other parts of Australia. Subsequently, Creek to Coral commissioned CSIRO to
run a climate model specific to Townsville (Climate Change Projections for the Townsville Region.
The CSIRO climate change projections are presented as 10th, 50th and 90th percentile units,
reflecting the uncertainty inherent in global climate modeling. While the 10th and 90th percentiles
give an indication of the range of uncertainty contained in the projections, the 50th percentile, or
central estimate, can be taken as the most likely scenario based on current knowledge. The climate
change projections for Townsville in the years 2030 and 2070 were developed by CSIRO for the
following features:
Draft Black and Ross River Basins WQIP
Page 34
� Mean Temperature;
� Number of days over 35º C;
� Precipitation;
� Potential evapo-transpiration;
� Wind speed;
� Relative humidity;
� Fire risk;
� Solar radiation;
� Sea surface temperature and sea level rise.
The SEA O2 report considers how climate change scenarios are developed then reviews the results
of the climate change model run by the CSIRO specifically for the Townsville region. Using these
results a qualitative assessment of the potential impacts on local water quality was made.
As with the overall impacts of global warming on climate change the exact impacts of climate change
on water quality are uncertain. It has been possible to identify a range of factors associated with
climate change, which could impact water quality. Quantifying the water quality impacts with any
level of certainty will, however, require further research and/or modelling.
Key drivers for changes to water quality as a result of climate change are primarily indirect and are
associated with changes to the physical condition and structure of vegetation and vegetation
communities with potential corresponding changes in soil erosion rates. Direct impacts could include
an increase in the temperature of water bodies due to increases in average temperatures and
extreme daily temperatures i.e. number of days with temperatures over 35 degrees Celsius, and sea
level rise altering fresh water coastal wetlands to brackish or salt water.
What we can conclude from the short-term projections about climate change in Townsville is that
there is unlikely to be any significant direct or indirect impacts on water quality during the term of the
Water Quality Improvement Plan (WQIP). This conclusion is based on the fact that there will only be
minor climatic variations, which will not have significant broadscale impacts on the distribution or
structure of vegetation through direct association i.e. reduced rainfall and increased temperatures, or
through indirect means e.g. increased fire weather. Therefore the main factor impacting water
quality, erosion and sedimentation, is unlikely to increase.

Draft Black and Ross River Basins WQIP
Page 35
4. Catchment Condition and Environmental Values
4.1 State of the Black/Ross Basins
Two primary studies have been undertaken to determine the current condition of the Black and Ross
River Basins and these have been included in a synthesis document i.e. Basins, Sub Basins,
Catchments and Receiving Waters Background Report (Gunn, Manning and Connolly 2009).
4.1.1 Condition of Receiving Waters
A study was undertaken by Connell Wagner to collate available water quality data for the study area
and provide a report on the condition of the waterways with reference to the data collected. The
report has been used to provide an indicative current condition figure (or assumed current condition
for dated water quality data) as part of the development of water quality objectives and targets for the
freshwaters of the Black/Ross WQIP area. A discussion on the condition of marine waters is
provided in the catchments background report mentioned above (Gunn, Manning and Connolly
2009).
4.1.2 Catchment Condition
Catchment condition is more difficult to measure due to the number of variables. The two main
variables chosen, which are relatively easy to measure, are land use and riparian condition. C and R
Consulting prepared a riparian condition report (2 stages) to provide an overview of the current state
of the vegetation in the riparian zones of the main waterways in the Black and Ross River Basins.
Land use information for the Black/Ross WQIP was updated by Creek to Coral using aerial
photography, SPOT imagery and local knowledge of the area. The combined land use and riparian
condition assessment was used to determine the current catchment condition and this was then
cross referenced with the water quality condition report and environmental values results to
determine priority catchments for water quality improvement activities.
4.2 Determining Environmental Values
The National Water Quality Management Strategy (NWQMS) provides a framework for protecting
and enhancing the quality of the nation’s waters. The framework includes the determination of
environmental values of waterways and waterbodies as a starting point to establish the level of
protection required.
A simplified diagram of the NWQMS framework used in this WQIP is shown in Figure 4-1.
Figure 4-1 Environmental Values in the NWQMS Framework
Water quality improvement actions
Targets
Water quality objectives
Environmental values
Background information
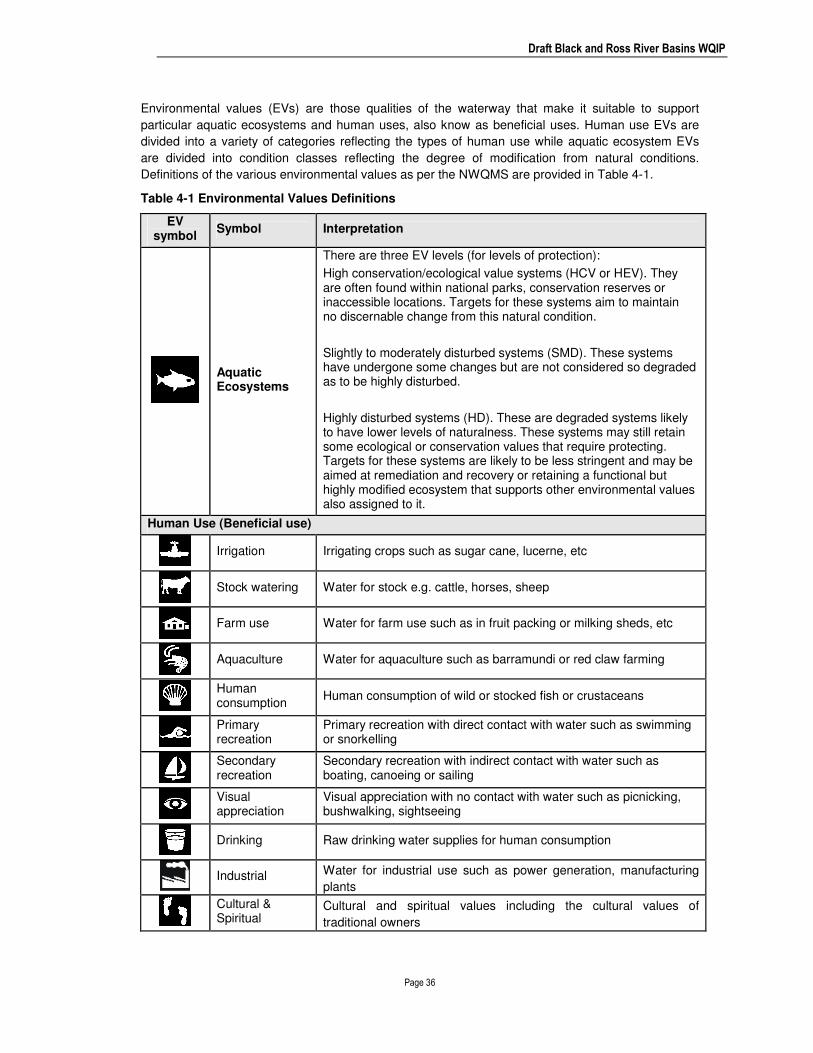
Draft Black and Ross River Basins WQIP
Page 36
Environmental values (EVs) are those qualities of the waterway that make it suitable to support
particular aquatic ecosystems and human uses, also know as beneficial uses. Human use EVs are
divided into a variety of categories reflecting the types of human use while aquatic ecosystem EVs
are divided into condition classes reflecting the degree of modification from natural conditions.
Definitions of the various environmental values as per the NWQMS are provided in Table 4-1.
Table 4-1 Environmental Values Definitions
EV symbol
Symbol Interpretation
Aquatic Ecosystems
There are three EV levels (for levels of protection):
High conservation/ecological value systems (HCV or HEV). They are often found within national parks, conservation reserves or inaccessible locations. Targets for these systems aim to maintain no discernable change from this natural condition.
Slightly to moderately disturbed systems (SMD). These systems have undergone some changes but are not considered so degraded as to be highly disturbed.
Highly disturbed systems (HD). These are degraded systems likely to have lower levels of naturalness. These systems may still retain some ecological or conservation values that require protecting. Targets for these systems are likely to be less stringent and may be aimed at remediation and recovery or retaining a functional but highly modified ecosystem that supports other environmental values also assigned to it.
Human Use (Beneficial use)
Irrigation Irrigating crops such as sugar cane, lucerne, etc
Stock watering Water for stock e.g. cattle, horses, sheep
Farm use Water for farm use such as in fruit packing or milking sheds, etc
Aquaculture Water for aquaculture such as barramundi or red claw farming
Human consumption
Human consumption of wild or stocked fish or crustaceans
Primary recreation
Primary recreation with direct contact with water such as swimming or snorkelling
Secondary recreation
Secondary recreation with indirect contact with water such as boating, canoeing or sailing
Visual appreciation
Visual appreciation with no contact with water such as picnicking, bushwalking, sightseeing
Drinking Raw drinking water supplies for human consumption
Industrial Water for industrial use such as power generation, manufacturing
plants
Cultural & Spiritual
Cultural and spiritual values including the cultural values of
traditional owners

Draft Black and Ross River Basins WQIP
Page 37
4.3 Science and Community Consultation
Compilation of background information for determination of environmental values for the Black/Ross
WQIP was done separately for aquatic ecosystems and human use before taking the information to
community workshops.
Creek to Coral partners, Queensland Environmental Protection Agency (EPA) and the Great Barrier
Reef Marine Park Authority (GBRMPA), took the lead role in collating the background information to
determine a preliminary set of aquatic ecosystem high ecological value (HEV) areas for discussion,
and produced the associated mapping.
After the initial compilation of information an expert panel workshop was held (12 October 2007) for
the freshwater areas of the Black Ross WQIP area to review the concepts and draft information. A
similar workshop was held for the estuarine and marine areas, in conjunction with the Burdekin
WQIP team, for the Black Ross WQIP and Burdekin WQIP in March 2008.
The results of both workshops, including possible changes to HEV waters and identification of
natural assets in modified systems, were compiled by the EPA and formed the basis for the
suggested high ecological value (HEV) areas to be taken to the community workshops.
An information report and draft set of human use environmental values was prepared by Creek to
Coral as background for the community consultation workshops through:
• An initial questionnaire sent out to selected stakeholders. The results were collated and used
as the starting point for the information report on human uses;
• A desktop study using a variety of public domain information sources. In some cases
individuals were also consulted to clarify or source information; and
• Water extraction licence information provided by the Department of Natural Resources and
Water. This information was used to collate human uses for the waterways in the vicinity of
the licenced property based on the purpose noted for the extraction licence.
Community workshops were held in July 2008 using the combined background information prepared
by Creek to Coral, EPA and GBRMPA. For consultation purposes the Black Ross WQIP sub basins
were grouped into 3 geographic regions:
1. Rural (Crystal Creek to Black River and upper Ross River –above the Ross River Dam);
2. Urban and rural residential (lower Ross River, Bohle River, Stuart Creek and Alligator Creek sub
basins including waterways to Cape Cleveland); and
3. Magnetic Island.
The community workshops were held at:
• Magnetic Island (Arcadia) on 22 July 2008,
• Bluewater on 23 July 2008 (Rural), and
• Annandale on 24 July 2008 (Urban and rural residential).
Results from the workshops were compiled by Creek to Coral for human use and by EPA for aquatic
ecosystems. Human use results were posted on the Creek to Coral website in September 2008 and
emailed to workshop participants for review and comment. Comments were incorporated and both
the human use and aquatic ecosystem draft results were posted on the Creek to website in January
2009 (see Figure 4-2). Additional consultation will be undertaken with Traditional Owner groups and
individuals as part of the implementation phase to better establish the cultural and spiritual human
use values associated with waterways and waterbodies of the Black/Ross WQIP area.

Draft Black and Ross River Basins WQIP
Page 38
Figure 4-2 Stakeholder Consultation Process
*Source: Communication Strategy Jan 08 (p.21) with modifications Nov 2008 and May 2009
Stakeholder survey and information ‘pack’ (February 08)
Website survey form and
information
Reports, technical advice and working
group inputs
Background information
GIS and mapping
Waterway pressures
Waterway condition
HEV/EV technical
group consultation and
workshops (October
2007 and March 2008)
Survey responses (April 2008)
22nd, 23rd and 24th
July 2008
1.Community consultation workshop 2.Community
consultation workshop 3.Community
consultation workshop
Response collation and analysis
HEV/EV technical
working group
Community consultation workshops background
information and preliminary draft HEV area maps, draft human use EVs (June 2008)
Workshop
results
Traditional Owner
consultation
Draft Water Quality Improvement Plan
Follow up community and key stakeholder consultation
feedback. Focus group implementation meetings,
CBSM and Thematic Interpretation studies and
action planning workshops
Result collation
and analysis
Draft Environmental Values and Water Quality Objectives
Black/Ross Water Quality
Improvement Plan

Draft Black and Ross River Basins WQIP
Page 39
4.4 Environmental Values for the Black/Ross WQIP Area
The combined results of the environmental values determination process are provided in Table 4-2
to Table 4-7. The areas identified as aquatic ecosystem HEVs are displayed in Figure 4-3 and Figure
4-4.
Figure 4-3 Draft Aquatic Ecosystem HEV Areas
Figure 4-4 Magnetic Island Draft Aquatic Ecosystem HEV Areas

Draft Black and Ross River Basins WQIP
Page 40
Table 4-2 Draft Environmental Values Black Basin
Waterway
Irrigation
Farm
supply
Stock
watering
Aquaculture
Human
consumer
Primary
recreation
Secondary
recreation
Visual
appreciation
Drinking
water
Industrial
use
Cultural and
spiritual
values
Aquatic
ecosystems
Freshwaters (Note: Instream storages (dams, weirs and barrages) have been underlined)
Black River Basin
Crystal Creek (Upland) L L M - H H H HEV
Crystal Creek (Lowland) M M H M H L - M H H H SMD
Lorna Creek (Upland) L L L H SMD
Lorna Creek (Lowland) M M H M H L - M H H SMD
Ollera Ck (Upland) L L L H HEV
Ollera Creek (Lowland) M M H M H L - M H H SMD
Scrubby Ck (Upland) L L L H HEV
Scrubby Creek (Lowland) M M H M H L - M H H SMD
Hencamp Ck (Upland) L L L H HEV
Hencamp Ck (Lowland) M M H M H L - M H H SMD
Rollingstone Ck (Upland) L L L H HEV
Rollingstone Ck (Lowland) M L H M H L - M H L H SMD
Surveyors Ck L L L L H HEV
Wild Boar Creek L L L H HEV
Station Creek L L L L H HEV
Saltwater Ck (Upland) L L L H HEV
Saltwater Creek (Lowland) M L H M H M M H HEV
Cassowary Ck (Upland) L L L H HEV
Cassowary Ck (Lowland) M L H M H L - M H H HEV
Leichhardt Ck (Upland) H HEV
Leichhardt Ck (Developed) M L H M H M M L H SMD
Christmas Ck (Upland) H HEV
Christmas Ck (Developed) L L H M H L - M H H SMD
Sleeper Log Ck (Upland) H HEV

Draft Black and Ross River Basins WQIP
Page 41
Waterway
Irrigation
Farm
supply
Stock
watering
Aquaculture
Human
consumer
Primary
recreation
Secondary
recreation
Visual
appreciation
Drinking
water
Industrial
use
Cultural and
spiritual
values
Aquatic
ecosystems
Sleeper Log Ck (Developed) L L H M H L - M H H SMD
Two Mile Creek L L H SMD
Bluewater Ck (Upland) L L M - H H HEV
Bluewater Ck (Lowland) M - H M H M H H H H SMD
Althaus Creek (Upland) L L M - H H HEV
Althaus Creek (Lowland) H L H H H H SMD
Deep Creek (Upland) L L M - H H SMD
Deep Creek (Lowland) M - H M H L H H H H SMD
Healy Creek ? L L L H SMD
Black River (Upland) L L L H HEV
Black River (Lowland) L H L L L M H SMD
Alick Creek (Black R trib.) L L H SMD
Log Creek (Black R trib.) L L H SMD
Scrubby Ck (Upland) L L L L H SMD
Alice River (Developed) L H L L H SMD
Canal Creek (Alice R trib.) L L H SMD
Notes: These notes apply to all draft Environmental Values tables. Most of the human use values have been identified from stakeholder workshops where L = Low, M = Medium and H = High
use/value. The level of human use (recreation and human consumption) was assigned on the basis of input from the community workshops where high use/value was assigned when it was
recognised that people travelled from other parts of the region to use the resource, medium use was associated with areas being important locally with less external utilisation i.e. by visitors, and low
use was infrequent or seasonal use predominantly by landowners and locals. Low use was also attributed to inaccessibility. Agricultural use was assigned on the local/catchment importance
associated with land use and stream size, and in the context of the region. Some use levels were assigned on the basis of water extraction data. Industrial and drinking water use was assigned on
the basis of regional importance followed by local importance.
Additional uses identified through a prior study and not identified at the workshop have also been included; from the preliminary stakeholder survey, the human use study and from DNRW water
licencing extraction data (see Human Use EVs Report for more detail). Unless otherwise indicated by the background information a low level of use was assigned to the human uses not identified at
the workshops. For Cultural and Spiritual human use a default high value was assigned at workshops. Traditional Owner consultation will be used to define the values.
In some cases future uses, which are different to current uses, have also been identified. These are marked on the appropriate table/s.
Aquatic ecosystem environmental values were initially identified through a desktop review and technical panel workshops. The draft aquatic ecosystem environmental values were then reviewed at
stakeholder workshops. The WQIP study team is continuing to review/update this information and we welcome further comment on the draft ecological values identified in the tables.
HEV = High ecological/environmental value, SMD = Slightly to moderately disturbed, HD = Highly disturbed

Draft Black and Ross River Basins WQIP
Page 42
Table 4-3 Draft Environmental Values Upper Ross River Catchment (Ross Basin)
Waterway
Irrigation
Farm
supply
Stock
watering
Aquaculture
Human
consumer
Primary
recreation
Secondary
recreation
Visual
appreciation
Drinking
water
Industrial
use
Cultural and
spiritual
values
Aquatic
ecosystems
Freshwaters
Ross River Basin (Ross River Dam and upstream)
Lake Ross (Ross Dam) L L L L M H M H SMD
Ross River (FrW) L M - H L L L H SMD
Round Mountain Ck (Upland) H HEV
Round Mountain Creek L M - H L L L H SMD
Lagoon Creek L M - H L L L H SMD
Plum Tee Creek L M - H L L L H SMD
Central Ck (aka Ross Ck) L M - H L L L H SMD
Sandy Creek L M - H L L L H SMD
Spring Creek L M - H L L L H SMD
Deep Creek L M - H L L L H SMD
Leichhardt Creek L M - H L L L H SMD
Cattle Creek L M - H L L L L H SMD
Six Mile Creek L L M L H SMD
Toonpan Lagoon M L M L H SMD
Jimmys Lagoon L L M L H SMD
Four Mile Ck /Flagstone Ck L L M L H SMD
One Mile Creek/Spring Creek H L M L H SMD
Lansdowne Creek H L M L H SMD
Antill Plains Creek L L M L H SMD
Sachs Creek (Upland) H HEV
Sachs Creek M L L M L H SMD
Blacksoil Gully/Mt Stuart
(Upland) H
HEV
Blacksoil Gully/Mt Stuart L L L H SMD

Draft Black and Ross River Basins WQIP
Page 43
Table 4-4 Draft Environmental Values Ross River Basin (exc. Upper Ross River Catchment)
Waterway
Irrigation
Farm
supply
Stock
watering
Aquaculture
Human
consumer
Primary
recreation
Secondary
recreation
Visual
appreciation
Drinking
water
Industrial
use
Cultural and
spiritual
values
Aquatic
ecosystems
Freshwaters
Ross River Basin (east)
Alligator Ck (Upland) L? H H H L H HEV
Alligator Creek (Lowland) L - M M L L - M L L - M L - M L H SMD/HD
Whites Creek (Upland) H HEV
Whites Creek L L L L L - M L - M H SMD
Slippery Rocks Ck (Upland) H HEV
Slippery Rocks Creek L L L L L - M L - M H SMD
Crocodile Creek L L L L L - M L - M L H SMD
Killymoon Creek (Upland) H HEV
Killymoon Creek M L L L L - M L - M L H SMD
Cape Cleveland L L L H HEV
Stuart Creek (ephemeral) L L L L L H SMD
Stuart Creek (includes pools) L L L M L M L - M H SMD/HD
Sandfly Creek L L L M H SMD
Ross River Basin (west)
Now /
future
Now /
future
Now /
future
Now /
future
Now /
future
Now /
future
Now /
future
Now / future Now /
future
Now
/future
Now /
future
Stoney Creek L L L L L M H SMD
Saunders Creek L L L L L M H SMD
Bohle R (above Condon STP) L L L L L L L H SMD
Bohle R (below Condon STP) L L L M M/H M/H M/H H SMD
Little Bohle River L L L L L M H SMD
Middle Bohle Creek L L L L L M H SMD
Louisa Creek L L L H HD
Town Common L - M H H SMD

Draft Black and Ross River Basins WQIP
Page 44
Waterway
Irrigation
Farm
supply
Stock
watering
Aquaculture
Human
consumer
Primary
recreation
Secondary
recreation
Visual
appreciation
Drinking
water
Industrial
use
Cultural and
spiritual
values
Aquatic
ecosystems
Ross River Basin (below the Ross River Dam)
Ross River (below Dam) M L H H H H H SMD
Ross River Weir Pools (All) M H H H H H HD
Ross River (Black Weir) H H H H H H H HD
Ross R (Gleesons Weir) L H H H H H HD
Ross River (Aplins Weir) L H H H H H HD
Tributaries (Defence land) L L L L H HEV to HD
University (Campus) Creek L L L M H HEV to HD
Lavarack Creek with weirs L L L M H HD
Ross Creek and tributaries H L L H H HD
Pallarenda H H H H HD

Draft Black and Ross River Basins WQIP
Page 45
Table 4-5 Draft Environmental Values for Magnetic Island
Waterway
Irrigation
Human
consumer
Primary
recreation
Secondary
recreation
Visual
appreciation
Drinking
water
Cultural and
spiritual
values
Aquatic
ecosystems
Freshwaters
Magnetic Island
Retreat Creek H L M H H L H HEV/SMD
Duck Creek L M H L L H HEV/SMD
Chinamans Gully L L L L H HEV/SMD
Ned Lee Creek H H H L H HEV/SMD
Butler Ck (Picnic Bay) L L L M H SMD/HD
Picnic Bay west creek L L L M H SMD/HD
Gustav Creek (Upland) L M M - H M - H H HEV
Gustav Creek (Lowland) L L H H H SMD/HD
Hoyer Creek (Nelly Bay) L L H H SMD/HD
North Nelly Bay creek L H H HEV/SMD
Petersen Creek (Upland) L M - H H H H HEV
Petersen Creek (Lowland) M - H H H H SMD/HD
Gorge Creek (Upland) L M - H H H H HEV
Gorge Creek (Lowland) L L L H H SMD/HD
Endeavour Creek (Upland) L M - H H H H HEV
Endeavour Creek (Lowland) M - H H H H SMD
East Horseshoe Bay creek L L L - M H H SMD
Five Beach Bay M - H H H H HEV

Draft Black and Ross River Basins WQIP
Page 46
Table 4-6 Draft Environmental Values Mainland Estuaries (Black and Ross Basins)
Waterway
Aquaculture
Human
consumer
Primary
recreation
Secondary
recreation
Visual
appreciation
Industrial
use
Cultural and
spiritual
values
Aquatic
ecosystems
Estuarine Waters
Crystal Creek H M M - H H H SMD
Lorna Creek H M M - H H H SMD
Ollera Creek H M M - H H H HEV
Scrubby Creek H M M - H H H HEV
Hencamp Creek H M M - H H H SMD
Rollingstone Creek H L H H H SMD
Surveyors Creek H M M - H H H HEV
Wild Boar Creek H M M - H H H HEV
Station Creek H M M - H H H HEV
Saltwater Creek H H L H H H HEV
Cassowary Creek L L L L H HEV
Leichhardt Creek H L H H H SMD
Christmas Creek H L H H H SMD
Two Mile Creek H L H H H SMD
Bluewater Creek H L L H H SMD
Deep Creek H L H H H SMD
Healy Creek H L H H H SMD
Black River H L M L H SMD
Bohle sub basin (upper) M M L - M H SMD
Bohle sub basin (lower) H H H H SMD
Town Common L H SMD
Louisa Creek M M M H SMD
Ross River sub basin H H H M H SMD
Stuart Creek sub basin L H L H H H SMD
Alligator Creek sub basin L H L H H H HEV

Draft Black and Ross River Basins WQIP
Page 47
Table 4-7 Draft Environmental Values Magnetic Island Estuaries and Coastal and Marine
Waterway
Aquaculture
Human
consumer
Primary
recreation
Secondary
recreation
Visual
appreciation
Cultural and
spiritual
values
Aquatic
ecosystems
Estuaries
All Magnetic Island H L L H H HEV
Butler Creek (Estuary) L M M H H SMD
Gustav Creek L - M H H H H HD
East Horseshoe Bay creek L L L H H SMD
Near Coastal and Marine Waters
All near coastal waters MIs H M - H H H H HEV
Horseshoe Bay M H H H H H HEV
West Channel H H H H H SMD
Cleveland Bay H H H H H HEV/SMD
Halifax Bay H H H H H SMD
Outer Marine H H H H H HEV/SMD

Draft Black and Ross River Basins WQIP
Page 48
5. Water Quality Objectives and Targets
5.1 Introduction
Updated Australian water quality guidelines (AWQG) were published in 2000 as part of the ongoing
National Water Quality Management Strategy (NWQMS) program. The guidelines set benchmark
values against which the quality of waters can be assessed and provided the technical base for
establishing draft water quality objectives.
The Queensland Water Quality Guidelines 2006 (QWQG) were developed by the Queensland
Environmental Protection Agency (EPA) as an extension of the NWQMS and AWQG, by delivering
guidelines that include locally and regionally relevant water quality data for fresh, estuarine and
marine waters. The QWQG focus largely on aquatic ecosystem protection, initially across three
geographic regions where regional data was available i.e. Southeast, Central Coast, and the Wet
Tropics.
5.2 Water Quality Guidelines Relevant to the Dry Tropics
Local water quality guidelines for non-marine areas have not yet been established for the Black/Ross
WQIP area so in lieu of local guidelines the Queensland guidelines for the Central Coast (Wet
Tropics guidelines are used for the for the northern catchments) have been adopted for freshwaters
and estuaries. Water quality trigger value guidelines prepared by GBRMPA have been adopted for
marine areas (see Gunn et al 2009).
5.3 Water Quality Condition Indicators
A range of indicators can be used to assess water quality and aquatic ecosystem condition. These
are usually divided into physico-chemical indicators and biological indicators. Physico-chemical
indicators are most often used as they are more easily measured using standard sampling and
analysis procedures. Biological indicators are discussed briefly in section 5.6. The physico-chemical
water quality indicators considered for use when establishing water quality objectives are listed in
Table 5-1. Some of the indicators are specific to urban areas and not all indicators are used in all
situations e.g. freshwater versus marine or ambient concentrations versus event-based loads.
Table 5-1 Condition Indicators
WQ Indicator Description Reason for Use
TSS Total suspended
sediment/solids
Indicator of erosion and transport of sediment to
waterbodies. Can be related to vegetation cover/bare
ground and management practices. Can result in
smothering of benthic organisms and inhibition of
primary production
Turbidity Visual measure of
water clarity
Light penetration and subsequent biological activity is
impacted by water clarity
OrgN/PN Organic nitrogen /
particulate nitrogen
Provides an indication of the amount of plant material
entering the system and will become bioavailable in the
longer term through decomposition
DIN Dissolved inorganic
nitrogen
Readily bioavailable and supports a range of biological
interactions including algal growth
Total N The sum of all forms
of nitrogen
Available data sets may not provide analysis of the
different species of nitrogen
PP Particulate
phosphorus
Can become bioavailability in the longer term and is
often related to TSS levels
FRP Filterable reactive
phosphorus
Readily bioavailable and supports a range of biological
interactions including algal growth

Draft Black and Ross River Basins WQIP
Page 49
Total P The sum of all forms
of phosphorus
Available data sets may not provide analysis of the
different species of phosphorus
Chlorophyll a A measure of algal
growth
Is an indicator of algal growth and has a close
relationship to nutrient concentrations, modified to
some extent by water clarity
DO Dissolved oxygen
(percentage
saturation)
Oxygen levels are important for fish and other aquatic
organisms to survive. Low oxygen levels are one of the
main water quality issues in tropical Queensland, often
resulting from natural causes
pH Indicator of acidity and
alkalinity
pH is important for chemical and biological processes
with highly acid and highly alkaline waters resulting in
stressful or toxic conditions for many organisms leading
to a change in biodiversity
EC Electrical conductivity
is a simple way to
measure salt levels
In freshwaters, high levels of salt can impact plant
growth and create conditions that are toxic to many
organisms leading to a change in biodiversity
Pesticides Various types Inhibits plant growth and may bioaccumulate
Urban Specific
Hydrocarbons Oil and petroleum
based products
Excessive hydrocarbons can result in smothering of
aquatic habitats. They can also increase morbidity and
mortality in aquatic species, and impact reproductive
cycles
Gross
Pollutants
Debris items often
>5mm. Litter including
plastics, garden waste
and coarse sediment
Organic material can lead to oxygen depletion during
decomposition. Litter, especially plastic bags, can be
harmful to marine organisms, as well as being
aesthetically unpleasant.
Metals/Heavy
metals
Cadmium, Chromium,
Copper, Nickel, Lead,
Zinc
Excessive levels can be toxic to aquatic organisms and
can bioaccumulate and be passed along the food chain
(Cobalt, Sellenium, Thallium, Silver, Arsenic, Antimony)
5.4 Water Quality Objectives
Water quality objectives (WQOs) are based on the adoption of the most stringent water quality
guidelines (WQGs), for the relevant water quality parameters, which will maintain the identified
environmental values (EVs) of the waterways and waterbodies in the study area.
Stream flow in the Dry Tropics is highly seasonal with potentially high and flood flows during the wet
season (December to April) and limited baseflow, or no flow, in many of the streams during the drier
months (May to November). The amount of pollutants in waterways will vary depending on rainfall
and stream flow so water quality objectives also need to be tailored to appropriately reflect
climatically influenced situations.
5.4.1 Ambient Concentrations
A set of draft physico-chemical water quality objectives for ambient conditions have been adopted for
the Black Ross WQIP area based on the EVs established and on the Queensland Water Quality
Guidelines (see Table 5-2) and GBRMPA marine water quality guideline trigger values (see Table
5-3).
For freshwater and estuaries the draft water quality objectives are based principally on the guidelines
for slightly to moderately disturbed aquatic ecosystems, which provide a higher level of water quality
protection than is required for most human use environmental values i.e. more stringent guideline
values. In this way all human use environmental values are protected by default if the aquatic
ecosystem water quality guideline values are maintained.

Draft Black and Ross River Basins WQIP
Page 50
Where there is an exception to this generalisation the higher level of protection for human use is
adopted where a waterway or water body has been identified as having one or more of those human
use environmental values. Exceptions are listed in the table endnotes. Wet Tropics water quality
objectives (to be inserted) have been adopted for Crystal Creek and Rollingstone sub basins.
Table 5-2 Draft Ambient Physico-chemical Water Quality Objectives Freshwater and Estuaries
Freshwater Estuarine Indicator
Upland Lowland Lakes Mid Estuary Upper Estuary
TSS (mg/L) - 10 10 20 25
OrgNQ/PNG – N (µg/L) 225 420 330 260 400
DIN – N (µg/L) 25 80 20 20 45
Total N (µg/L) 250 500 350 300 450
PP – P (µg/L) 15 30 17 30
FRP – P (µg/L) 15 20 5 8 10
Total P (µg/L) 30 50 10 25 40
Turbidity (NTU) 25 50 1-20 8 25
Chlorophyll a (µg/L) na 5 5 4 10
Dissolved Oxygen (%) 90-110 85-110 90-110 85-100 70-100
pH 6.5-7.5 6.5-8.0 6.5-8.0 7.0-8.4 7.0-8.4
EC* (µS/cm) 375/271 375/271 375/271 Notes: Values are for Slightly to Moderately Disturbed waterways. PP = Total P – FRP. Dissolved oxygen is % saturation. * Conductivity values (EC) for freshwaters (from the QWQG Appendix G, p.103) for Central Coast North, based on the 75
th percentile value, is 375 µS/cm for the Black Basin. The Ross Basin is in the Burdekin-Bowen region
and the corresponding value is 271 µS/cm. Water Quality Guideline values - Exceptions to the aquatic ecosystem guidelines: Ammonia - Recreation (Primary and Secondary) guidelines for Ammonia are more stringent in upper estuaries and lowland streams i.e. 10 µg/L. Turbidity - Drinking water (aesthetics) guidelines for turbidity are more stringent for freshwater i.e. 5 NTU. (Nephelometric turbidity unit) Secchi depth - Primary recreation guidelines for Secchi depth are more stringent for estuaries i.e. >1.6m.
Table 5-3 Draft Marine Physico-chemical Water Quality Objectives
Enclosed
Coastal
Coastal/
Inshore
Offshore
TSS (mg/L) 15 ¹ 2.0 ¹ 0.7 ¹
OrgNQ/PNG – N (µg/L) 180 ² 20 ¹ 17 ¹
DIN – N (µg/L) * 11 ² 9 ²
Total N 200 ² 29*
PP – P (µg/L) 14 ² 2.8 ¹ 1.9 ¹
FRP – P (µg/L) 6 ² 6 ²
Total P 20 ² 8.8*
Turbidity (NTU) 6 ² 1 ²
Chlorphyll a (µg/L) 2 ¹ 0.45 ¹ 0.4 ¹
Dissolved Oxygen (%) 90-100 ² 95-105 ²
pH 8.0-8.4 ² 8.0-8.4 ²
Secchi depth 1.5 ¹ 10 ¹ 17 ¹ Notes: ¹ indicates values from the WQ Guideline for the GBRMP (GBRMPA 2008) and ² indicates values from the Queensland WQ Guidelines (EPA 2006). * Based on the locally derived particulate nitrogen and phosphorous trigger levels an adjustment to the QWQG concentration for the total nitrogen and phosphorus values has been calculated

Draft Black and Ross River Basins WQIP
Page 51
Table 5-4 Draft Pesticide Water Quality Objectives
Freshwater Marine Pesticides (µµµµg/L)
Upland Lowland HEV SMD HEV SMD
Diuron <LOD 0.5 2.0 0.9* 1.6*
Atrazine <LOD 0.3 0.7 13 0.4* 2.4*
Simazine <LOD 0.01 0.2 3.2 0.2* 3.2*
Bromacil
Hexazinone <LOD 0.4 75* 75*
Endosulfan¹ 0.03 0.03 0.005 0.005
Malathion 0.002 0.05
Chlorpyrifos 0.005*
Ametryn 0.5*
2,4-D 0.8*
Tebuthiuron 0.02*
MEMC 0.002*
Diazinon 0.00003*
Tributytlin² 0.0002* Pesticides (from Leissmann et al 2007, ACTFR 07/09). Pesticide concentrations for upland and lowland freshwater from MWWQIP p.28 LOD is limit of detection (generally 0.01µg/L) HEV and SMD values for freshwater from AWQG ANZECC 2000 Table 3.4.1 Trigger values for toxicants at alternative levels of protection (aquatic ecosystems) Part 8, 9 and 10 (all other values ID). * Marine values from GBR
¹ This trigger value may not protect keystone species given effect concentrations for adult coral colonies are
observed at significantly lower concentrations. ² Tributytlin is a biocide.
Additional water quality objectives have also been adopted for the high urban catchments i.e.
catchments where urban land uses are >65%. Draft objectives for heavy metals and hydrocarbons,
and heavy metals in sediment are listed in Table 5-5 and Table 5-6.
Table 5-5 Draft Heavy Metal Water Quality Objectives
Indicator Freshwater Marine
Heavy metal (µµµµg/L) HEV SM Dist. HEV SM Dist.
Cadmium 0.06 0.2 0.7 5.5
Chromium 0.01 1.0 0.14 4.4
Copper 1.0 1.4 0.3 1.3
Lead 1.0 3.4 2.2 4.4
Nickel 8 11 7 70
Zinc 2.4 8.0 7 15
Hydrocarbons * 300 300 Source: AWQG Table 3.4.1 Trigger values for toxicants at alternative levels of protection Note: Trigger values for toxicants (µg/L) at alternative levels of protection (AWQG, pp.3.4-5 to 3.4-10) i.e. 99%, 95%, 90% and 80% for freshwaters and marine waters. * Hydrocarbon reference (Oils and greases (including petrochemicals) <300 µg/L) appears in Aquaculture Table 4.4.3 Toxicant guidelines for the protection of aquaculture species Part 2. A range of hydrocarbons are included in AWQG Table 3.4.1

Draft Black and Ross River Basins WQIP
Page 52
Table 5-6 Draft Heavy Metals in Sediment Objectives
Metals in sediment ISQG low ISQG high
Cadmium 1.5 10
Chromium 80 370
Copper 65 270
Lead 50 220
Nickel 21 52
Zinc 200 410 Heavy metals from Interim Sediment Quality Guidelines (ANZECC 2000) Measured as mg/kg (dry weight) = ppm Table 3.5.1 A water quality objective has been set for gross pollutants as part of the process for developing the Water Sensitive Urban Design guidelines. This is expressed as a 90% reduction in gross pollutants from current levels.
5.4.2 Event Concentrations
It is important in urban areas to reduce the amount of sediment moving off construction sites to
waterways and it is also important to provide an indication to the development and construction
industry of acceptable water quality levels of run-off from construction sites. As the majority of
pollutants load (80-90%) is discharged from catchments during event flows the concentrations during
events is greater than that of background readings.
Indicating appropriate water quality objectives is best done using event concentrations rather than
unrealistic background or low flow concentrations. Local event water quality monitoring data has
been used to calculate a draft set of event based water quality objectives. Data was collected during
event monitoring over the 2006/2007 and 2007/2008 ‘wet seasons’. The draft objectives are listed in
Table 5-7.
Table 5-7 Event Based Water Quality Objectives
Event based WQOs Indicator
Developing Urban All Other Landuse
TSS (mg/L) 285 (476) 75
OrgNQ/PN – N (µg/L) 119 (198) 149
DIN – N (µg/L) - 75
Total N (µg/L) - 426
PP – P (µg/L) 75 (125) 33
FRP – P (µg/L) - 20
Total P (µg/L) - 59
Source: Townsville WQO EMC for TSS, PN and PP for developing areas was derived by summing three of four
event monitoring samples taken from developing coastal plains in Townsville (discard the outlier) and then
reducing the mean by 40% (numbers in brackets are the mean prior to reduction) to the initial target figures.

Draft Black and Ross River Basins WQIP
Page 53
Table 5-8 Freshwater Ambient WQOs and Targets (µg/L)
DIN PN Total N FRP PP Total P TSS Catchment/Management Unit
WQO CC T WQO CC T WQO CC T WQO CC T WQO CC T WQO CC T WQO CC T
Crystal Creek (Upland) 1-1 HEV PCC 14 14 PCC 95 95 PCC 108 108 PCC 2 2 PCC 2 2 PCC 4 4 PCC 2 2
Crystal Creek (Lowland FW) 1-1 SMD 10 14 10 200 95 200 240 108 240 4 2 4 6 2 6 10 4 10 ND 4 ND
Lorna Creek (Upland) 1-2 SMD 36 14 36 125 95 125 150 108 150 5 2 5 5 2 5 10 4 10 ND 4 ND
Lorna Creek (Lowland FW) 1-2 SMD 10 14 10 200 95 200 240 108 240 4 2 4 6 2 6 10 4 10 ND 4 ND
Ollera Ck (Upland) 1-3 HEV PCC 14 14 PCC 95 95 PCC 108 108 PCC 2 2 PCC 2 2 PCC 4 4 PCC 4 4
Ollera Creek (Lowland FW) 1-3 SMD 10 14 10 200 95 200 240 108 240 4 2 4 6 2 6 10 4 10 ND 4 ND
Scrubby Ck (Upland) 1-4 HEV PCC 14 14 PCC 95 95 PCC 108 108 PCC 2 2 PCC 2 2 PCC 4 4 PCC 4 4
Scrubby Creek (Lowland FW) 1-4 SMD 10 14 10 200 95 200 240 108 240 4 2 4 6 2 6 10 4 10 ND 4 ND
Hencamp Ck (Upland) 1-5 HEV PCC 35 35 PCC 300 300 PCC 340 340 PCC 5 5 PCC 5 5 PCC 20 20 PCC 20 20
Crystal Creek
Sub Bas
in
Hencamp Ck (Lowland FW) 1-5 SMD 10 35 10 200 300 200 240 340 240 4 5 4 6 5 6 10 20 10 ND 20 ND
Rollingstone Ck (Upland) 2-1 HEV PCC 40 40 PCC 300 300 PCC 360 360 PCC ND 5 PCC ND 5 PCC 20 20 PCC 20 20
Rollingstone Ck (Lowland FW) 2-1 SMD 10 40 10 200 300 200 240 360 240 4 ND 4 6 ND 6 10 20 10 ND 20 ND
Unnamed Creek 2-2 SMD 10 15 10 200 200 200 240 223 240 4 5 4 6 5 6 10 20 10 ND 20 ND
Surveyors Ck 2-3 HEV PCC 15 15 PCC 200 200 PCC 223 223 PCC 5 5 PCC 5 5 PCC 20 20 PCC 20 20
Wild Boar Creek 2-4 HEV PCC 15 15 PCC 200 200 PCC 223 223 PCC 5 5 PCC 5 5 PCC 20 20 PCC 20 20
Station Creek 2-5 HEV PCC 15 15 PCC 200 200 PCC 223 223 PCC 5 5 PCC 5 5 PCC 20 20 PCC 20 20
Saltwater Ck (Upland) 2-6 HEV PCC 15 15 PCC 200 200 PCC 223 223 PCC 5 5 PCC 5 5 PCC 20 20 PCC 20 20
Saltwater Creek (Lowland FW) 2-6 HEV PCC 15 15 PCC 200 200 PCC 223 223 PCC 5 5 PCC 5 5 PCC 20 20 PCC 20 20
Cassowary Ck (Upland) 2-7 HEV PCC 15 15 PCC 200 200 PCC 223 223 PCC 5 5 PCC 5 5 PCC 20 20 PCC 20 20
Cassowary Ck (Lowland FW) 2-7 HEV PCC 15 15 PCC 200 200 PCC 223 223 PCC 5 5 PCC 5 5 PCC 20 20 PCC 20 20
Leichhardt Ck (Upland) 2-8 HEV PCC 30 30 PCC 300 300 PCC 330 330 PCC ND 5 PCC ND 5 PCC 20 20 PCC 20 20
Rollingstone Creek
Sub Bas
in
Leichhardt Ck (Developed) 2-8 SMD 10 30 10 200 300 200 240 330 240 4 ND 4 6 ND 6 10 20 10 ND 20 ND
Christmas Ck (Upland) 3-1 HEV PCC 17 17 PCC 200 200 PCC 240 240 PCC 5 5 PCC 5 5 PCC 30 30 PCC 30 30
Christmas Ck (Developed) 3-1 SMD 80 17 80 420 200 420 500 240 500 20 5 20 30 5 30 50 30 50 10 30 10
Sleeper Log Ck (Upland) 3-1 HEV PCC 17 17 PCC 200 200 PCC 240 240 PCC 5 5 PCC 5 5 PCC 30 30 PCC 30 30
Sleeper Log Ck (Developed) 3-1 SMD 80 17 80 420 200 420 500 240 500 20 5 20 30 5 30 50 30 50 10 30 10
Two Mile Creek 3-2 SMD 80 19 80 420 200 420 500 228 500 20 9 20 30 9 30 50 40 50 10 40 10
Bluewater Ck (Upland) 3-3 HEV PCC 61 61 PCC 196 196 PCC 282 282 PCC 6 6 PCC 6 6 PCC 20 20 PCC 20 20
Bluewater Ck (Lowland FW) 3-3 SMD 80 61 80 420 196 420 500 282 500 20 6 20 30 6 30 50 20 50 10 20 10
Althaus Creek (Upland) 3-4 HEV PCC 40 40 PCC 300 300 PCC 370 370 PCC ND 15 PCC ND 15 PCC 20 20 PCC 20 20
Althaus Creek (Lowland FW) 3-4 SMD 80 40 80 420 300 420 500 370 500 20 ND 20 30 ND 30 50 20 50 10 20 10
Deep Creek (Upland) 3-4 SMD 25 40 25 225 300 225 250 370 250 15 ND 15 15 ND 15 30 20 30 - 20 -
Deep Creek (Lowland FW) 3-4 SMD 80 40 80 420 300 420 500 370 500 20 ND 20 30 ND 30 50 20 50 10 20 10
Bluew
ater Creek
Sub Bas
in
Healy Creek 3-4 SMD 80 40 80 420 300 420 500 370 500 20 ND 20 30 ND 30 50 20 50 10 20 10
Black River (Upland) 4-1 HEV PCC 40 40 PCC 300 300 PCC 335 335 PCC 35 35 PCC 35 35 PCC 32 32 PCC 32 32
k
River
S.Ba
Black River (Lowland FW) 4-1 SMD 80 40 80 420 300 420 500 335 500 20 35 20 30 35 30 50 32 50 10 32 10

Draft Black and Ross River Basins WQIP
Page 54
DIN PN Total N FRP PP Total P TSS Catchment/Management Unit
WQO CC T WQO CC T WQO CC T WQO CC T WQO CC T WQO CC T WQO CC T
Alick Creek (Black R trib.) 4-1 SMD 80 40 80 420 300 420 500 335 500 20 35 20 30 35 30 50 32 50 10 32 10
Log Creek (Black R trib.) 4-1 SMD 80 40 80 420 300 420 500 335 500 20 35 20 30 35 30 50 32 50 10 32 10
Scrubby Ck (Alice R trib.) (Up) 4-2 SMD 80 40 80 420 300 420 500 335 500 20 35 20 30 35 30 50 32 50 10 32 10
Alice River (Developed) 4-2 SMD 80 40 80 420 300 420 500 335 500 20 35 20 30 35 30 50 32 50 10 32 10
Canal Creek (Alice R trib.) 4-2 SMD 80 40 80 420 300 420 500 335 500 20 35 20 30 35 30 50 32 50 10 32 10
Stoney Creek 5-1 SMD 80 69 80 420 500 420 500 620 500 20 130 20 30 130 30 50 130 50 10 130 10
Saunders Creek 5-1 SMD 80 69 80 420 500 420 500 620 500 20 130 20 30 130 30 50 130 50 10 130 10
Bohle R (below Bruce Hway) 5-1 SMD 80 69 80 420 500 420 500 620 500 20 130 20 30 130 30 50 130 50 10 130 10
Louisa Creek 5-1 HD 80 69 80 420 500 420 500 620 500 20 130 20 30 130 30 50 130 50 10 130 10
Town Common 5-1 SMD 80 69 80 420 500 420 500 620 500 20 130 20 30 130 30 50 130 50 10 130 10
Bohle R (above Condon STP) 5-2 SMD 80 931 80 420 1000 420 500 1822 500 20 4000 20 30 4000 30 50 2500 50 10 2500 10
Bohle R (below Condon STP) 5-2 SMD 80 931 80 420 1000 420 500 1822 500 20 4000 20 30 4000 30 50 2500 50 10 2500 10
Little Bohle River 5-2 SMD 80 931 80 420 1000 420 500 1822 500 20 4000 20 30 4000 30 50 2500 50 10 2500 10
Bohle River Sub Bas
in
Middle Bohle Creek 5-2 SMD 80 931 80 420 1000 420 500 1822 500 20 4000 20 30 4000 30 50 2500 50 10 2500 10
Pallarenda 6-1 HD 80 57 80 420 245 420 500 356 500 20 20 20 30 20 30 50 40 50 10 40 10
Mundy Creek 6-2 SMD 80 72 80 420 359 420 500 642 500 20 138 20 30 138 30 50 245 50 10 245 10
Esplanade 6-3 SMD 80 30 80 420 300 420 500 345 500 20 ND 20 30 ND 30 50 40 50 10 40 10
Ross Creek and tributaries 6-4 HD 80 57 80 420 245 420 500 356 500 20 20 20 30 20 30 50 40 50 10 40 10
Ross River (below Dam) 6-5 SMD 80 40 80 420 336 420 500 430 500 20 12 20 30 12 30 50 44 50 10 44 10
Ross River (Black Weir) 6-5 HD 80 40 80 420 336 420 500 430 500 20 12 20 30 12 30 50 44 50 10 44 10
Ross R (Gleesons Weir) 6-5 HD 80 40 80 420 336 420 500 430 500 20 12 20 30 12 30 50 44 50 10 44 10
Ross River (Aplins Weir) 6-5 HD 80 40 80 420 336 420 500 430 500 20 12 20 30 12 30 50 44 50 10 44 10
Tributaries (Defence land) 6-5 SMD 80 40 80 420 336 420 500 430 500 20 12 20 30 12 30 50 44 50 10 44 10
University (Campus) Creek 6-5 SMD 80 40 80 420 336 420 500 430 500 20 12 20 30 12 30 50 44 50 10 44 10
Lower Ross
River Sub Bas
in
Lavarack Ck with weirs (?)6-5 HD 80 40 80 420 336 420 500 430 500 20 12 20 30 12 30 50 44 50 10 44 10
Lake Ross (Ross Dam) 7-1 SMD 20 40 20 330 500 330 350 560 350 5 15 5 0 15 0 10 30 10 10 30 10
Ross River (FrW) 7-1 SMD 80 40 80 420 500 420 500 560 500 20 15 20 30 15 30 50 30 50 10 30 10
Round Mountain Ck (Upland) 7-1 HEV PCC 40 40 PCC 500 500 PCC 560 560 PCC 15 15 PCC 15 15 PCC 30 30 PCC 30 30
Round Mountain Creek 7-1 SMD 80 40 80 420 500 420 500 560 500 20 15 20 30 15 30 50 30 50 10 30 10
Lagoon Creek 7-1 SMD 80 40 80 420 500 420 500 560 500 20 15 20 30 15 30 50 30 50 10 30 10
Plum Tee Creek 7-1 SMD 80 40 80 420 500 420 500 560 500 20 15 20 30 15 30 50 30 50 10 30 10
Central Ck (aka Ross Ck) 7-1 SMD 80 40 80 420 500 420 500 560 500 20 15 20 30 15 30 50 30 50 10 30 10
Sandy Creek 7-1 SMD 80 40 80 420 500 420 500 560 500 20 15 20 30 15 30 50 30 50 10 30 10
Deep Creek 7-1 SMD 80 40 80 420 500 420 500 560 500 20 15 20 30 15 30 50 30 50 10 30 10
Leichhardt Creek 7-1 SMD 80 40 80 420 500 420 500 560 500 20 15 20 30 15 30 50 30 50 10 30 10
Cattle Creek 7-1 SMD 80 40 80 420 500 420 500 560 500 20 15 20 30 15 30 50 30 50 10 30 10
Upper Ross
River Sub Bas
in
Six Mile Creek 7-2 SMD 80 40 80 420 500 420 500 560 500 20 15 20 30 15 30 50 30 50 10 30 10
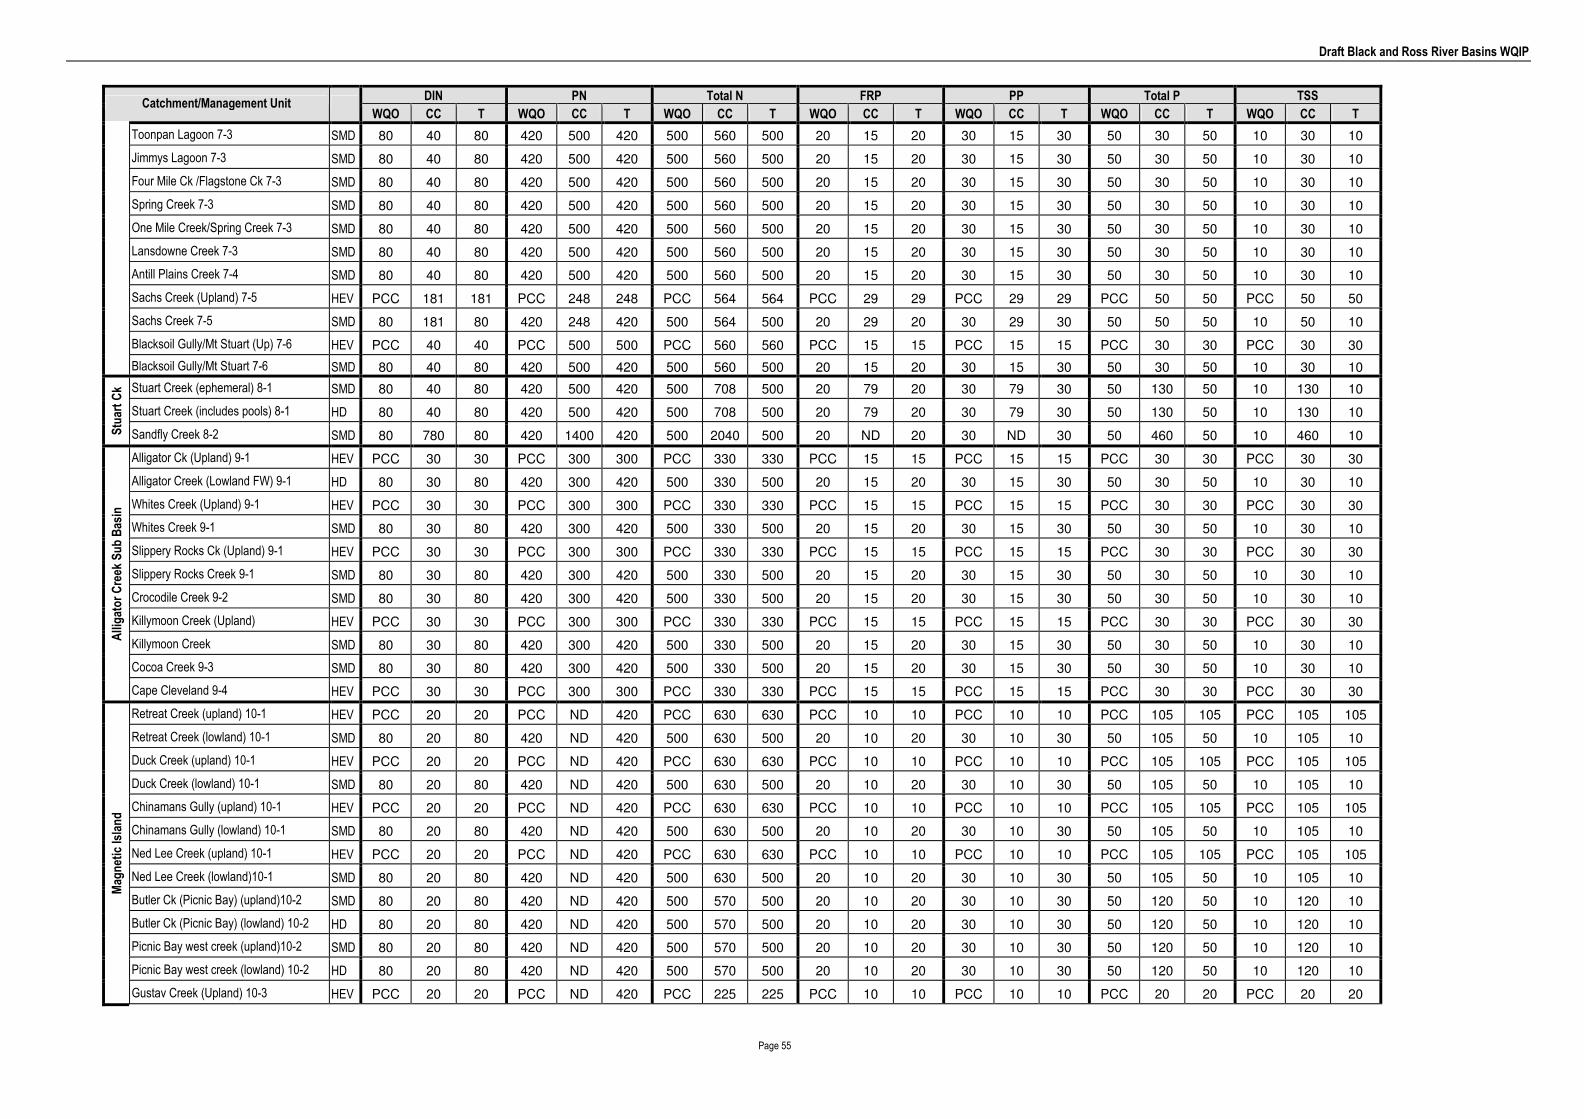
Draft Black and Ross River Basins WQIP
Page 55
DIN PN Total N FRP PP Total P TSS Catchment/Management Unit
WQO CC T WQO CC T WQO CC T WQO CC T WQO CC T WQO CC T WQO CC T
Toonpan Lagoon 7-3 SMD 80 40 80 420 500 420 500 560 500 20 15 20 30 15 30 50 30 50 10 30 10
Jimmys Lagoon 7-3 SMD 80 40 80 420 500 420 500 560 500 20 15 20 30 15 30 50 30 50 10 30 10
Four Mile Ck /Flagstone Ck 7-3 SMD 80 40 80 420 500 420 500 560 500 20 15 20 30 15 30 50 30 50 10 30 10
Spring Creek 7-3 SMD 80 40 80 420 500 420 500 560 500 20 15 20 30 15 30 50 30 50 10 30 10
One Mile Creek/Spring Creek 7-3 SMD 80 40 80 420 500 420 500 560 500 20 15 20 30 15 30 50 30 50 10 30 10
Lansdowne Creek 7-3 SMD 80 40 80 420 500 420 500 560 500 20 15 20 30 15 30 50 30 50 10 30 10
Antill Plains Creek 7-4 SMD 80 40 80 420 500 420 500 560 500 20 15 20 30 15 30 50 30 50 10 30 10
Sachs Creek (Upland) 7-5 HEV PCC 181 181 PCC 248 248 PCC 564 564 PCC 29 29 PCC 29 29 PCC 50 50 PCC 50 50
Sachs Creek 7-5 SMD 80 181 80 420 248 420 500 564 500 20 29 20 30 29 30 50 50 50 10 50 10
Blacksoil Gully/Mt Stuart (Up) 7-6 HEV PCC 40 40 PCC 500 500 PCC 560 560 PCC 15 15 PCC 15 15 PCC 30 30 PCC 30 30
Blacksoil Gully/Mt Stuart 7-6 SMD 80 40 80 420 500 420 500 560 500 20 15 20 30 15 30 50 30 50 10 30 10
Stuart Creek (ephemeral) 8-1 SMD 80 40 80 420 500 420 500 708 500 20 79 20 30 79 30 50 130 50 10 130 10
Stuart Creek (includes pools) 8-1 HD 80 40 80 420 500 420 500 708 500 20 79 20 30 79 30 50 130 50 10 130 10
Stuart Ck
Sandfly Creek 8-2 SMD 80 780 80 420 1400 420 500 2040 500 20 ND 20 30 ND 30 50 460 50 10 460 10
Alligator Ck (Upland) 9-1 HEV PCC 30 30 PCC 300 300 PCC 330 330 PCC 15 15 PCC 15 15 PCC 30 30 PCC 30 30
Alligator Creek (Lowland FW) 9-1 HD 80 30 80 420 300 420 500 330 500 20 15 20 30 15 30 50 30 50 10 30 10
Whites Creek (Upland) 9-1 HEV PCC 30 30 PCC 300 300 PCC 330 330 PCC 15 15 PCC 15 15 PCC 30 30 PCC 30 30
Whites Creek 9-1 SMD 80 30 80 420 300 420 500 330 500 20 15 20 30 15 30 50 30 50 10 30 10
Slippery Rocks Ck (Upland) 9-1 HEV PCC 30 30 PCC 300 300 PCC 330 330 PCC 15 15 PCC 15 15 PCC 30 30 PCC 30 30
Slippery Rocks Creek 9-1 SMD 80 30 80 420 300 420 500 330 500 20 15 20 30 15 30 50 30 50 10 30 10
Crocodile Creek 9-2 SMD 80 30 80 420 300 420 500 330 500 20 15 20 30 15 30 50 30 50 10 30 10
Killymoon Creek (Upland) HEV PCC 30 30 PCC 300 300 PCC 330 330 PCC 15 15 PCC 15 15 PCC 30 30 PCC 30 30
Killymoon Creek SMD 80 30 80 420 300 420 500 330 500 20 15 20 30 15 30 50 30 50 10 30 10
Cocoa Creek 9-3 SMD 80 30 80 420 300 420 500 330 500 20 15 20 30 15 30 50 30 50 10 30 10
Alligator Creek
Sub Bas
in
Cape Cleveland 9-4 HEV PCC 30 30 PCC 300 300 PCC 330 330 PCC 15 15 PCC 15 15 PCC 30 30 PCC 30 30
Retreat Creek (upland) 10-1 HEV PCC 20 20 PCC ND 420 PCC 630 630 PCC 10 10 PCC 10 10 PCC 105 105 PCC 105 105
Retreat Creek (lowland) 10-1 SMD 80 20 80 420 ND 420 500 630 500 20 10 20 30 10 30 50 105 50 10 105 10
Duck Creek (upland) 10-1 HEV PCC 20 20 PCC ND 420 PCC 630 630 PCC 10 10 PCC 10 10 PCC 105 105 PCC 105 105
Duck Creek (lowland) 10-1 SMD 80 20 80 420 ND 420 500 630 500 20 10 20 30 10 30 50 105 50 10 105 10
Chinamans Gully (upland) 10-1 HEV PCC 20 20 PCC ND 420 PCC 630 630 PCC 10 10 PCC 10 10 PCC 105 105 PCC 105 105
Chinamans Gully (lowland) 10-1 SMD 80 20 80 420 ND 420 500 630 500 20 10 20 30 10 30 50 105 50 10 105 10
Ned Lee Creek (upland) 10-1 HEV PCC 20 20 PCC ND 420 PCC 630 630 PCC 10 10 PCC 10 10 PCC 105 105 PCC 105 105
Ned Lee Creek (lowland)10-1 SMD 80 20 80 420 ND 420 500 630 500 20 10 20 30 10 30 50 105 50 10 105 10
Butler Ck (Picnic Bay) (upland)10-2 SMD 80 20 80 420 ND 420 500 570 500 20 10 20 30 10 30 50 120 50 10 120 10
Butler Ck (Picnic Bay) (lowland) 10-2 HD 80 20 80 420 ND 420 500 570 500 20 10 20 30 10 30 50 120 50 10 120 10
Picnic Bay west creek (upland)10-2 SMD 80 20 80 420 ND 420 500 570 500 20 10 20 30 10 30 50 120 50 10 120 10
Picnic Bay west creek (lowland) 10-2 HD 80 20 80 420 ND 420 500 570 500 20 10 20 30 10 30 50 120 50 10 120 10
Mag
netic Is
land
Gustav Creek (Upland) 10-3 HEV PCC 20 20 PCC ND 420 PCC 225 225 PCC 10 10 PCC 10 10 PCC 20 20 PCC 20 20

Draft Black and Ross River Basins WQIP
Page 56
DIN PN Total N FRP PP Total P TSS Catchment/Management Unit
WQO CC T WQO CC T WQO CC T WQO CC T WQO CC T WQO CC T WQO CC T
Gustav Creek (Lowland FW) 10-3 SMD 80 20 80 420 ND 420 500 225 500 20 10 20 30 10 30 50 20 50 10 20 10
Hoyer Creek (Nelly Bay) (upland) 10-3 SMD 80 20 80 420 ND 420 500 225 500 20 10 20 30 10 30 50 20 50 10 20 10
Hoyer Creek (Nelly Bay) (lowland) 10-3 HD 80 20 80 420 ND 420 500 225 500 20 10 20 30 10 30 50 20 50 10 20 10
North Nelly Bay creek (upland) 10-3 HEV PCC 20 20 PCC ND 420 PCC 225 225 PCC 10 10 PCC 10 10 PCC 20 20 PCC 20 20
North Nelly Bay creek (lowland) 10-3 SMD 80 20 80 420 ND 420 500 225 500 20 10 20 30 10 30 50 20 50 10 20 10
Petersen Creek (Upland) 10-4 HEV PCC 140 140 PCC ND 420 PCC 770 770 PCC 10 10 PCC 10 10 PCC 70 70 PCC 70 70
Petersen Creek (Lowland FW) 10-4 SMD 80 140 80 420 ND 420 500 770 500 20 10 20 30 10 30 50 70 50 10 70 10
Gorge Creek (Upland) 10-6 HEV PCC 140 140 PCC ND 420 PCC 770 770 PCC 10 10 PCC 10 10 PCC 70 70 PCC 70 70
Gorge Creek (Lowland FW) 10-6 SMD 80 140 80 420 ND 420 500 770 500 20 10 20 30 10 30 50 70 50 10 70 10
Endeavour Creek (Upland) 10-6 HEV PCC 140 140 PCC ND 420 PCC 770 770 PCC 10 10 PCC 10 10 PCC 70 70 PCC 70 70
Endeavour Creek (Lowland FW) 10-6 SMD 80 140 80 420 ND 420 500 770 500 20 10 20 30 10 30 50 70 50 10 70 10
East Horseshoe Bay creek 10-6 SMD 80 140 80 420 ND 420 500 770 500 20 10 20 30 10 30 50 70 50 10 70 10
Five Beach Bay 10-7 HEV PCC 140 140 PCC ND 420 PCC 770 770 PCC 10 10 PCC 10 10 PCC 70 70 PCC 70 70
Notes: DIN – Dissolved Inorganic Nitrogen, PN – Particulate Nitrogen, Total N – Total Nitrogen, FRP – Filterable Reactive Phosphorus, PP – particulate Phosphorus, Total P – Total Phosphorus, TSS – Total Suspended Sediments
WQO – Water Quality Objective; CC – Current Condition; T – Target, PCC – Protect/Maintain Current Condition; ND – No Data
Table 5-9 Estuarine Ambient WQOs and Targets (µg/L)
DIN PN Total N FRP PP Total P TSS Catchment/Management Unit
WQO CC T WQO CC T WQO CC T WQO CC T WQO CC T WQO CC T WQO CC T
Crystal Creek 20 ND 20 260 ND 260 300 ND 300 8 ND 8 17 ND 17 25 ND 25 20 ND 20
Lorna Creek 20 ND 20 260 ND 260 300 ND 300 8 ND 8 17 ND 17 25 ND 25 20 ND 20
Ollera Creek PCC ND PCC PCC ND PCC PCC ND PCC PCC ND PCC PCC ND PCC PCC ND PCC PCC ND PCC
Scrubby Creek PCC ND PCC PCC ND PCC PCC ND PCC PCC ND PCC PCC ND PCC PCC ND PCC PCC ND PCC
Cry
stal
Cre
ek
Hencamp Creek 20 ND 20 260 ND 260 300 ND 300 8 ND 8 17 ND 17 25 ND 25 20 ND 20
Rollingstone Creek 20 ND 20 260 ND 260 300 ND 300 8 ND 8 17 ND 17 25 ND 25 20 ND 20
Surveyors Creek PCC ND PCC PCC ND PCC PCC ND PCC PCC ND PCC PCC ND PCC PCC ND PCC PCC ND PCC
Wild Boar Creek PCC ND PCC PCC ND PCC PCC ND PCC PCC ND PCC PCC ND PCC PCC ND PCC PCC ND PCC
Station Creek PCC ND PCC PCC ND PCC PCC ND PCC PCC ND PCC PCC ND PCC PCC ND PCC PCC ND PCC
Saltwater Creek PCC ND PCC PCC ND PCC PCC ND PCC PCC ND PCC PCC ND PCC PCC ND PCC PCC ND PCC
Cassowary Creek PCC ND PCC PCC ND PCC PCC ND PCC PCC ND PCC PCC ND PCC PCC ND PCC PCC ND PCC
Rol
lings
tone
Cre
ek
Leichhardt Creek 20 ND 20 260 ND 260 300 ND 300 8 ND 8 17 ND 17 25 ND 25 20 ND 20
Christmas Creek 20 ND 20 260 ND 260 300 ND 300 8 ND 8 17 ND 17 25 ND 25 20 ND 20
Two Mile Creek 20 ND 20 260 ND 260 300 ND 300 8 ND 8 17 ND 17 25 ND 25 20 ND 20
Bluewater Creek 20 ND 20 260 ND 260 300 ND 300 8 ND 8 17 ND 17 25 ND 25 20 ND 20
Deep Creek 20 ND 20 260 ND 260 300 ND 300 8 ND 8 17 ND 17 25 ND 25 20 ND 20
Blu
ewat
er C
k
Healy Creek 20 ND 20 260 ND 260 300 ND 300 8 ND 8 17 ND 17 25 ND 25 20 ND 20
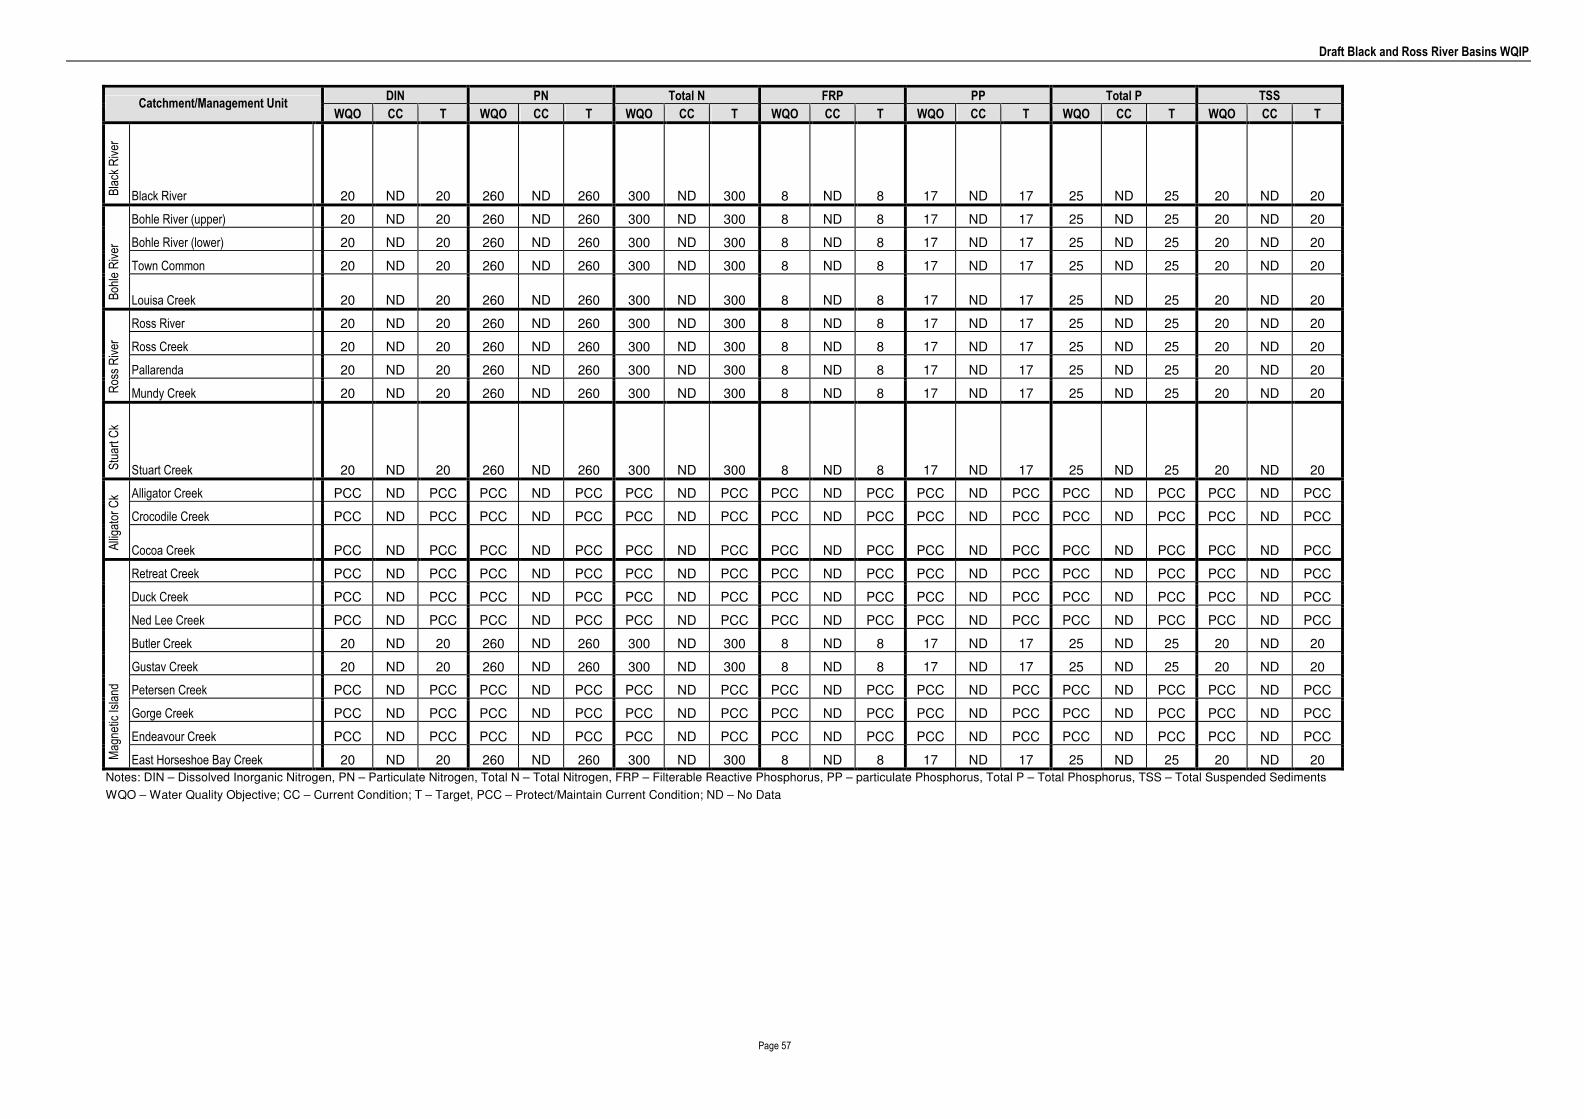
Draft Black and Ross River Basins WQIP
Page 57
DIN PN Total N FRP PP Total P TSS Catchment/Management Unit
WQO CC T WQO CC T WQO CC T WQO CC T WQO CC T WQO CC T WQO CC T Bla
ck R
iver
Black River 20 ND 20 260 ND 260 300 ND 300 8 ND 8 17 ND 17 25 ND 25 20 ND 20
Bohle River (upper) 20 ND 20 260 ND 260 300 ND 300 8 ND 8 17 ND 17 25 ND 25 20 ND 20
Bohle River (lower) 20 ND 20 260 ND 260 300 ND 300 8 ND 8 17 ND 17 25 ND 25 20 ND 20
Town Common 20 ND 20 260 ND 260 300 ND 300 8 ND 8 17 ND 17 25 ND 25 20 ND 20
Boh
le R
iver
Louisa Creek 20 ND 20 260 ND 260 300 ND 300 8 ND 8 17 ND 17 25 ND 25 20 ND 20
Ross River 20 ND 20 260 ND 260 300 ND 300 8 ND 8 17 ND 17 25 ND 25 20 ND 20
Ross Creek 20 ND 20 260 ND 260 300 ND 300 8 ND 8 17 ND 17 25 ND 25 20 ND 20
Pallarenda 20 ND 20 260 ND 260 300 ND 300 8 ND 8 17 ND 17 25 ND 25 20 ND 20
Ros
s R
iver
Mundy Creek 20 ND 20 260 ND 260 300 ND 300 8 ND 8 17 ND 17 25 ND 25 20 ND 20
Stu
art C
k
Stuart Creek 20 ND 20 260 ND 260 300 ND 300 8 ND 8 17 ND 17 25 ND 25 20 ND 20
Alligator Creek PCC ND PCC PCC ND PCC PCC ND PCC PCC ND PCC PCC ND PCC PCC ND PCC PCC ND PCC
Crocodile Creek PCC ND PCC PCC ND PCC PCC ND PCC PCC ND PCC PCC ND PCC PCC ND PCC PCC ND PCC
Alliga
tor C
k
Cocoa Creek PCC ND PCC PCC ND PCC PCC ND PCC PCC ND PCC PCC ND PCC PCC ND PCC PCC ND PCC
Retreat Creek PCC ND PCC PCC ND PCC PCC ND PCC PCC ND PCC PCC ND PCC PCC ND PCC PCC ND PCC
Duck Creek PCC ND PCC PCC ND PCC PCC ND PCC PCC ND PCC PCC ND PCC PCC ND PCC PCC ND PCC
Ned Lee Creek PCC ND PCC PCC ND PCC PCC ND PCC PCC ND PCC PCC ND PCC PCC ND PCC PCC ND PCC
Butler Creek 20 ND 20 260 ND 260 300 ND 300 8 ND 8 17 ND 17 25 ND 25 20 ND 20
Gustav Creek 20 ND 20 260 ND 260 300 ND 300 8 ND 8 17 ND 17 25 ND 25 20 ND 20
Petersen Creek PCC ND PCC PCC ND PCC PCC ND PCC PCC ND PCC PCC ND PCC PCC ND PCC PCC ND PCC
Gorge Creek PCC ND PCC PCC ND PCC PCC ND PCC PCC ND PCC PCC ND PCC PCC ND PCC PCC ND PCC
Endeavour Creek PCC ND PCC PCC ND PCC PCC ND PCC PCC ND PCC PCC ND PCC PCC ND PCC PCC ND PCC
Mag
netic
Isla
nd
East Horseshoe Bay Creek 20 ND 20 260 ND 260 300 ND 300 8 ND 8 17 ND 17 25 ND 25 20 ND 20
Notes: DIN – Dissolved Inorganic Nitrogen, PN – Particulate Nitrogen, Total N – Total Nitrogen, FRP – Filterable Reactive Phosphorus, PP – particulate Phosphorus, Total P – Total Phosphorus, TSS – Total Suspended Sediments
WQO – Water Quality Objective; CC – Current Condition; T – Target, PCC – Protect/Maintain Current Condition; ND – No Data

Draft Black and Ross River Basins WQIP
Page 58
Table 5-10 Marine Ambient WQOs and 2021 Targets (µg/L)
Notes: DIN – Dissolved Inorganic Nitrogen, PN – Particulate Nitrogen, Total N – Total Nitrogen, FRP – Filterable Reactive Phosphorus, PP – particulate Phosphorus, Total P – Total Phosphorus, TSS – Total Suspended Sediments
WQO – Water Quality Objective; CC – Current Condition; T – Target, PCC – Protect/Maintain Current Condition; ND – No Data. Secchi depth is metres. Revised 9/6/09
DIN PN Total N FRP PP Total P TSS Chlorophyll a Secchi Depth Catchment/Management Unit
WQO CC T WQO CC T WQO CC T WQO CC T WQO CC T WQO CC T WQO CC T WQO CC T WQO CC T
West Coast PCC ND PCC PCC ND PCC PCC ND PCC PCC ND PCC PCC ND PCC PCC ND PCC PCC ND PCC PCC ND PCC PCC ND PCC
Picnic Bay PCC 2.1 3 PCC 22.8 23 PCC 91 92 PCC ND PCC PCC 3.81 3 PCC 19.205 15 PCC 2.48 2 PCC 0.96 0.8 PCC 4.25 5
Nelly Bay PCC ND PCC PCC ND PCC PCC ND PCC PCC ND PCC PCC ND PCC PCC ND PCC PCC ND PCC PCC ND PCC PCC ND PCC
Arcadia PCC 3.1 4 PCC 20.7 20 PCC 89.8 70 PCC ND PCC PCC 4.55 3 PCC 13.01 10 PCC 4.52 4 PCC 0.88 0.7 PCC 4 5
Radical Bay PCC ND PCC PCC 13.6 14 PCC 71.4 72 PCC ND PCC PCC 1.7 2 PCC 18.45 15 PCC 2.07 2 PCC 0.26 0.3 PCC 9.5 10
Horseshoe Bay PCC ND PCC PCC 17.9 18 PCC 89 90 PCC ND PCC PCC 3.4 3.5 PCC 22.72 18 PCC 4.14 3 PCC 0.45 0.45 PCC ND PCC
Five Beach Bay PCC ND PCC PCC ND PCC PCC ND PCC PCC ND PCC PCC ND PCC PCC ND PCC PCC ND PCC PCC ND PCC PCC ND PCC
Rollingstone Bay PCC ND PCC PCC ND PCC PCC ND PCC PCC ND PCC PCC ND PCC PCC ND PCC PCC ND PCC PCC ND PCC PCC ND PCC
West Channel 9 ND 9 20 40.44 30 29 138 29 6 ND 6 2.8 6.07 5 8.8 17.93 14 2 6 4 0.45 0.94 0.45 ND 2.13 ND
Cleveland Bay 9 ND 9 20 ND 20 29 ND 29 6 ND 6 2.8 ND 2.8 8.8 ND 8.8 2 ND 2 0.45 ND 0.45 ND ND ND
Nea
r C
oast
al
Halifax Bay 9 ND 9 20 ND 200 29 ND 29 6 ND 6 2.8 ND 2.8 8.8 ND 8.8 2 ND 2 0.45 ND 0.45 ND ND ND
Mar
ine
Outer Marine ND ND ND 17 ND 17 ND ND ND ND ND ND 1.9 ND 1.9 ND ND ND 0.7 ND 0.7 0.4 ND 0.4 17 ND 17

Draft Black and Ross River Basins WQIP
Page 59
5.4.3 End of Catchment Loads
In order to determine sources of pollutants and end of catchment loads for TSS and nutrients a
modelling study was undertaken using input from the ACTFR water quality event monitoring
(2006/07 and 2007/08 wet seasons) and other local water quality and climatic data. The sub
catchment boundaries used for modelling purposes are shown in Figure 5-1. Modelled baseline
loads for the Black Ross WQIP sub basins are shown in Table 5-11 without STPs and in Table 5-12
with STPs.
Table 5-11 Modelled Loads by WQIP Sub Basin (No STPs)
Area Flow TSS TN TP Sub Basin
No. Hectares ML/Year kg/Year kg/Year kg/Year
Crystal Creek 1 24,074 239,443 5,509,675 90,060 9,376
Rollingstone Creek 2 21,986 144,387 1,601,949 40,420 4,018
Bluewater Creek 3 28,973 145,698 2,805,025 92,637 4,637
Black River 4 30,258 114,396 7,190,500 69,131 10,016
Black Basin total 105,291 643,925 17,107,149 292,248 28,047
Bohle River 5 33,155 131,708 9,289,250 78,275 14,136
Lower Ross River 6 13,478 53,714 4,202,975 33,097 6,976
Upper Ross River 7 (75,950) 196,870 8,103,000 100,375 12,775
Stuart Creek 8 11,158 47,483 1,649,800 18,944 2,957
Alligator Creek 9 27,365 104,834 2,103,495 42,687 4,807
Ross Basin total 85,155 534,608 25,348,520 273,378 41,651
Magnetic Island 10 4,923 27,390 341,983 6,282 943
Black Ross Total 195,369 1,205,923 42,797,652 571,908 70,641
Note: Alligator Creek sub basin has been grouped with the Ross River AWR Basin. It is part of the Haughton
River AWR Basin. Loads do not include point source discharges. Areas are from modelled results except for
Upper Ross River (in brackets). Flow figures updated using 9/6/09 data
Table 5-12 Modelled Loads by WQIP Sub Basin With STPs (2007)
Area Flow TSS TN TP Sub Basin
No. Hectares ML/Year kg/Year kg/Year kg/Year
Crystal Creek 1 24,074 239,443 5,509,675 90,060 9,376
Rollingstone Creek 2 21,986 144,387 1,601,949 40,420 4,018
Bluewater Creek 3 28,973 145,698 2,805,025 92,637 4,637
Black River 4 30,258 114,396 7,190,500 70,591 11,063
Black Basin 105,291 643,925 17,107,149 293,708 29,095
Bohle River 5 33,155 131,708 9,289,250 191,753 29,795
Lower Ross River 6 13,478 53,714 4,202,975 33,097 6,976
Upper Ross River 7 (75,950) 196,870 8,103,000 100,375 12,775
Stuart Creek (pre) 8 11,158 47,483 1,649,800 200,020 58,400
Stuart Creek (post) 8 11,158 47,483 1,649,800 61,320 20,039
Alligator Creek 9 27,365 104,834 2,103,495 42,687 4,807
Ross Basin 85,155 534,608 25,348,520 429,232 74,391
Magnetic Island 10 4,923 27,390 341,983 6,282 943
Black Ross Total 195,369 1,205,923 42,797,652 729,223 104,429
Note: Yellow shaded rows are different to load values in Table 5-11 due to input to sub basins from STPs. Tan
shaded row is load value prior to the Cleveland Bay STP upgrade. Flow figures updated using 9/6/09 data

Draft Black and Ross River Basins WQIP
Page 60
Figure 5-1 Modelled Sub Catchments
Based on the modelled loads, with and without STP contributions, the relative contributions from
STPs by sub basin, basin and WQIP area have been calculated (see Table 5-13).
Table 5-13 STP Load Contributions
Total N (kg/yr) Difference Total P (kg/yr) Difference Sub Basin
With Without kg/yr % With Without kg/yr %
Black River 70,591 69,131 1,460 2.1 11,063 10,016 1,047 9.5
Black Basin 293,708 292,248 1,460 0.5 29,095 28,047 1,047 3.6
Bohle River 191,753 78,275 113,478 59.2 29,795 14,136 15,659 52.6
Stuart Creek 61,320 18,944 42,376 69 20,039 2,957 17,082 85
Ross Basin 429,232 273,378 155,854 36.3 74,391 41,651 32,740 44
Black Ross Total 729,223 571,908 157,315 21.6 104,429 70,641 33,788 32.5
Note: Load contribution totals for basins and the Black Ross WQIP area are from all sources (point source and
diffuse) and all sub basins. Only the sub basins with contributions from STPs have been included in the table.
For a list of all load contributions see Table 5-11 and Table 5-12.
Point source loads will be reduced over the next three years as a result of upgrades to existing
STPs. Expected load reductions from STPs along with post upgrade increases associated with
population growth are listed in Error! Not a valid bookmark self-reference..

Draft Black and Ross River Basins WQIP
Page 61
Table 5-14 Point Source Load Reduction Figures
Upgrade
status
Years Total Flows
(ML/day)
Total TSS
loads (t/yr)
Total TN
loads (t/yr)
Total TP loads
(t/yr)
Pre 2006 41.54 91.03 296.32 72.08
2008 41.54 91.03 157.41 33.83
2010 43.24 94.77 163.29 36.68
2012 48.43 106.14 70.02 23.92
2021 55.65 121.97 92.10 28.67
STP upgrade
scenario data
2045 74.43 163.12 124.64 37.06
Note: Loads are in tonnes per year.
Projected increases in diffuse source pollutant loads have been calculated from modelling results
and are presented in Table 5-15. Anticipated load reduction as a result of improved management
practices have also been modelled and these will be used to establish draft load reduction targets
following analysis of implementation costs. Potential diffuse source TSS load reductions from the
modelling are listed in Table 5-16.

Draft Black and Ross River Basins WQIP
Page 62
Table 5-15 Modelled End of Catchment Loads
2005 2005 2005 2021 2021 2021 2045 2045 2045 2045
Area Flow TSS TN TP TSS TN TP Flow TSS TN TP Sub Basin
Hectare ML/Year kg/Year kg/Year kg/Year kg/Year kg/Year kg/Year ML/Year kg/Year kg/Year kg/Year
Crystal Creek 24,074 239,443 5,509,675 90,060 9,376 6,419,255 97,680 10,272 239,042 8,013,575 109,657 11,798
Rollingstone Creek 21,986 144,387 1,601,949 40,420 4,018 2,071,368 45,353 4,481 14,5008 3,015,229 53,400 5,397
Bluewater Creek 28,973 145,698 2,805,025 92,637 4,637 2,802,835 95,134 4,510 144,566 2,805,390 98,915 4,325
Black River 30,258 114,396 7,190,500 69,131 10,016 7,403,660 70,620 10,239 114,433 7,723,400 72,854 10,574
Black Basin 105,291 643,925 17,107,149 292,248 28,047 18,697,118 308,787 29,503 643,048 21,557,594 334,825 32,093
Bohle River 33,155 131,708 9,289,250 78,275 14,136 8,884,961 75,103 13,527 133,397 9,786,928 78,268 14,333
Lower Ross River 13,478 53,714 4,202,975 33,097 6,976 4,989,039 36,446 7,676 54,795 6,390,420 4,2085 8,933
Upper Ross River 196,870 8,103,000 100,375 12,775 10,147,000 110,157 14,731 196,139 13,213,000 124,830 17,666
Stuart Creek 11,158 47,483 1,649,800 18,944 2,957 2,427,980 23,543 3,774 47,483 3,595,250 30,441 5,001
Alligator Creek 27,365 104,834 2,103,495 42,687 4,807 3,789,503 53,212 6,581 103,775 6,318,515 69,000 9,242
Ross Basin 85,155 534,608 25,348,520 273,378 41,651 30,238,483 298,460 46,290 535,589 39,304,113 344,624 55,174
Magnetic Island 4,923 27,390 341,983 6,282 943 344,275 6,214 947 27,489 484,990 6,523 1,084
Black Ross Total 195,369 1,205,923 42,797,652 571,908 70,641 49,279,876 613,461 76,739 1,206,126 61,346,696 685,973 88,351
Change from base 0 0 0 0 0 6,482,225 41,553 6,097 21,688 16,205,562 103,884 15,243
% change from base 15.1 7.3 8.6 1.8 43.3 20.0 25.1
Note: 2005 figures updated using 9/6/09 data. Interpolated figures not updated.
Note: If the increase in pollutants is a result of conversion of ‘rural’ land to urban land use then the target load reductions could equate to the WSUD objectives multiplied by the
projected increases i.e. TSS 80% TN 65% TP 40%, for those areas. Grazing can be calculated from NQDT projections and natural areas remain the same.

Draft Black and Ross River Basins WQIP
Page 63
Table 5-16 Potential TSS Load Reductions
2045 2045 2045 2045 2045 2045 2045 2045 2045 2045
Loads GF WSUD Change % All WSUD Change % Rural BMP Change % Sub Basin
t/year t/Year t/Year t/Year t/Year t/Year t/Year kg/Year
Crystal Creek 8,019 7,847 172 2 7,847 172 2 3,349 4,670 60
Rollingstone Creek 3,017 2,841 177 6 2,736 281 9 1,656 1,362 48
Bluewater Creek 2,807 2,803 4 0 2,778 29 1 1,735 1,072 38
Black River 7,729 7,729 0 0 7,433 296 4 4,489 3,240 42
Black Basin 21,572 21,220 353 2 20,795 777 4 11,229 10,343 49
Bohle River 9,794 8,972 822 8 7,268 2,526 26 6,931 2,863 32
Lower Ross River 6,395 6,221 174 3 3,760 2,634 41 4,716 1,678 27
Upper Ross River 13,222 13,222 0 0 13,222 0 0 6,940 6,282 48
Stuart Creek 3,598 3,598 0 0 3,568 29 1 1,855 1,742 48
Alligator Creek 6,323 6,323 0 0 6,323 0 0 3,009 3,314 52
Ross Basin 39,331 38,335 996 3 34,141 5,190 13 23,452 15,879 41
Magnetic Island 485 384 101 21 214 271 56 485 0 0
Black Ross Total 61,389 59,939 1,450 2 55,150 6,238 10 35,166 26,223 44
Notes: GF WSUD denotes potential load reduction from Greenfield (new) development with 100% adoption of water sensitive urban design (WSUD). All WSUD
denotes adoption of WSUD measures across all urban areas and Rural BMP denotes 100% uptake of farming best management practice in rural areas.
Potential load reductions are being reviewed in relation to implementation costs for urban and rural management actions in order to set realistic load reduction targets. These will be added to the draft WQIP website as soon as they are available

Draft Black and Ross River Basins WQIP
Page 64
5.5 Environmental Flow
Environmental flow is a term used to express the amount/proportion of the natural flow of a
watercourse required to maintain aquatic habitat health and ecological function in waterways and
waterbodies. Environmental flow is usually related to regulated waterways where there are
impoundments. Environmental flow also applies to unregulated waterways where water entitlements
permit landowners to extract water for irrigation and other purposes.
There are two regulated systems in the Black/Ross WQIP area i.e. the Ross River and Crystal
Creek. Both of these systems are the subject of an Interim Resource Operations Licence (IROL)
under the Water Act 2000 (Qld).
The remainder of the WQIP area is subject to the general provisions of the Water Act with regard to
taking water from a watercourse or other waterbody. If a landowner wants to take water from a
stream, lake or other waterbody they are required to apply to the Department of Natural Resources
and Water (DNRW) for a water licence.
If a Water Resource Plan (WRP) of Resource Operations Plan (ROP) is in place for an area then the
ROP can define the process for granting a water licence in that area. This is not the case for the
majority of the Black Basin and the sub basins of the Ross Basin at present. Unregulated systems
and the two regulated systems are discussed below in relation to current extraction and flow
regimes.
5.5.1 Unregulated systems
The allocation of water licences, previously permits, has largely been based on an incremental
system which started in the late 1960's and accelerated during the 70's (an unusually wet period),
resulting in over allocation in some instances. This means the entitlements are not achievable in
many years and there is no actual use/extraction i.e. water allocation is higher than actual extraction.
New entitlements in these watercourses are generally restricted to flood harvesting to off stream
storages, based on minimum start up flows. As yet here has been no systematic approach in the
Black and Ross Basins to determine sustainable yields and environmental flows. In the past there
has been some attempt to restrict entitlements based on maintenance of minimum flows and
protection of waterholes (pers. comm. Ian Boyce DERM - NRW).
As the majority of the streams in the Black and Ross Basins are ephemeral it is not an easy matter to
determine sustainable yield based on an ‘average’ annual flow. Allowing an allocated amount of
water harvesting when a stream has reached a minimum flow level is at present the best approach to
maintaining adequate flow for environmental purposes in the ephemeral streams of the Townsville
coastal Dry Tropics. A WRP will be prepared for Black and Ross Basins by DERM sometime in the
future.
Table 5-17 Extraction Rates and Flow for Black and Ross Basins
Name
ML (by
ha)
Alloc.
(ML)
No. of
Alloc. Flow est. % of flow
Crystal Creek 1088 8
Bullocky Toms Creek 437.6 3
UT Bullocky Toms Creek 48 1
Little Crystal Creek 280 3
Crystal Creek and tributaries 1854 15
UT Halifax Bay (Spring Gully) 264 28 3
Ollera Creek 320 2
Hencamp Creek 448 3
Crystal Creek Sub basin 2913.6 23 288,712 1%¹

Draft Black and Ross River Basins WQIP
Page 65
Crystal Creek Sub basin 21,500 1 288,712 7.4%²
Rollingstone Creek 792 11
Rollingstone Creek West 200 1
Leichhardt Creek 208 1
Rollingstone Creek Sub Basin 1200 14 169,790 <1%
Sleeper Log Creek 4 1
Bluewater Creek 143.2 27.4 37
Healy Creek 8 1
Bluewater Creek Sub Basin 182.6 39 155,189 <1%
Black River 544 56.5 10 82,283ML*
Alick Creek 32 1
UT Canal Creek 160 1
Black River Sub Basin 792.5 12 116,431 <1%
Black Basin Total 4976.8 111.8 87
Black Basin Total Megalitres 5,088.6 87 730,121 <1%
Black Basin Total Megalitres ² 26,589 88 730,121 3.6%
Ross River 30.4 75,000 3 125,784ML**
Lansdowne Creek 1,360 9
UT Ross River 240 1
Lower Ross River Sub Basin 60,464
Ross River Sub Basin 76,630.4 186,000 41%
Bohle River 50 1 133,854 <1%
Stuart Creek 92.8 2 41,943 <1%
Alligator Creek 616.8 21 116,589 <1%
Gustav Creek (Magnetic Island) 1.8 1
Ross Basin Totals 2,340 75,051.8 38
Ross Basin Total Megalitres 77,392 38 478,386 7%
Black/Ross WQIP total ML 82,480 125 1,208,500 6.8%
Black/Ross WQIP total ML² 103,980 126 1,208,500 8.6%
Source: DNRW “WERD periodic reports at 09 02 2009”
Notes: These are allocations and not an indication of actual use. In the ML (by ha) column nominal mega litre
(ML) allocations have been calculated where allocations were provided in hectares (a use rate of 8ML per
hectare per annum is assumed). This was the old style of allocation i.e. by land area to be irrigated. Flow
estimate is annual average flow in mega litres. * 117002A Black River at Bruce Highway. ** 118104A Ross
River at Ross Dam Headwater. Other flows are from WaterCAST modelled outputs (pre 9/6/09 figures used).
If the Ross Dam allocation is excluded the extraction rate for all waterways in the Black and Ross Basins is
approximately 7,480 Ml per annum.
¹ This figure does not take into account extraction associated with the water drawn from Crystal Creek as part of
the IROL. ² Figures include the total take allowable from the Paluma-Crystal water supply scheme.
Surface water extraction figures for the streams of the Black and Ross Basins, as provided by DERM
(formerly DNRW), are included in Table 5-17 along with stream flow estimates. It should be noted
that the figures provided in Table 5-17 are indicative only and have not been validated (see
associated Notes also). When a Water Resource Plan and Resource Operation Plan is in place for
the Black and Ross River Basins a set of validated entitlements will be published by DERM.

Draft Black and Ross River Basins WQIP
Page 66
5.5.2 Regulated systems
The two regulated systems in the Black/Ross WQIP are at the opposite ends of the WQIP area with
the Crystal Creek system having Wet Tropics features i.e. perennial flow, while the Ross River
system is a more typical Dry Tropics ephemeral system. Due to its ephemeral nature and the
location of three weirs downstream of the dam the Ross River Water Supply Scheme does not
provide for environmental flows. The main features of both regulated systems are discussed in brief
below.
5.5.3 Paluma-Crystal Water Supply Scheme
An interim water allocation was granted to Townsville City Council (TCC) on 30 April 2008 to service
the Paluma-Crystal Water Supply Scheme. The allocation involves the taking of water from the
Paluma Dam storage, located on Swamp Creek, and Crystal Creek (Crystal Creek Weir). This is a
high priority entitlement of 21,571 megalitres per (water) year. There are other entitlements
downstream of Crystal Creek Weir (presumably lower priority).
The Paluma-Crystal Water Supply Scheme involves extraction of water from Crystal Creek and
Swamp Creek, as well as inter-catchment transfers. Paluma Dam (11,400ML commandable storage)
is located in the Swamp Creek catchment (Burdekin Basin) and water is transferred from the dam to
Crystal Creek (Crystal Creek catchment/Black Basin) when required.
Water is drawn from Crystal Creek Weir and piped via the Mt Spec pipeline to supply points. While
Crystal Creek is a perennial stream it has characteristic wet and dry season flow patterns. Crystal
Creek Weir overflows at median flows of 24ML/day and average flows 62ML/day. Low flows can be
as little as 10ML/day in drier periods. It appears from the little data available, the flow regime of
Crystal Creek has periodic pulses overtopping a low base flow during the 'dry' season.
The maximum allowable take of water from Crystal Creek weir is 59.1 ML/day, however, as noted,
this is probably not achievable and a more realistic maximum extraction rate is in the vicinity of 40
ML/day. The average flows of 62 ML/day may also be misleading, as it is believed that TCC often
supplement the volume with water from Paluma Dam to enable extraction of between 30 and 40
ML/day.
Crystal Creek Weir has a capacity of 1ML; therefore pass flows are dependant on three factors:
• Natural Crystal Creek flows, plus
• Water releases from Paluma Dam to Crystal Creek, minus
• Water extraction.
It is recognised in the IROL that due to the seasonal variation in flows the water supply extraction
from Crystal Creek Weir can impact downstream entitlements and other interests e.g. environment
and public. To accommodate downstream requirements, including environmental flow, the IROL
provides for a diversion of water from Paluma Dam to Crystal Creek when the natural flow upstream
of Crystal Creek Weir has been less than 65ML/day for a period of 30 days or more. In this event a
minimum of 35ML/day is required to be diverted from Paluma Dam to Crystal Creek for a period of
two days. In the event that no water has spilled over the weir for a period of nine months, and there
has been flow in Crystal Creek, then TCC is required to allow 1ML/day of water to spill over the weir
for a period of ten days. While currently correct these figures may change when a WRP is prepared
for the Black and Ross Basins.

Draft Black and Ross River Basins WQIP
Page 67
5.5.4 Ross River Water Supply Scheme
An interim water allocation was granted to Townsville City Council on 30 April 2008 to service the
Ross River Supply Scheme. The allocation involves the taking of water from the Ross River (Ross
River Dam and Black Weir) with an entitlement of 75,000 megalitres per (water) year. The Ross
River Water Supply Scheme also has the option of transferring water from the Burdekin-Haughton
Water Supply Scheme, via the Haughton pipeline, into Toonpan Creek, which then flows into the
Ross River Dam.
The associated IROL permits Townsville City Council (formerly NQ Water) to “take a volume
equivalent to the amount required to meet town water supply demands” (nominally 75,000 ML)
(DNRW Information Notice 28 April 2008). Water managed under the IROL includes that impounded
by the Ross River Dam and Black Weir. Black Weir is the emergency supply (approximately two
weeks supply) in the event that water can’t be drawn from Ross River Dam. The IROL is an interim
arrangement until a WRP and ROP are prepared for the area.
Following the upgrade of the Ross River Dam the commandable (extractable) storage capacity is
233,000ML. Black Weir has a total storage capacity of 3,780ML with a commandable storage of
2,800ML. The only provision for release of water is to maintain Black Weir at a level not lower than
2.5 metres below its full supply (EL 11.31m AHD).
The licensee releases to the Ross River (Black Weir) below the Ross River storage area, all water
that has been collected by the Ross River Dam collection system. This collection system aims to
maintain groundwater levels below the dam wall at a desired level. The licensee also tests the water
quality to assess dam wall integrity.
5.5.5 North Queensland Regional Water Supply Strategy
The Strategy area takes in stream catchments in the coastal strip from Bowen to the northern
boundary of Townsville i.e. Crystal Creek, and closely mirrors the Burdekin Dry Tropics NRM area
(equivalent to the combined Black/Ross and Burdekin WQIP areas). The various stages in the
development process of the North Queensland Regional Water Supply Strategy (NQRWSS) are
listed in the text box below.
It should be noted that the NQRWSS is not a statutory document and will not impact surface water
allocations in the Black/Ross WQIP area.

Draft Black and Ross River Basins WQIP
Page 68
Some of the research and investigations, which are well advanced, may be useful to inform the Black
Ross WQIP in terms of background information relevant to environmental flows and aquatic
ecosystem health e.g. current extraction rates as a percentage of flow and potential future demand.
It is assumed that the information collated for the NQRWSS will be available for inclusion in any
future WRP and ROPs prepared for the Black and Ross Basins.
5.6 Aquatic Ecosystem Health
While physico-chemical properties are important for waterway health there are a number of other
physical and biological factors that impact aquatic ecosystem health that can be readily measured
and contribute to our understanding of water quality issues and areas for improvement.
A draft water quality report card has been developed as part of the Black/Ross WQIP and includes a
number of indicators that are relevant to aquatic ecosystem health. The key indicators for the report
card are grouped into the following categories:
1) Water quality (physico-chemical);
2) Freshwater fish (aquatic ecosystem);
3) Aquatic invertebrates (aquatic ecosystem);
4) Aquatic vegetation (aquatic ecosystem);
5) Riparian vegetation (catchment condition);
6) Channel and floodplain features (catchment condition).
While all groupings can be related to aquatic ecosystem health, the three principal indicator groups
are freshwater fish, aquatic invertebrates and aquatic vegetation. Flow regime modification is also a
critical factor for aquatic ecosystem health particularly in perennial streams. Aquatic ecosystems of
ephemeral streams are probably less susceptible to impacts of flow modification as they are adapted
to the seasonal variations of high and no flow. This is of course a generalisation and flow
modification can also be detrimental to ephemeral systems.
Regional Water Supply Strategy Process
1. Research Phase – Define supply objectives
• Current supply/demand situation;
• Future demand scenarios;
• Establish water supply objectives.
2. Investigation Phase – Evaluate supply options in meeting supply objectives
• Infrastructure options;
o Stage 1 – selection of viable projects based on course economic/engineering filter,
o Stage 2 – refinement of viable projects based on triple bottom line and other
criteria.
• Non-infrastructure options;
• Evaluate options against supply objectives to develop draft Strategy.
3. Development Phase – Develop and consult on a draft Strategy taking in best options
• Consult with internal stakeholders;
• Incorporate stakeholder comments and revise draft Strategy.
4. Pre-approval Phase – Seek state-agency support, then Cabinet approval for draft Strategy
• Consult with State Government agencies;
• Lodge Cabinet Submission for approval of proposed final Strategy.
5. Approval and Implementation Phase
• Implementation of approved Strategy and programme of works.

Draft Black and Ross River Basins WQIP
Page 69
While some studies have been done that are relevant to aquatic ecosystem health the range of
available information has not been collated for the Black/Ross WQIP area as yet. In the absence of
current condition information and local aquatic ecosystem health guidelines the generic aquatic
ecosystem health target is to improve the current condition of waterways by at least one report card
(see Connell Wagner 2009) grade for a minimum of one out of the six indicator groups by 2014.

Draft Black and Ross River Basins WQIP
Page 70
6. Water Quality Improvement Management Actions
6.1 Introduction
Management options were identified that have the potential to improve water quality in line with the
environmental values identified by the community, and to achieve the water quality objectives and
load reduction targets identified in the previous section. The options were considered on the basis of
likely water quality improvement results (based on previous experiences and catchment modelling
results), value for money, social acceptability and practicality of implementation i.e. available
resources and timeframes.
Information about the management options considered including associated costs and benefits can
be found in the background report - Black Ross Water Quality Improvement Plan Options, Costs and
Benefits (Gunn, Manning and McHarg 2009).
To better facilitate land based management practice improvements the Black Ross WQIP area was
initially separated into two predominant land use categories i.e. rural and urban. It was envisaged
that peri-urban areas would be included in the urban category as they are potential future urban
areas and need to be considered in growth scenarios and urban planning.
It became apparent during the development of the WQIP that the peri-urban ‘zone’, including rural
residential areas in close proximity to the urban areas, needed to be classified as a separate major
land use category so that peri-urban specific issues could be addressed using appropriate
measures. Elements of management measures from both the rural and urban areas will also be
adopted as appropriate to the situation.
While many of the management actions are directed at specific land uses and stages of
development (see section 3) some of the management actions will be common to the whole of the
Black Ross WQIP area, and especially the enabling actions and programs.
This section provides a description of the management actions selected for urban, peri-urban and
rural areas as well as cross-catchment and cross-land use actions.
6.2 Priority Management Actions
Priority actions have been selected to address the issues that have the most impact on water quality
in the urban, peri-urban and rural environments. The priority actions have been proven to be
effective locally or in other parts of Australia, are based on available sound science and are
considered to be the best value in terms of benefits for water quality improvement (see Gunn,
Manning and McHarg 2009).
Where there was a moderate to high uncertainty about the potential benefit or practicality of
management options investigated the subsequent implementation actions are based on:
• Gathering additional data to determine the magnitude of the issue and the potential benefits
of interventions in relation to the issue,
• Feeding ‘new’ information into models such as the Bayesian Belief Network to identify the
best management interventions on a catchment basis,
• Undertaking socio-economic studies to determine the most effective course of action to
achieve a particular behaviour change e.g. for uptake of water quality improvement
management practice, and
• Determining the effectiveness of interventions through pilot programs and case studies.

Draft Black and Ross River Basins WQIP
Page 71
Priority management actions have initially been divided into major land use groupings i.e. urban,
peri-urban and rural, with further internal divisions based on more specific land uses (see Table 3-1)
and/or development stage. The main enabling actions, designed to increase capacity to undertake
on ground actions and influence behaviour change, have been listed separately as the actions are
generally not specific to a particular land use.
The priority management action topics are referenced to the main land use categories with a
corresponding priority and relevance rating as shown in Table 6-1.
The priority management actions selected to implement the Black Ross WQIP are discussed below.
6.2.1 Project management
Project management and coordination, communications and information management are
overarching enabling ‘administrative’ actions required for implementation of the WQIP. It is proposed
that Creek to Coral (Townsville City Council) manages the delivery of the implementation of the
Black Ross WQIP in a similar manner used to prepare the WQIP.
To make project management of the WQIP more effective a management system will be developed
based on ISO 9001, and an adaptive management and planning approach used to implement this
WQIP. The management system will be integrally linked to the communication strategy and assist
with data and information management as part of the overall adaptive management framework.

Draft Black and Ross River Basins WQIP
Page 72
Table 6-1 Priority Management Action Areas
Rural and Peri-urban Urban
No.
Action area
Grazing
Intensive
agricu
lture
Natural
areas
Ross Dam
catchmen
t
Peri-urban
Urban
(diffuse)
Urban
(point )
1 Erosion and Sediment Control for development O L O H H H O
2 Site based Stormwater Management Plans for development O O O H H H O
3 Water Sensitive Urban Design (WSUD) guideline finalisation and adoption O O O M H H L
4 Develop the Coastal Dry Tropics Guide for Urban Water Management O O O H H H M
5 Urban Stormwater Quality Management Plan integration O O O L M H O
6 Urban stormwater treatment trains O O O O L H O
7 WSUD retrofit O O O O H H O
8 Develop peri-urban catchment management guidelines and implementation activities M M L H H L O
9 Water Resource Catchment Management (Ross River Dam) H M L H H M O
10 Promote “Managing for WQ within grazing lands of the Burdekin Catchment” (BDT NRM) H O L H M O O
11 Promote management practice ABCD framework for sugar cane and horticulture (Mackay Whitsunday NRM) O H O M M L O
12 Legislation and Governance L L L H H H M
13 Policy investigations and development L M L H H H M
14 Planning Scheme studies and instruments review M M M H H H L
15 Strategic landscape mapping and habitat prioritisation H H H H H H L
16 Population Growth and Climate Change considerations M M M H H H H
17 Condition assessment and prioritisation H H M H H H L
18 Community Based Education and Involvement (CBEI) (awareness and capacity building) M M L H H H L
19 Reef Guardian Councils implementation O O O L H H H
20 Social learning and behaviour change studies (for determining effective management interventions) M M L H H H L
21 Market Based Instruments investigation L L L H H H L
22 Riparian zone rehabilitation H M M M H H O
23 Wetland restoration and construction M M M M H H O
24 Aquatic ecosystem health improvement H H M H H H L
25 Water quality monitoring and modelling (WQM and M) H H H H H H H
26 Integration, Communication, Monitoring, Evaluation and Adaptive Management M M M H H H M
Notes: H is high priority activity. Colour coding denotes the principal land use ‘style’ associated with high priority activity. There will be overlap into peri-urban areas from rural and
urban land uses (Purple = rural, green = peri-urban, yellow = urban), M is medium priority activity (grey) L is low priority activity O is not relevant or very low priority.

Draft Black and Ross River Basins WQIP
Page 73
6.3 Urban Management Actions
The priority management actions for reducing urban diffuse water quality pollutant loads are primarily
based around the stage of development and target short-term sediment ‘spikes’ as well as the long-
term leakage of sediment and nutrients from developed areas. Point source pollutants are discussed
first in terms of management actions in progress, expected load reductions and potential future
actions.
6.3.1 Point source
Wastewater treatment plants are the main point source contributor of water quality pollutants in the
Black Ross WQIP area with direct discharge of treated effluent to the Black River, Bohle River and
Stuart Creek sub basins. Targets and management actions to reduce point source pollutant loads
are listed in Table 6-2.
Table 6-2 Point Source Targets and Management Actions
Management Outcome PS: Management of point source pollution
To ensure that pollutants from point sources in Townsville are managed appropriately to reduce
their impact on receiving waters to acceptable levels
Target Target description Cost
PSRC 1.1 By 2012 total wastewater treatment plant pollutant loads are reduced
from 2006 loads by:
• 75% for total nitrogen (225 tonnes/yr)
• 65% for total phosphorus (48 tonnes/yr)
PSMA 1.1 By 2012 all wastewater treatment plants in Townsville are upgraded and
meet DERM (EPA) revised permit requirements
$189.4M
PSRC 1.2 By 2021 total wastewater treatment plant pollutant loads are further
reduced from 2012 levels by:
• 17% for total nitrogen (12 tonnes/yr)
• 24% for total phosphorus (5.8 tonnes/yr)
• 30% for total flows (14.4 ML/day)
PSMA 1.2 A effluent reuse scheme for treated effluent from the Cleveland Bay
Wastewater Treatment Plant is established and operational by 2021
$32.9M
Management action
PS1 Other options for ‘fit for purpose’ uses of treated wastewater are
investigated through Townsville’s Integrated Regional Water Strategy
(IRWS) and implemented as appropriate.
PS2 All water quality improvement devices are managed and maintained
appropriately over the life cycle of the asset to ensure that treatment
efficiencies are maintained
PS3 Sewer networks are managed appropriately and infrastructure is
upgraded in order to minimise wet weather overflows and to achieve zero
dry weather overflows.
$20.3M
PS4 Options to reduce the potential impact of wastewater concentrates,
toxicants, disinfection residuals, biosolids and salt loads are investigated
and implemented where appropriate
PS5 Ensure new and emerging point sources issues are identified and
addressed in a timely manner

Draft Black and Ross River Basins WQIP
Page 74
6.3.2 Developing urban areas
The main water quality pollutant issue associated with developing areas is soil erosion and the
subsequent movement of sediment to waterways in rainfall run-off. This is particularly relevant to
development on sloping sites; however, it is also an issue on flat sites and floodplains, albeit not as
severe. The management action targets (MATs) and priority actions for developing areas are listed in
Table 6-3. The actions are also relevant to ‘urban’ style development in rural and peri-urban areas,
as the general principles are the same.
Table 6-3 Urban Diffuse Developing Areas
Management Outcome 1: Management of development in urban and peri-urban areas
To ensure that all new development in Townsville is managed appropriately to achieve agreed water
quality improvement outcomes including sediment load reductions
MAT 1.1 Erosion and sediment control principles and measures implemented across all new
development by 2011 (1)
MAT 1.2 Locally specific guidelines and associated tools developed to support the
implementation of best practice stormwater management in Townsville by 2013 (2 and
4)
MAT 1.3 Water Sensitive Urban Design (stormwater) principles and actions are progressively
incorporated in the design of all new development reaching a 100% adoption rate by
2021 (3-5, 7 and 12-16)
No. Action area and tasks
Urban (some peri-urban overlap)
1 Erosion and Sediment Control for development and construction
• Review the effectiveness of current measures through the development assessment
process;
o TCC Erosion and Sediment Control Course,
o Planning Scheme provisions and use of Best Practice Erosion and Sediment
Control (IECA Australasia 2008)
o Monitoring and enforcement,
o State legislation especially EPAct and EP (Water) Policy.
• Link with the WSUD implementation process and the development of a new Planning
Scheme for Townsville;
• Incorporate risk management for climate change in all new policy settings and measures;
• Develop generic guidelines for developers/construction industry;
o General principles about erosion and sediment movement,
o Linkage with Stormwater Management Planning,
o Staged clearing commensurate with the progress of development.
• Monitoring and enforcement.
2 Site based Stormwater Management Plans for development
• Review the effectiveness of current measures through the development assessment
process including;
o Linkages with the TCC Erosion and Sediment Control Course,
o Planning Scheme provisions,
o Monitoring and enforcement,
o State legislation especially EP Act and EP (Water) Policy.
Implementation costs for most of the management actions are being reviewed at present and will be added to the draft WQIP website as soon as they are available

Draft Black and Ross River Basins WQIP
Page 75
• Link with the WSUD implementation process and the development of a new Planning
Scheme for Townsville;
• Incorporate risk management for climate change in all new policy settings and measures;
• Develop generic guidelines for developers/construction industry;
o General principles about stormwater management,
o Linkage to erosion and sediment control.
• Monitoring and enforcement.
Note: Numbers in (brackets) in the MAT rows refer to the Action area and tasks numbers
6.3.3 Developed urban areas
Developed urban areas have the same water quality pollutants as developing areas i.e. sediment
and nutrients, as well as some additional issues and pollutants specific to the population intensive
urban environment that are associated primarily with industry and commerce, transport, waste and
human behaviour.
The two key strategic management approaches to water quality improvement applied to developed
urban areas are: pre-development design and installation of measures i.e. water sensitive urban
design (WSUD), for post-development outcomes; and urban stormwater quality management
(USQMP) including treatment measure retrofitting (see Table 6-5).
As an adjunct to the preparation of the Black Ross WQIP a set of draft WSUD products were
developed for testing in the Townsville region. These products include:
• WSUD Strategy Roadmap - a web based navigation tool to assist access to information and
resources relevant to the application of WSUD in the Coastal Dry Tropics;
• WSUD Draft Design Objectives for the Dry Tropics;
• WSUD Technical Design Guidelines for the Coastal Dry Tropics; and
• Factsheets;
o Factsheet 1 - Concepts and Terms,
o Factsheet 2 - WSUD in the Dry Tropics,
o Factsheet 3 - Site Planning and Urban Design,
o Factsheet 4 - Industrial and Commercial Sites,
o Factsheet 5 – Carparks,
o Factsheet 6 - Porous Pavement, and
o Factsheet 7 - Best Management Practices.
The management action targets and main actions associated with the testing and implementation of
WSUD are listed in Table 6-4.
Table 6-4 WSUD Actions
Management Outcome 2: Management of existing urban areas
To ensure that the existing urban areas of Townsville are managed appropriately in order to achieve
agreed water quality improvement outcomes including sediment, nutrient and other pollutant load
reductions over time
MAT 2.1 By 2013 locally specific Water Sensitive Urban Design guidelines and associated tools
developed and tested to support the implementation of best practice stormwater
management in Townsville (3)
MAT 2.2 Coastal Dry Tropics Guide for Urban Water Management developed by 2011 (4)
MAT 2.3 Water Sensitive Urban Design (stormwater) principles and measures progressively
included in all new development reaching 100% adoption rate by 2021 (3-5, 7 and 12-
16)
No. Action area and tasks (Urban with some peri-urban overlap)
3 Water Sensitive Urban Design (WSUD) guideline finalisation and adoption

Draft Black and Ross River Basins WQIP
Page 76
• Strategic direction/framework (commenced) for introducing WSUD into:
o The development assessment process in existing planning schemes,
o The ‘new’ planning scheme for Townsville City,
o Development and construction industry.
• Develop or adapt additional material as required including:
o Concept Design Guidelines,
o Construction and Establishment Guideline,
o Asset Management Guideline,
o Deemed to Comply and Standard Drawings,
o MUSIC Auditing Tool (to assist with the development assessment process).
• Develop the socio-economic case for WSUD;
• Investigate Market Based Incentives to assist WSUD adoption;
• Prepare an education and training strategy (Council, developers/construction industry,
consultants, community);
• Prepare a Communication Strategy including;
o Website platform incorporating the ‘Roadmap’ (TCC and Creek to Coral websites),
o Internal reporting,
o Consultation with key stakeholders,
o Community consultation.
• Adaptive management;
o Incorporation of amendments and updates to initial guidelines and documents,
and development of an ongoing improvement/learning process.
• Model subdivisions project - monitoring ‘new’ subdivisions from Greenfields stage to test
WSUD effectiveness (uptake, and WQ monitoring and modelling);
• Full WSUD Integration (i.e. stormwater, potable water and wastewater) Scoping Study in
conjunction with Landscape Planning initiatives and Planning Scheme background
studies;
• Develop a monitoring and enforcement system to complement the development
assessment process.
4 Develop the Coastal Dry Tropics Guide for Urban Water Management
The complete current story incorporating:
• The WSUD Guidelines and products;
• Erosion and sediment control components;
• Stormwater management principles and USQMP;
• Hydrology and hydraulic considerations;
• Geology, soils and geomorphic features and influences;
• Soil health and soil carbon;
• Vegetation and fire;
• Aquatic ecosystem health assessment;
• Linkages to other programs such as Creekwatch and Dry Tropics Watersmart;
• Other relevant findings and components associated with preparation of the Black Ross
WQIP e.g. Stormwater Quality Improvement Devices (SQID) case studies report;
• Potable water;
• Wastewater;
• Asset Maintenance/Management Plans.
Note: Numbers in (brackets) in the MAT rows refer to the Action area and tasks numbers
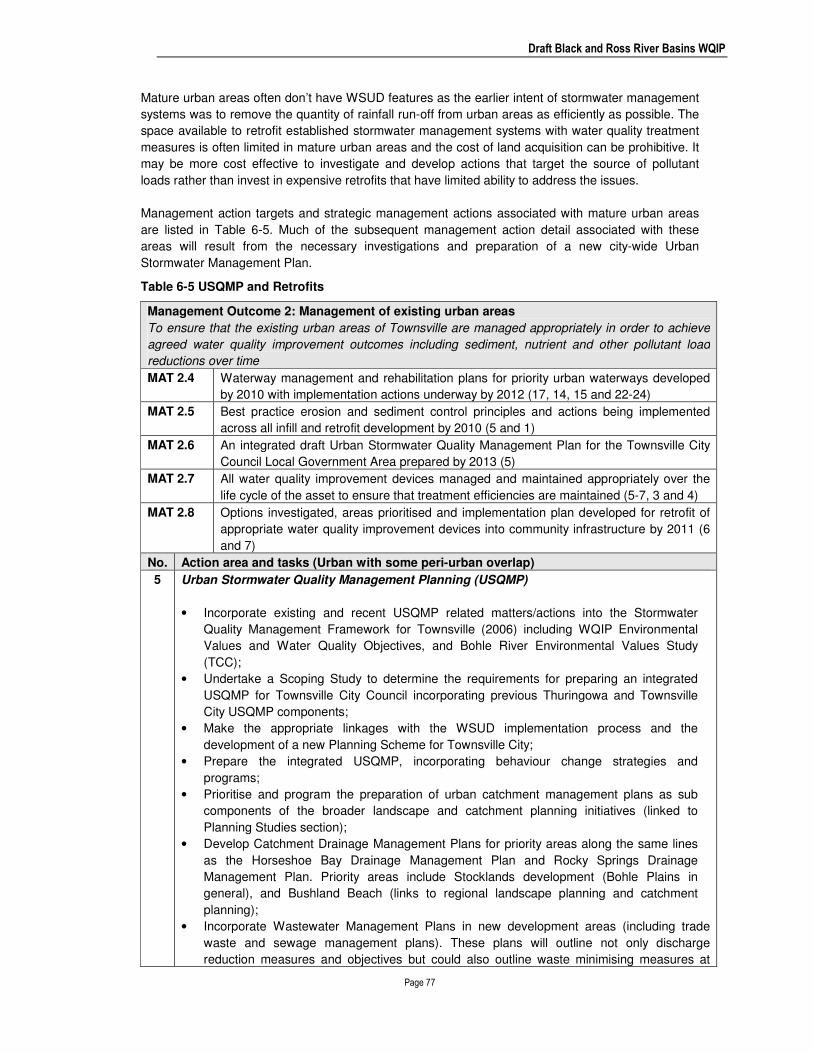
Draft Black and Ross River Basins WQIP
Page 77
Mature urban areas often don’t have WSUD features as the earlier intent of stormwater management
systems was to remove the quantity of rainfall run-off from urban areas as efficiently as possible. The
space available to retrofit established stormwater management systems with water quality treatment
measures is often limited in mature urban areas and the cost of land acquisition can be prohibitive. It
may be more cost effective to investigate and develop actions that target the source of pollutant
loads rather than invest in expensive retrofits that have limited ability to address the issues.
Management action targets and strategic management actions associated with mature urban areas
are listed in Table 6-5. Much of the subsequent management action detail associated with these
areas will result from the necessary investigations and preparation of a new city-wide Urban
Stormwater Management Plan.
Table 6-5 USQMP and Retrofits
Management Outcome 2: Management of existing urban areas
To ensure that the existing urban areas of Townsville are managed appropriately in order to achieve
agreed water quality improvement outcomes including sediment, nutrient and other pollutant load
reductions over time
MAT 2.4 Waterway management and rehabilitation plans for priority urban waterways developed
by 2010 with implementation actions underway by 2012 (17, 14, 15 and 22-24)
MAT 2.5 Best practice erosion and sediment control principles and actions being implemented
across all infill and retrofit development by 2010 (5 and 1)
MAT 2.6 An integrated draft Urban Stormwater Quality Management Plan for the Townsville City
Council Local Government Area prepared by 2013 (5)
MAT 2.7 All water quality improvement devices managed and maintained appropriately over the
life cycle of the asset to ensure that treatment efficiencies are maintained (5-7, 3 and 4)
MAT 2.8 Options investigated, areas prioritised and implementation plan developed for retrofit of
appropriate water quality improvement devices into community infrastructure by 2011 (6
and 7)
No. Action area and tasks (Urban with some peri-urban overlap)
5 Urban Stormwater Quality Management Planning (USQMP)
• Incorporate existing and recent USQMP related matters/actions into the Stormwater
Quality Management Framework for Townsville (2006) including WQIP Environmental
Values and Water Quality Objectives, and Bohle River Environmental Values Study
(TCC);
• Undertake a Scoping Study to determine the requirements for preparing an integrated
USQMP for Townsville City Council incorporating previous Thuringowa and Townsville
City USQMP components;
• Make the appropriate linkages with the WSUD implementation process and the
development of a new Planning Scheme for Townsville City;
• Prepare the integrated USQMP, incorporating behaviour change strategies and
programs;
• Prioritise and program the preparation of urban catchment management plans as sub
components of the broader landscape and catchment planning initiatives (linked to
Planning Studies section);
• Develop Catchment Drainage Management Plans for priority areas along the same lines
as the Horseshoe Bay Drainage Management Plan and Rocky Springs Drainage
Management Plan. Priority areas include Stocklands development (Bohle Plains in
general), and Bushland Beach (links to regional landscape planning and catchment
planning);
• Incorporate Wastewater Management Plans in new development areas (including trade
waste and sewage management plans). These plans will outline not only discharge
reduction measures and objectives but could also outline waste minimising measures at

Draft Black and Ross River Basins WQIP
Page 78
source.
6 Urban stormwater treatment trains
• Utilise the USQMP process to prioritise areas for infrastructure upgrades;
• Upgrade existing systems where additional water quality benefits can be gained at
‘reasonable’ cost;
• Pilot innovative soil amelioration techniques to increase carbon content, nutrient retention
and water infiltration in TCC managed sites;
• Investigate (using MUSIC modelling and other techniques) ‘household’ WSUD options that
have the potential to reduce pollutant loads without compromising flood management
issues.
7 WSUD retrofit
• Expand the SQID Report (Zingspace 2009) to include all levels of WSUD measures in
place in the Townsville urban footprint, and categorise previous
developments/neighbourhoods using the ABCD framework;
• Prioritise areas where WSUD retrofits can be undertaken in a cost effective way for water
quality improvement to meet WSUD objectives for sediment, nutrients and gross
pollutants. These can be included in USQMP for ‘local’ areas.
Note: Numbers in (brackets) in the MAT rows refer to the Action area and tasks numbers
6.4 Peri-urban Management Actions
While being strategically important from both the short-term and long-term water quality perspective
there is not a large store of information associated with peri-urban areas, which comprise around
30% of the Black Ross WQIP area. Along with application of the ‘safe’ management actions for
developing urban areas, the main management actions associated with the peri-urban landscape
involve the quantification and prioritisation of water quality issues, behaviour change investigations
and the development of guidelines and programs based on knowledge acquired from investigations.
The principle peri-urban specific management actions and associated management actions targets
are listed in Table 6-6.
Table 6-6 Peri-urban Management Actions for Water Quality Improvement
Management Outcome 3: Management of peri-urban areas
To ensure that all peri-urban areas in Townsville are managed appropriately to achieve agreed
water quality improvement outcomes including sediment, nutrients and pesticide load reductions
MAT 3.1 A locally relevant catchment management plan and/or guidelines for managing peri-
urban landuse for water quality improvement prepared by 2010 (8)
MAT 3.2 Peri-urban diffuse source pollutant loads reduced through cost-effective approaches to
the management of priority pollutant source areas (8, 17, 22-26)
MAT 3.3 All on-site wastewater treatment facilities (including septic tanks) managed according
to approved best management practice over the life cycle of the asset (8)
MAT 2.7 All water quality improvement devices managed and maintained appropriately over the
life cycle of the asset to ensure that treatment efficiencies are maintained (8 and 3)
No. Action area and tasks
8 Peri-urban Catchment Management
• Delineate key peri-urban areas through internal/external stakeholder focus group
meeting/s and aerial photograph and cadastral interpretation to develop a GIS layer;
• Identify and prioritise catchment management, water quality and socio-economic issues
associated with peri-urban areas;

Draft Black and Ross River Basins WQIP
Page 79
• Develop biophysical BMP guidelines for peri-urban areas (soil, land, water and
biodiversity management) incorporating fire management for catchment health and water
quality;
• Refine the ABCD framework for peri-urban areas in line with BMP guidelines;
• Undertake behaviour change studies (Thematic Interpretation and/or Community Based
Social Marketing) in selected catchments e.g. Alligator Creek, Stuart Creek, Ross River,
Bohle River, Black River and Bluewater Creek, to determine the most effective programs
for water quality and catchment management initiatives (does not include Ross Dam
catchment study);
• Develop and cost programs based on results of studies;
• Incorporate social findings in biophysical BMP guidelines and ABCD framework;
• Implement peri-urban land and water management program.
Note: Numbers in (brackets) in the MAT rows refer to the Action area and tasks numbers
While not entirely comprised of peri-urban land uses the Ross River Dam catchment is heavily
influenced by peri-urban activities especially in the vicinity of the water storage area. The main
actions associated with protecting the water quality of the Ross Dam are listed in Table 6-7. Where
appropriate rural management practice actions will be adopted as for other rural land uses in the
Black Ross WQIP area.
Table 6-7 Water Resource Catchment Management Actions for Water Quality Improvement
Management Outcome 3: Management of peri-urban areas
To ensure that all peri-urban areas in Townsville are managed appropriately to achieve agreed water
quality improvement outcomes including sediment, nutrients and pesticide load reductions
MAT 3.4 Best practice management actions being implemented within the catchment of the Ross
Dam to ensure the improvement in the quality of water draining into the Ross Dam (9, 8,
10-26)
No. Action area and tasks (Peri-urban and Rural)
9 Ross River Dam Water Resource Catchment Management
• Integrate the dam catchment water quality monitoring program with the Black/Ross WQIP
WQ Monitoring and Modelling Strategy;
• Review Planning Scheme provisions in terms of what has worked and what needs to be
amended for the information of the new Planning Scheme for Townsville City;
• Catchment planning for water quality improvement in higher risk land use areas/sub
catchments;
• Include Oak Valley in peri-urban management actions and subject to a combination of
appropriate rural and urban management interventions;
• Include Ross River, Alligator Creek and Stuart Creek catchments, and other areas
delineated as peri-urban in the development of the peri-urban BMP guidelines;
• Partner with BDT NRM to extend grazing Reef Rescue BMP incentives to the larger
grazing properties of the Upper Ross River sub basin;
• Review previous catchment plans and studies and provide further recommendations for
catchment management and WQIP actions;
• Conduct CBSM/Thematic Communication and Social Learning studies for implementation
of peri-urban BMP in dam catchment communities e.g. Oak Valley (see sections Options,
Costs and Benefits report);
• Develop an extension program based on behaviour change findings and the peri-urban
BMP guidelines and implement the program.
Note: Numbers in (brackets) in the MAT rows refer to the Action area and tasks numbers
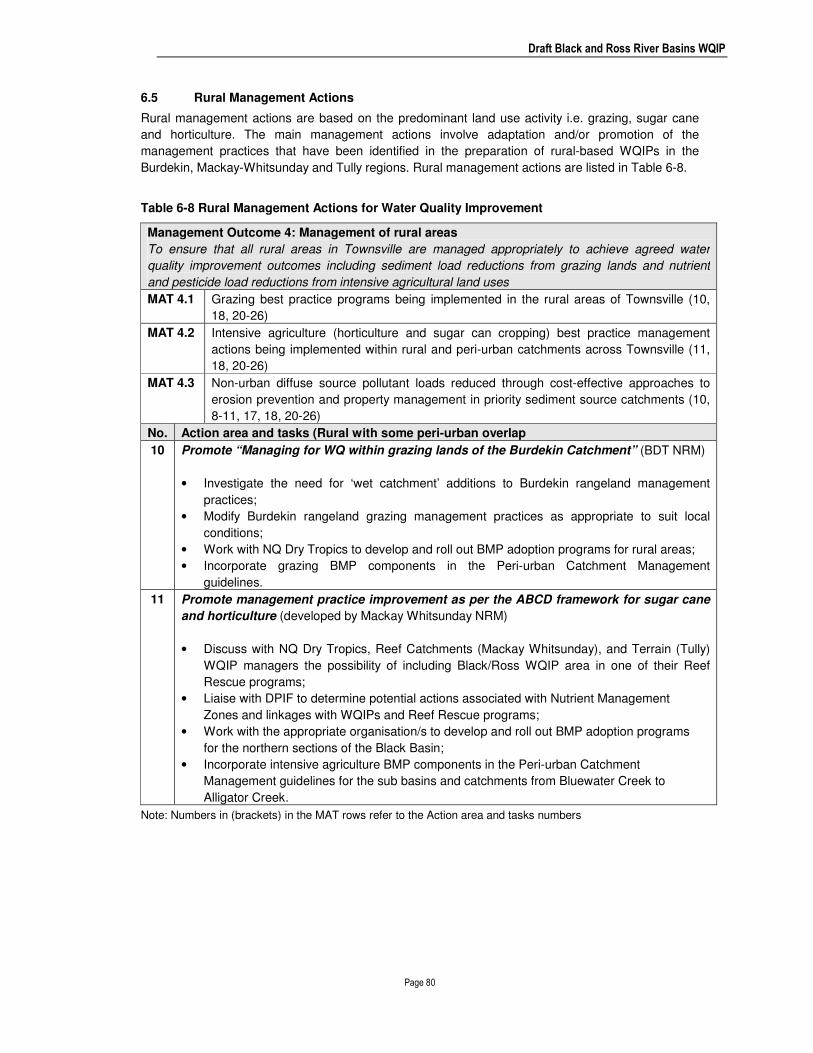
Draft Black and Ross River Basins WQIP
Page 80
6.5 Rural Management Actions
Rural management actions are based on the predominant land use activity i.e. grazing, sugar cane
and horticulture. The main management actions involve adaptation and/or promotion of the
management practices that have been identified in the preparation of rural-based WQIPs in the
Burdekin, Mackay-Whitsunday and Tully regions. Rural management actions are listed in Table 6-8.
Table 6-8 Rural Management Actions for Water Quality Improvement
Management Outcome 4: Management of rural areas
To ensure that all rural areas in Townsville are managed appropriately to achieve agreed water
quality improvement outcomes including sediment load reductions from grazing lands and nutrient
and pesticide load reductions from intensive agricultural land uses
MAT 4.1 Grazing best practice programs being implemented in the rural areas of Townsville (10,
18, 20-26)
MAT 4.2 Intensive agriculture (horticulture and sugar can cropping) best practice management
actions being implemented within rural and peri-urban catchments across Townsville (11,
18, 20-26)
MAT 4.3 Non-urban diffuse source pollutant loads reduced through cost-effective approaches to
erosion prevention and property management in priority sediment source catchments (10,
8-11, 17, 18, 20-26)
No. Action area and tasks (Rural with some peri-urban overlap
10 Promote “Managing for WQ within grazing lands of the Burdekin Catchment” (BDT NRM)
• Investigate the need for ‘wet catchment’ additions to Burdekin rangeland management
practices;
• Modify Burdekin rangeland grazing management practices as appropriate to suit local
conditions;
• Work with NQ Dry Tropics to develop and roll out BMP adoption programs for rural areas;
• Incorporate grazing BMP components in the Peri-urban Catchment Management
guidelines.
11 Promote management practice improvement as per the ABCD framework for sugar cane
and horticulture (developed by Mackay Whitsunday NRM)
• Discuss with NQ Dry Tropics, Reef Catchments (Mackay Whitsunday), and Terrain (Tully)
WQIP managers the possibility of including Black/Ross WQIP area in one of their Reef
Rescue programs;
• Liaise with DPIF to determine potential actions associated with Nutrient Management
Zones and linkages with WQIPs and Reef Rescue programs;
• Work with the appropriate organisation/s to develop and roll out BMP adoption programs
for the northern sections of the Black Basin;
• Incorporate intensive agriculture BMP components in the Peri-urban Catchment
Management guidelines for the sub basins and catchments from Bluewater Creek to
Alligator Creek.
Note: Numbers in (brackets) in the MAT rows refer to the Action area and tasks numbers

Draft Black and Ross River Basins WQIP
Page 81
6.6 Enabling Management Actions
Enabling management actions consist of a number of interrelated tasks, which can be implemented
sequentially if necessary, and would be most effective if implemented in parallel.
6.6.1 Policy and strategic planning
The first set of enabling management actions involve some form of policy or governance
arrangements, which in terms of local government often overlap with regulatory roles and functions
through planning schemes and the development assessment process.
Policy, governance arrangements and regulatory functions all need to have access to the most
relevant information from the biophysical and socio-economic realms. The policy and governance
management actions listed in Table 6-9 include strategic planning studies and integration of natural
asset assessment and are therefore closely linked to condition assessment and behaviour change
investigations in subsequent sections.
Table 6-9 Policy and Governance Management Actions
Management Outcome 5: Strategic planning
To ensure that relevant water quality improvement initiatives, information and activities are
investigated and integrated where appropriate into Council strategic policy and planning instruments
MAT 5.1 Appropriate water quality improvement actions integrated with the Townsville City
Council Planning Scheme by 2013 (12-17, 19, 1-4, 8 and 9)
MAT 5.2 Regulatory, policy and land use planning frameworks across all levels of government
support the enhanced adoption of water quality improvement actions in Townsville (12-
16)
MAT 5.3 An Urban Water Management Strategy developed for Townsville linking stormwater,
wastewater, potable water and waterway management (13, 15, 1-5 and 19-26)
No. Action area and tasks (Enabling and cross catchment)
12 Legislation and Governance
• Facilitate the incorporation of WSUD guidelines and measures in the current planning
schemes, where possible, and as an integral part of the new Townsville City Planning
Scheme;
• Make recommendations for amendments to planning control measures based on the
Erosion and Sediment Control and Site Based Stormwater Management Plans review
findings;
• Provide advice on potential development control measures and landscape protection
mechanisms through the new Townsville City Planning Scheme based on findings from
condition assessment studies and strategic landscape mapping;
• Assist with the development of Codes associated with ‘environmental’ Overlays as part of
the review process and development of the new Townsville City Planning Scheme;
• Further investigate the identified potential mechanisms available to Council for water
quality improvement associated with State and Commonwealth legislation and
governance arrangements (see Options, Costs and Benefits report).
13 Policy investigations and development
• Investigate the potential for development of an Integrated Water Management Policy for
total water cycle management in the urban environment;
• Investigate the potential and benefits of establishing an Environment Levy to be used
exclusively for protecting and managing natural resources such as waterways and
wetlands;
• Investigate options for the establishment of a Beneficial Rating system based on the level

Draft Black and Ross River Basins WQIP
Page 82
of environmental services installed and maintained in sub catchments within the
Townsville region (also in Market Based Instruments).
14 Planning Scheme studies and instruments review
• Provide input to Planning Scheme scoping investigations to determine linkages between
WQIP components and proposed studies to inform the development of the new planning
scheme with emphasis on the following study areas, Overlays and associated Codes;
o Housing Density
o Growth Spatial Studies
o Waterways & Wetlands Overlay and Code
o Biodiversity Overlay and Code
o Bushfire Overlay and Code
o Acid Sulphate Overlay and Code
o Agricultural Overlay and Code
o Steep Lands Overlay and Code
o Cultural Heritage Overlay
• Where possible integrate WQIP condition assessment studies with Planning Scheme
studies and/or assist with design and coordination of Planning Scheme studies to achieve
mutual outcomes.
15 Strategic landscape mapping and habitat prioritisation
• Coordinate ecological and environmental studies and mapping across Council
departments and with external partners to produce a comprehensive data set across the
Townsville region landscape;
• Develop criteria to enable prioritisation of landscape elements critical to water quality,
habitat and biodiversity values protection and map GIS;
• Integrate relevant protection layers with regional planning processes and the
development of the new Townsville City Planning Scheme.
16 Population Growth and Climate Change considerations
• Update and refine population growth and urban expansion projections and mapping for
inclusion in catchment and receiving waters modelling and the Bayesian Belief Network
management practice decision support system;
• Adapt management actions as appropriate to compensate for any issues identified by the
refined modelling associated with population growth not previously identified.
• Literature review of linkages between climate change and water quality;
• Based on literature review findings develop a model, or utilise an existing model, to
determine likely scenarios and timeframes for potential deterioration or improvement in
water quality associated with climate change in the Black Ross WQIP area;
• Develop long term, intermediate and short term objectives and actions to address any
projected adverse impacts of climate change on water quality in the Black Ross WQIP
area.
Note: Numbers in (brackets) in the MAT rows refer to the Action area and tasks numbers
6.6.2 Condition assessment and mapping
Natural asset condition assessment and mapping, combined with socio-economic data, underpins
appropriate decision-making and policy development. During the preparation of the Black Ross
WQIP a number of information gaps were identified along with areas where greater coordination and
integration of information resources could result in more cost effective outcomes. Condition
assessment management actions are listed in Table 6-10.

Draft Black and Ross River Basins WQIP
Page 83
Table 6-10 Condition Assessment and Mapping
Management Outcome 6: Ecosystem health improvement
On-ground actions are prioritised and effective in improving water quality and ecosystem health
MAT 6.1 Condition assessment studies progressed by 2010 to enable prioritisation of on-ground
works (17)
MAT 6.2 Traditional Owner waterway and water quality values are incorporated into planning and
implementation of management actions (17, 22-25 and 12-19)
No. Action area and tasks (Enabling and cross catchment)
17 Condition assessment and prioritisation
• Scope requirements for collating and gathering condition assessment data and information
associated with;
o Catchment condition assessment,
o Aquatic ecosystem health assessment,
o Riparian condition assessment,
o Wetland condition,
o Report card format verification,
o Acid sulphate soils.
• Liaise with TCC Planning and Development, and other TCC departments, to identify natural
resource condition studies being undertaken by Council departments and possibilities for
integration and value adding;
• Carry out condition assessments and develop a prioritisation process to rank areas for
rehabilitation on the basis of water quality improvement potential;
• Scope the requirements to prepare a greenspace management system for all properties
owned or maintained by TCC containing greenspace i.e. parkland and natural areas;
• Through a staged process of consultation with Traditional Owners determine Indigenous
cultural and spiritual environmental values of waterways and waterbodies in the Black Ross
WQIP area, including protocols for use of the information and management options to
protect the identified environmental values.
Note: Numbers in (brackets) in the MAT rows refer to the Action area and tasks numbers
6.6.3 Socio-economic and behavioural actions
In the realm of energy use and waste management it is less expensive to reduce demand or the
need for disposal facilities than it is to construct new infrastructure. The same concept applies to
water pollutant load reduction i.e. reduction at the source through behaviour change is less costly
than installing physical infrastructure.
Townsville City Council has a range of community based education and involvement (CBEI)
initiatives in place, which promote catchment management objectives and people based solutions to
environmental issues. More recently a number of behaviour change approaches have been added to
the CBEI toolkit to accelerate the uptake of sustainability practices.
Behaviour change strategies can be utilised in most situations where people are involved including
the mature urban environment to reduce the need for expensive infrastructure as well as in
developing environments to encourage the uptake of erosion and sediment control and WSUD
measures (see Gunn 2009). The main CBSM and behaviour change targets and actions are listed in

Draft Black and Ross River Basins WQIP
Page 84
Table 6-11.

Draft Black and Ross River Basins WQIP
Page 85
Table 6-11 Socio-economic and Behavioural Actions
Management Outcome 7: Community involvement and capacity
All sectors of the Townsville community have access to the information and training required to
contribute to implementation of relevant water quality improvement actions in the Black Ross WQIP
area
MAT 7.1 Community involvement in water quality improvement is supported through
continuation of Townsville’s community based education and involvement program
(18)
MAT 7.2 Locally relevant training and information provision programs developed and delivered
to relevant sector groups based on the identified and agreed priority actions (18-20, 1-
4, 8-11 and 22-25)
MAT 7.3 Best practice management and measures being implemented in the home and
workplaces as a result of programs developed using behaviour change study results
(19 and 21)
MAT 7.4 Best practice market based incentive options identified for water quality improvement
in Townsville by 2011 (21 and 18-20)
No. Action area and tasks (Enabling and cross catchment)
18 Community Based Education and Involvement (CBEI)
• Supporting community and raising capacity through existing programs:
o Creek watch,
o Catchment tours (eco-certified),
o Dry Tropics Watersmart,
o Rowes Bay Sustainability Education Centre, Learnscapes and Transect,
o Citisolar,
o Catchment management/natural resource management via Landcare and
Coastcare.
• Incorporate behaviour change strategies in CBEI activities.
19 Reef Guardian Councils implementation of BMP
TCC and GBRMPA are working together to identify and/or develop actions to protect the
water quality of the Great Barrier Reef Marine Park including:
• Produce media with key Great Barrier Reef messages for events such as Ecofiesta and
River Festival;
• Developing best management practice approaches and guidelines for Council staff;
• Develop behaviour change strategies for uptake of BMP;
• Wastewater reuse investigations (as part of Dry Tropics Watersmart).
20 Social learning and behaviour change studies
• Undertake behaviour change studies as required for urban and peri-urban landscapes
using methods developed by the leading proponents of Community Based Social
Marketing (CBSM) (Dr Doug Mackenzie-Mohr), Thematic Interpretation (Prof. Sam Ham)
and Collective Social Learning (Prof. Valerie Brown);
• Promote community and community group leaders involvement in behaviour change
training programs and studies.
21 Market Based Instruments investigation
Market Based Instruments (MBIs) are tools that use market-like approaches to positively
influence the behaviour of people through the use of market signals rather than through
explicit directives or regulations. Market based incentives may be used in their own right and
behaviour change studies can be used to help identify the most appropriate MBIs for a
particular situation.
Note: Numbers in (brackets) in the MAT rows refer to the Action area and tasks numbers

Draft Black and Ross River Basins WQIP
Page 86
6.6.4 On-ground actions
While the largest gains in water pollutant load reductions are likely to be realised from improved
management practices there are also potential gains from on-ground actions, which stabilise
waterways, increase groundcover and assist with erosion prevention. There may also be some water
quality benefits derived from rehabilitated riparian zones through the filtering of sediment and
nutrients. Prior to any on-ground works a rigorous prioritisation process needs to be undertaken to
ensure the benefits derived are worthwhile. On ground actions and preliminary investigations are
listed in Table 6-12.
Table 6-12 On-ground Actions
Management Outcome 6: Ecosystem health improvement
On-ground actions are prioritised and effective in improving water quality and ecosystem health
MAT 6.3 Priority on-ground works for water quality and ecosystem health improvement
underway by 2010 (22-24 and 17)
No. Action area and tasks (Enabling and cross catchment)
22 Riparian rehabilitation
• Identification and prioritisation of areas for maximum water quality benefit from protection
mechanisms and on ground action;
• Develop action plans;
• Implement actions and protection measures.
23 Wetland restoration and construction
• Identification and prioritisation of areas for maximum water quality benefit from protection
mechanisms and on ground action;
• Develop action plans;
• Implement actions and protection measures.
24 Aquatic ecosystem health improvement
• Define priority areas for action based on Condition assessment and prioritisation task
(16);
• Develop Waterway Improvement Plans for high priority urban streams;
• Implement priority management actions potentially including;
o Freshwater fish - removal or modification of in stream movement barriers,
o Aquatic vegetation - control of exotic species,
o Channel and floodplain features - maintain ‘natural’ flow regimes and processes,
o Riparian vegetation - grazing management e.g. fencing and off stream watering
points.
Note: Numbers in (brackets) in the MAT rows refer to the Action area and tasks numbers
6.6.5 Water quality monitoring and modelling
Water quality monitoring and modelling is used not only for measuring success but also to guide
management actions as a key component of the adaptive management strategy. Additional
information is provided in section 7.3 with priority actions listed in Table 6-13.
Table 6-13 Water Quality Monitoring and Modelling Actions
Management Outcome 8: Monitoring, evaluation and reporting
To ensure that water quality improvement actions are effective in improving water quality and
results are communicated appropriately to the Townsville community
MAT 8.1 A comprehensive monitoring, modelling and evaluation program developed and being
implemented as part of the ongoing adaptive planning and management framework of
the Black Ross WQIP

Draft Black and Ross River Basins WQIP
Page 87
No. Action area and tasks (Enabling and cross catchment)
25 Water quality monitoring and modelling (WQM and M)
• Implement the Integrated Water Quality Monitoring and Modelling Strategy including
detailed program design for:
o Critical sub catchment and river sites (to inform and validate modelling),
o Ecosystem health and ambient water quality monitoring (see Figure 7-1),
o Community based education and involvement monitoring (see Figure 7-1),
o Developing a set of local water quality guidelines for the wet and dry catchments
of the Black Ross WQIP area in conjunction with DERM/EPA (see Figure 7-1),
o Socio-economic monitoring and management practice uptake,
o Modelling.
• Update the Creek to Coral water quality monitoring activity report prepared in 2004;
• Develop protocols and management systems for coordinating water quality monitoring
initiatives and analysing and sharing data and results;
• Extract monitoring data from the database relevant to stormwater treatment measures
and land uses for further analysis and to assist with development of mitigation measures;
• Build on the water quality monitoring database developed by Creek to Coral for the Black
Ross WQIP to encompass additional data including from commercial/private sources;
• Incorporate monitoring data from large scale developments and developing areas e.g.
Rocky Springs;
• Develop strategies for enabling inclusion of water quality monitoring data generated from
commercial enterprises e.g. development projects and Environmental Impact
Assessments;
• Refining catchment scale models (WaterCAST and updates) incorporating on-going
monitoring results (see Figure 7-2);
• Improve knowledge on the connection between terrestrial run-off and receiving water
health through improved linkage of catchment models and receiving waters models (see
Figure 7-2);
• Investigate linkages between previous socio-economic modelling (Greiner et al 2005) and
the Bayesian Belief Network (BBN) model being developed for the Black Ross WQIP area
(Lynam et al 2008);
• Further develop the BBN decision support model;
• Finalisation of Marine and Tropical Sciences Research Facility (MTSRF) Project 4.9.7.
Understanding and enhancing social resilience: science and management integration
(Gooch et al 2008) Townsville component through monitoring community response to a
water quality management intervention designed after conducting a community based
social marketing study.
Note: Numbers in (brackets) in the MAT rows refer to the Action area and tasks numbers
6.6.6 Communication plus
Good communications and management systems along with coordinated and integrated actions are
critical to the success of the Black Ross WQIP. The main strategic actions are listed in Table 6-14.
Additional information is provided in the following sections.
Table 6-14 Communications Plus
Management Outcome 8: Monitoring, evaluation and reporting
To ensure that water quality improvement actions are effective in improving water quality and
results are communicated appropriately to the Townsville community
MAT 8.2 Knowledge and information requirements are identified and prioritised for major sector
groups by 2010
MAT 8.3 Opportunities identified to invest in research to develop and assess the performance of
water quality improvement actions in the Townsville region

Draft Black and Ross River Basins WQIP
Page 88
MAT 8.4 An integrated report card developed to communicate the progressive outcomes from
the implementation of the Black Ross WQIP
No. Action area and tasks (Enabling and cross catchment)
26 Integration, Communication, Monitoring, Evaluation and Adaptive Management
• Facilitate WQIP integration with other Council and external processes;
• Develop and implement the Black Ross WQIP Communication Strategy;
• Foster partnerships and relationships for water quality improvement;
• Refine and implement the WQIP Monitoring and Evaluation framework;
• Refine and extend the ABCD Management Practice Framework for urban and peri-urban
areas;
• Progress and test the Bayesian Belief Networks decision support system.
Note: Numbers in (brackets) in the MAT rows refer to the Action area and tasks numbers

Draft Black and Ross River Basins WQIP
Page 89
6.7 Management Action Targets
A summary of the management action targets from the sections above is provided in Table 6-15.
Table 6-15 Management Action Targets
Management Outcome PS: Management of point source pollution
To ensure that pollutants from point sources in Townsville are managed appropriately to reduce
their impact on receiving waters to acceptable levels
Target Target description Cost
PSRC 1.1 By 2012 total wastewater treatment plant pollutant loads are reduced
from 2006 loads by:
• 75% for total nitrogen (225 tonnes/yr)
• 65% for total phosphorus (48 tonnes/yr)
PSMA 1.1 By 2012 all wastewater treatment plants in Townsville are upgraded and
meet DERM (EPA) revised permit requirements
$189.4M
PSRC 1.2 By 2021 total wastewater treatment plant pollutant loads are further
reduced from 2012 levels by:
• 17% for total nitrogen (12 tonnes/yr)
• 24% for total phosphorus (5.8 tonnes/yr)
• 30% for total flows (14.4 ML/day)
PSMA 1.2 A effluent reuse scheme for treated effluent from the Cleveland Bay
Wastewater Treatment Plant is established and operational by 2021
$32.9M
Management Outcome 1: Management of development in urban and peri-urban areas
To ensure that all new development in Townsville is managed appropriately to achieve agreed
water quality improvement outcomes including sediment load reductions
MAT 1.1 Erosion and sediment control principles and measures implemented across all new
development by 2011 (1)
MAT 1.2 Locally specific guidelines and associated tools developed to support the
implementation of best practice stormwater management in Townsville by 2013 (2 and
4)
MAT 1.3 Water Sensitive Urban Design (stormwater) principles and actions are progressively
incorporated in the design of all new development reaching a 100% adoption rate by
2021 (3-5, 7 and 12-16)
Management Outcome 2: Management of existing urban areas
To ensure that the existing urban areas of Townsville are managed appropriately in order to achieve
agreed water quality improvement outcomes including sediment, nutrient and other pollutant load
reductions over time
MAT 2.1 By 2013 locally specific Water Sensitive Urban Design guidelines and associated tools
developed and tested to support the implementation of best practice stormwater
management in Townsville (3)
MAT 2.2 Coastal Dry Tropics Guide for Urban Water Management developed by 2011 (4)
MAT 2.3 Water Sensitive Urban Design (stormwater) principles and measures progressively
included in all new development reaching 100% adoption rate by 2021 (3-5, 7 and 12-
16)
MAT 2.4 Waterway management and rehabilitation plans for priority urban waterways developed
by 2010 with implementation actions underway by 2012 (17, 14, 15 and 22-24)
MAT 2.5 Best practice erosion and sediment control principles and actions being implemented
across all infill and retrofit development by 2010 (5 and 1)
MAT 2.6 An integrated draft Urban Stormwater Quality Management Plan for the Townsville City
Council Local Government Area prepared by 2013 (5)
MAT 2.7 All water quality improvement devices managed and maintained appropriately over the

Draft Black and Ross River Basins WQIP
Page 90
life cycle of the asset to ensure that treatment efficiencies are maintained (5-7, 3 and 4)
MAT 2.8 Options investigated, areas prioritised and implementation plan developed for retrofit of
appropriate water quality improvement devices into community infrastructure by 2011
(6 and 7)
Management Outcome 3: Management of peri-urban areas
To ensure that all peri-urban areas in Townsville are managed appropriately to achieve agreed
water quality improvement outcomes including sediment, nutrients and pesticide load reductions
MAT 3.1 A locally relevant catchment management plan and/or guidelines for managing peri-
urban landuse for water quality improvement prepared by 2010 (8)
MAT 3.2 Peri-urban diffuse source pollutant loads reduced through cost-effective approaches to
the management of priority pollutant source areas (8, 17, 22-26)
MAT 3.3 All on-site wastewater treatment facilities (including septic tanks) managed according
to approved best management practice over the life cycle of the asset (8)
MAT 2.7 All water quality improvement devices managed and maintained appropriately over the
life cycle of the asset to ensure that treatment efficiencies are maintained (8 and 3)
MAT 3.4 Best practice management actions being implemented within the catchment of the
Ross Dam to ensure the improvement in the quality of water draining into the Ross
Dam (9, 8, 10-26)
Management Outcome 4: Management of rural areas
To ensure that all rural areas in Townsville are managed appropriately to achieve agreed water
quality improvement outcomes including sediment load reductions from grazing lands and nutrient
and pesticide load reductions from intensive agricultural land uses
MAT 4.1 Grazing best practice programs being implemented in the rural areas of Townsville (10,
18, 20-26)
MAT 4.2 Intensive agriculture (horticulture and sugar can cropping) best practice management
actions being implemented within rural and peri-urban catchments across Townsville
(11, 18, 20-26)
MAT 4.3 Non-urban diffuse source pollutant loads reduced through cost-effective approaches to
erosion prevention and property management in priority sediment source catchments
(10, 8-11, 17, 18, 20-26)
Management Outcome 5: Strategic planning
To ensure that relevant water quality improvement initiatives, information and activities are
investigated and integrated where appropriate into Council strategic policy and planning instruments
MAT 5.1 Appropriate water quality improvement actions integrated with the Townsville City
Council Planning Scheme by 2013 (12-17, 19, 1-4, 8 and 9)
MAT 5.2 Regulatory, policy and land use planning frameworks across all levels of government
support the enhanced adoption of water quality improvement actions in Townsville (12-
16)
MAT 5.3 An Urban Water Management Strategy developed for Townsville linking stormwater,
wastewater, potable water and waterway management (13, 15, 1-5 and 19-26)
Management Outcome 6: Ecosystem health improvement
On-ground actions are prioritised and effective in improving water quality and ecosystem health
MAT 6.1 Condition assessment studies progressed by 2010 to enable prioritisation of on-ground
works (17)
MAT 6.2 Traditional Owner waterway and water quality values are incorporated into planning
and implementation of management actions (17, 22-25 and 12-19)
MAT 6.3 Priority on-ground works for water quality and ecosystem health improvement
underway by 2010 (22-24 and 17)
Management Outcome 7: Community involvement and capacity
All sectors of the Townsville community have access to the information and training required to
contribute to implementation of relevant water quality improvement actions in the Black Ross WQIP
area
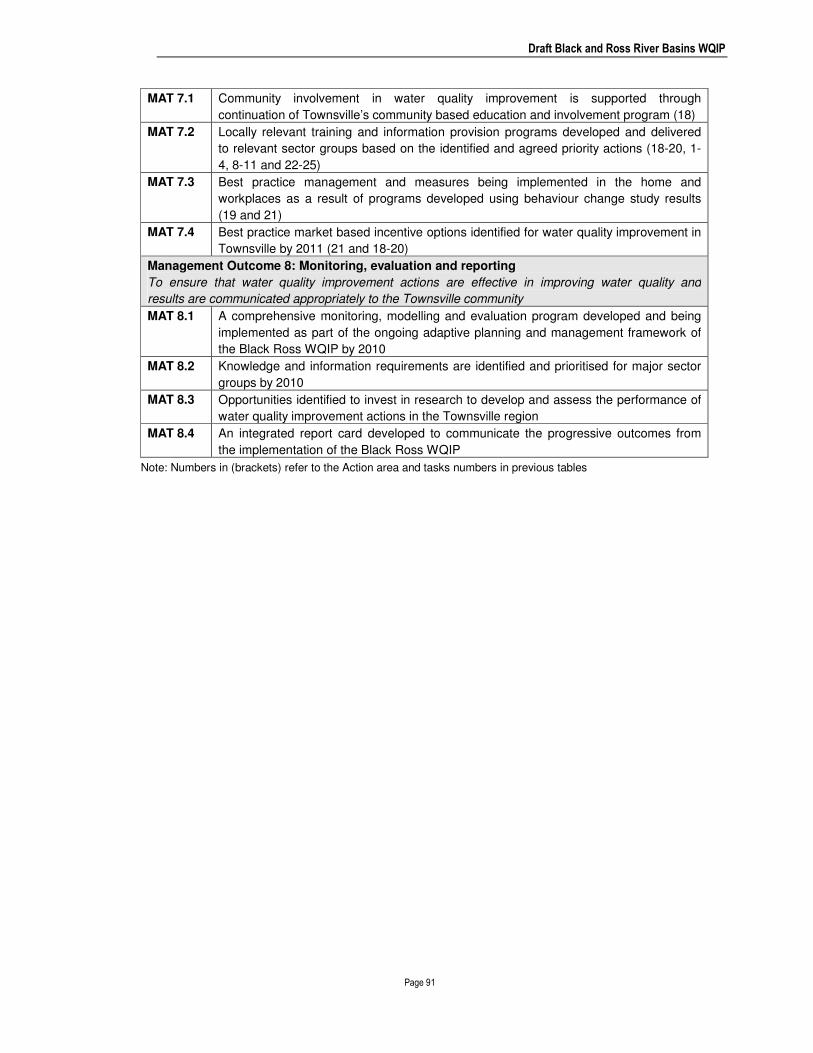
Draft Black and Ross River Basins WQIP
Page 91
MAT 7.1 Community involvement in water quality improvement is supported through
continuation of Townsville’s community based education and involvement program (18)
MAT 7.2 Locally relevant training and information provision programs developed and delivered
to relevant sector groups based on the identified and agreed priority actions (18-20, 1-
4, 8-11 and 22-25)
MAT 7.3 Best practice management and measures being implemented in the home and
workplaces as a result of programs developed using behaviour change study results
(19 and 21)
MAT 7.4 Best practice market based incentive options identified for water quality improvement in
Townsville by 2011 (21 and 18-20)
Management Outcome 8: Monitoring, evaluation and reporting
To ensure that water quality improvement actions are effective in improving water quality and
results are communicated appropriately to the Townsville community
MAT 8.1 A comprehensive monitoring, modelling and evaluation program developed and being
implemented as part of the ongoing adaptive planning and management framework of
the Black Ross WQIP by 2010
MAT 8.2 Knowledge and information requirements are identified and prioritised for major sector
groups by 2010
MAT 8.3 Opportunities identified to invest in research to develop and assess the performance of
water quality improvement actions in the Townsville region
MAT 8.4 An integrated report card developed to communicate the progressive outcomes from
the implementation of the Black Ross WQIP
Note: Numbers in (brackets) refer to the Action area and tasks numbers in previous tables

Draft Black and Ross River Basins WQIP
Page 92
6.8 Cost of Improved Water Quality and Ecosystem Health
An initial costing of management actions was prepared as part of the proposal submitted to the
Australian Government to deliver relevant components of the Caring for Our Country Business Plan
2009/10. These costings are shown in Table 6-16. Detailed budgets are being developed internally
and with partner organisations.
Table 6-16 Preliminary Costs
No. Action Areas Cost
$ ,000s
Lead Role and
Partners
1 Erosion and Sediment Control for development [2009/11] (36) TCC, UDIA
2 Site based Stormwater Management Plans for development
[2009/11]
(18) TCC, UDIA
3 Water Sensitive Urban Design (WSUD) guideline adoption
and additional products [2009/13]
24 [134]
(88)
TCC, UDIA
4 Develop the Coastal Dry Tropics Guide for Urban Water
Management [2009/10]
24 [4] TCC
5 Urban Stormwater Quality Management Plan integration
[2009/10]
244 [6] TCC
6 Urban stormwater treatment trains [2009/11] 580 [80] TCC
7 WSUD retrofit [2009/11] (60) TCC
8 Develop peri-urban catchment management guidelines and
implementation activities [2009/12]
262 [5] TCC, NQ Dry
Tropics
9 Water Resource Catchment Management (Ross River
Dam) [2009/11]
(40) TCC
10 Promote “Managing for WQ within grazing lands of the
Burdekin Catchment” (BDT NRM) [2009/11]
(30) TCC, NQ Dry
Tropics
11 Promote management practice ABCD framework for sugar
cane and horticulture (Mackay Whitsunday NRM) [2009/11]
(12) TCC, Reef
Catchments
12 Legislation and Governance [2009/13] (48) TCC
13 Policy investigations and development [2009/11] (14) TCC
14 Planning Scheme studies and instruments review [2009/13] (120) TCC
15 Strategic landscape mapping and habitat prioritisation
[2009/13]
158 [260] TCC, DERM
16 Population Growth and Climate Change considerations
[2009/11]
(36) TCC
17 Condition assessment and prioritisation [2009/13] (100) TCC, NQ Dry
Tropics, DERM
18 Community Based Education and Involvement (CBEI)
(awareness and capacity building) [2009/13]
320 [1,442] TCC, CVA
19 Reef Guardian Councils implementation [2009/13] (80) TCC, GBRMPA
20 Social learning and behaviour change studies (for
determining effective management interventions) – urban
and peri-urban [2009/11]
75 [141] TCC, NQ Dry
Tropics
21 Market Based Instruments investigation [2009/10] (13) TCC
22 Riparian zone rehabilitation [2009/11] (200) TCC, CVA
23 Wetland restoration and construction [2009/11] (40) TCC, CVA
24 Aquatic ecosystem health improvement [2009/13] [1,000] (300) TCC, CVA
25 Water quality monitoring and modelling – event [2009/13] 580 [52] (100) TCC, ACTFR
26 Integration, Communication, Monitoring, Evaluation and
Adaptive Management [2009/13]
645 [1,484]
(40)
TCC, EPA

Draft Black and Ross River Basins WQIP
Page 93
Notes: Funding requested through CFOC/Reef Rescue is followed by approved and yet to be approved
budgeted funding in [square brackets]. All figures are exclusive of GST. Figures in (brackets) are preliminary
estimates, which need to be confirmed following investigations into requirements of tasks within the activity
area.
6.9 Roles and Responsibilities
Roles and responsibility are being negotiated with relevant stakeholders including internally
throughout Townsville City Council. An indication of stakeholder involvement in the delivery of the
priority actions is provided in Table 6-16.
6.10 Integration With Other Processes
There are a number of NRM initiatives that have direct relevance to the Black/Ross WQIP with a
variety of other activities that are indirectly related and/or synergistic. A selection of the key
programs, projects and initiatives considered in when developing implementing the Black/Ross
WQIP are described briefly in the Options, Costs and Benefits background report.
The process of developing and implementing a WQIP is both incremental and iterative as new
information is accumulated and incorporated. Other planning processes need to be taken into
account and integrated, as appropriate, into the WQIP development process. In the context of an
‘urban’ catchment incorporation of elements of the WQIP in Council planning schemes under the
Integrated Planning Act (IPA), development assessment processes and construction guidelines and
codes is particularly important.
Coordination between ‘external’ and evolving planning processes is also appropriate with
opportunities sometimes presenting to address a number of issues simultaneously. Opportunities
associated with the March 2008 amalgamation of local government areas e.g. Townsville and
Thuringowa, and the reorganisation of Australian Government natural resource management (NRM)
programs are two relevant examples.
The adaptive management strategy, which is an integral part of this WQIP, makes allowance for the
transitional nature of both local government in Queensland, NRM funding programs, partners and
partnerships, evolving science and socio-economic influences. This enables the uncertainty inherent
in the system to be accounted for and incorporated in the implementation phase of the Black/Ross
WQIP.
6.10.1 Communication Strategy
Reporting to the community and stakeholders is to be integrated into relevant and existing reporting
mechanisms including NQ Dry Tropics, Reef Plan, Townsville SOE and Creek to Coral websites.
The Communication Strategy will be developed after the availability of funding to implement this
WQIP is known.
6.10.2 Partnerships
Organisation such as NQ Dry Tropics (formerly Burdekin Dry Tropics NRM) and Terrain are regional
NRM bodies funded through the Australian Government to implement NRM activities within their
region and, with other NRM bodies, across regions. Creek to Coral is partnering with NQ Dry Tropics
to deliver the rural components of the Black Ross WQIP and in return will provide assistance to NQ
Dry Tropics with the urban and peri-urban components of their WQIP area. There is scope for future
collaborative projects to jointly deliver WQIP components as well as broader biodiversity and
catchment management outcomes.

Draft Black and Ross River Basins WQIP
Page 94
6.11 Are We Confident?
The level of confidence varies between management actions. The actions that been shown to work
in other areas elicit a high level of confidence and these are the actions that we plan to implement as
priorities. The actions that we are less sure of will be investigated further and tested to determine
their worth. When we have a greater level of confidence in their ability to deliver cost effective
outcomes then we will look at implementing additional actions.
6.11.1 Reasonable Assurance Statement
A reasonable assurance statement is part of the contractual arrangements associated with funding
arrangements under the previous Australian Government’s Coastal Catchments Initiative program.
This will be provided as an annexure to the final WQIP as required by the original funding agreement
between Townsville City Council and the Commonwealth of Australia.

Draft Black and Ross River Basins WQIP
Page 95
7. Progress Reporting and Adaptation
7.1 WQIP Monitoring and Evaluation
There are two key monitoring and evaluation components associated with the Black/Ross WQIP:
1. WQIP implementation effectiveness;
2. Water quality monitoring.
7.2 WQIP Effectiveness
The main method for determining the effectiveness of the WQIP will be through the measurement of
recommended management practice adoption rates. To assist with the task of determining current
management practice status and then measuring adoption rates; an ABCD framework for urban and
peri-urban areas is being developed. Initially a coarse survey of a range of land managers for
different land uses may be required as a starting point to feed into the ABCD framework.
7.2.1 Management practice uptake
Determining management practice uptake needs to commence by assessing the current status of
management practice in the various areas of interest for the different land uses across the WQIP
area, especially in the near urban developing areas and peri-urban fringe. As yet a data collection
system has not been devised as the proposed management practices are inextricably related to a
number of other processes within Townsville City Council, including regulatory processes associated
with State legislation and policy. Any data collection system proposed will necessarily have
implications for the monitoring and enforcement role of Council and needs to be designed in
consultation with all relevant Council departments and staff, and linked with each of the associated
processes and existing systems.
Each individual action component of the Black Ross WQIP will involve a design that incorporates
monitoring of behaviour change, social learning and management practice uptake. In addition
specific social studies will be undertaken to determine the most appropriate methods to
communicate water quality improvement messages and motivate land managers to adopt
management practices aimed at improving water quality and ecosystem health.
7.2.2 ABCD Management Practice Framework
A tool to assist with the promotion and measurement of management practice uptake is the ABCD
management practice framework for urban areas. This was initially developed in conjunction with the
management team of the Mackay Whitsunday WQIP and Mackay City Council. The framework has a
number of functional uses including:
• To set targets for water quality management practice improvement;
• To provide land managers with a list of water quality improvement options;
• To relate the management action improvements to pollutant load reductions;
• To measure improvement in management practice on an ascending grouped scale;
• To provide discreet management classes for inclusion in Bayesian Belief Network modelling;
• To investigate the most effective, and most cost effective, management interventions for water
quality improvement using BBN modelling;
• To provide a level of certainty (through probability distribution) of the potential effectiveness of
management interventions (using BBN modelling) i.e. reasonable assurance;
• To inform the adaptive management strategy.
The main elements associated with the urban ABCD framework as presented in the Mackay
Whitsunday WQIP are listed in Table 7-1.

Draft Black and Ross River Basins WQIP
Page 96
Table 7-1 Urban ABCD Framework Main Elements
New development Existing/developed areas
• WSUD
• ESCP – development, implementation and
maintenance
• SBSMP – developed, implemented and maintained
• Planning and reporting
o Relevant to USQMP,
o Relevant to ESCP,
o Relevant to SBSMP,
o Adaptive management,
o Non-compliance reporting,
o Staged clearing and development.
• Infrastructure (not determined - a component of
WSUD and USQMPs)
• Infill development as for new
development i.e. WSUD, ESCP
and SBSMP
• Planning and reporting based
around maturity and
implementation of USQMP
Education in conjunction with the development and
construction industry
Community based activity associated
with total water cycle management
Source: Water Quality Improvement Plan Final report for Mackay Whitsunday region (2008, pp.66-70)
Creek to Coral has continued to work on the framework with the latest urban drafts (developing
areas, developed areas and point sources) included in the Options, Costs and Benefits background
report.
In addition to the urban areas, a draft framework for peri-urban areas has also been developed and
this will be ‘road-tested’ as part of the WQIP implementation process. The peri-urban areas do not
neatly fit into the urban or rural land use categories and require separate consideration, while being
mindful that it is the peri-urban areas that are under the most pressure from a development
perspective and also have a relatively large number of ‘rural’ land managers in a relatively small
‘rural’ area.
7.3 Water Quality Monitoring and Modelling
The WQIP development and implementation process is being used to integrate water quality
monitoring in the study area to achieve more effective outcomes including calibrating and verifying
water quality models and to inform the adaptive management strategy for the Black Ross WQIP,
Townsville (Dry Tropics) WSUD guidelines and Urban Stormwater Quality Management Plan/s.
An integrated water quality monitoring and modelling strategy has been prepared by the Australian
Centre for Tropical Freshwater Research (ACTFR)/James Cook University (Bainbridge et al 2008)
for the Black Ross WQIP. Since the main aim of the Black Ross WQIP is to reduce sediment,
nutrient and pesticide export to the Great Barrier Reef, a coupled monitoring and modelling approach
has been designed to measure, assess and report on the effectiveness of the Black Ross WQIP and
in particular the impact of improved land management practices on receiving waters associated with
WQIP implementation actions.
The ACTFR report provides a monitoring and modelling strategy for the Townsville region, as well as
an outline for future plan development. The strategy is presented in three sections:
(i) Catchment Ecosystem Health Framework, relating to instream waterways and wetlands;
(ii) Marine Ecosystem Health Framework, linking catchment management actions to marine
ecosystem health; and

Draft Black and Ross River Basins WQIP
Page 97
(iii) Social and Economic Framework, linking socio-economic indicators and management
action uptake to water quality outcomes.
7.3.1 A water quality work in progress
Creek to Coral, through its Coastal Catchments Initiative (CCI)/WQIP project, commissioned:
• The collation of available water quality monitoring data and preparation of a Water Quality
Condition Report;
• The development of a draft Report Card format for water quality, ecosystem and catchment
health;
• Event water quality monitoring for the 2006/07 and 2007/08 wet seasons; and
• Catchment and receiving waters modelling for the Black Ross WQIP area.
Prior to these studies there have been limited modelling efforts specific to the region and appropriate
to the conditions i.e. smaller coastal catchments and altered catchment processes of urbanised
landscapes, and virtually no event monitoring (most existing data is ambient monitoring).
The broader integration of all ambient (catchment ecosystem health) and event (marine ecosystem
health) water quality monitoring within the Black and Ross Basins (extended to the Townsville City
Council local government area) will be developed as part of the implementation of the Black Ross
WQIP. Similarly the coupled monitoring and modelling approach described in the strategy
(Bainbridge et al 2008) will be an implementation action of the Black Ross WQIP and in particular the
continuation of the process for assessing management effectiveness and response for marine
ecosystem health (see Figure 7-2) started with the event monitoring and modelling undertaken
during the preparation of the WQIP.
In the interim an on-going event monitoring plan has been developed based on results and gaps
from the 2006/07 and 2007/08 event monitoring programs, and to fill immediate catchment modelling
verification requirements with regard to end-of-catchment sediment and nutrient loads.
While the coupled modelling and monitoring approach will provide managers with a better
understanding of the water quality signals and trends that result from improved land uses over time
e.g. WSUD measures, improvement in management practices also need to be audited. Such
auditing will be an integral part of the Black Ross WQIP particularly during the first phase of
implementation where monitoring data particularly will be limited, and management practice auditing
will be the primary means of feedback.
7.3.2 Water quality monitoring scales
Changes in water quality as a result of catchment management actions are only likely to be
measured at the smaller sub-catchment/land use scale in the shorter term. Catchment ‘noise’ and
lag times associated with particular management actions limit the detection of water quality changes
or trends at the catchment (end-of-catchment) scale (Stow et al. 2001; Osidele et al., 2003 in
Bainbridge et al 2008).
For this reason the most effective form of monitoring to determine improvements in water quality at
the end of catchment will be long term and strategically focused. Short-term improvements may be
detected through a well-planned program based around ‘isolated’ reaches and water bodies
associated with small sub catchments and relatively uniform land uses. Without this level of
specificity there are too many variables and too much background ‘interference’ to derive any
meaningful cause and effect information from water quality monitoring.

Draft Black and Ross River Basins WQIP
Page 98
Figure 7-1 Catchment Ecosystem Health Framework
Source: Bainbridge et al (2008) Figure 5 (p.11)
Assess & report
on management
practice
effectiveness
Identification of waterbodies within the
region using agreed biophysical
parameters
Develop local water
quality guidelines
Representative Site
Monitoring
(Local guideline development)
Community- based Education and
Involvement Monitoring
(e.g. CreekWatch)
Ecosystem Health Monitoring
(Issues based - site specific)
Identification of waterbodies within the
region of importance to the community
Identification of representative
waterbodies within the region
Where long
term trends
identified
Data used for
communication/
education purposes
Data used for
ecosystem health
monitoring and
guideline development
where compatible
• Assessment of long-term water quality trends
• Assessing attainment of water quality standards
• Determine suitability of waters for water supply,
recreation, fish, aquatic life and other uses
• Input into reporting through report card system
Issues and trends
identification
Implementation of
management
practice
Identify potential issues
Design of monitoring program
Parameters Frequency Methods
Determine relevant water
quality indicators
Where issues
identified
Design of monitoring program
Parameters Frequency Methods Design of monitoring program
Parameters Frequency Methods
Update local water quality
objectives using guidelines
Continue monitoring
program

Draft Black and Ross River Basins WQIP
Page 99
Figure 7-2 Coupled Monitoring and Modelling Marine Ecosystem Health Framework
Source: Bainbridge et al (2008) Figure 6 (p.13). Notes: Monitoring processes shown in blue, modelling in green and (management practice/social) auditing in red.

Draft Black and Ross River Basins WQIP
Page 100
7.3.3 Connecting management practice to water quality
Verification of the effectiveness of management practices will be through ‘micro’ scale water quality
monitoring at the urban ‘paddock’ scale. The information gained at this scale can then be used as
input to catchment models to determine ‘downstream’ improvements and to justify broader introduction
of effective management practices. ‘Macro’ scale monitoring will also be used to verify modelled
outputs and assist with recalibration of models (Bainbridge et al 2008).
7.3.4 Connecting management practice to ecosystem health
Making the connection between ecosystem health and management practices requires the collection
of baseline data, prior to the commencement of ‘new’ practices; with follow up monitoring after
management interventions have been put in place. Available water quality monitoring data has been
collated and this needs to be further analysed and combined with as yet to be collated and collected
condition assessment data. Ecosystem health relates to all receiving waters and requires different
assessment methods and models for freshwaters, estuaries and marine systems (Bainbridge et al
2008).
Making direct connections between marine ecosystem health and catchment land use and
management practices is a difficult task and requires a well planned and appropriately resourced
monitoring program combining and coordinating local and regional monitoring efforts. The Black Ross
WQIP focuses on the local level monitoring i.e. Black and Ross Basins, and relies on linking to
regional monitoring undertaken by GBRMPA, and being involved in integrated whole of GBR
catchment monitoring programs and activities e.g. exposure modelling undertaken by the Reef Water
Quality Partnership.
7.4 Bayesian Belief Networks
Bayesian Belief Networks (BBN) and their application to the Black Ross WQIP are explained in more
detail in a draft report prepared by the BBN project team leader, Tim Lynam (Lynam et al 2008). Creek
to Coral has been working in conjunction with CSIRO to develop a water quality based BBN to explore
the relationships between management practice, land use and water quality (pollutant loads) as a
probability based decision support system. The BBN has been designed to assist with setting, or
verifying, direction for potential management interventions and subsequently redirecting management
interventions as part of the adaptive management approach to catchment management and water
quality improvement in the Black and Ross Basins.
Information derived from the monitoring (ACTFR event monitoring) and modelling processes (e.g. E2
load modelling) feeds into the BBN to provide pollutant coefficients for the various land uses within a
sub catchment (management unit). The ABCD management practice framework (see section 7.2.2) is
being developed, in part; to provide some form of delineation of the pollutant generation variables
associated with different management practices for various land uses.
The end game is to use the BBN to determine the most effective management interventions for each
land use based on potential water quality improvement associated with various management
practices. A significant amount of testing and calibration of the BBN is required to attain greater levels
of certainty associated with results i.e. the better the input the better the output. A simplified diagram
showing the initial conceptual BBN for total suspended solids for the Bohle River catchment is
provided in Figure 7-3.
The BBN has also been used in conjunction with catchment modelling to provide a level of confidence
in the proposed management actions. Additional information on the BBN is provided in the Options,
Costs and Benefits background report.

Draft Black and Ross River Basins WQIP
Page 101
Figure 7-3 Initial BBN Concept for the Bohle River Catchment
A parallel and integrated component of the BBN project involves the observation of the BBN
development process as part of a social learning study. Alternatively referred to as collective or
collaborative learning, social learning in natural resource management contexts is a process for
improving the effectiveness of adaptive management strategies. Creek to Coral in partnership with
CSIRO is investigating a range of adaptive management approaches and tools, as recommended by
the Reef Water Quality Partnership (Eberhard et al. 2008).
The social learning study seeks to understand the role of social learning in complementing and
enhancing approaches and tools currently being trialled in the WQIP process. The social learning
component of the BBN project will provide a social learning conceptual framework as well as set of
processes and tools to maximise the capacity of Townsville City Council staff (and associated
partners) to ‘learn by reflection and doing’. BBN and social learning are included in the Decision
Support components of the adaptive management framework (see Figure 7-5).
End of
Catchment
TSS
Marine Environment
Marine WQ
Health Indicator
e.g. Seagrass
Extent
New
Seagrass
Extent
Management
Unit
TSS
Land Use
TSS
Management
Practice
TSS
Management
Unit
TSS
Land Use
TSS
Management
Practice
TSS Bayesian Belief Network Model
Sediment Transport

Draft Black and Ross River Basins WQIP
Page 102
7.5 Adaptive Management Strategy - Learning and Doing
In a report (draft) prepared for the Reef Water Quality Partnership, Eberhard et al (2008) state
“Adaptive management is particularly appropriate in dynamic and complex systems that result in high
levels of uncertainty in delivery of actions and achievement of outcomes. These characteristics typify
environmental management systems, in both biophysical and socio-economic aspects, and are strong
features of the GBR system. Uncertainty in natural resource management systems is systemic in our
understanding of the current state of the system (measurement and interpretation), our understanding
of how the system will respond to changes over time (prediction) and the influence of other factors
outside our control or knowledge” (Eberhard et al 2008, p.4).
Furthermore, environmental and catchment management takes place in the context of human activity
systems (social, economic and political). In essence we are not managing the environment so much
as guiding and influencing the people that impact the environment through their everyday behaviour.
Adaptive management needs to be mindful of the human activity systems operating in the area of
influence and be designed to enable behaviour change in the relevant context.
7.5.1 Adaptive management
Adaptive Management is an approach that involves learning from management actions, and using that
learning to improve the next stage of management (Holling, 1978). It is "learning to manage by
managing to learn" (Bormann et al, 1993). (Source: http://www.connectedwater.gov.au/framework/
adaptive_management.html)
In simple terms adaptive management is the application of experiential learning to the management
process. We start by managing the preparation of our strategic plan (a water quality improvement
plan) and associated action plans, and then manage the plan implementation process i.e. project
management. We implement actions devised as part of the WQIP and we review the outputs and
outcomes of the actions. We learn from observation and evaluation of the results and we then
incorporate the lessons into the action plans and continue to implement the actions.
In some cases the learning may lead to the discontinuation of an action, project or program due to low
levels of success i.e. inability to reach targets or achieve outcomes. In reality this is not a failure of the
plan, as plans are built using; the best available information at the time, opinions, untested
assumptions and, often, limited science. Rather this is an example of the successful implementation of
adaptive management. The result is that an ineffective action is prevented from continuing along an
unproductive path. In terms of the overall plan this may lead to a revision of ‘unrealistic’ targets,
investigation of innovative options or the creation of a totally new area of focus.
7.5.2 Adaptive management and planning
Eberhard et al (2008) describe a double loop model of adaptive management where the inner loop of
the cycle represents feedback and adaptive implementation of the current action management of the
WQIP. The outer loop represents the review and revision of the overall WQIP itself.
The adaptive management strategy for the Black Ross WQIP follows the general principles proposed
in the double loop model with some modification, which allows for greater flexibility in the WQIP
implementation process by recognising that the implementation process includes on-going planning
processes. The WQIP is in effect an implementation and planning framework. We therefore have an
adaptive management and planning process, which recognises the review of the overall WQIP as the
outer loop with an additional inner loop component that includes adaptive planning as part of WQIP
implementation.

Draft Black and Ross River Basins WQIP
Page 103
In particular the peri-urban component of the Black Ross WQIP area is part of a dynamic and complex
system “with high levels of uncertainty in delivery of actions and achievement of outcomes”. The
adaptive management and planning approach is particularly pertinent for this broad land use zone as
little attention has been paid to it in terms of catchment management and water quality as it is not part
of the ‘mainstream’ agricultural scene.
The other factor is the relatively large number of land managers in a relatively small area, more closely
resembling geographic and social patterns of intensive agricultural areas than grazing areas. In reality
there is a mixture of both types of agriculture along with lifestyle farmers, urban escapists and
absentee owners. It has probably been too diverse a mix (too hard) for ‘conventional’ rural/agricultural
management practices to address without the benefit of a robust adaptive management and planning
approach incorporating social learning and behaviour change tools. The Black Ross WQIP includes
these approaches and tools.
Figure 7-4 Double Open Loop Adaptive Management and Planning Model
Note: The white circle is the pivot point for the ‘inner loop’ and the black circle is the pivot point for the ‘outer loop’. The
amorphous grey cloud is the context of uncertainty which the adaptive management works within. It is an open loop system
so new stuff can be introduced into the loops as a natural part of the change and innovation process.
Learn
Policy
New stuff
Plan
Adapt
Do

Draft Black and Ross River Basins WQIP
Page 104
The modified double loop model (see Figure 7-4) incorporates the additional element in the inner loop
i.e. the linkage between planning, doing and adapting, as well as being an open loop system to enable
‘new stuff’ to be infused into the adaptive management cycle at various points in the loops. In terms of
the Black Ross WQIP ‘new stuff’ includes social learning, behaviour change studies, maturing
partnerships and project concepts, coupled monitoring and modelling results, Bayesian Belief Network
results, new science, legislative change, management practice updates and modified trend reporting
e.g. climate change.
7.5.3 Black Ross adaptive management components
The main components and pathways for delivery of the adaptive management strategy for the Black
Ross WQIP are illustrated in Figure 7-5.
A review of the WQIP will take place on a two-year cycle and will focus on ‘higher’ level strategic
program adaptation based on the information gathered and analysed through the decision support
processes. Examples could include the introduction of ‘new’ legislation or a rerun of catchment models
revealing different priority areas.
Adaptation will be part of an ongoing process for action planning and implementation with details of
monitoring and assessment of each project or task to be built into each action plan as part of the
monitoring component. This will include a set of decision rules to revise targets and actions (tasks),
including timeframes.
7.6 Conclusion
The draft Black Ross Water Quality Improvement Plan is now available for review and comment.
Please take some time and let us know what you think about the results so far, including ideas for a
snappy conclusion.
All the background documents and a feedback form can be found on the website at
creektocoral.org/draftwqip
Many of the documents are large and will take time to download so if that is an issue please let us
know and we can copy the documents to a CD and send them to you.
Please address all comments to Chris Manning at:
Email: [email protected]

Draft Black and Ross River Basins WQIP
Page 105
Figure 7-5 Adaptive Management Strategy Main Pathways
Note: WQ monitoring and modelling fits into the Decision Support and Implementation and ‘boxes’ simultaneously
(i.e. doing decision support) with Steps 14 and 15 (see Figure 7-2) comprising the adaptive management
component.
Observe/Monitor
Strateg
ic Planning (WQIP) Issues
Condition
Options
Decision
Action planning (Project and tasks)
Target
Location
Roles
Timing
Resources
Tasks
Objectives
Monitoring
Decision Support
WQ Monitoring
Modelling
Consultation
Data collation
Implemen
tation
Do
Record
Compare to target
Evaluate and Learn
Evaluation
Decision Support Toolkit Catchment
modelling/E2
BBN
CBSM/TI/CSL
MODSS
Cost/benefit
Adapt
Adapt
(2 yearly
review)
Adapt
inputs
External flux
New science
Partnerships
Legislation
Policy

Draft Black and Ross River Basins WQIP
Page 106
8. Bibliography
Alluvium 2007, Burdekin Dry Tropics NRM Region Fish Passage Study: Draft for consultation, BDT NRM, Townsville. ANZECC and ARMCANZ 1992, National Water Quality Management Strategy: Australian Water Quality Guidelines for Fresh and Marine Waters, Agriculture and Resource Management Council of Australia and Australian and New Zealand Environment and Conservation Council, Canberra. ANZECC and ARMCANZ 1994, National Water Quality Management Strategy: Policies and Principles, a Reference Document, Agriculture and Resource Management Council of Australia and Australian and New Zealand Environment and Conservation Council, Canberra. ANZECC and ARMCANZ 1996, National Principles for the Provision of Water for Ecosystems, Agriculture and Resource Management Council of Australia and New Zealand and Australian and New Zealand Environment and Conservation Council, Canberra. ANZECC ARMCANZ 1998, National Water Quality Management Strategy Implementation Guidelines. Agriculture and Resource Management Council of Australia, and Australian and New Zealand Environment and Conservation Council, Canberra. ANZECC and ARMCANZ 2000, National Water Quality Management Strategy Australian and New Zealand Guidelines for Fresh and Marine Waters Quality, Draft Guidelines Volume 1. Prepared under the auspices of the Australia and New Zealand Environment and Conservation Council and Agriculture and Resource Management Council of Australia and New Zealand, Canberra. ARMCANZ and ANZECC 2000, Australian Guidelines for Urban Stormwater Management, National Water Quality Management Strategy, Canberra. Australian Institute of Engineers (Pilgrim and Canterford) 1987, Australian Rainfall and Runoff; a guide to flood estimation, Canberra, Institute of Engineers, Australia. Bainbridge, Z., Brodie, J., Waterhouse, J., Manning, C. and Lewis, S. 2008, Integrated Monitoring and Modelling Strategy for the Black Ross Water Quality Improvement Plan, CTFR Report No. 08/17, Creek to Coral/Townsville City Council, Townsville.
Bennett, J., Sanders, N., Moulton, D., Phillips, N., Lukacs, G., Walker, K. and Redfern, F. 2002,
Guidelines for Protecting Australian Waterways, Land & Water Australia
Bormann, B.T., Cunningham, P.G., Brookes, M.H., Manning, V.W. and Collopy, M.W. 1993, Adaptive ecosystem management in the Pacific Northwest, USDA Forestry Services General Technical Reprot PNW-GTR-341. Brisbane City Council 1996, Urban Stream Rehabilitation: Principles and Guidelines, Brisbane City Council, Brisbane. Brodie, J. (comp.) 2007, Nutrient management zones in the Great Barrier Reef catchment: a decision system for zone selection, ACTFR Report No. 06/07, Australian Centre for Tropical Freshwater Research, James Cook University, Townsville. Brodie, J. 2004, Mackay Whitsunday Region State of the Waterways Report, ACTFR Report No.02/03, Australian Centre for Tropical Freshwater Research, Townsville. Brodie, J., McKergow, L.A., Prosser, I.P., Furnas, M., Hughes, A., and Hunter, H. 2003, Sources of Sediment and Nutrient Exports to the Great Barrier Reef World Heritage Area, ACTFR Report No. 03/11

Draft Black and Ross River Basins WQIP
Page 107
Collins, D. and Scoccimarro, M. 2008, Market-based Instruments Decision Support Tool, Market Based Instruments Capacity Building Program, Department of Natural Resources and Water, Brisbane. Connell Wagner 2008, Water Quality Condition of the Black and Ross River Basins, Townsville City Council, Townsville. Connell Wagner 2009, Development of a Report Card Format for the Waterways of the Black/Ross Basins, Townsville City Council, Townsville. Cooperative Research Centre for Catchment Hydrology 1997, Best Practice Environmental Management Guidelines for Urban Stormwater —- Background Paper, Prepared for Environment Protection Authority, Melbourne Water Corporation and Department of Natural Resources and Environment, Victoria. Coughlin, T., O’Reagan, P., Nelson, B., Butler, B. and Burrow, D. 2008, Managing for water quality within grazing lands of the Burdekin Catchments – Guidelines for land managers, Burdekin Solutions Ltd, Townsville. Department of Agriculture, Fisheries and Forestry (DAFF) 2007, What are market based instruments?, DAFF, Canberra. Dight, I. 2009, Draft Burdekin Water Quality Improvement Plan, Burdekin Solutions Ltd, Townsville. Drewry, J., Higham, W. and Mitchell, C. 2008, Water Quality Improvement Plan Final report for Mackay Whitsunday region, Mackay Whitsunday Natural Resource Management Group, Mackay. Earth Environmental 2006, Stormwater Quality Management Framework for Townsville, Citiworks Townsville City Council Eberhard, R., Waterhouse, J., Robinson, C., Taylor, B., Hart, B., Parslow, J. and Grayson, R. 2008, Adaptive Management Strategies for Great Barrier Reef Water Quality Improvement Plans: Draft Final Report, Reef Water Quality Partnership, Brisbane. Environmental Protection Agency 2001, Model urban stormwater quality management plans and guideline, EPA, Queensland. Environmental Protection (Water) Policy 1997, Queensland Government. Furnas, M. 2003, Catchments and Corals: Terrestrial Runoff to the Great Barrier Reef, Australian Institute of Marine Science, Townsville.
GHD 2002, Ross River Dam Catchment: Land Use Management Framework Report, NQ Water,
Townsville.
Report
GHD 2006, Ross River Dam Catchment Water Quality Monitoring Plan, NQ Water, Townsville.
Gooch, M., Cullen, L., Manning, C. and Butler, J. 2008, ‘Developing indicators of social resilience to
changes in water quality – Townsville case study’, paper presented to the MTSRF Annual
Conference, Cairns, April 29, 2008.
Greenwood-Smith, S.L. 2001, ‘The use of Rapid Environmental Assessment Techniques to monitor the health of Australian Rivers’ from http://archive.riverfestival.com.au/2001/symposium_papers/GREENWOODSMITHSarah.asp

Draft Black and Ross River Basins WQIP
Page 108
Greiner, R., Herr, A., Brodie, J., Haynes, D., Audas, D., and Roth, C. 2003, Profiling and assessment of basins with respect to the sediment, nutrient and other diffuse-source loads they export to the Great Barrier Reef WHA, CSIRO, Townsville. Greiner, R., Stoeckl, N., Stokes, C., Herr, A. and Bachmaier, J. 2003, Natural resource management in the Burdekin Dry Tropics: social and economic issues, Report for the Burdekin Dry Tropics NRM Board, Northern Futures, CSIRO Townsville. Greiner, R., Herr, A., Brodie, J. and Haynes, D. 2005, ‘A multi-criteria approach to Great Barrier Reef catchment (Queensland, Australia) risk assessment’, Marine Pollution Bulletin, 51(1-4): 128-137. Gunn, J. 2006, Draft Framework for Townsville Stormwater Quality Management, Citiworks-Townsville City Council, Townsville.
Gunn, J. and Barker, G. 2008, Water Quality Pollutant Types and Sources for the Black and Ross
River Basins Water Quality Improvement Plan, Townsville City Council - Creek to Coral, Townsville. Gunn, J., Manning, C. and Connolly, N. 2009, Basins, Catchments and Receiving Waters of the Black and Ross River Basins Water Quality Improvement Plan Area, Townsville City Council - Creek to Coral, Townsville Gunn, J., Manning, C., McHarg, A., Moulton, D., Connolly, N., Bennett, J., Watson, F. and Kelton, M. 2009, Draft Environmental Values, Water Quality Objectives and Targets for the Black and Ross River Basins Water Quality Improvement Plan, Townsville City Council - Creek to Coral, Townsville. Gunn, J., Manning, C. and McHarg, A. 2009, Black Ross WQIP Options, Costs and Benefits, Townsville City Council - Creek to Coral, Townsville. Gunn, J. 2009, Social Approaches to Water Quality Improvement in the Black and Ross Basins, Townsville City Council - Creek to Coral, Townsville. Holling, C.S. 1978, Adaptive environmental management and assessment, Wiley, Chichester. Johnson, J.E., and Marshall, P.A. (editors) 2007, Climate Change and the Great Barrier Reef, Great Barrier Reef Marine Park Authority and Australian Greenhouse Office, Australia Kinsey-Henderson, A., Sherman, B., Bartley, R. 2007, Improved SedNet Modelling of Grazing Lands in the Burdekin Catchment, CSIRO Land and Water (Science Report 63/07) Lewis, S., Brodie, J., Ledee, E., and Alewijnse, M. 2006, The Spatial Extent of Delivery of Terrestrial Materials from the Burdekin Region in the Great Barrier Reef Lagoon, ACTFR Report No. 06/02, ACTFR, Townsville Lewis, S., Bainbridge, Z., Brodie, J., Butler, B., and Maughan, M. 2008, Water Quality Monitoring of the Black Ross Basins: 2007/08 Wet Season, Report No. 08/04, ACTFR, Townsville. Lynam, T., Stone-Jocovich, S., Blanco-Martin, B., Gunn, J., and Manning, C. 2008, (Draft) Bayesian belief network modelling and social learning for water quality management in the Bohle catchment, Townsville, Queensland, CSIRO, Townsville. Maunsell McIntyre 2000, Ross River Dam Catchment Management Plan Report, NQ Water, Townsville.
Maunsell McIntyre 2001, Ross River Dam Catchment Water Quality Strategy, NQ Water, Townsville.
Maunsell McIntyre 2001, Management of Aquatic Weed in Ross River Strategic Plan, NQ Water,
Townsville.

Draft Black and Ross River Basins WQIP
Page 109
Maunsell McIntyre 2001, Mechanical Harvesting Operation for Ross River: Environmental
Management Plan, NQ Water, Townsville.
Maunsell 2002, Aquatic Weed Monitoring Project Final Report, NQ Water, Townsville. (Ross River
Weirs) Maunsell Australia 2008, Wastewater Upgrade Program Planning Report, Townsville City Council, Townsville.
Mitchell, A., Lewis, S., Brodie, J., Bainbridge, Z., and Maughan, M. 2007, Water Quality Issues in the
Burdekin Region, ACTFR Report No. 07/03 Moss, Rayment, Reilly and Best 1992, A Preliminary Assessment of Sediment and Nutrient Exports from Queensland Coastal Catchments, Queensland Department of Primary Industries, Brisbane. Norris, R.H., Prosser, I., Young, B., Liston, P., Bauer, N., Davies, N., Dyer, F., Linke, S., and Thoms, M. 2001, The Assessment of River Condition (ARC) An Audit of the Ecological Condition of Australian Rivers, prepared for the National Land and Water Resources Audit, CSIRO (Land and Water) and CRC for Freshwater Ecology Phillips, N., Bennett, J. and Moulton, D. 2001, Principles and tools for the protection of rivers, Queensland Environmental Protection Agency report for LWA Prange, J., Haynes, D., Schaffelke, B., and Waterhouse, J. 2007, Great Barrier Reef Water Quality Protection Plan (Reef Plan) - Annual Marine Monitoring Report: Reporting on data available from December 2004 to April 2006, Great Barrier Reef Marine Park Authority, Townsville. Queensland Institute of Engineers (Witheridge, G. & Walker, R.) 1996, Soil Erosion & Sediment Control, Engineering Guidelines for Queensland Construction Sites, Institute of Engineers, Qld Division, Brisbane. Reef Water Quality Partnership 2007, Water quality monitoring in Great Barrier Reef catchments, State of Queensland (Department of Natural Resources and Water), Brisbane. Sinclair Knight Merz 2001, Urban Stormwater Quality Management Plan: USQMP Water Quality Objectives, Townsville City Council, Townsville Townsville City Council 1998, Urban Stormwater Quality Management Plan: Stage 1 Atlas of Environmental Values, Townsville City Council, Townsville Townsville City Council 1999, Urban Stormwater Quality Management Plan: Stage II Review of Status and Condition of Priority Sites, Stage III Assessment of Environmental Threats and Risks at Priority Sites, Stage IV Concept Engineering of Stormwater Quality Management Townsville City Council, Townsville Trezise, D.L., and Stephenson, P.J. 1990, Rocks and Landscapes of the Townsville District, Department of Resource Industries, Queensland. Trezise, D.L., Holmes, K.H., and Cooper, W. 1989, Townsville Sheet 8259 1:100000 Geological Map Commentary, Queensland Department of Mines, Brisbane. Turner, L., Tracey, D., Tilden, J., and Dennison, W. 2004, Where river meets sea: Exploring Australia’s estuaries, Cooperative Research Centre for Coastal Zones, Estuary and Waterway Management