draft for agency use only, not for distribution outside of
TRANSCRIPT


Benzene
Emissions Trends (1990 to 2002)
0
100,000
200,000
300,000
400,000
500,000
600,000
1990 2002
Tons
/Yea
r
M obile sources
Pesticide Applicat ion
Open Burning - Forest , Wildf ires, and PrescribedFiresResident ial Boilers: Wood/Wood ResidueCombustionOpen Burning - Residential, Household Waste
Gasoline Distribut ion (Stage I)
Oil & Natural Gas Product ion
Petroleum Refineries
Synthet ic Organic Chemical M anufacturing (HON)
Other Categories (540 categories)
2002 National Emissions Inventory
Booklet Volatile Organic Compounds
2002 Emissions: Detailed Source Categorization
Fires19%
Industrial Processes
8%
On-Road23%
Residential Wood8%
Solvent Use21%
Road Dust0%
Misc.5%
Non-Road13%
Indust/ Comm/Res
Fuels1%
EGUs0%
Fertilizer & Livestock
0%
Waste Disposal
2%
Ambient 2002 PM2.5 by County
Concentration ug/m3 <= 12 12.1 - 15 15.1 - 20 20.1 - 40
1

2002 Air Quality Emissions Data Analysis Booklet
Introduction The United States Environmental Protection Agency (EPA) has completed the National Emission Inventory (NEI) for 2002. This booklet contains analysis of the 2002 NEI and comparisons with 1990 emissions levels. The 2002 NEI is the most comprehensive emissions inventory available and includes data submitted by State, Local, and Tribal Air Pollution Control Agencies (S/L/Ts) as well as information collected from other sources. This analysis focuses upon emissions that are or could be harmful to people including a set of principal criteria air pollutants (CAPs) and air toxics. These CAPs include carbon monoxide (CO), lead (Pb), directly emitted particulate matter (PM2.5 and PM10) and precursors to ozone (O3) and particulate matter, including volatile organic compounds (VOCs), nitrogen oxides (NOx), sulfur dioxide (SO2), and ammonia (NH3). Air toxic compounds that have been determined to be hazardous air pollutants (HAPs) are addressed in this booklet including forty of the most toxic and/or pervasive of these pollutants. The analyses contained in this booklet are based upon the 2002 NEI version 1. The NEI Version 1 is the initial version of the NEI made available to the public and this version will be subjected to further updates. These estimates do not reflect emission changes relating to ongoing regulatory projects such as the Lead National Ambient Air Quality Standard (NAAQS) or the Risk and Technology Review (RTR). Multi-pollutant View of Criteria and Hazardous Air Pollutants It is useful to assess air pollution from a multi-pollutant standpoint since air emissions are frequently emitted from sources in combinations into the environment. There is also the potential for sector based strategies to provide multi-pollutant emission reductions. Using a multi-pollutant view that evaluates a number of different air pollutants, we conducted an assessment of related CAP and HAP pollutants for the 2002 NEI. We focused on CAPs and HAPs that are emitted as precursors to ozone and PM2.5, or emitted in conjunction with direct PM2.5, or are identified to be high risk HAPs. High risk HAPs are defined as those air pollutants that have been identified as suspected of causing cancer or other serious health problems by the 1999 National Scale Air Toxic Assessment (NATA) or the list of 33 HAPs identified as urban area source HAPs (64FR 38706, July 19,1999 as required by Clean Air act Sections 112(c)(3) and 112K). We found that the sources of emissions related to PM2.5 and ozone may be categorized into 12 major sectors that include: Electric generating units (EGUs), Solvent usage (SolventUse) Fertilizer and livestock (Fertil&Livest), Non-road mobile sources (Non_Road), Prescribed and wild fires (Fires), Residential wood combustion (ResidWood), Industrial, commercial, and residential Paved and unpaved road dust (Road_Dust), fossil fuel sources (I/C/R_Fossil), Waste disposal Industrial processes (Indust_Proc), Miscellaneous (Misc.), and On-road mobile sources (On_Road),
2
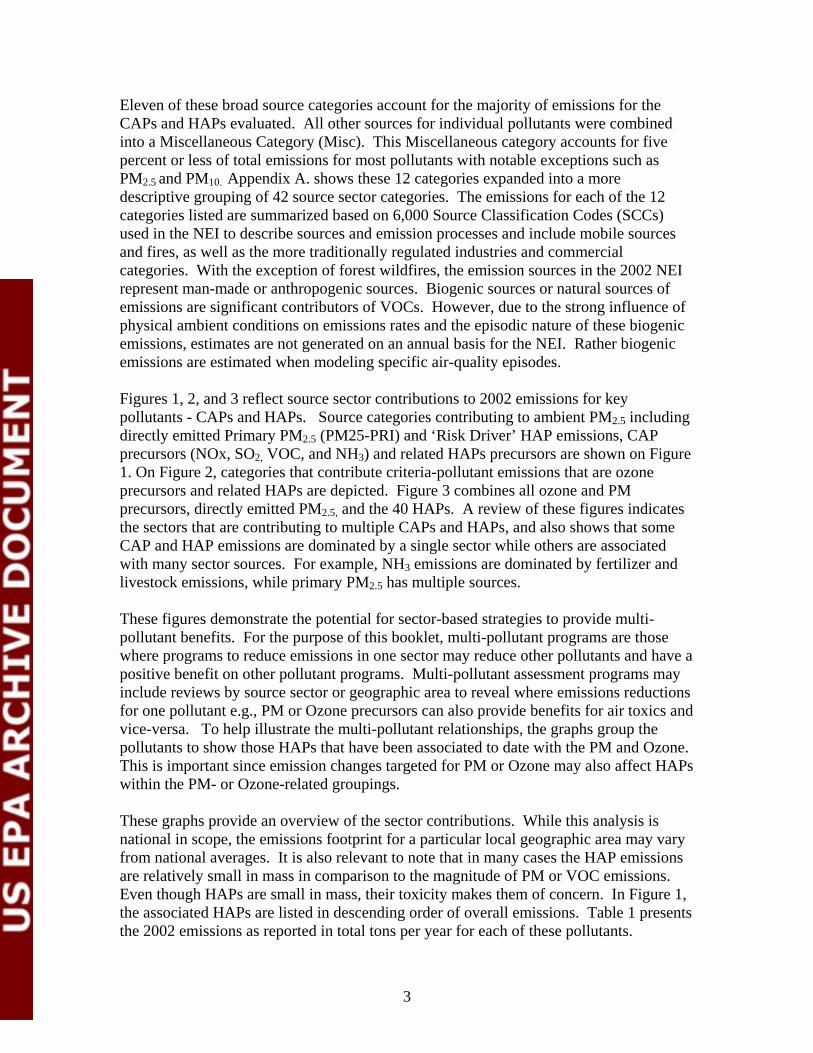
Eleven of these broad source categories account for the majority of emissions for the CAPs and HAPs evaluated. All other sources for individual pollutants were combined into a Miscellaneous Category (Misc). This Miscellaneous category accounts for five percent or less of total emissions for most pollutants with notable exceptions such as PM2.5 and PM10. Appendix A. shows these 12 categories expanded into a more descriptive grouping of 42 source sector categories. The emissions for each of the 12 categories listed are summarized based on 6,000 Source Classification Codes (SCCs) used in the NEI to describe sources and emission processes and include mobile sources and fires, as well as the more traditionally regulated industries and commercial categories. With the exception of forest wildfires, the emission sources in the 2002 NEI represent man-made or anthropogenic sources. Biogenic sources or natural sources of emissions are significant contributors of VOCs. However, due to the strong influence of physical ambient conditions on emissions rates and the episodic nature of these biogenic emissions, estimates are not generated on an annual basis for the NEI. Rather biogenic emissions are estimated when modeling specific air-quality episodes. Figures 1, 2, and 3 reflect source sector contributions to 2002 emissions for key pollutants - CAPs and HAPs. Source categories contributing to ambient PM2.5 including directly emitted Primary PM2.5 (PM25-PRI) and ‘Risk Driver’ HAP emissions, CAP precursors (NOx, SO2, VOC, and NH3) and related HAPs precursors are shown on Figure 1. On Figure 2, categories that contribute criteria-pollutant emissions that are ozone precursors and related HAPs are depicted. Figure 3 combines all ozone and PM precursors, directly emitted PM2.5, and the 40 HAPs. A review of these figures indicates the sectors that are contributing to multiple CAPs and HAPs, and also shows that some CAP and HAP emissions are dominated by a single sector while others are associated with many sector sources. For example, NH3 emissions are dominated by fertilizer and livestock emissions, while primary PM2.5 has multiple sources. These figures demonstrate the potential for sector-based strategies to provide multi-pollutant benefits. For the purpose of this booklet, multi-pollutant programs are those where programs to reduce emissions in one sector may reduce other pollutants and have a positive benefit on other pollutant programs. Multi-pollutant assessment programs may include reviews by source sector or geographic area to reveal where emissions reductions for one pollutant e.g., PM or Ozone precursors can also provide benefits for air toxics and vice-versa. To help illustrate the multi-pollutant relationships, the graphs group the pollutants to show those HAPs that have been associated to date with the PM and Ozone. This is important since emission changes targeted for PM or Ozone may also affect HAPs within the PM- or Ozone-related groupings. These graphs provide an overview of the sector contributions. While this analysis is national in scope, the emissions footprint for a particular local geographic area may vary from national averages. It is also relevant to note that in many cases the HAP emissions are relatively small in mass in comparison to the magnitude of PM or VOC emissions. Even though HAPs are small in mass, their toxicity makes them of concern. In Figure 1, the associated HAPs are listed in descending order of overall emissions. Table 1 presents the 2002 emissions as reported in total tons per year for each of these pollutants.
3

4
In addition to the sector-based multi-pollutant view, more detailed pollutant analyses are also provided for this set of pollutants in the remainder of this report. These pollutant analyses are also national in scope. For each pollutant, 2002 emissions and sources contributions, the spatial distribution of 2002 emissions, and comparisons of the 1990 to 2002 emissions are shown. These figures allow one to see how emissions are changing over time and the geographical distribution of emissions in 2002. For selected pollutants, ambient monitoring information is also presented. A finer level of source sector contribution detail is provided for the HAPs in the section of the booklet. Where relevant, reasons for large changes in emissions between 2002 and 1990 including emission inventory methodology changes and the impacts of emission control programs are noted.

0% 20% 40% 60% 80% 100%
PM25-PRIManganese
LeadNickel
ChromiumArsenic
CadmiumBerylliumAntimony
Mercury
SO2NOXNH3
VOC
Maleic AnhydrideHexamethylene DI
HexachlorobenzeneNaphthalene
1,3-DichloropropenePOM
Coke Oven Emiss2,4-TDI
PCBQuinoline
EGUs Fertil&Livest Fires I/C/R_Fossil Indust_Proc Misc Non_Road On_Road ResidWood Road_Dust SolventUse Waste Disposal
P
Prim
ary
PM2.
5 &
PM
2.5
Pre
curo
rs('R
isk-
driv
er" H
AP
S).
(Crit
eria
)"R
isk-
driv
er"
Met
al H
APs
Figure 1. Overview of Source Sector Contributions to Emissions of PM2.5, PM Precursors, and Related Hazardous Air Pollutants
5

0% 20% 40% 60% 80% 100%
VOCNOX
BenzeneFormaldehydeAcetaldehyde1,3-Butadiene
AcroleinChloroform
TrichloroethyleneVinyl Chloride
AcrylonitrileTriethylamine
Ethylene OxideCarbon Tet
TetrachloroethaneEthylene Dichloride
Propylene DichlorideEthylene Dibromide
Naphthalene1,3-Dichloropropene
POMCoke Oven Emiss
2,4-TDIPCB
Quinoline
EGUs Fertil&Livest Fires I/C/R_Fossil Indust_Proc Misc Non_Road On_Road ResidWood Road_Dust SolventUse Waste Disposal
O3
Pre
curs
ors
- Crit
eria
and
Sel
ecte
d H
APs
Figure 2. Overview of Source Sector Contributions to Ozone Precursors and Related Hazardous Air Pollutants
6

0% 20% 40% 60% 80% 100%
PM25-PRISO2NH3NOXVOCLead
ManganeseNickel
ChromiumArsenic
CadmiumBeryllium
Maleic AnhydrideAntimonyMercury
Hexamethylene DIHexachlorobenzene
Naphthalene1,3-Dichloropropene
POMCoke Oven Emiss
2,4-TDIPCB
QuinolineBenzene
FormaldehydeAcetaldehyde1,3-Butadiene
AcroleinChloroform
TrichloroethyleneVinyl Chloride
AcrylonitrileTriethylamine
Ethylene OxideCarbon Tet
TetrachloroethaneEthylene Dichloride
Propylene DichlorideEthylene Dibromide
Hydrochloric AcidChlorine
TetrachloroethyleneMethylene Chloride
Hydrazine
EGUs Fertil&Livest Fires I/C/R_Fossil Indust_Proc Misc Non_Road On_Road ResidWood Road_Dust SolventUse Waste Disposal
Sele
cted
Cr
iteria
P
ollu
tant
s
"Ris
k-dr
iver
" HA
Ps
(Pre
curs
ors
to P
M &
O3
Form
atio
n)
Figure 3. Overview of Source Sector Contributions to Emissions of Criteria and Hazardous Air Pollutants
7

Table 1. 2002 Emissions of Selected CAPs and ‘Risk Driver’ HAPs
2002 Total Emissions From All Sources
(tons per year) Selected CAPs: PM2.5 – Primary 6,031,351SO2 15,293,220NH3 4,235,970NOx 21,342,858VOC 20,481,365Lead Compounds 1,726‘Risk Driver’ Metal HAPs & Ozone & PM2.5 Precurors
Manganese 2,664Nickel 1235Chromium 787Arsenic 551Cadmium 207Beryllium 158Maleic Anhydride 144Antimony 142Mercury 112Hexamethylene 1, 6 -diisocyanate 40Hexachlorobenzene 1Naphthalene 16,1091,3-Dichloropropene 11,521Polychlorinated Biphenyls (POM) 13,772Coke Oven Emissions 7752,4 Tolulene Diisocyanate 86Polychorinated Biphenyls (PCBs) 26Quinoline 4Benzene 376,154Formaldehyde 258,009Acetaldehyde 77,5631,3-Butadiene 46,950Acrolein 27,003Chloroform 16,513Trichloroethylene 10,847Vinyl Chloride 1,308Acrylonitrile 1,041Triethylamine 851Ethylene Oxide 715Carbon Tetrachloride 433
8

2002 Total Emissions From All Sources
(tons per year) 1,1,2,2 Tetrachloroethane 297Ethylene Dichloride 456Propylene Dichloride 161Ethylene Dibromide 24Other ‘Risk Driver’ HAPs: Hydrochloric Acid 562,349Chlorine 12,530Tetrachloroethylene 35,587Methylene Chloride 51,013Hydrazine 6Benzidine 0.1Source: 2002 NEI version 1. Criteria Pollutants Background Under the Clean Air Act, EPA establishes air quality standards to protect public health and the environment. EPA has set NAAQS for six principal air pollutants. These include:
• carbon monoxide, • lead, • nitrogen dioxide, • ozone, • particulate matter (also known as particle pollution), and • sulfur dioxide
Four of these pollutants (CO, Pb, NO2, and SO2) are emitted directly into the air from a variety of sources. Ozone is not directly emitted, but is formed when oxides of nitrogen, NOx and volatile organic compounds, VOCs react in the presence of sunlight. PM can be directly emitted, or it can be formed when emissions of NOx, sulfur oxides (SOx), ammonia, organic compounds, and other gases react in the atmosphere. Ammonia is an important precursor of PM.
What are Sources of Criteria Pollutants? CO, VOC and NOx are mainly emitted during the combustion of fuels in motor vehicles, power plants and boilers and the open burning of biomass. VOC is also associated with evaporation from fuels handling and storage and solvent use. SO2 is emitted from the combustion of sulfur-containing fuels such as coal and fuel oil by power plants and industrial and commercial boilers. These compounds must be removed from the exhaust gases by scrubbers and other control devices. Particulate matter is also emitted during the combustion of both fossil and biomass fuels but it is also emitted during mechanical
9

grinding, crushing and abrasion of soils, rocks and minerals. Smaller particles (PM2.5 – particles smaller than 2.5 micrometer (um) aerodynamic diameter) are mainly associated with combustion while the larger particles (PM Coarse – particles between 2.5 and 10 um aerodynamic diameter) are mainly associated with the mechanical fracture and suspension of soil and mineral matter, mostly from open sources. PM10 is the name given to particles smaller than 10 um and includes both PM2.5 and PM Coarse. All the criteria pollutants can also be emitted from industrial combustion and manufacturing processes. Lead is a component of PM and is mainly associated with industrial processes and boilers. Some lead is emitted from aircraft, because it is an additive to aircraft gasoline. Ammonia is emitted mainly from animal husbandry and agricultural fertilizers. The emissions of some of the pollutants shown in Table 2 were reduced significantly from 1990 to 2002 due to air pollution control programs. However, in some cases, these
Table 2. Changes in Emissions of Criteria Air Pollutants Percent Reductions in Emissions of CAPs and NH3
1990-2002, % Reductions NOx 16% VOC 15% SO2 34% PM10
a 27% PM2.5
a 20% NH3 2% CO 26% Pb 52% a Directly emitted particles only Source: 2002 NEI version 1. comparisons also reflect improvements in emission estimation methodologies over time. It has not always been feasible to backcast emissions into previous inventory years using improved estimation procedures. Changes in emissions are also due in part to increasing awareness by our State, Local and Tribe emissions inventory partners of the importance of some categories and pollutants. For example, SO2 has been reduced through emission controls on electric generating units (EGU), NOx from EGU and mobile source programs, VOC from mobile source programs and solvent reformulation, PM2.5 from new source performance standards for woodstoves and general reductions due to controls on industrial processes and boiler emissions. Lead was dramatically decreased due to the removal of lead from gasoline in the 1980’s and continuing reductions in industrial emissions. Emission estimation methodology improvements have resulted in lower emission estimates from fugitive dust sources and for ammonia (a PM precursor). On the other hand, emission estimates for condensible organics were greatly improved in the 1990’s and emission estimates for open fires have recently been improved.
10

Individual Pollutant Analyses – Criteria Pollutants In addition to providing multi-pollutant emissions inventory data analysis, we provide detailed information CAPs and the 40 HAPs previously discussed. The individual pollutant analyses allow for more in-depth analysis of emissions for the individual pollutants and these analyses are included in Appendix B. Each pollutant sheet includes sector details of the individual pollutants, as well as, emission density maps and ambient concentrations maps where available. Comparisons of emissions are made in sector detail between 1990 and 2002. 2002 emissions are presented by detailed sector categorization for the 12 sectors previously discussed and for four major categories: transportation, fuel combustion, industrial process, and miscellaneous. Emissions densities are shown for each pollutant by county. The distribution of emissions are presented in thirds with the lowest emissions levels shown in light green, medium levels in medium green and highest densities in dark green. The ambient concentration maps show how monitored concentrations of ambient air varied across the country in 2002. The concentrations are displayed in ranges, with the lower concentrations being green, and the higher concentrations being orange, red and purple (where applicable). In general, the ranges and colors are consistent with the Air Quality Index (AQI) levels, so green and yellow are below the level of the standard and orange, red, and purple are above. The air quality indicator (e.g. annual mean, 2nd maximum) for each pollutant corresponds to the form of the National Ambient Air Quality Standard (NAAQS). For pollutants like PM2.5 and PM10 that have more than one standard (e.g. annual and 24-hour), the indicator for the "controlling" standard (or the standard that results in the greatest level of control) is represented in the map. The indicators are computed at each monitoring site and the highest in the county is plotted on the map. With few exceptions, monitored concentrations of CO, Pb, NO2, and SO2 were below the level of the NAAQS in 2002. Ozone and PM maps, on the other hand, show that many areas had concentrations above the level of the NAAQS in 2002. While most of the PM10 problem areas were in the west, ozone and PM2.5 had levels above the NAAQS in the east and west. Ozone was higher in 2002 (than in subsequent years based upon ambient air monitoring) in many areas partly due to meteorology. Since sunlight and hot weather in combination with NOx and VOC emissions create ground-level ozone, meteorology does impact ozone levels in any given year. In addition, the NOx Budget Trading Program has successfully reduced ozone season NOx emissions, and consequently ozone concentrations, in many parts of the eastern U.S. since 2002. Ammonia – 2002 emissions of ammonia were 4,236 thousand tons, which represents a 2 percent reduction from 1990 to 2002. Seventy-eight percent of 2002 ammonia emissions come from fertilizer and livestock emissions. The density map of ammonia emissions indicates high emissions in agricultural regions of the Midwest, California, the Northeast and Middle Atlantic states
11

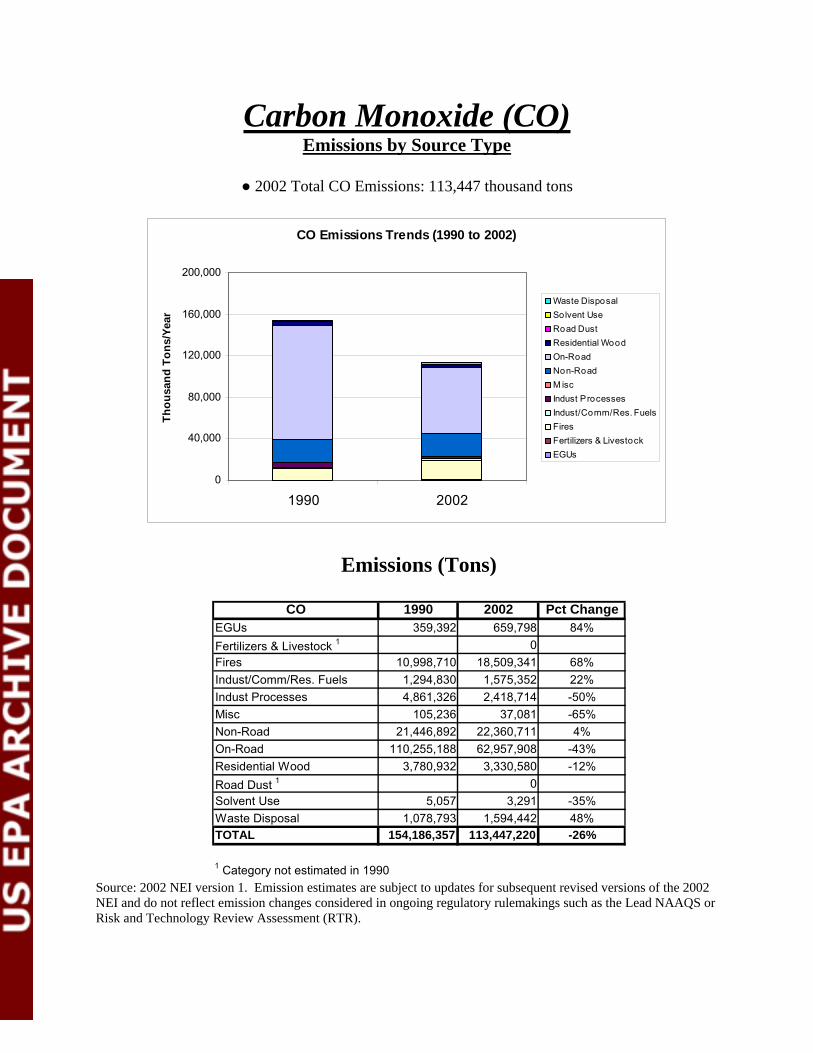
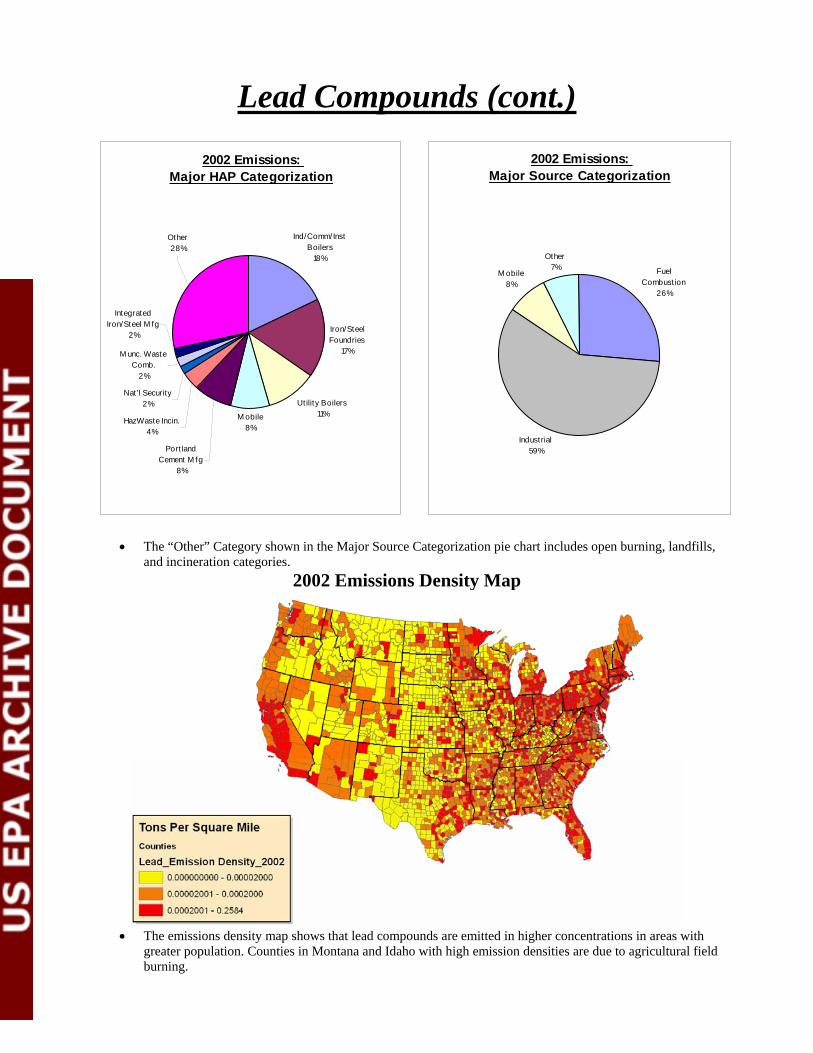
Carbon Monoxide – 2002 emissions of CO were 113,447 thousand tons, a decrease of 26 percent from 1990. Mobile sources contributed 76 percent of these emissions in 2002 with fires as the next highest source accounting for 16 percent of 2002 emissions. The density map of emissions shows higher CO emissions in the eastern US. The ambient monitoring data for 2002 reflect that all counties with the exception of one were below the standard in 2002. Lead Compounds – 2002 emissions of lead were 1,726 tons. Stationary source and mobile source regulations have reduced lead compound emissions approximately 52% since 1990. Lead compounds are emitted from a variety of industrial sources. Industrial, commercial and institutional boilers, iron and steel foundries, and utility boilers account for approximately 46 percent of total 2002 emissions. Nitrogen Oxides – Nationwide emissions of nitrogen oxides were 21,373 thousand tons in 2002 a 16 percent decrease from 1990 levels. Mobile emissions account for 59 percent and EGU 22 percent of total NOx emissions. All areas in the country are below the NO2 standard in 2002. For the O3 standard, there are areas in the east and west that experienced ozone concentrations above the 8 hour standard of 0.08 ppm in 2002. Particulate Matter (PM2.5) - 2002 emissions of primary PM2.5 were 6,031 thousand tons nationwide. Methodology changes in primary PM2.5 make a comparison between 1990 and 2002 emission levels somewhat problematic for many sources of these emissions. Multiple sources account for emissions with 26 percent of these emissions generated by fires and 18% by road dust. Areas exceeding the PM2.5 annual standard in 2002 are located in both the eastern and western parts of the US. Particulate Matter (PM10) – 2002 total emissions of PM10 were 21,919 thousand tons nationwide, a 27 percent decrease from 1990 levels. Road dust is the source of 49 percent of these emissions in 2002. Areas in the country exceeding the 24-hour standard in 2002 are located primarily in the west. Sulfur Dioxide (SO2) – Emissions of SO2 were 15,293 thousand tons in 2002, a decrease of 34 percent from 1990 levels. Emissions from EGUs accounted for 70 percent of emissions in 2002. EGUs emissions declined by 34 percent between 1990 and 2002. Based upon monitoring data, no areas in the country exceeded the SO2 24-hour standard in 2002. Volatile Organic Compounds (VOC) – 2002 emissions of VOCs were 20,481 thousand tons, a 15 percent decrease from 1990 levels. Mobile sources accounted for 36 percent of total VOC emissions followed by solvent related emissions of 21 percent. Air Toxics Background
12

Toxic air pollutants, also known as hazardous air pollutants, are those pollutants that are known or suspected to cause cancer or other serious health effects, such as reproductive effects or birth defects, or adverse environmental effects. For more information on the health and environmental effects of HAPs, see http://www.epa.gov/air/toxicair/newtoxics.html#health.
Before 1990, EPA had regulated air toxics by writing eight National Emissions Standards for Hazardous Air Pollutants (NESHAP) using a risk reduction approach that proved slow and cumbersome. In the 1990 amendments to the Clean Air Act, Congress mandated EPA to regulate the emissions of 189 HAPs. The list of HAPs is in section 112(b) of the Clean Air Act and at http://www.epa.gov/ttn/atw/orig189.html. Please note that caprolactam, ethylene glycol monobutyl ether, and methyl ethyl ketone are no longer listed as HAPs. Although there are 187 HAPs, some groups of HAPs have been individually listed. For example, xylenes (isomers and mixture) are listed on the list of 188, followed by o-xylenes, m-xylenes, and p-xylenes isomers. In addition, all the metals are listed including compounds, such as antimony compounds, arsenic compounds, beryllium compounds, etc., to indicate all of these metal compounds (instead of only the elemental form of the metal) should be considered a HAP and, thus, subject to air toxics regulations. Other compounds on the HAP list include polychlorinated biphenyls, radionuclides, polycyclic organic matter, cyanide compounds, glycol ethers, and fine mineral fibers. Radionuclides are a special air toxic pollutant because they are not measured and regulated in the same manner as the rest of the HAPs.
In order to comply with Congress’s mandate, EPA determined the major source categories of air toxics emissions and subsequently wrote 96 technology-based standards (also called Maximum Achievable Control Technology (MACT) Standards) for 174 source categories to control HAP emissions. For a complete list of the standards and the sources regulated, go to http://www.epa.gov/ttn/atw/mactfnlalph.html. The HAP emissions reductions from the technology-based standards are estimated to be 1.7 million tons when the rules are fully implemented in 2007. Congress also required EPA to revisit the MACT standards every 8 years to determine whether the standards are still effective and protective of human health. This Congressional mandate requires EPA to conduct a residual risk assessment to determine whether the MACT is adequately protecting human health. For more information on EPA’s residual risk program, see http://www.epa.gov/ttn/atw/rrisk/residriskpg.html. In the Clean Air Act, Congress defined major stationary sources of HAPs emissions to be those that emit or have the potential to emit 10 tons of one pollutant or a combination of 25 or more tons of a combination of pollutants. Sources emitting smaller amounts of HAPs are defined as area sources. Area sources are small emitters of HAPs individually, but are collectively important contributors in urban areas. Area sources represent 65% of the national stationary source emissions. Many area sources emit toxic metals and organics that may pose significant health threats to sensitive populations such as children and the elderly, and can contribute to fine particulate matter and ozone. The Clean Air Act also includes two provisions, section 112(c)(3) and 112(k)(3)(B)(ii) that instruct EPA to identify and list source categories representing at least 90 percent of the
13

emissions of the 30 ``listed'' HAPs that pose the greatest public health risks to urban areas and that are, or will be, subject to standards under section 112(d) of the CAA (see the Integrated Urban Air Toxics Strategy, 64 FR 38706, July 19, 1999 for more information). For more information on area sources, please see http://www.epa.gov/ttn/atw/urban/urbanpg.html. Automobiles and trucks are also sources of hazardous air pollutants (i.e., diesel exhaust is a HAP). There have been several regulations and initiatives (including a voluntary initiative to retrofit school buses with newer, more efficient burning engines) to reduce emissions from mobile sources. Many of the HAPs are either volatile organic compounds or particulate matter, and the measures and regulations developed to control criteria pollutants will also reduce the emissions of HAP. All of these measures combined are expected to greatly reduce emissions of and subsequent exposure to air toxics. Intuitively, large sources like petrochemical facilities, petroleum refineries, gas stations, and incinerators come to mind as big contributors of air toxics emissions. However, almost all industries have air toxics emissions. Sources such as electric generating units, foundries, coke ovens, brick manufacturers, glass manufacturers, automobile manufacturing, surface coating, municipal waste landfills, and many other types of industry emit air toxics. In addition, many common smaller facilities such as gas stations and dry cleaners emit significant quantities of air toxics. As mentioned above, automobiles, trucks, and off-road mobiles sources (such as airplanes and construction equipment) emit air toxics. Trends in the Air Toxics Data Although EPA and the S/L/Ts collect data from most or all of the 187 HAPs listed in the Clean Air Act, EPA is only showing the data and trends from 40 air toxics in this booklet. We chose to describe the emissions and risks from only 40 of the 187 HAPs because these pollutants are the primary risk drivers for risks from inhalation in NATA or on the list of 33 HAPs identified as urban area source HAPs. In other words, these air toxics are the most prevalent and have higher potential to cause adverse health effects from chronic inhalation to the public. The selection of these HAPs is not based on other important routes of exposure that cause adverse health effects to humans including acute exposures and multi-pathway exposures to PB-HAPs or adverse ecological effects. Generally, all of the stakeholders, including EPA, State, Local, and Tribal Air Pollution Control Agencies, industry, and the public have made great strides in reducing air toxics emissions in the past 16 years. In total, the 2002 National Emissions Inventory shows air toxics emissions of 4.5 million tons per year which is down from 7.1 million tons per year in 1990. This is a 37 percent decrease and more reductions are expected in the near future as additional area source standards and mobile source rules are promulgated.
(1) Major sources’ air toxics trends
14

Air Toxics emissions from major sources have been greatly reduced from 1990 to 2002. The National Emissions Inventory shows a more than 50 percent decrease from 1.9 million tons per year in 1990 to 0.9 tons in 2002. The primary reason for this decline is the implementation of the National Emission Standards for Hazardous Air Pollutants (NESHAP) that is technology standards known as Maximum Achievable Control Technology (MACT) standards. By 2002, most of the MACT standards had been promulgated and implemented and the emissions reductions achieved. Reduction of air toxics emissions from MACT standards were expected to be 1.7 million tons per year when all become fully implemented. One of the MACT standards that accounted for much air toxics reductions is the Hazardous Organic NESHAP that reduced emissions for Synthetic Organic Chemical Manufacturers. Generally, much of the emissions reductions are from the sources that emit the 40 air toxics described in this booklet.
(2) Area Source Air Toxics Trends The air toxics emissions from area source also decreased from 1.9 million tons per year in 1990 to 1.7 million tons per year in 2002. Several standards, such as those regulating dry cleaners, and halogenated solvent degreasers, are responsible for much of the area source HAP emission reductions. However, one large source of air toxics emissions from area sources, fires (both prescribed and wild fires), increased from 0.2 million tons per year in 1990 to 0.3 million tons per year in 2002. One of the reasons for this increase may be the way in which emissions from fires are estimated. Fire estimation techniques improved from the 1990 to 2002 emission inventories. EPA is currently developing standards for the area source categories that were identified in The Integrated Urban Air Toxics Strategy (64 FR38706). Fifteen area source standards have been implemented previously as part of the MACT standards development.
(3) Mobile Sources’ Air Toxics Trends The air toxics emissions from onroad mobile sources decreased by more than 50 percent, 2.5 million tons per year to 1.2 million tons per year, from 1990 to 2002. The air toxics emissions from the nonroad mobile sources decreased slightly from 0.8 million tons per year in 1990 to 0.7 million tons per year. Further reductions are expected because EPA’s Office of Transportation and Air Quality is working on other rules and projects to reduce mobile source emissions. Changes in emissions of the 40 HAPs between 1990 and 2002 are shown in Table 3.
15

Table 3. Changes in Emissions of HAPs
Pollutant Percent Changes in Emissions of HAPs1
1990-2002, % Change (Reductions shown in brackets)1,1,2,2 - Tetrachlorethane 564%2
1,3 Butadiene (49)%
1,3- Dichlorpropene (39)%
2.4 – Toluene Diisocyanate (39)%
Acetaldehyde (36)%
Acrolein (5)%
Acrylonitrile (77)%
Antimony (22)%
Arsenic Compounds 138%3
Benzene (27)%
Benzidine (82)%
Beryllium Compounds 349%
Cadmium Compounds (55)%
Carbon Tetrachloride (94)%
Chlorine (87)%
Chloroform (42)%
Chromium Compounds (14)%
Coke Oven Emissions (40)%
Ethylene dibromide (51)%
Ethylene dichloride (96)%
Ethylene oxide (87)%
Formaldehyde (28)%
Hexachlorobenzene (78)%
Hexamethylene 1,6-diisocyanate (87)%
Hydrazine (70)%
Hydrochloric Acid 51%3
Maleic Anhydride (98)%
Manganese Compounds (26)%
Mercury Compounds (54)%
Methylene Chloride (62)%
Napthhalene (37)%
16

Percent Changes in Emissions of HAPs1 Pollutant 1990-2002, % Change (Reductions shown in brackets)
Nickel Compounds (3)%
Polychlorinated biphenyls (PCB) 28%
Polycyclic Organic Matter 11%4
Propylene dichloride (74)%
Quinoline (95)%
Tetrachloroethylene (67)%
Trichlorethylene (86)%
Triethylamine (42)%
Vinyl Chloride (79)% 1 Source: 2002 NEI Version 1. 2 Landfill emissions were not reported in 1990 and account for the increase in emissions reported for this pollutant. 3 Sources such as industrial, commercial and institutional boilers and process heaters and utility boilers are significantly underestimated in the 1990 NEI resulting in the increase in emissions recorded for this HAP between 1990 and 2002. 4 Categories such as residential wood combustion are underestimated in the 1990 NEI resulting reported increases in emissions of this pollutant between 1990 and 2002. Individual Pollutant Analyses – Hazardous Air Pollutants The individual pollutant analyses are included in Appendix B. Each pollutant sheet includes sector details of the individual pollutants and emission density maps. Comparisons of emissions are made in sector detail between 1990 and 2002. 2002 emissions are presented by detailed sector categorization for the important sectors for HAPs that may differ somewhat from the previously discussed. In addition to the detailed sector categorization emissions are shown for four major categories: transportation, fuel combustion, industrial process, and miscellaneous. Emissions densities are shown for each pollutant by county. The distribution of emissions are presented in thirds with the lowest emissions levels shown in light yellow, medium levels in orange and highest densities in red. Areas with no emissions are shown in white. A discussion of the individual pollutants follows: 1,1,2,2 – Tetrachlorethane – This pollutant is only emitted from stationary sources. Although emission reported in 2002 exceed emissions in 1990, this results from the fact that municipal landfill emissions were not available in the 1990 inventory. Emissions from landfills account for 81 percent of total emissions for this pollutant in 2002. Reductions in emissions of this pollutant have occurred due to the implementation of MACT standards for the HON and Rubber Tire Production. 1,3 Butadiene – Emissions of this pollutant decreased by approximated 50 percent between 1990 and 2002. Significant reductions have occurred in emissions due to implementation of MACT standards for the HON, Miscellaneous Organic Chemical Manufacturing and Polymers and Resins. Mobile sources account for 60 percent of the
17

1,3 Butadiene emissions in 2002. The emissions density map indicates that higher levels of emissions occur in the more populated counties in the U.S. 1,3- Dichloropropene – Emissions of this pollutant have declined by approximately 40 percent since 1990 due to the MACT standards for the HON and Hydrochloric Acid Production. Consumer and Commercial products account for 77% of the emissions of this pollutant in 2002. This HAP is emitted only from stationary non-point sources. Problems with consistent reporting in the nonpoint inventory exist. 2,4- Toluene Diisocyanate – Emissions of this HAP were reduced between 1990 and 2002 by approximately 40 percent due to MACT controls implemented for Flexible Polyurethane Foam Production, the HON, and Plastic Parts and Products Surface Coatings. This pollutant is emitted primarily from stationary surface coating processes and emissions of the pollutant tend to be higher in more populated counties of the country. Several categories of 2002 emissions including Printing and Publishing, Chemical Preparations, Architectural Surface Coating, and Leather Tanning were not reported in the 1990 NEI. Acetaldehyde – 2002 emissions have decreased 36 percent from 1990 levels due to the MACT program. This toxic is emitted from a variety of stationary and mobile sources with 57 percent of 2002 emissions coming from mobile sources. The second largest source category is open burning and significant emission estimation methodology improvements have occurred for the 2002 inventory. Acrolein – This pollutant is primarily emitted from combustion sources. Reductions of approximately 5 percent in annual emissions are reported between 1990 and 2002 due to a number of MACT standards. Open burning accounts for 66 percent of all emissions of this pollutant in 2002 and significant improvements in the estimation methods for this category are reflected in the 2002 NEI. Acrylonitrile – 2002 emissions of this toxic reflect a 77 percent decline from those reported in 1990. Significant stationary source reductions have occurred due to a number of major MACT standards. Landfills, the largest source of emissions of this pollutant in 2002 (43 percent of total emissions) are not well characterized in the 1990 inventory. Antimony Compounds – 2002 emissions show a drop of 22 percent for this toxic from 1990 levels. Antimony is emitted from a large number of source categories that contribute small amounts of emissions. Of the 164 source categories, 20 categories emit more than one ton. Antimony emissions are dominated by stationary point sources. Arsenic Compounds – Emissions of this pollutant have increased 138 percent. However, categories such as industrial/institutional/commercial boilers and utility boilers burning oil are significantly underestimated in the 1990 NEI and account the increase in this toxic pollutant. Approximately 82 percent of 2002 emissions of this toxic are emitted from these two source categories. Arsenic is emitted from a large number of sources that
18

contribute small amounts to emissions. Of the 285 source categories for this pollutant, only 21 have emissions exceeding 1 ton. Benzene – 2002 Benzene emissions declined by 27 percent from 1990 levels due to implementation of major MACT rules. The major source category of benzene emissions are mobile sources that accounts for 55 percent of the total. Emission trends for benzene agree well with ambient monitoring data trends. The emissions density map for benzene reflects that emissions are greater in more populated counties consistent with mobile sources accounting for over 50 percent of the emissions of this pollutant annually. Benzidine –2002 emissions have dropped 82 percent from the levels reported in 1990 due to the MACT program. This pollutant is emitted only from stationary sources and some source categories reported in 2002 are not reported in 1990. This pollutant is only reported to be emitted in 11 counties in the continental United States. Beryllium Compounds – Beryllium is emitted by a large number of sources that contribute small amounts of emissions. Of the 196 source contributing emissions only 12 categories emit more than 1 ton annually. Industrial, commercial and institutional boilers contribute 79 percent of the emissions of this HAP. Cadmium Compounds – The 2002 emissions of this pollutant have decreased approximately 55 percent from reported 1990 amounts. A number of MACT standards have resulted in emission reductions of this toxic. A large number of source categories contribute small amounts to the total emissions of Cadmium Compounds with only 13 of the 301 source categories emitted more than one ton annually in 2002. Carbon Tetrachloride –Emissions of this toxic have decline significantly (by approximately 94%) since 1990 due to the phase out of the production and use of this chemical by the Montreal Protocol of 1990. Industrial sources account for the majority of emissions for this toxic. Synthetic Organic Chemical Manufacturing and pulp and paper production account for 34 percent and 27 percent of the annual 2002 emissions of this pollutant, respectively. Chlorine – Emissions of chlorine have declined significantly from 1990 levels (87%). MACT standards for a number of source categories account for this decline. A number of source categories reported in 2002 were not reported or not well characterized in the 1990 NEI. The largest source of chlorine emissions comes from Primary Magnesium Refining in Utah with approximately 50 percent of the nationwide emissions coming from this source. Chloroform – 2002 emissions declined by approximately 42 percent for 1990 levels for this toxic. Chloroform is emitted from stationary sources and the MACT program is responsible for these decreases. Swimming pools account for 90 percent all 2002 emissions of this pollutant and the inventory for the source was not well characterized in 1990.
19

Chromium Compounds– The MACT standards for a number of source categories have resulted in declines in the inventory of this toxic in 2002. Industrial sources explain 49 percent of this pollutants sources and fuel combustion sources account for an additional 46 percent of the total emissions for this pollutant. Coke Oven Emissions – Coke Oven Emissions have declined 40 percent in 2002 from levels in 1990 due to implementation of the MACT standard. Coke oven estimates include 2 categories: Pushing, Quenching & Battery Stands and Charging, Top Side and Door Leaks. Coke oven emissions are emitted in 19 counties in the continental United States. Ethylene Dibromide - 2002 emissions of this HAP show over 50 percent declines from 1990 estimates. Emissions of Ethylene Dibromide come from stationary sources only. Utility coal boilers account for 64 percent of the total reported emissions in 2002, and this source category was not reported in the 1990 NEI. Ethylene dichloride – This HAP is emitted from stationary sources only and decreases of 96 percent have occurred between 1990 and 2002. These decreases are thee result of a number of MACT standards. Approximately 68 percent of 2002 emissions came from industrial sources Ethylene Oxide – Emissions of this pollutant have decline approximately 87 percent since 1990 due to MACT standards for a number of source categories. This HAP is emitted by stationary sources only. Industrial processes account for 78 percent of all emissions for this HAP in 2002. Formaldehyde – Emissions of this HAP have declined by 28 percent from 1990 reported emissions. Stationary and mobile source reductions have occurred since 1990. Mobile sources account for 44 percent of emissions and Open, Prescribed, and Wild Fires explain 42 percent of these HAP emissions in 2002. A number of the emission categories for this pollutant were not reported in 1990 or methodology improvements have occurred. Such is the case for the fire emissions. Formaldehyde has significant contributions in the ambient air from secondary formation. Hexachlorbenzene – This HAP is emitted from stationary sources only. Reductions of 78 percent have occurred between 1990 and 2002 due to the MACT standards. Pesticide applications and open burning result in 28 percent and 16 percent of the 2002 total emissions of this HAP. Hexamethylene 1,6-diisocyanate – Stationary source emission decreases of 87 percent have occurred since 1990 for this HAP. Industrial processes account for 92 percent of the total emissions of this HAP. Hydrazine – This HAP is emitted from stationary sources and emission reductions have occurred from a number of MACT standards implementation. A number of source categories were not reported in the 1990 NEI. Industrial processes account for 99 percent
20

of total emissions of hydrazine in 2002. Emissions were reported only in 52 counties in the continental US in 2002. Hydrochloric Acid – Emissions reported in 2002 are 51 percent greater for this HAP than in 1990 because the major source categories of utility boilers and industrial, commercial and institutional boilers and process heaters were underestimated in the 1990 NEI. This HAP is emitted from stationary sources only with utility boilers emitting 60 percent and industrial commercial and institutional boilers emitting 33 percent of total 2002 emissions of hydrochloric acid. Maleic Anhydride – Emissions of this pollutant have declined 98 percent since 1990 due to MACT controls implemented for stationary sources. Synthetic Organic Chemical Manufacturing is the major source of emissions accounting for 68 percent of the total in 2002. This pollutant is emitted in only 160 counties in the United States. Manganese Compounds – Reductions of emissions of Manganese Compounds occurred between 1990 and 2002 (26 percent). These reductions are the result of MACT standards for a number of source categories. Industrial sources emit 64 percent of 2002 emissions and fuel combustion sources 34 percent. Mercury Compounds – 2002 reported mercury emissions show reductions of approximately 54 percent since 1990. Significant stationary source emission decreases have resulted from MACT implementations for a number of source categories. Utility boilers emitted 43 percent of the total reported mercury compound emissions for 2002. Methylene Chloride – Emissions of this HAP declined by 62 percent from 1990 to 2002. This HAP is emitted only by stationary sources and implemented MACT standards are responsible for the decline in emissions. In 2002 paint stripping was the largest souce category resulting in 39 percent of total emissions of this HAP. Napthalene – Emissions of naphthalene have been reduced by 37 percent since 1990. Both stationary source regulations (MACT) and mobile source regulations have reduced these emissions during the period 1990 and 2002. Emission estimation methodologies have been improved for a number of source categories for this HAP in the 2002 NEI. Mobile source emissions are 31 percent, fuel combustion 25 percent, and industrial sources 22 percent of total 2002 NEI reported emission of napthalene. Nickel Compounds – Emissions of this pollutant declined 3 percent between 1990 and 2002. Stationary source reductions have occurred due to implementation of a number of MACT standards. Fuel combustion sources are the major source of emissions in 2002 and emissions for certain of these categories were underestimated in the 1990 NEI. PCBs – Emissions of PCBs increased by 28 percent in 2002 when compared to 1990 levels. PCBs are emitted from stationary sources only. The major sources of 2002 emissions are from open burning of residential waste and the emissions from an incinerator located in UT.
21

Polycyclic Organic Matter – Emissions of this pollutant increased 11 percent between 1990 and 2002. In general emissions have declined for most of the source categories due to the MACT program. However, emission methodologies have improved for open burning and residential wood combustion in the 2002 NEI. Residential wood combustion emissions explain 51 percent and open burning 29 percent of the total 2002 emissions of POM. Propylene dichloride – Emissions of this HAP decreased by approximately 74 percent in 2002 when compared to 1990. This HAP is emitted from stationary sources and reductions come from the MACT standards for a number of source categories. Industrial processes represent 80 percent of emissions of this HAP in 2002. Quinoline – Emissions of this pollutant declined 95 percent between 1990 and 2002. This decline is the result of the MACT for the HON. Industrial processes are the major source of emissions of quinoline in the 2002 NEI. Emissions of this HAP are reported in only 26 counties in the US in 2002. Tetrachloroethylene – This HAP is emitted only by stationary sources and a number of MACT standards have resulted in a 67 percent decline in emissions since 1990. In 2002, dry cleaning facilities account for 63 percent of tetrachloroethylene emissions in the US. The density map of emission reflects that emissions of this HAP are greater in more populated counties in the country. Trichloroethylene – Emissions of trichloroethylene have declined by 86 percent between 1990 and 2002. These decreases have resulted from the MACT program. Industrial sources account form 92 percent of all 2002 emission of this HAP. Triethylamine – Emissions of Triethylamine have declined 42 percent in the 2002 NEI when compared to 1990 levels. This reduction is due to the MACT program for the HON, Pharmaceutical Production and Surface Coatings. Vinyl chloride – Emissions of vinyl chloride were 1,308 tons in 2002 a decrease of almost 80 percent from 1990. This decrease results from a number of MACT standards. Municipal landfills represent 46 percent of 2002 emission and emissions from this source were not well characterized in the 1990 NEI.
22

Authors:
OAQPS Data Analysis Team Tesh Rao, AQAG Ron Ryan, EIAG Rhonda Thompson, EIAG Brian Timin, AQMG Lee Tooly, EIAG Tom Driscoll, SPPD, MPG Tom McMullen, EIAG David Mintz, EIAG Tom Pace, EIAG Anne Pope, EIAG Linda Chappell, Team Lead, EIAG
Douglas Solomon – Group Leader Advisor Sara Terry PACS For questions, please contact: Linda Chappell Mail Code C339-02 RTP, NC 27711 919-541-2864
23

Appendix A – Source Categorization Detail for Figures 1, 2, and 3
42 Sector Category Names 12 Sector Category Names Livestock Waste Fertilizer Application
Fertilizer and Livestock
Fuel Comb - Electric Utility EGUs Fuel Comb - Industrial Boilers, Internal Combustion Engines Fuel Comb - Commercial/Institutional Fuel Comb - Residential Fossil
Industrial, Commercial and Residential Fuel Combustion
Fuel Comb - Residential Fireplaces Fuel Comb - Residential Woodstoves Residential Wood Waste Disposal Waste Disposal - Open Burning Waste Disposal Wildfires Prescribed Fires Agricultural Field Burning Logging Slash Burning
Fires Indus Process – NEC Commercial Cooking Industrial Process – Metals Industrial Process - Chemical Manufacturing Industrial Process - Storage & Transfer Industrial Process - Petroleum Refineries Industrial Process - Oil & Gas Production Industrial Process - Pulp & Paper Industrial Process - Cement Manufacturing Industrial Processes On-Road Vehicles - Gasoline On-Road Vehicles - Diesel On -Road Non-Road Equipment - Gasoline Non-Road Equipment - Diesel Planes, Trains, & Ships Non-Road Unpaved Roads Paved Roads Road_Dust Solvent - Non-industrial Surface Coating - Industrial Degreasing Surface Coating - Architectural Graphic Arts Solvent – Not Elsewhere Classified Dry Cleaning Solvent Use Agriculture - Crop Tilling & Livestock Dust Construction Gas Stations Bulk Gasoline Terminals Miscellaneous Sources Miscellaneous
24

25
Appendix B. Individual Pollutant Analysis

Ammonia (NH3) Emissions by Source Type
● 2002 Total NH3 Emissions: 4,235 thousand tons
NH3 Emissions (1990 and 2002)
0
500,000
1,000,000
1,500,000
2,000,000
2,500,000
3,000,000
3,500,000
4,000,000
4,500,000
5,000,000
1990 2002
Tons
/Yea
r
Waste DisposalSolvent UseRoad DustResidential WoodOn-RoadNon-RoadM iscIndust ProcessesIndust/Comm/Res. FuelsFiresFertilizers & LivestockEGUs
Emissions (tons)
NH3 1990 2002 Pct ChangeEGUs 0 35,710Fertilizers & Livestock 1,285,882 3,310,506 157%Fires 1 261,369Indust/Comm/Res. Fuels 25,246 24,455 -3%Indust Processes 268,943 208,505 -22%Misc 2,471,250 56,353 -98%Non-Road 30,724 13,509 -56%On-Road 154,859 289,567 87%Residential Wood 1 10,155Road Dust 1 0Solvent Use 1 303Waste Disposal 81,763 25,536 -69%TOTAL 4,318,667 4,235,970 -2%
1 Category not estimated in 1990 Source: 2002 NEI version 1. Emission estimates are subject to updates for subsequent revised versions of the 2002 NEI and do not reflect emission changes considered in ongoing regulatory rulemakings such as the Lead NAAQS or Risk and Technology Review Assessment (RTR).

Ammonia (NH3) (cont.)
2002 Emissions: Detailed Source Categorization
Fertilizer & Livestock
78%
Waste Disposal
1%
Fires6%
Indust/Comm/Res
Fuels1%
Solvent Use0%
Residential Wood0%
Road Dust0%
EGUs1%Industrial
Processes5%
Non-Road0%
On-Road7%
Misc.1%
2002 Emissions:Major Source Categorization
Fuel Com-bustion
2% Industrial Processes
5%
Trans-portation
7%
Misc.86%
2002 Emissions Density Map
Source: 2002 National Emissions Inventory, version 1.
Carbon Monoxide (CO) Emissions by Source Type
● 2002 Total CO Emissions: 113,447 thousand tons
CO Emissions Trends (1990 to 2002)
0
40,000
80,000
120,000
160,000
200,000
1990 2002
Thou
sand
Ton
s/Ye
ar
Waste DisposalSolvent UseRoad DustResidential WoodOn-RoadNon-RoadM iscIndust ProcessesIndust/Comm/Res. FuelsFiresFertilizers & LivestockEGUs
Emissions (Tons)
CO 1990 2002 Pct ChangeEGUs 359,392 659,798 84%Fertilizers & Livestock 1 0Fires 10,998,710 18,509,341 68%Indust/Comm/Res. Fuels 1,294,830 1,575,352 22%Indust Processes 4,861,326 2,418,714 -50%Misc 105,236 37,081 -65%Non-Road 21,446,892 22,360,711 4%On-Road 110,255,188 62,957,908 -43%Residential Wood 3,780,932 3,330,580 -12%Road Dust 1 0Solvent Use 5,057 3,291 -35%Waste Disposal 1,078,793 1,594,442 48%TOTAL 154,186,357 113,447,220 -26%
1 Category not estimated in 1990 Source: 2002 NEI version 1. Emission estimates are subject to updates for subsequent revised versions of the 2002 NEI and do not reflect emission changes considered in ongoing regulatory rulemakings such as the Lead NAAQS or Risk and Technology Review Assessment (RTR).

Carbon Monoxide (CO) (cont.)
2002 Emissions:Detailed Source Categorization
Non-Road20%On-Road
56%
Fires16%
Industrial Processes
2%
Misc.0%
Solvent Use0%
EGUs1%
Fertilizer & Livestock
0%
Waste Disposal
1%Road Dust
0%Residential
Wood3%
Indust/ Comm/
Res Fuels1%
2002 Emissions:Major Source Categorization
Misc.18%
Fuel Com-bustion
5%
Industrial Processes
2%
Trans-portation
75%
2002 Emissions Density Map
Source: 2002 National Emission Inventory, Version 1.

Carbon Monoxide (CO) (cont.)
Ambient CO by County, 2002: second-high non-overlapping 8-hr average
Concentration PPM < 4.5 4.5 - 9.4 9.5 - 12.4
The level of the CO 8-hour standard is 9 ppm (9.5 is above the level of the standard).

Lead Compounds • HAP Category Name: Lead Compounds • Includes 26 compounds in the NEI • Toxicity: Potential NonCancer Effects • 521 Source Categories • 2002 Total Emissions: 1,726 tons
Emissions Trends (1990 to 2002)
0
500
1,000
1,500
2,000
2,500
3,000
3,500
4,000
1990 2002
Tons
/Yea
r
Industrial/Commercial/ InstitutionalBoilers & Process HeatersIron and Steel Foundries
Utility Boilers
M obile sources
Portland Cement M anufacturing
M uncipal Waste Combustors
Integrated Iron & Steel M anufacturing
Other Categories ( 467categories)
1990 2002 Pct ChangeIndustrial/Commercial/ Institutional Boilers & Process Heaters 106.16 310.94 192.9%Iron and Steel Foundries 98.27 288.07 193.1%Utility Boilers 93.65 186.79 99.5%Mobile sources 1,041.89 142.83 -86.3%Portland Cement Manufacturing 10.86 134.05 1134.3%Muncipal Waste Combustors 180.46 32.84 -81.8%Integrated Iron & Steel Manufacturing 190.15 32.71 -82.8%Other Categories ( 467categories) 1,876.74 597.83 -68.1%TOTAL 3,598.2 1,726.1 -52.0%
Emissions (Tons)
• Stationary source and mobile source regulations have reduced lead compounds emissions by approximately
52 % since 1990. Lead compounds are emitted from a variety of stationary and mobile sources. • Significant stationary source reductions have occurred due to the implementation of Maximum Achievable
Control Technology (MACT) standards for Primary Lead Smelting, Integrated Iron & Steel Manufacturing, Pulp & Paper Production, Secondary Lead Smelting, Secondary Copper Smelting, and Primary Copper Smelting sources.
• Categories such as utility and industrial/commercial/institutional boilers are underestimated in the 1990 NEI.
• Mobile sources present in 2002 are from nonroad categories. Source: 2002 NEI version 1. Emission estimates are subject to updates for subsequent revised versions of the 2002 NEI and do not reflect emission changes considered in ongoing regulatory rulemakings such as the Lead NAAQS or Risk and Technology Review Assessment (RTR).
Lead Compounds (cont.)
2002 Emissions: Major HAP Categorization
Ind/Comm/Inst Boilers
18%
Iron/Steel Foundries
17%
Utility Boilers11%M obile
8%
Port land Cement M fg
8%
HazWaste Incin.4%
Nat'l Security2%
M unc. Waste Comb.
2%
Integrated Iron/Steel M fg
2%
Other28%
2002 Emissions: Major Source Categorization
Fuel Combustion
26%
Industrial59%
M obile8%
Other7%
• The “Other” Category shown in the Major Source Categorization pie chart includes open burning, landfills,
and incineration categories. 2002 Emissions Density Map
• The emissions density map shows that lead compounds are emitted in higher concentrations in areas with
greater population. Counties in Montana and Idaho with high emission densities are due to agricultural field burning.

Nitrogen Oxides (NOx) Emissions by Source Type
● 2002 Total NOx Emissions: 21,343 thousand tons
NOx Emissions (1990 and 2002)
0
5,000,000
10,000,000
15,000,000
20,000,000
25,000,000
30,000,000
1990 2002
Tons
/Yea
r
Waste DisposalSolvent UseRoad DustResidential WoodOn-RoadNon-RoadM iscIndust ProcessesIndust/Comm/Res. FuelsFiresFertilizers & LivestockEGUs
Emissions (Tons)
NOx 1990 2002 Pct ChangeEGUs 6,640,871 4,722,007 -29%Fertilizers & Livestock 1 2,099Fires 366,016 208,453 -43%Indust/Comm/Res. Fuels 3,869,900 2,533,942 -35%Indust Processes 1,105,535 1,164,770 5%Misc 32,960 12,250 -63%Non-Road 3,780,845 4,402,837 16%On-Road 9,592,113 8,133,567 -15%Residential Wood 45,863 43,596 -5%Road Dust 1 0Solvent Use 3,245 8,987 177%Waste Disposal 91,482 110,348 21%TOTAL 25,528,828 21,342,858 -16%
1 Category not estimated in 1990
Source: 2002 NEI version 1. Emission estimates are subject to updates for subsequent revised versions of the 2002 NEI and do not reflect emission changes considered in ongoing regulatory rulemakings such as the Lead NAAQS or Risk and Technology Review Assessment (RTR).

Nitrogen Oxides (NOx) (cont.)
2002 Emissions: Detailed Source Categorization
EGUs22%
Non-Road21%
On-Road38%
Waste Disposal
1%
Misc.0%
Industrial Processes
5%
Fertilizer & Livestock
0%
Fires1%
Road Dust0%
Solvent Use0%
Residential Wood0%
Indust/ Comm/Res
Fuels12%
2002 Emissions:Major Source Categorization
Fuel Com-bustion34%
Industrial Processes
5%
Misc.2%
Trans-portation
59%
2002 Emissions Density Map
Source: 2002 National Emissions Inventory, version 1.

Nitrogen Oxides (NOx) (cont.) Ambient NO2 by County, 2002: Highest annual mean
Concentration PPM < .0275 .0275 - .0534
The level of the NO2 standard is 0.053 ppm (0.0535 is considered above the level of the standard).
Ambient O3 by County, 2002: Fourth highest daily maximum 8-hr average
Concentration PPM < .065 .065 - .084 .085 - .104.105 - .124 .125 - .374
The level of the O3 8-hour standard is 0.08 ppm (0.085 is considered above the level of the standard).

Particulate Matter (PM2.5) Emissions by Source Type
● 2002 Total PM2.5 Emissions: 6,031 thousand tons
PM2.5 Emissions: (1990 and 2002)
0
1,000,000
2,000,000
3,000,000
4,000,000
5,000,000
6,000,000
7,000,000
8,000,000
1990 2002
Tons
/Yea
r
Waste DisposalSolvent UseRoad Dust 3Residential WoodOn-RoadNon-RoadM iscIndust ProcessesIndust/Comm/Res. FuelsFires 3Fertilizers & Livestock 2EGUs 1
Emissions (Tons)
PM2.5 1990 2002 Pct ChangeEGUs 1 121,325 514,319 324%Fertilizers & Livestock 2 4,444Fires 3 1,016,599 1,526,650 50%Indust/Comm/Res. Fuels 264,023 299,290 13%Indust Processes 642,419 494,629 -23%Misc 1,907,451 991,821 -48%Non-Road 300,147 301,334 0%On-Road 322,831 148,433 -54%Residential Wood 501,281 430,004 -14%Road Dust 3 2,244,771 1,044,146 -53%Solvent Use 3,942 7,030 78%Waste Disposal 233,526 269,251 15%TOTAL 7,558,315 6,031,351 -20%
1 1990 excludes PM-Condensible fraction2 Category not estimated in 19903 Methodology changes between years
Source: 2002 NEI version 1. Emission estimates are subject to updates for subsequent revised versions of the 2002 NEI and do not reflect emission changes considered in ongoing regulatory rulemakings such as the Lead NAAQS or Risk and Technology Review Assessment (RTR).

Particulate Matter (PM2.5) (cont.)
2002 Emissions: Detailed Source Categorization
Fires26%
Industrial Processes
8%
Misc.16%
Non-Road5%
On-Road2%
Residential Wood7%
Road Dust18%
Solvent Use0%
Waste Disposal
4%Fertilizer & Livestock
0%
EGUs9%
Indust/ Comm/Res
Fuels5%
2002 Emissions:Major Source Categorization
Misc.64%
Fuel Com-bustion21%
Industrial Processes
8%
Trans-portation
7%
2002 Emissions Density Map

Particulate Matter (PM2.5) (cont.)
Ambient PM2.5 by County, 2002: Annual mean
he level of the PM2.5 annual standard is 15.0 μg/m3 (15.1 μg/m3 is above the level of the standard).
Concentration ug/m3 <= 12 12.1 - 15 15.1 - 20 20.1 - 40
T

Particulate Matter (PM10) Emissions by Source Type
● 2002 Total PM10 Emissions: 21,919 thousand tons
PM10 Emissions (1990 and 2002)
0
5,000,000
10,000,000
15,000,000
20,000,000
25,000,000
30,000,000
1990 2002
Tons
/Yea
r
Waste DisposalSolvent UseRoad Dust 2Residential WoodOn-RoadNon-RoadM iscIndust ProcessesIndust/Comm/Res. FuelsFires 2Fertilizers & Livestock 1EGUs
Emissions (Tons)
PM10 1990 2002 Pct ChangeEGUs 294,850 644,966 54%Fertilizers & Livestock 1 15,230Fires 2 1,158,794 1,801,525 55%Indust/Comm/Res. Fuels 375,154 926,880 147%Indust Processes 1,392,570 1,205,201 -13%Misc 9,572,518 5,560,069 -42%Non-Road 327,567 331,510 1%On-Road 385,337 203,260 -47%Residential Wood 501,281 443,989 -11%Road Dust 2 13,466,540 10,488,288 -22%Solvent Use 4,446 8,374 88%Waste Disposal 271,176 289,913 7%TOTAL 27,750,231 21,919,204 -27%
1 Category not estimated in 19902 Methodology changes between years
Source: 2002 NEI version 1. Emission estimates are subject to updates for subsequent revised versions of the 2002 NEI and do not reflect emission changes considered in ongoing regulatory rulemakings such as the Lead NAAQS or Risk and Technology Review Assessment (RTR).

Particulate Matter (PM10) (cont.)
2002 Emissions: Detailed Source Categorization
Misc.25%
Road Dust49%
Waste Disposal
1%
Solvent Use0%
Fires8%
EGUs3%
Fertilizer & Livestock
0% Indust/ Comm/Res
Fuels4%
Industrial Processes
5%
Non-Road2%
On-Road1%
Residential Wood2%
2002 Emissions:Major Source Categorization
Industrial Processes
5%
Misc.84%
Fuel Com-bustion
9%
Trans-portation
2%
2002 Emissions Density Map
Source: 2002 National Emissions Inventory, version 1.

Particulate Matter (PM10) (cont.)
Ambient PM10 by County, 2002: Second-high 24-hr average
Concentration ug/m3 < 55 55 - 154 155 - 254255 - 354 >= 425
The level of PM10 24-hour standard is 150 mg/m3 (155 mg/m3 is above the level of the standard).

Sulfur Dioxide (SO2) Emissions by Source Type
● 2002 Total SO2Emissions: 15,293 thousand tons
SO2 Emissions (1990 and 2002)
0
5,000,000
10,000,000
15,000,000
20,000,000
25,000,000
1990 2002
Tons
/Yea
r
Waste DisposalSolvent UseRoad DustResidential WoodOn-RoadNon-RoadM iscIndust ProcessesIndust/Comm/Res. FuelsFiresFertilizers & LivestockEGUs
Emissions (Tons) SO2 1990 2002 Pct Change
EGUs 15,908,598 10,454,869 -34% Fertilizers & Livestock 1 0 Fires 11,851 386,125 3158% Indust/Comm/Res. Fuels 3,974,205 2,416,256 -39% Indust Processes 2,209,403 1,247,230 -44% Misc 44,921 6,350 -86% Non-Road 370,573 493,334 33% On-Road 502,998 257,519 -49% Residential Wood 6,539 6,120 -6% Road Dust 1 0 Solvent Use 2,342 1,048 -55% Waste Disposal 44,749 24,368 -46% TOTAL 23,076,179 15,293,220 -34% 1 Category not estimated in 1990
Source: 2002 NEI version 1. Emission estimates are subject to updates for subsequent revised versions of the 2002 NEI and do not reflect emission changes considered in ongoing regulatory rulemakings such as the Lead NAAQS or Risk and Technology Review Assessment (RTR).

Sulfur Dioxide (SO2) (cont.)
2002 Emissions: Detailed Source Categorization
EGUs70%
Fires1%
Fertilizer & Livestock
0%
Indust/ Comm/Res
Fuels16%
On-Road2%
Road Dust0%
Solvent Use0%
Misc.0%
Non-Road3%
Residential Wood0%
Waste Disposal
0%Industrial Processes
8%
2002 Emissions:Major Source Categorization
Industrial Processes
8%
Fuel Com-bustion84%
Misc.3%
Trans-portation
5%
2002 Emissions Density Map
Source: 2002 National Emission Inventory, version 1.

Sulfur Dioxide (SO2) (cont.)
Ambient SO2 by County, 2002: Second-high 24-hr average
Concentration PPM < .034 .035 - .144
The level of the SO2 24 standard is 0.14 ppm (0.145 is above the level of the standard).

Volatile Organic Compounds (VOC) Emissions by Source Type
● 2002 Total VOC Emissions: 20,481 thousand tons
VOC Emissions (1990 and 2002)
0
5,000,000
10,000,000
15,000,000
20,000,000
25,000,000
30,000,000
1990 2002
Tons
/Yea
r
Waste DisposalSolvent UseRoad DustResidential WoodOn-RoadNon-RoadM iscIndust ProcessesIndust/Comm/Res. FuelsFiresFertilizers & LivestockEGUs
Emissions (Tons)
VOC 1990 2002 Pct ChangeEGUs 46,431 49,709 7%Fertilizers & Livestock 1 42,192Fires 1,031,297 3,924,916 281%Indust/Comm/Res. Fuels 195,307 149,947 -23%Indust Processes 2,122,066 1,687,766 -20%Misc 1,241,365 975,299 -21%Non-Road 2,661,723 2,626,373 -1%On-Road 9,388,018 4,660,578 -50%Residential Wood 717,517 1,662,020 132%Road Dust 1 1Solvent Use 5,751,230 4,315,040 -25%Waste Disposal 952,876 387,523 -59%TOTAL 24,107,830 20,481,365 -15%
1 Category not estimated in 1990
Source: 2002 NEI version 1. Emission estimates are subject to updates for subsequent revised versions of the 2002 NEI and do not reflect emission changes considered in ongoing regulatory rulemakings such as the Lead NAAQS or Risk and Technology Review Assessment (RTR).

Volatile Organic Compounds (VOC) (cont.)
2002 Emissions: Detailed Source Categorization
Fires19%
Industrial Processes
8%
On-Road23%
Residential Wood8%
Solvent Use21%
Road Dust0%
Misc.5%
Non-Road13%
Indust/ Comm/Res
Fuels1%
EGUs0%
Fertilizer & Livestock
0%
Waste Disposal
2%
2002 Emissions:Major Source Categorization
Industrial Processes
8%
Misc.47%
Fuel Com-bustion
9%
Trans-portation
36%
2002 Emissions Density Map

Volatile Organic Compounds (VOC) (cont.)
Ambient O3 by County, 2002: Fourth highest daily maximum 8-hr average
Concentration PPM < .065 .065 - .084 .085 - .104.105 - .124 .125 - .374
The level of the O3 8-hour standard is 0.08 ppm (0.085 is above the level of the standard).

1,1,2,2-Tetrachloroethane • HAP Category Name: 1,1,2,2-Tetrachloroethane • CAS Number: 79-34-5 • Chemical Formula: C2H2Cl4 Molecular Weight: 167.85 • Toxicity: Potential Cancer Risks • 84 Source Categories (2002) • 2002 Total Emissions: 297 tons
Emissions Trends (Tons)
0
50
100
150
200
250
300
350
1990 2002
Tons
/Yea
r
M unicipal Landfills
Landf ills
Dry Cleaning Facilit ies
Sewage Sludge Incinerat ion
Synthetic Organic Chemical M anufacturing(HON)Aerospace Industries
Rubber Tire Product ion
Other categories ( 55 categories)
1990 2002 Pct ChangeMunicipal Landfills 0.59 240.2 40611.9%Landfills 28.64Dry Cleaning Facilities 15.42Sewage Sludge Incineration 6.87 1.32 -80.8%Synthetic Organic Chemical Manufactur 28.65 1.05 -96.3%Aerospace Industries 0.62 0.62 0.0%Rubber Tire Production 6.21 0.1 -98.4%Other categories ( 55 categories) 1.81 9.66 433.7%TOTAL 44.75 297.01 563.7%
Emissions (Tons)
• 1,1,2,2-Tetrachloroethane is only emitted from stationary sources. • Stationary source reductions have occurred due to the implementation of Maximum Achievable Control
Technology (MACT) standards for the HON and Rubber Tire Production sources. • Landfills, the largest source of emissions in the 2002 NEI, were not reported in the 1990 NEI.
Source: 2002 NEI version 1. Emission estimates are subject to updates for subsequent revised versions of the 2002 NEI and do not reflect emission changes considered in ongoing regulatory rulemakings such as the Lead NAAQS or Risk and Technology Review Assessment (RTR).

1,1,2,2-Tetrachloroethane (cont.)
2002 Emissions: Major HAP Categorization
M unic. Landf ills81%
Other3%
Indust. Inorg. Chem. M fg
1%
Dry Cleaners5%
Landfills10%
2002 Emissions: Major Source Categorization
Fuel Combustion
0%
Industrial9%
Other91%
2002 Emissions Density Map
• The County Density map shows that 1,1,2,2-tetrachloroethane is emitted in 3051 counties of the 3141
counties in the 50 states. • Lowest range extends below 10-9 tons/sq. mi. White areas identify counties with actual zero emissions.

1,3-Butadiene • HAP Category Name: 1,3-Butadiene • CAS Number: 106-99-0 • Chemical Formula: C4H6 Molecular Weight: 54.09 • Toxicity: Potential Cancer Risks and NonCancer Effects • 174 Source Categories (2002) • 2002 Total Emissions: 46,950 tons
Emissions Trends (1990 to 2002)
0
10,000
20,000
30,000
40,000
50,000
60,000
70,000
80,000
90,000
100,000
1990 2002
Tons
/Yea
r
M obile sources
Open Burning - Forest , Wildf ires, and PrescribedFires
Synthet ic Organic Chemical M anufacturing (HON)
M iscellaneous Organic Chemical M anufacturing
Polymers and Resins 1 and 2
Other Categories (165 categories)
1990 2002 Pct ChangeMobile sources 59,122 27,770 -53%Open Burning - Forest, Wildfires, and Prescribed Fires 14,639 17,064 17%Synthetic Organic Chemical Manufacturing (HON) 14,323 319 -98%Miscellaneous Organic Chemical Manufacturing 872 89 -90%Polymers and Resins 1 and 2 920 5 -99%Other Categories (165 categories) 1,605 1,703 6%TOTAL 91,480 46,950 -49%
Emissions (Tons)
• Stationary source and mobile source regulations have reduced 1,3-butadiene emissions by approximately 50 % since 1990.
• Significant stationary source reductions have occurred due to the implementation of Maximum Achievable Control Technology (MACT) standards for the HON, Miscellaneous Organic Chemical Manufacturing, and Polymers and Resins sources.
• Emission estimation methodologies are different in 1990 and 2002 for the categories of: Open Burning: Forest and Wildfires and Prescribed Burns.
• Categories such as Agricultural Field Burning, Burning of Land Clearing Debris, and Residential Wood Combustion are reported in 2002 NEI but were not reported in the 1990 NEI.
Source: 2002 NEI version 1. Emission estimates are subject to updates for subsequent revised versions of the 2002 NEI and do not reflect emission changes considered in ongoing regulatory rulemakings such as the Lead NAAQS or Risk and Technology Review Assessment (RTR).

1,3 Butadiene (cont.)
2002 Emissions:Major HAP Categorization
Open/Presc./ Wild Fires
36%
Synth. Org. Chem. M fg
1%
M obile sources59%
Other2%
Ag. Field Burning
1%
Res. Wood Boilers
1%
2002 Emissions:Major Source Categorization
Industrial2%
Fuel Comb.1%
Other37%
M obile60%
• The “Other” Category shown in the Major Source. Categorization pie chart includes open burning categories, which have the significant emissions in 2002.
2002 Emissions Density Map
• The emissions density map shows that 1,3-butadiene is emitted in higher concentrations in areas with greater
population. The primary source of 1,3-butadiene emissions in 2002 is mobile sources, which can be correlated to population. The counties in Montana and Idaho with high emission densities are due to agricultural field burning
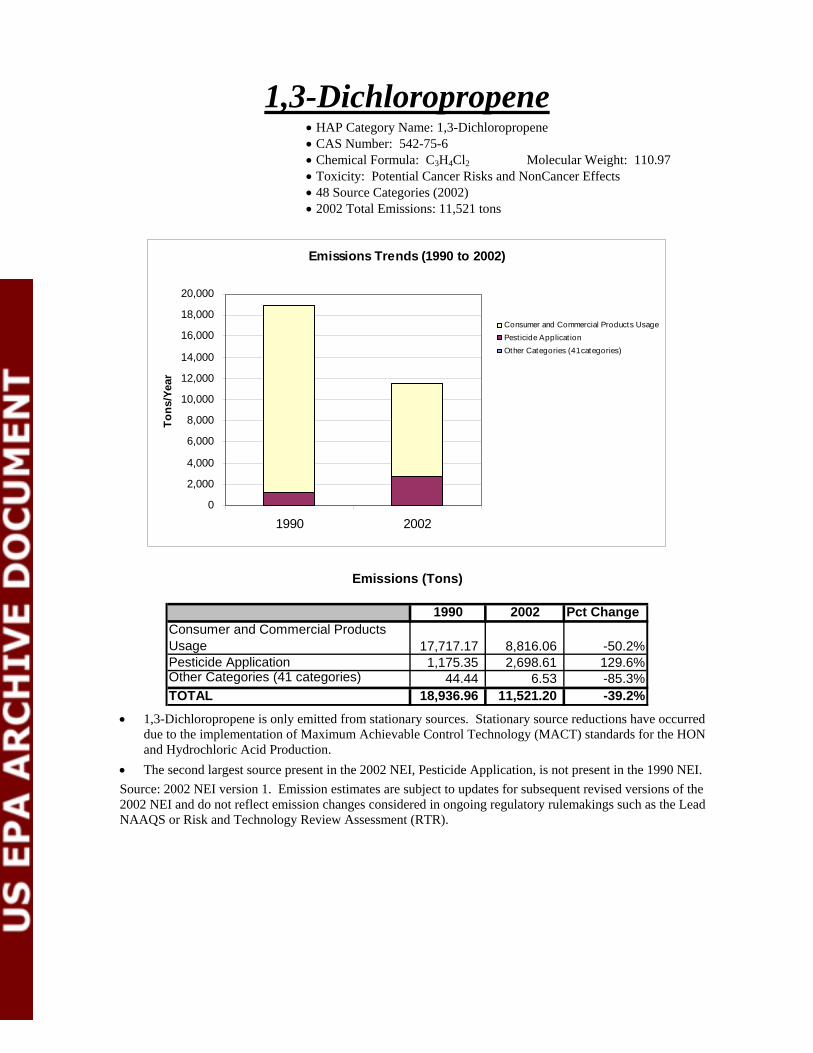
1,3-Dichloropropene • HAP Category Name: 1,3-Dichloropropene • CAS Number: 542-75-6 • Chemical Formula: C3H4Cl2 Molecular Weight: 110.97 • Toxicity: Potential Cancer Risks and NonCancer Effects • 48 Source Categories (2002) • 2002 Total Emissions: 11,521 tons
Emissions Trends (1990 to 2002)
0
2,000
4,000
6,000
8,000
10,000
12,000
14,000
16,000
18,000
20,000
1990 2002
Tons
/Yea
r
Consumer and Commercial Products UsagePesticide Applicat ionOther Categories (41 categories)
1990 2002 Pct ChangeConsumer and Commercial Products Usage 17,717.17 8,816.06 -50.2%Pesticide Application 1,175.35 2,698.61 129.6%Other Categories (41 categories) 44.44 6.53 -85.3%TOTAL 18,936.96 11,521.20 -39.2%
Emissions (Tons)
• 1,3-Dichloropropene is only emitted from stationary sources. Stationary source reductions have occurred
due to the implementation of Maximum Achievable Control Technology (MACT) standards for the HON and Hydrochloric Acid Production.
• The second largest source present in the 2002 NEI, Pesticide Application, is not present in the 1990 NEI. Source: 2002 NEI version 1. Emission estimates are subject to updates for subsequent revised versions of the 2002 NEI and do not reflect emission changes considered in ongoing regulatory rulemakings such as the Lead NAAQS or Risk and Technology Review Assessment (RTR).

1,3-Dichloropropene (cont.)
2002 Emissions: Major HAP Categoriztion
Pest icide App.23%
Other0%
Consumer/ Commercial
Prod77%
2002 Emissions: Major Source Categorization
Other100%
Fuel Combust ion
0%Industrial
0.1%
2002 Emissions Density Map
• The County Density map shows that 1, 3-dichloropropene is emitted in 1256 counties of the 3141 counties in the 50 states. The majority of emissions is in the nonpoint inventory and reported by states. Coverage of categories is not complete. Problems with consistent reporting in the nonpoint inventory exist.

2,4-Toluene Diisocyanate • HAP Category Name: 2,4-Toluene Diisocyanate • CAS Number: 26471-62-5 • Chemical Formula: C9H6N2O2 Molecular Weight: 174.16 • Toxicity: Potential Cancer Risk and NonCancer Effects • 67 Source Categories (2002) • 2002 Total Emissions: 86 tons
Emissions Trends (1990 to 2002)
0
20
40
60
80
100
120
140
160
1990 2002
Tons
/Yea
r
Hydrochloric Acid Product ion
Print ing And Publishing, Commercial Print ing
Chemical Preparat ions
Surface Coat ings: Architectural
Leather and Leather Products
Plast ic M aterials and Resins M anufacturing
Clay Refractories
Acrylic/M odacrylic Fibers Product ion
Rubber And Plast ics Products
Flexible Polyurethane Foam Product ion
M otor Vehicle Parts and Accessories
Synthet ic Organic Chemical M anufacturing (HON)
Other Categories (69 source categories)
1990 2002 Pct ChangePrinting And Publishing, Commercial Printing 36.17Chemical Preparations 0.01 14.75 147400%Surface Coatings: Architectural 9.82Leather and Leather Products 7.65Plastic Materials and Resins Manufacturing 0.54 3.45 539%Clay Refractories 11.96 2.37 -80%Acrylic/Modacrylic Fibers Production 2Rubber And Plastics Products 60.44 1.89 -97%Flexible Polyurethane Foam Production 24.61 0.73 -97%Motor Vehicle Parts and Accessories 10.16 0.37 -96%Synthetic Organic Chemical Manufacturing (HON) 11.08 0.17 -98%Hydrochloric Acid Production 4.51 -100%Other Categories (69 source categories) 16.42 6.52 -60%TOTAL 139.7 85.9 -39%
Emissions (Tons) 11/20/06
• 2,4-Toluene Diisocyanate is only emitted from stationary source categories. It is primarily emitted from surface coating processes.
• Several categories listed above are part of RTR; the 2002 emissions for these RTR categories will be significantly revised.
• Stationary source reductions have occurred due to the implementation of Maximum Achievable Control Technology (MACT) standards for the Flexible Polyurethane Foam Production, HON, and Plastic Parts & Products (Surface Coating).
• Many categories such as Printing and Publishing, Chemical Preparations, Architectural Surface Coating, and Leather Tanning, are reported in the 2002 NEI but were not reported in the 1990 NEI.
Source: 2002 NEI version 1. Emission estimates are subject to updates for subsequent revised versions of the 2002 NEI and do not reflect emission changes considered in ongoing regulatory rulemakings such as the Lead NAAQS or Risk and Technology Review Assessment (RTR).

2,4-Toluene Diisocyanate (cont.)
2002 Emissions: Major HAP Categorization
Print ing & Publishing
43%
Chem. Prep.17%
Acrylic Fiber Prod.
2%
Surface Coatings:
Archit .11%
Chem. & Allied Prod.
1%
Clay Refractories
3%
Plast ics/Resins M fg4%
Leather Prod.9%
Other8%
Rubber/ Plast ics Prod.
2%
2002 Emissions:Major Source Categorization
Other0% Fuel Comb.
1%
Industrial99%
2002 Emissions Density Map
• The emissions density map shows that 2,4-toluene diisocyanate is emitted in higher concentrations in areas
with greater population.
• The primary source of 2,4-toluene diisocyanate emissions in 2002 is surface coating operations, which can be correlated to population.

Acetaldehyde • HAP Category Name: Acetaldehyde • CAS Number: 75-07-0 • Chemical Formula: C2H4O Molecular Weight: 44.05 • Toxicity: Potential Cancer Risks and NonCancer Effects • 326 Source Categories (2002) • 2002 Total Emissions: 77,563 tons
Emissions Trends (1990 to 2002)
0
20,000
40,000
60,000
80,000
100,000
120,000
140,000
1990 2002
Tons
/Yea
r
Mobile sources
Open Burning - Forest , Wildf ires, and PrescribedFires
Resident ial Boilers: Wood/ Wood ResidueCombust ion
Pulp and Paper Product ion
Indust r ial/ Commercial/ Inst it ut ional Boilers &Process Heat ers
Agricult ural Field Burning
Plywood and Composit e Wood Product s
Ot her Cat egories (290 Ot her Cat egories)
1990 2002 Pct ChangeMobile sources 70,974 44,011 -38.0%Open Burning - Forest, Wildfires, and Prescribed Fires 14,747 17,201 16.6%Residential Boilers: Wood/Wood Residue Combustion 0 4,327Pulp and Paper Production 12,821 3,317 -74.1%Industrial/Commercial/ Institutional Boilers & Process Heaters 48 1,798 3619.2%Agricultural Field Burning 1,038Plywood and Composite Wood Products 1,517 615 -59.4%Other Categories (290 Other Categories) 21,700 5,255 -75.8%TOTAL 121,808 77,563 -36.3%
Emissions (Tons)
• Stationary source and mobile source regulations have reduced acetaldehyde emissions by approximately 36% since
1990. Acetaldehyde is emitted from a variety of stationary sources and from mobile sources. • Significant stationary source reductions have occurred due to the implementation of Maximum Achievable Control
Technology (MACT) standards for Pulp and Paper Production, HON, Plywood and Composite Wood Products Production, Polymers and Resins, and Miscellaneous Organic Chemical Manufacturing sources.
• Emission estimation methodologies are different in 1990 and 2002 for the categories of: Open Burning: Forest and Wildfires and Prescribed Burns.
• Categories such as Agricultural Field Burning, Residential Wood Combustion, Burning of Logging Debris and Charbroiling are reported in 2002 NEI but were not reported in the 1990 NEI. Note that the 1990 emissions for residential wood boilers are rounded to 0; the reported value is 0.02 tons.
Source: 2002 NEI version 1. Emission estimates are subject to updates for subsequent revised versions of the 2002 NEI and do not reflect emission changes considered in ongoing regulatory rulemakings such as the Lead NAAQS or Risk and Technology Review Assessment (RTR).

Acetaldehyde (cont.)
2002 Emissions: Major HAP Categorization
M obile sources57%
Res Boilers: Wood
6%
Pulp/Paper Prod4%
Ind/Comm/Inst Boilers
2%
Ag. Field Burning
1% Other8%
Forest / Wildf ires/
Prescr.Fires22%
2002 Emissions: Major Source Categorization
Fuel Combustion
9%
Industrial9%
M obile57%
Other25%
The “Other” Category shown in the Major Source Categorization pie chart includes open burning categories.
2002 Emissions Density Map
• The emissions density map shows that acetaldehyde is emitted in higher concentrations in areas with
greater population. The primary source of acetaldehyde emissions in 2002 is mobile sources, which can be correlated to population. The counties in Montana and Idaho with high emission densities are due to agricultural field burning.

Acrolein • HAP Category Name: Acrolein • CAS Number: 107-02-8 • Chemical Formula: C3H4O Molecular Weight: 56.06 • Toxicity: Potential NonCancer Effects • 231 Source Categories (2002) • Total Emissions: 27,003 tons
Emissions Trends (1990 to 2002)
0
5,000
10,000
15,000
20,000
25,000
30,000
1990 2002
Tons
/Yea
r
Open Burning - Forest, Wildf ires, and PrescribedFiresM obile sources
Structure Fires
Agricultural Field Burning
Resident ial Boilers: Wood/Wood ResidueCombust ionIndustrial/Commercial/ Inst itut ional Boilers &Process HeatersPlywood and Composite Wood Products
Synthetic Organic Chemical M anufacturing (HON)
Industrial Organic Chemical M anufacturing
Other Categories(220 source categories)
1990 2002 Pct Change
Open Burning - Forest, Wildfires, and Prescribed Fires 15,326 17,864 17%Mobile sources 10,125 5,387 -47%Structure Fires 1,410 1,201 -15%Agricultural Field Burning 691
Residential Boilers: Wood/Wood Residue Combustion 337Industrial/Commercial/ Institutional Boilers & Process Heaters 22 272 1121%Plywood and Composite Wood Products 339 176 -48%Synthetic Organic Chemical Manufacturing (HON) 527 9 -98%Industrial Organic Chemical Manufacturing 394 8 -98%Other Categories(220 source categories) 377 1,059 181%TOTAL 28,520 27,003 -5%
Emissions (Tons) 11/20/06
• Stationary source and mobile source regulations have reduced acrolein emissions. Significant stationary
source reductions have occurred due to the implementation of Maximum Achievable Control Technology (MACT) standards for the HON, Miscellaneous Organic Chemical Manufacturing, Pulp and Paper Production, and Plywood and Composite Wood Products Production sources.
• Acrolein is primarily emitted from combustion sources • Emission estimation methodologies are different in 1990 and 2002 for the categories of: Open Burning:
Forest and Wildfires and Prescribed Burns. • Categories such as Agricultural Field Burning, and Residential Wood Combustion are reported in 2002 NEI
but were not reported in the 1990 NEI. Other categories such as industrial/institutional/commercial boilers, stationary reciprocating internal combustion engines, and utility boilers are not characterized well in the 1990 NEI.
Source: 2002 NEI version 1. Emission estimates are subject to updates for subsequent revised versions of the 2002 NEI and do not reflect emission changes considered in ongoing regulatory rulemakings such as the Lead NAAQS or Risk and Technology Review Assessment (RTR).

Acrolein (cont.) 2002 Emissions:
Major HAP Categorization
M obile sources20%
Open/ Prescribed/ Wild Fires
66%
Other5%
Indust ./Comm./Inst. Boilers
1%
Ag. Field Burning
3%
Resident ial Boilers: Wood
1%
Structure Fires4%
2002 Emissions:Major Source Categorization
Fuel Comb. 3%
M obile20%
Other75%
Industrial2%
• The “Other” Category shown in the Major Source Categorization pie chart includes open burning
categories, which have the largest emissions in 2002.
2002 Emissions Density Map
• The emissions density map shows that acrolein is emitted in higher concentrations in areas with greater population due to mobile sources.

Acrylonitrile • HAP Category Name: Acrylonitrile • CAS Number: 107-13-1 • Chemical Formula: C3H3N Molecular Weight: 53.06 • Toxicity: Potential Cancer Risks and NonCancer Effects • 109 Source Categories (2002) • 2002 Total Emissions: 1,041 tons
Emissions Trends (1990 to 2002)
0
500
1,000
1,500
2,000
2,500
3,000
3,500
4,000
4,500
5,000
1990 2002
Tons
/Yea
r
M unicipal Landfills
Synthet ic Organic Chemical M anufacturing(HON)Plast ic M aterials and Resins M anufacturing
Landf ills
Polymers and Resins 4
Synthet ic Rubber M anufacturing
Publicly Owned Treatment Works
Acrylic/M odacrylic Fibers Product ion
Other Categories (90 other categories)
1990 2002 Pct ChangeMunicipal Landfills 6.16 436.43 6984.9%Synthetic Organic Chemical Manufacturing (HON) 2208.21 189.79 -91.4%Plastic Materials and Resins Manufacturing 1.27 125.03 9744.9%Landfills 108.38Polymers and Resins 4 46.43 46.62 0.4%Synthetic Rubber Manufacturing 41.05Publicly Owned Treatment Works 22.75 22.94 0.8%
Acrylic/Modacrylic Fibers Production 149.74 16.19 -89.2%Other Categories (90 other categories) 2008.25 54.965 -97.3%TOTAL 4,442.81 1,041.40 -76.6%
Emissions (Tons)
• Significant stationary source reductions have occurred due to the implementation of Maximum Achievable Control
Technology (MACT) standards for the HON, Miscellaneous Organic Chemical Manufacturing, Polymers and Resins and Acrylic/Modacrylic Fibers Production sources.
• Landfills, the largest source category in the 2002 NEI, are not well characterized in the 1990 NEI. Source: 2002 NEI version 1. Emission estimates are subject to updates for subsequent revised versions of the 2002 NEI and do not reflect emission changes considered in ongoing regulatory rulemakings such as the Lead NAAQS or Risk and Technology Review Assessment (RTR).

Acrylonitrile (cont.)
2002 Emissions: Major HAP Categorization
M unic. Landfills43%
Synth. Organic Chem M fg
18%
Plast ic/Resins M fg12%
Acrylic/ M odacrylic Fibers Prod.
2%
POTW2%
Synth Rubber M fg4%
Polymers/Resins 44%
Landfills10%
Other5%
2002 Emissions: Major Source Categorization
Industrial47%
Other52.8%
Fuel Combust ion
0.1%
• The “Other” Category shown in the Major Source Categorization pie chart includes landfills, which have the
significant emissions in 2002. 2002 Emissions Density Map
• The County Density map shows that acrylonitrile is emitted in 3044 counties of the 3141 counties in the 50 states. Landfills are
not present in all counties. • White areas identify counties with actual zero emissions.

Antimony Compounds • HAP Category Name: Antimony Compounds • Includes 8 compounds in the NEI • Toxicity: Potential NonCancer Effects • 164 Source Categories (2002) • 2002 Total Emissions: 142 tons
Emissions Trends (1990 to 2002)
0
20
40
60
80
100
120
140
160
180
200
1990 2002
Tons
/Yea
r
Primary Nonferrous M etals--Zinc, Cadmium andBerylliumIndustrial/Commercial/ Inst itut ional Boilers &Process HeatersUtility Boilers
Unsupported Plast ics Film and Sheet
M etal Coil (Surface Coating)
Industrial Inorganic Chemical M anufacturing
Radio and Television Broadcasting andCommunicat ions EquipmentHazardous Waste Incinerat ion
Pressed and Blown Glass and GlasswareM anufacturingPetroleum Ref ineries
Synthet ic Organic Chemical M anufacturing (HON)
Secondary Lead Smelt ing
Other Categories (158 other categories)
1990 2002 Pct ChangeIndustrial/Commercial/ Institutional Boilers & Process Heaters 0.5 19.7 3554%Utility Boilers 11.0 18.8 70%Unsupported Plastics Film and Sheet 18.0Metal Coil (Surface Coating) 2.0 10.6 444%Industrial Inorganic Chemical Manufacturing 4.0 8.7 119%Radio and Television Broadcasting and Communications Equipment 7.1Hazardous Waste Incineration 6.5
Pressed and Blown Glass and Glassware Manufacturing 7.5 6.4 -14%Petroleum Refineries 23.8 2.0 -92%Synthetic Organic Chemical Manufacturing (HON) 24.5 1.2 -95%Secondary Lead Smelting 13.2 0.5 -96%Primary Nonferrous Metals--Zinc, Cadmium and Beryllium 28.8 -100%Other Categories (158 other categories) 66.4 43.0 -35%TOTAL 181.7 142.4 -22%
Emissions (Tons) 11/20/06
• Stationary source reductions have occurred due to the implementation of Maximum Achievable Control Technology
(MACT) standards for the Secondary Lead Smelting, Iron and Steel Foundries, Primary Copper Smelting and Primary Lead Smelting sources.
• Antimony is emitted from a large number of source categories that contribute small amounts of emissions. Of 164 source categories, 20 categories emit more than 1 ton.
• Categories such as industrial/institutional/commercial boilers, hazardous waste incineration, and utility boilers burning oil are not well characterized in the 1990 NEI.
Source: 2002 NEI version 1. Emission estimates are subject to updates for subsequent revised versions of the 2002 NEI and do not reflect emission changes considered in ongoing regulatory rulemakings such as the Lead NAAQS or Risk and Technology Review Assessment (RTR).

Antimony Compounds (cont.)
2002 Emissions:Major Source Categorization
Fuel Comb.22%
Industrial71%
Other5%
M obile2%
2002 Emissions: Major HAP Categorization
Ind/Comm/Inst Boilers
14%
M etal Coating7%
Other30%
RadioTV Equip.
5%
Haz-Waste Incin.5%
Pressed/Blown Glass M fg
4%
Indust . Inorganic
Chem. M fg6%
Plastics Film and Sheet
13%
Utility Boilers13%
Secondary Nonferrous
M etals3%
• The “Other” Category shown in the Major Source Categorization pie chart includes incineration categories.
2002 Emissions Density Map
• The County Density map shows that antimony is emitted in 1938 counties of the 3141 counties in the 50 states. Antimony emissions are dominated by stationary point sources that are not located in all counties. Mobile source emissions are present for some nonroad categories.

Arsenic Compounds
• HAP Category Name: Arsenic Compounds • Includes 7 compounds in the NEI • Toxicity: Potential Cancer Risks and NonCancer Effects • 285 Source Categories (2002) • 2002 Total Emissions: 551 tons
Emissions Trends (1990 to 2002)
0
100
200
300
400
500
600
1990 2002
Tons
/Yea
r
Industrial/Commercial/ Inst itut ional Boilers & ProcessHeatersUt ility Boilers
M obile sources
Primary Copper Smelt ing
Hazardous Waste Incinerat ion
Pulp and Paper Production
Pressed and Blown Glass and GlasswareM anufacturingSecondary Lead Smelt ing
Petroleum Ref ineries
Primary Lead Smelt ing
Wood Preserving
Other Categories (279 categories)
1990 2002 Pct ChangeIndustrial/Commercial/ Institutional Boilers & Process Heaters 38.15 264.64 594%Utility Boilers 66.92 194.22 190%Mobile sources 12.71Primary Copper Smelting 43.32 9.01 -79%Hazardous Waste Incineration 5.76 3.39 -41%Pulp and Paper Production 14.15 2.57 -82%
Pressed and Blown Glass and Glassware Manufacturing 9.55 1.54 -84%Secondary Lead Smelting 5.63 0.6 -89%Petroleum Refineries 4.05 0.34 -92%Primary Lead Smelting 20.79 0.27 -99%Wood Preserving 3.47 0.25 -93%Other Categories (279 categories) 19.8 61.42 210%TOTAL 231.6 551.0 138%
Emissions (Tons) 11/20/06
• Stationary source reductions have occurred due to the implementation of Maximum Achievable Control Technology
(MACT) standards for the Secondary Lead Smelting, Iron and Steel Foundries, Primary Copper Smelting, Pulp and Paper Production, and Primary Lead Smelting sources.
• Arsenic is emitted from a large number of source categories that contribute small amounts of emissions. Of 285 source categories, 21categories emit more than 1 ton.
• Categories such as industrial/institutional/commercial boilers and utility boilers burning oil are significantly underestimated in the 1990 NEI. Mobile sources present in 2002 are from nonroad categories.
Source: 2002 NEI version 1. Emission estimates are subject to updates for subsequent revised versions of the 2002 NEI and do not reflect emission changes considered in ongoing regulatory rulemakings such as the Lead NAAQS or Risk and Technology Review Assessment (RTR).

Arsenic Compounds (cont.)
2002 Emissions: Major HAP Categorization
Utility Boilers35%
Indust ./Comm./Inst. Boilers
47%M obile sources
2%
Gold Ores2%
Refuse System2%
Primary Copper Smelt ing
2%
Other10%
2002 Emissions:Major Source Categorization
Fuel Comb.85%
Industrial12%
M obile2%
Other1%
• The “Other” Category shown in the Major Source Categorization pie chart includes open burning and
incineration categories. 2002 Emissions Density Map
• The emissions density map shows that arsenic compounds are emitted in higher concentrations in areas with greater population. Counties in Montana and Idaho with high emission densities are due to agricultural field burning.

Benzene • HAP Category Name: Benzene • CAS Number: 71-43-2 • Chemical Formula: C6H6 Molecular Weight: 78.11 • Toxicity: Potential Cancer Risks and NonCancer Effects • 540 Source Categories (2002) • 2002 Total Emissions: 376,154 tons
Emissions Trends (1990 to 2002)
0
100,000
200,000
300,000
400,000
500,000
600,000
1990 2002
Tons
/Yea
r
M obile sources
Pesticide Applicat ion
Open Burning - Forest , Wildf ires, and PrescribedFiresResidential Boilers: Wood/Wood ResidueCombust ionOpen Burning - Resident ial, Household Waste
Gasoline Distribut ion (Stage I)
Oil & Natural Gas Product ion
Petroleum Ref ineries
Synthet ic Organic Chemical M anufacturing (HON)
Other Categories (540 categories)
1990 2002 Pct ChangeMobile sources 384,228.0 210,034.5 -45%Pesticide Application 48,616.8
Open Burning - Forest, Wildfires, and Prescribed Fires 40,844.0 47,399.4 16%
Residential Boilers: Wood/Wood Residue Combustion 13,417.8 21,437.2 60%Open Burning - Residential, Household Waste 8,909.4 9,678.9 9%Gasoline Distribution (Stage I) 5,668.6 7,913.4 40%Oil & Natural Gas Production 12,224.4 5,918.9 -52%Petroleum Refineries 6,772.9 881.9 -87%Synthetic Organic Chemical Manufacturing (HON) 19,767.9 507.1 -97%Other Categories (540 categories) 21,318.7 23,766.2 11%TOTAL 513,151 376,154 -27%
Emissions (Tons) 11/20/06
• Mobile source regulations have significantly reduced benzene since 1990. • Significant stationary source reductions have occurred due to the implementation of Maximum Achievable
Control Technology (MACT) standards for the Oil & Natural Gas Production, Petroleum Refineries, and HON sources.
• Emission estimation methodologies are different in 1990 and 2002 for the categories of: Open Burning: Forest and Wildfires and Prescribed Burns. Some categories such as Pesticide Application are not present in 1990 NEI.
• Emission Inventory trends for benzene agree well with ambient monitoring data trends. NATA results are in good agreement with ambient monitoring data.
Source: 2002 NEI version 1. Emission estimates are subject to updates for subsequent revised versions of the 2002 NEI and do not reflect emission changes considered in ongoing regulatory rulemakings such as the Lead NAAQS or Risk and Technology Review Assessment (RTR).

Benzene (cont.)
• The “Other” Category shown in the Major Source Ccategories, pesticide application, incineration, pavi
2002 Emissions Density Map
ategorization pie chart includes open burning ng, and landfills.
• The emissions density map shows that benzene is emitted in higher concentrations in areas with greater population. The primary source of benzene emissions in 2002 is mobile sources, which can be correlated to population.
2002 Emissions:Major Source Categorization
Fuel Comb.6%
Industrial7%
M obile56%
Other31%
2002 Emissions:Major HAP Categorization
Pest icide App.12%
M obile sources55%
Res. Open Burning
3%
Res. Wood/Boilers
6%
Open/ Prescribed/ Wild Fires
13%
Oil & Natural Gas Prod.
2%Gasoline Dist . (Stage I)
2%
Product Usage2% Other
5%

Benzidine • HAP Category Name: Benzidine • CAS Number: 92-87-5 • Chemical Formula: C12H12N2 Molecular Weight: 184.24 • Toxicity: Potential Cancer Risks and NonCancer Effects • 11 Source Categories (2002) • 2002 Total Emissions: 0.104 tons
Emissions Trends (1990 to 2002)
0
0.1
0.2
0.3
0.4
0.5
0.6
0.7
1990 2002
Tons
/Yea
r
Rubber Tire Product ion
Hazardous Waste Incinerat ion
Pressed and Blown Glass and GlasswareM anufacturingIron and Steel Foundries
M unicipal Landfills
Synthetic Organic Chemical M anufacturing(HON)Other Categories (5 categories)
1990 2002 Pct ChangeOther Categories (5 categories) 0.003 0.002 -33%Synthetic Organic Chemical Manufacturing (HON) 0.2 0.003 -99%Municipal Landfills 0.004Iron and Steel Foundries 0.005
Pressed and Blown Glass and Glassware Manufacturing 0.02Hazardous Waste Incineration 0.03Rubber Tire Production 0.39 0.04 -90%TOTAL 0.593 0.104 -82%
Emissions (Tons) 11/20/06
• Benzidine is only emitted from stationary sources. • Significant stationary source reductions have occurred due to the implementation of Maximum Achievable
Control Technology (MACT) standards for the HON and Rubber Tire Production sources. • Some sources present in 2002 NEI are not present in the 1990 NEI. Source: 2002 NEI version 1. Emission estimates are subject to updates for subsequent revised versions of the 2002 NEI and do not reflect emission changes considered in ongoing regulatory rulemakings such as the Lead NAAQS or Risk and Technology Review Assessment (RTR).

Benzidine (cont.)
2002 Emissions:Major HAP Categorization
Glass M fg19%
Rubber Tire Prod.38%
HazWaste Inc.29%
Iron & Steel Foundries
5%
Synth. Organic Chem. M fg
3%M unicipal Landfills
4%
Other2%
2002 Emissions:Major Source Categorization
Industrial68%
Other32%
• The “Other” Category shown in the Major Source Categorization pie chart includes incinerators and
landfills. 2002 Emissions Density Map
• The County Density map shows that benzidine is emitted in 11 counties of the 3141 counties in the 50
states.

Beryllium Compounds • HAP Category Name: Beryllium Compounds • Includes 7 compounds in the NEI • Toxicity: Potential Cancer Risks and NonCancer Effects • 196 Source Categories (2002) • 2002 Total Emissions: 158 tons
Emissions Trends (1990 to 2002)
0
20
40
60
80
100
120
140
160
180
1990 2002
Tons
/Yea
r
Industrial/Commercial/ Inst itut ionalBoilers & Process HeatersUtility Boilers
Refuse Systems
Pulp and Paper Product ion
Other Categories (196 categories)
1990 2002 Pct ChangeIndustrial/Commercial/ Institutional Boilers & Process Heaters 1.38 124.39 8913.8%Utility Boilers 7.13 10.52 47.5%Refuse Systems 0 9.45Pulp and Paper Production 0.6 3.82 536.7%Other Categories (196 categories) 26.14 10.06 -61.5%TOTAL 35.25 158.24 348.9%
Emissions (Tons)
• Beryllium is emitted from a large number of source categories that contribute small amounts of emissions. Of
196 source categories, 12 categories emit more than 1 ton. • Categories such as industrial/institutional/commercial boilers are significantly underestimated in the 1990 NEI.
Uncertainty also exists with 2002 boiler estimates. Mobile sources present in 2002 are from nonroad categories. Source: 2002 NEI version 1. Emission estimates are subject to updates for subsequent revised versions of the 2002 NEI and do not reflect emission changes considered in ongoing regulatory rulemakings such as the Lead NAAQS or Risk and Technology Review Assessment (RTR).
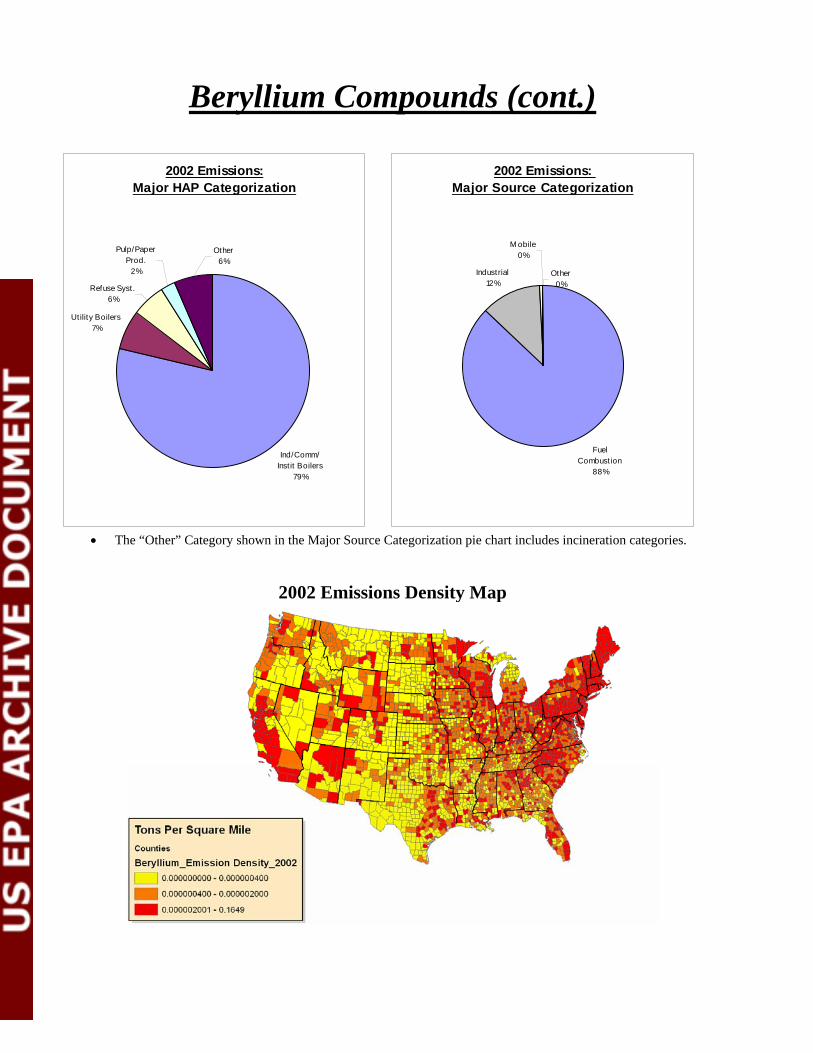
Beryllium Compounds (cont.)
2002 Emissions:Major HAP Categorization
Utility Boilers7%
Refuse Syst .6%
Pulp/Paper Prod.
2%
Ind/Comm/ Inst it Boilers
79%
Other6%
2002 Emissions: Major Source Categorization
Fuel Combust ion
88%
Industrial12%
M obile0%
Other0%
• The “Other” Category shown in the Major Source Categorization pie chart includes incineration categories.
2002 Emissions Density Map

Cadmium Compounds • HAP Category Name: Cadmium Compounds • Includes 11 compounds in the NEI • Toxicity: Potential Cancer Risks and NonCancer Effects • 301 Source Categories (2002) • 2002 Total Emissions: 207 tons
Emissions Trends (1990 to 2002)
0
50
100
150
200
250
300
350
400
450
500
1990 2002
Tons
/Yea
r
Industrial/Commercial/ Inst itut ional Boilers &Process Heaters
Ut ility Boilers
Hazardous Waste Incinerat ion
Secondary Nonferrous M etals
Primary Lead Smelt ing
Secondary Lead Smelt ing
Other Categories (303 categories)
1990 2002 Pct ChangeIndustrial/Commercial/ Institutional Boilers & Process Heaters 183.11 134.03 -27%Utility Boilers 6.37 23.04 262%Hazardous Waste Incineration 10.99 5.1 -54%Secondary Nonferrous Metals 13.43 4.97 -63%Primary Lead Smelting 15.72 0.68 -96%Secondary Lead Smelting 137.99 0.59 -100%Other Categories (303 categories) 95.64 38.73 -60%TOTAL 463.3 207.1 -55%
Emissions (Tons) 11/20/06
• Stationary source reductions have occurred due to the implementation of Maximum Achievable Control
Technology (MACT) standards for the Secondary Lead Smelting, Primary Lead Smelting, Primary Copper Smelting, Municipal Waste Combustion, Medical Waste Incineration, and Hazardous Waste incineration sources.
• Cadmium is emitted from a large number of source categories that contribute small amounts of emissions. Of 301 source categories, 13 categories emit more than 1 ton.
• Categories such as utility boilers are underestimated in the 1990 NEI. Other categories such as Electric Arc Furnaces are not in the 2001 version of the 1990 NEI.
• Mobile sources present in 2002 are from nonroad categories. Source: 2002 NEI version 1. Emission estimates are subject to updates for subsequent revised versions of the 2002 NEI and do not reflect emission changes considered in ongoing regulatory rulemakings such as the Lead NAAQS or Risk and Technology Review Assessment (RTR).

Cadmium Compounds (cont.)
2002 Emissions: Major Source Categorization
Fuel Comb.77%
Industrial 18%
Other3%
M obile Sources
2%
2002 Emissions: Major HAP Categorization
Utility Boilers11%
M obile sources2%
Res. Boilers1%
Other12%
Indust/Comm/ Inst Boilers
66%
Secondary Nonferrous
M etals2%
HazWaste Inc.2%
Refuse Systems
2%
Pulp & Paper Prod.
2%
• The “Other” Category shown in the Major Source Categorization pie chart includes open burning, landfills, and incineration categories.
2002 Emissions Density Map
• The emissions density map shows that cadmium compounds are emitted in higher concentrations in areas
with greater population. Counties in Montana and Idaho with high emission densities are due to agricultural field burning.

Carbon Tetrachloride • HAP Category Name: Carbon Tetrachloride • CAS Number: 56-23-5 • Chemical Formula: CCl4 Molecular Weight: 153.82 • Toxicity: Potential Cancer Risks and NonCancer Effects • 124 Source Categories (2002) • 2002 Total Emissions: 433 tons
Emissions Trends (1990 to 2002)
0
1,000
2,000
3,000
4,000
5,000
6,000
7,000
8,000
1990 2002
Tons
/Yea
r
Synthetic Organic Chemical M anufacturing (HON)
Pulp and Paper Production
Publicly Owned Treatment Works
Synthetic Rubber M anufacturing
Industrial Inorganic Chemical M anufacturing
Agricultural Chemicals and Pesticides M anufacturing
Hydrochloric Acid Product ion
M iscellaneous Organic Chemical M anufacturing
Other Categories (126 categories)
1990 2002 Pct ChangeSynthetic Organic Chemical Manufacturing (HON) 1962.92 153.49 -92%Pulp and Paper Production 4270.68 91.25 -98%Publicly Owned Treatment Works 63.95 72.75 14%Synthetic Rubber Manufacturing 32.05Industrial Inorganic Chemical Manufacturing 1.18 13.53 1047%Agricultural Chemicals and Pesticides Manufacturing 15.26 12.53 -18%Hydrochloric Acid Production 339.61 1.39 -100%Miscellaneous Organic Chemical Manufacturing 243.81 0.44 -100%Other Categories (126 categories) 259.45 55.92 -78%TOTAL 7,157 433 -94%
Emissions (Tons) 11/20/06
• Stationary source regulations have reduced carbon tetrachloride emissions by approximately 94 % since
1990. Carbon tetrachloride is not emitted from mobile sources. • Significant stationary source reductions have occurred due to the implementation of Maximum Achievable
Control Technology (MACT) standards for the Pulp and Paper Production, HON, Hydrochloric Acid Production, and Miscellaneous Organic Chemical Manufacturing sources.
Source: 2002 NEI version 1. Emission estimates are subject to updates for subsequent revised versions of the 2002 NEI and do not reflect emission changes considered in ongoing regulatory rulemakings such as the Lead NAAQS or Risk and Technology Review Assessment (RTR).

Carbon Tetrachloride (cont.)
2002 Emissions: Major HAP Categorization
Synth Organic Chem. M fg
34%
Pulp & Paper Prod.21%
Indust/Comm/ Inst . Boilers
2%
Other5%
Hydrogen Fluoride Prod.
2%
Synth Rubber M fg7%
Sanitary Services
2%
Indust . Inorganic
Chem. M fg3%
Ag Chem & Pesticides M fg
3%
Pub. Owned Treatment
Works17%
Rubber Tire Prod.
2%Chemical Prep.
2%
2002 Emissions:Major Source Categorization
Fuel Comb.2%
Industrial97%
Other1%
• The “Other” Category shown in the Major Source Categorization pie chart includes landfills and incineration.
2002 Emissions Density Map
• The County Density map shows that carbon tetrachloride is emitted in 3112 counties of the 3141 counties
in the 50 states. Landfills and POTWs are not present in all counties. Lowest range extends below 10-9 tons/sq. mi. White areas identify counties with actual zero emissions.

Chlorine • HAP Category Name: Chlorine • CAS Number: 7782-50-5 • Chemical Formula: Cl2 Molecular Weight: 70.91 • Toxicity: Potential NonCancer Effects • 216 Source Categories (2002) • 2002 Total Emissions: 12,530 tons
Emissions Trends (1990 to 2002)
0
10,000
20,000
30,000
40,000
50,000
60,000
70,000
80,000
90,000
100,000
1990 2002
Tons
/Yea
r
Primary M agnesium Ref ining
Agricultural Field Burning
Hazardous Waste Incinerat ion
Industrial/Commercial/ Inst itut ional Boilers & ProcessHeatersM obile sources
Open Burning
Synthet ic Organic Chemical M anufacturing (HON)
Hydrochloric Acid Production
Other Categories (260 categories)
1990 2002 Pct ChangePrimary Magnesium Refining 33,717.90 6,908.64 -80%Agricultural Field Burning 1,159.93Hazardous Waste Incineration 1,059.26 791.32 -25%Industrial/Commercial/ Institutional Boilers & Process Heaters 61.52 421.27 585%Mobile sources 416.03Open Burning 0.01 399.57 3995600%Synthetic Organic Chemical Manufacturing (HON) 8,074.51 186.04 -98%Hydrochloric Acid Production 44,935.24 13.03 -100%Other Categories (260 categories) 6,822.87 2,233.98 -67%TOTAL 94,671 12,530 -87%
Emissions (Tons) 11/20/06
• Significant stationary source reductions have occurred due to the implementation of Maximum Achievable
Control Technology (MACT) standards for the Hydrochloric Acid Production, Primary Magnesium Refining, HON, and Pulp and Paper Production sources.
• Categories such as Agricultural Field Burning and Open Burning of Yard Waste are reported in 2002 NEI but were not reported in the 1990 NEI.
• Categories such as POTWs, Portland Cement Manufacturing, Utility Boilers, Industrial/Institutional/Commercial Boilers, and Residential Wood Combustion are not well characterized in the 1990 NEI.
Source: 2002 NEI version 1. Emission estimates are subject to updates for subsequent revised versions of the 2002 NEI and do not reflect emission changes considered in ongoing regulatory rulemakings such as the Lead NAAQS or Risk and Technology Review Assessment (RTR).

Chlorine (cont.)
2002 Emissions:Major Source Categorization
Fuel Comb.6%
Industrial72%
M obile3%
Other19%
2002 Emissions:Major HAP Categorization
Primary M g Ref ining
56%
Ag. Field Burning
9%
Other15%
HazWaste Inc.6%
Indust/Comm/ Inst . Boilers
3%
M obile sources3%
Open Burning3%
Res.Boilers: Wood
3%
Pub.Owned Treatment
Works2%
2002 Emissions Density Map
• The County Density map shows that chlorine is emitted in 1057 counties of the 3141 counties in the 50
states. The largest source in the US is a Primary Magnesium Refining located in Utah. Approximately 50% of total 2002 chlorine emissions are associated with this facility. This facility has been evaluated since the 1996 NEI and the emission trends are consistent with from year to year. The emissions have been verified by the state of UT.

Chloroform • HAP Category Name: Chloroform • CAS Number: 67-66-3 • Chemical Formula: CHCl3 Molecular Weight: 119.38 • Toxicity: Potential NonCancer Effects • 217 Source Categories (2002) • 2002 Total Emissions: 16,513 tons
Emissions Trends (1990 to 2002)
0
5,000
10,000
15,000
20,000
25,000
30,000
35,000
1990 2002
Tons
/Yea
r
Swimming Pools
Pulp and Paper Product ion
Publicly Owned Treatment Works
Synthet ic Organic Chemical M anufacturing(HON)Pharmaceut ical Production
Hydrochloric Acid Production
Other Categories (184 categories)
1990 2002 Pct ChangeSwimming Pools 3,031.5 14,924.2 392.3%Pulp and Paper Production 21,222.2 639.6 -97.0%Publicly Owned Treatment Works 353.3 447.9 26.8%Synthetic Organic Chemical Manufactu 1,619.1 60.2 -96.3%Pharmaceutical Production 407.2 14.3 -96.5%Hydrochloric Acid Production 634.3 0.1 -100.0%Other Categories (184 categories) 1,392.8 426.3 -69.4%TOTAL 28,660.4 16,512.6 -42.4%
Emissions (Tons)
• Chloroform is emitted from stationary sources. Significant stationary source reductions have occurred due
to the implementation of Maximum Achievable Control Technology (MACT) standards for the Pulp and Paper Production, HON, Hydrochloric Acid Production, Pharmaceutical Production, and Miscellaneous Organic Chemical Manufacturing sources.
• Categories such as Swimming Pools and POTWs are not well characterized in the 1990 NEI. Source: 2002 NEI version 1. Emission estimates are subject to updates for subsequent revised versions of the 2002 NEI and do not reflect emission changes considered in ongoing regulatory rulemakings such as the Lead NAAQS or Risk and Technology Review Assessment (RTR).

Chloroform (cont.) •
2002 Emissions: Major HAP Categorization
Swimming Pools90%
Pulp/Paper Prod.
4%
POTW3%
Other3%
2002 Emissions: Major Source Categorizations
Industrial9%
Other91%
Fuel Combustion
0%
2002 Emissions Density Map
• The County Density map shows that chloroform is emitted in 3124 counties of the 3141 counties in the 50 states.
• White areas identify counties with actual zero emissions.

Chromium Compounds • HAP Category Name: Chromium Compounds • Includes 35 compounds in the NEI • Toxicity: Potential Cancer Risks and NonCancer Effects for Hexavalent
Chromium • 414 Source Categories (2002) • 2002 Total Emissions: 787 tons
Emissions Trends (1990 to 2002)
0
100
200
300
400
500
600
700
800
900
1,000
1990 2002
Tons
/Yea
r
Industrial/Commercial/ Inst itut ional Boilers &Process HeatersUtility Boilers
M obile sources
Iron and Steel Foundries
Ferroalloys Product ion
Integrated Iron & Steel M anufacturing
Chromium Electroplat ing
Iron and Steel Forging
Petroleum Refineries
Chromic Acid Anodizing
Other Categories (426 categories)
1990 2002 Pct ChangeIndustrial/Commercial/ Institutional Boilers & Process Heaters 24.67 242.65 884%Utility Boilers 87.42 125.78 44%Mobile sources 11.88 31.75 167%Iron and Steel Foundries 53.92 31.53 -42%Ferroalloys Production 38.74 7.56 -80%Integrated Iron & Steel Manufacturing 45.24 4.87 -89%Chromium Electroplating 147.19 4.56 -97%Iron and Steel Forging 40.05 1 -98%Petroleum Refineries 47.29 0.92 -98%Chromic Acid Anodizing 36.55 0.01 -100%Other Categories (426 categories) 382.06 336.71 -12%TOTAL 915 787 -14%
Emissions (Tons) 11/20/06
• Stationary source reductions have occurred due to the implementation of Maximum Achievable Control
Technology (MACT) standards for the Chromium Electroplating, Iron and Steel Foundries, Integrated Iron & Steel Manufacturing, Petroleum Refineries, and Ferroalloys Production sources.
• Categories such as industrial/institutional/commercial boilers and utility boilers burning oil are underestimated in the 1990 NEI.
• Emission data are shown for Chromium Compounds, not Hexavalent Chromium. Source: 2002 NEI version 1. Emission estimates are subject to updates for subsequent revised versions of the 2002 NEI and do not reflect emission changes considered in ongoing regulatory rulemakings such as the Lead NAAQS or Risk and Technology Review Assessment (RTR).

Chromium Compounds (cont.)
2002 Emissions:Major HAP Categorization
Ind/Comm/Inst Boilers
31%
Primary M etal Products M fg
3%
Aerospace Ind.3%
Port land Cement M fg
4%
M obile sources4%
Surface Coat ing
2%
Other29%
Utility Boilers16%
Stainless/ Nonstainless
Steel M fg4%
Iron & Steel Foundries
4%
2002 Emissions:Major Source Categorization
Fuel Comb.46%
Industrial49%
M obile4%
Other1%
• The “Other” Category shown in the Major Source Categorization pie chart includes incineration categories.
2002 Emissions Density Map

Coke Oven Emissions • HAP Category Name: Coke Oven Emissions • CAS Number: 8007-45-2 • Comprised of: Benzene Soluble Organics (BSO) and Methylene Chloride
Soluble Organics (MCSO) • Toxicity: Potential Cancer Risks • 2 Source Categories (2002) • 2002 Total Emissions: 775 tons
Emissions Trends (1990 to 2002)
0
200
400
600
800
1,000
1,200
1,400
1990 2002
Tons
/Yea
r
Coke Ovens
1990 2002 Pct ChangeCoke Ovens 1281.68 775.12 -40%TOTAL 1,282 775 -40%
Emissions (Tons) 11/20/06
• Coke Oven Emissions data are of high quality. 2002 NEI data are based on data from the Coke oven
Residual Risk Standard development. Coke ovens estimates include 2 categories: Pushing, Quenching, & Battery Stacks; and Charging, Top Side, and Door Leaks.
• Significant reductions have occurred due to implementation of Maximum Achievable Control Technology (MACT) standards. Further reductions are expected from implementation of Residual Risk standards.
Source: 2002 NEI version 1. Emission estimates are subject to updates for subsequent revised versions of the 2002 NEI and do not reflect emission changes considered in ongoing regulatory rulemakings such as the Lead NAAQS or Risk and Technology Review Assessment (RTR).

Coke Oven Emissions (cont.) 2002 Emissions:
Major HAP Categorization
Pushing, Quenching, &
Battery Stacks92%
Charging, Top Side, and Door
Leaks8%
2002 Emissions:Major Source Categorization
Industrial100%
2002 Emissions Density Map
• The County Density map shows that coke oven emissions are emitted in 19 counties of the 3141 counties in the 50 states.

Ethylene dibromide • HAP Category Name: Ethylene dibromide • CAS Number: 106-93-4 Chemical Synonym: Dibromoethane • Chemical Formula: C2H4Br2 Molecular Weight: 187.86 • Toxicity: Potential Cancer Risks and NonCancer Effects • 97 Source Categories (2002) • 2002 Total Emissions: 24 tons
Emissions Trends (1990 to 2002)
0
10
20
30
40
50
60
1990 2002
Tons
/Yea
r
Utility Boilers: Coal
Petroleum Ref ineries
Industrial/Commercial/ Inst itut ional Boilers &Process HeatersIndustrial Organic Chemical M anufacturing
Industrial Inorganic Chemical M anufacturing
Rubber Tire Production
Other Categories ( 64 categories)
Emissions (Tons)
1990 2002 Pct ChangeOther Categories ( 64 categories) 34.31 2.94 -91.4%Polymers and Resins 1 2 3.65Off-Site Waste and Recovery Operation 3.42Motor Vehicle Parts and Accessories 4.97Miscellaneous Organic Chemical Manuf 8.41Hydrochloric Acid Production 10.16Rubber Tire Production 6.85 0.004 -99.9%Industrial Inorganic Chemical Manufactu 3.45 0.02 -99.4%Industrial Organic Chemical Manufactur 2.31 0.33 -85.7%Industrial/Commercial/ Institutional Boile 0.01 1.92 19100.0%Petroleum Refineries 1.39 3.5 151.8%Utility Boilers: Coal 14.87TOTAL 48.32 23.584 -51.2%
• Ethylene Dibromide is only emitted from stationary sources. Source categories are not consistent in the
1990 NEI and the 2002 NEI. The largest categories in the 2002 NEI are not present in the 1990 NEI. • Ethylene Dibromide is on the list of HAPs under the Section 112c3/112k Urban Area Source Program (FR
1999), but is not on the list of 1999 NATA risk drivers. Source: 2002 NEI version 1. Emission estimates are subject to updates for subsequent revised versions of the 2002 NEI and do not reflect emission changes considered in ongoing regulatory rulemakings such as the Lead NAAQS or Risk and Technology Review Assessment (RTR).

Ethylene dibromide (cont.)
2002 Emissions: Major HAP Categorization
Utility Boilers: Coal64%
Ind. Org. Chem M fg1%
NG Xmission/ Storage
1%
M unic. Landf ills1%
Other3%
HF Prod.4%
Synth. Org. Chem. M fg
3%
Ind/Comm/Inst . Boilers
8%
Petro Ref.15%
2002 Emissions: Major Source Categorizaton
Fuel Combustion
71%
Industrial28%
Other1%
• The “Other” Category shown in the Major Source Categorization pie chart includes incinerators and
landfills. 2002 Emissions Density Map
• The County Density map shows that ethylene dibromide is emitted in 2393 counties of the 3141 counties in
the 50 states.

Ethylene dichloride • HAP Category Name: Ethylene dichloride • CAS Number: 107-06-2 • Chemical Synonym: 1,2-Dichloroethane • Chemical Formula: C2H4Cl2 Molecular Weight: 98.96 • Toxicity: Potential Cancer Risks and NonCancer Effects • 189 Source Categories (2002) • 2002 Total Emissions: 456 tons
Emissions Trends (1990 to 2002)
0.0
2,000.0
4,000.0
6,000.0
8,000.0
10,000.0
12,000.0
1990 2002
Tons
/Yea
r
Hydrochloric Acid Production
Synthetic Organic ChemicalM anufacturing (HON)M unicipal Landfills
Commercial Cooking - Charbroiling
Industrial Inorganic ChemicalM anufacturingM iscellaneous Organic ChemicalM anufacturingIndustrial/Commercial/ InstitutionalBo ilers & Process HeatersPulp and Paper Production
Industrial M achinery and Equipment: Finishing OperationsOther Categories ( 150 categories)
1990 2002 Pct ChangeSynthetic Organic Chemical Manufacturing (HON) 5,985.3 148.6 -97.5%Municipal Landfills 1.6 53.1 3239.6%Commercial Cooking - Charbroiling 38.7Industrial Inorganic Chemical Manufacturing 680.8 22.9 -96.6%Miscellaneous Organic Chemical Manufacturing 217.1 22.5 -89.6%Industrial/Commercial/ Institutional Boilers & Process Heaters 0.8 22.2 2611.0%Pulp and Paper Production 458.1 18.0 -96.1%Industrial Machinery and Equipment: Finishing Operations 553.3 0.0 -100.0%Hydrochloric Acid Production 1,633.7Other Categories ( 150 categories) 663.8 130.1 -80.4%TOTAL: 10,194.4 456.1 -95.5%
Emissions (Tons)
• Ethylene Dichloride is only emitted from stationary sources. Stationary source reductions have occurred
due to the implementation of Maximum Achievable Control Technology (MACT) standards for the HON, Hydrochloric Acid Production, Pharmaceutical Production and Miscellaneous Organic Chemical Manufacturing.
• Categories such as Charbroiling, Utility Boilers and Industrial/Institutional/Commercial boilers are reported in 2002 NEI but were not reported in the 1990 NEI. Other categories such as Landfills are not well characterized in the 1990 NEI.
Source: 2002 NEI version 1. Emission estimates are subject to updates for subsequent revised versions of the 2002 NEI and do not reflect emission changes considered in ongoing regulatory rulemakings such as the Lead NAAQS or Risk and Technology Review Assessment (RTR).

Ethylene dichloride (cont.)
2002 Emissions: Major HAP Categorization
Synth.Organic Chem. M fg
33%
M unic. Landfills12%
Comm. Cooking -
Charbroiling8%
Utility Boilers4%
Indust . Inorganic
Chem. M fg5%
M isc. Organic Chem. M fg
5%
Ind/Comm/Inst. Boilers
5%
Pulp/Paper Prod.
4%
Chem. Prep.3%
M arine Vessel Loading Ops
3%
Other18%
2002 Emissions: Major Source Categorization
Fuel Combust ion
9%
Industrial68%
Other23%
• The “Other” Category shown in the Major Source Categorization pie chart includes landfills, charbroiling
and incineration categories. 2002 Emissions Density Map
• Lowest range extends below 10-9 tons/sq. mi. White areas identify counties with actual zero emissions.
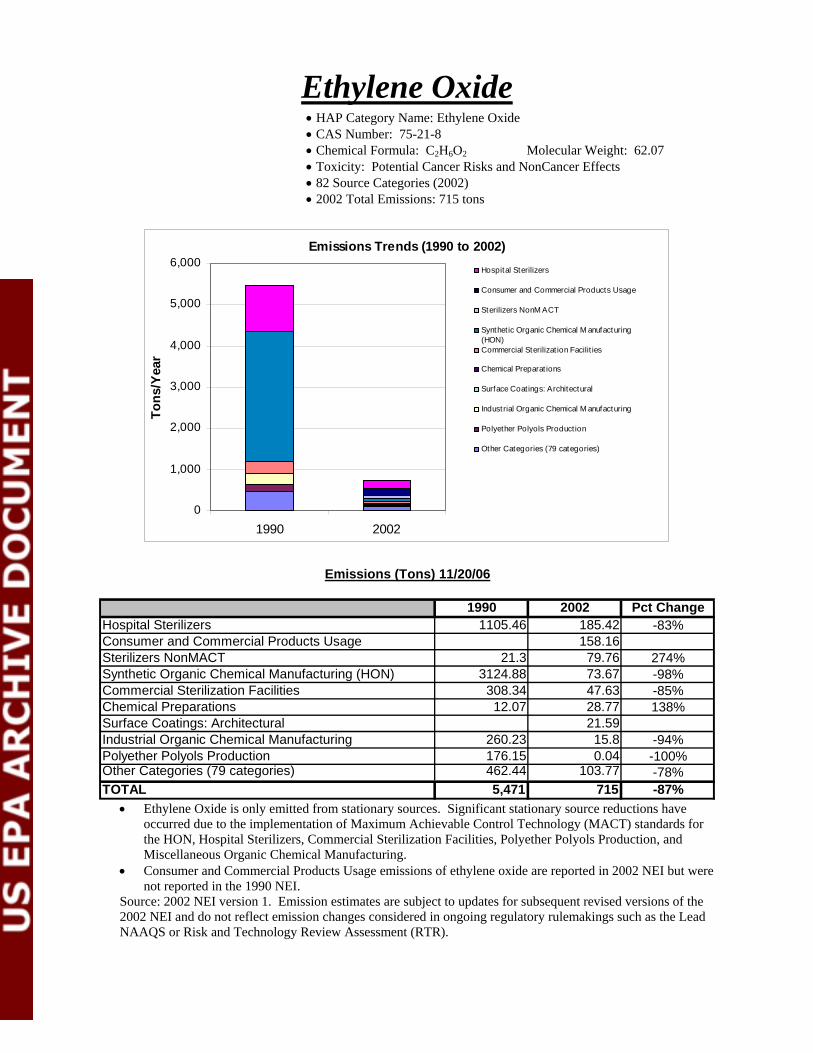
Ethylene Oxide • HAP Category Name: Ethylene Oxide • CAS Number: 75-21-8 • Chemical Formula: C2H6O2 Molecular Weight: 62.07 • Toxicity: Potential Cancer Risks and NonCancer Effects • 82 Source Categories (2002) • 2002 Total Emissions: 715 tons
Emissions Trends (1990 to 2002)
0
1,000
2,000
3,000
4,000
5,000
6,000
1990 2002
Tons
/Yea
r
Hospital Sterilizers
Consumer and Commercial Products Usage
Sterilizers NonM ACT
Synthetic Organic Chemical M anufacturing(HON)Commercial Sterilizat ion Facilit ies
Chemical Preparat ions
Surface Coatings: Architectural
Industrial Organic Chemical M anufacturing
Polyether Polyols Production
Other Categories (79 categories)
1990 2002 Pct ChangeHospital Sterilizers 1105.46 185.42 -83%Consumer and Commercial Products Usage 158.16Sterilizers NonMACT 21.3 79.76 274%Synthetic Organic Chemical Manufacturing (HON) 3124.88 73.67 -98%Commercial Sterilization Facilities 308.34 47.63 -85%Chemical Preparations 12.07 28.77 138%Surface Coatings: Architectural 21.59Industrial Organic Chemical Manufacturing 260.23 15.8 -94%Polyether Polyols Production 176.15 0.04 -100%Other Categories (79 categories) 462.44 103.77 -78%TOTAL 5,471 715 -87%
Emissions (Tons) 11/20/06
• Ethylene Oxide is only emitted from stationary sources. Significant stationary source reductions have
occurred due to the implementation of Maximum Achievable Control Technology (MACT) standards for the HON, Hospital Sterilizers, Commercial Sterilization Facilities, Polyether Polyols Production, and Miscellaneous Organic Chemical Manufacturing.
• Consumer and Commercial Products Usage emissions of ethylene oxide are reported in 2002 NEI but were not reported in the 1990 NEI.
Source: 2002 NEI version 1. Emission estimates are subject to updates for subsequent revised versions of the 2002 NEI and do not reflect emission changes considered in ongoing regulatory rulemakings such as the Lead NAAQS or Risk and Technology Review Assessment (RTR).

Ethylene Oxide (cont.)
2002 Emissions:Major Source Categorization
Fuel Comb.0%
Industrial78%
Other22%
2002 Emissions:Major HAP Categorization
Consumer and Commerc. Prod
22%Sterilizers
11%
Other Categories
12%
Pharm. Prod.2%
Ind. Organic Chem. M fg
2%
Hospital Sterilizers
27%
Synth Organic Chem. M fg
10%
Commerc. Sterilizat ion
Facil.7%
Chemical Prep.4%
Surface Coatings: Arch.
3%
• The “Other” Category shown in the Major Source Categorization pie chart includes Consumer and Commercial Products Usage categories.
2002 Emissions Density Map
• The County Density map shows that ethylene oxide is emitted in 2987 counties of the 3141 counties in the
50 states. • Lowest range extends below 10-9 tons/sq. mi. White areas identify counties with actual zero emissions.

Formaldehyde • HAP Category Name: Formaldehyde • CAS Number: 50-00-0 • Chemical Formula: CH2O Molecular Weight: 30.03 • Toxicity: Potential Cancer Risks and NonCancer Effects • 452 Source Categories (2002) • 2002 Total Emissions: 258,009 tons
Emissions Trends (1990 to 2002)
0
50,000
100,000
150,000
200,000
250,000
300,000
350,000
400,000
1990 2002
Tons
/Yea
r
M obile sources
Open Burning - Forest, Wildf ires, andPrescribed FiresIndustrial/Commercial/ Inst itut ional Boilers &Process HeatersResident ial Boilers: Wood/Wood ResidueCombust ionStat ionary Reciprocat ing Internal Combust ionEnginesPlywood and Composite Wood Products
Pulp and Paper Product ion
Synthet ic Organic Chemical M anufacturing(HON)Other Categories (447 Other Categories)
1990 2002 Pct ChangeMobile sources 209,311.3 111,934.8 -47%
Open Burning - Forest, Wildfires, and Prescribed Fires 93,254.4 108,492.0 16%Industrial/Commercial/ Institutional Boilers & Process Heaters 687.3 12,194.2 1674%
Residential Boilers: Wood/Wood Residue Combustion 0.2 3,661.1 1525354%
Stationary Reciprocating Internal Combustion Engines 25,240.9 3,326.5 -87%Plywood and Composite Wood Products 3,773.5 2,190.3 -42%Pulp and Paper Production 4,340.9 789.4 -82%Synthetic Organic Chemical Manufacturing (HON) 12,554.2 217.1 -98%Other Categories (447 Other Categories) 10,333.0 15,203.5 47%TOTAL 359,495.7 258,008.9 -28%
Emissions (Tons) 11/20/06
• Stationary source and mobile source regulations have reduced formaldehyde emissions by approximately 28 % since
1990. Significant stationary source reductions have occurred due to the implementation of Maximum Achievable Control Technology (MACT) standards for Stationary Reciprocating Internal Combustion Engines, HON, Pulp & Paper Production, Plywood and Composite Wood Products, Wool Fiberglass Manufacturing, Miscellaneous Organic Chemical Manufacturing, and Petroleum Refineries sources. Many other MACT categories have also reduced emissions of formaldehyde.
• Emission estimation methodologies are different in 1990 and 2002 for the categories of: Open Burning: Forest and Wildfires and Prescribed Burns.
• Categories such as Agricultural Field Burning, Residential Wood Combustion, Burning of Logging Debris and Charbroiling are reported in 2002 NEI but were not reported in the 1990 NEI. Other categories such as utility and industrial/institutional/commercial boilers are underestimated in the 1990 NEI.
Source: 2002 NEI version 1. Emission estimates are subject to updates for subsequent revised versions of the 2002 NEI and do not reflect emission changes considered in ongoing regulatory rulemakings such as the Lead NAAQS or Risk and Technology Review Assessment (RTR).

Formaldehyde (cont.)
2002 Emissions:Major HAP Categorization
M obile sources44%
Open/Presc/ Wild Fires
42%
Ind./Comm/Inst Boilers
5%
Res. Boilers: Wood
1%
Other7%
Stat ionary RICE
1%
2002 Emissions:Major Source Categories
Fuel Comb.8%
Industrial4%
M obile43%
Other45%
2002 Emissions Density Map
• The emissions density map shows that formaldehyde is emitted in higher concentrations in areas with
greater population. The primary source of formaldehyde emissions in 2002 is mobile sources, which can be correlated to population. The counties in Montana and Idaho with high emission densities are due to agricultural field burning.

Hexachlorobenzene • HAP Category Name: Hexachlorobenzene • CAS Number: 118-74-1 • Chemical Formula: C6Cl6 Molecular Weight: 284.78 • Toxicity: Potential Cancer Risks and NonCancer Effects • 39 Source Categories • 2002 Total Emissions: 1.05 tons
Emissions Trends (1990 to2002)
0
1
2
3
4
5
6
1990 2002
Tons
/Yea
r
Pest icide Applicat ion
Open Burning - Resident ial, Household Waste
Rubber Tire Product ion
Refuse Systems
Synthetic Organic Chemical M anufacturing(HON)Agricultural Chemicals and Pest icidesM anufacturingHydrochloric Acid Product ion
Industrial Organic Chemical M anufacturing
Other Categories ( 25 Other Categories)
1990 2002 Pct ChangePesticide Application 0.2 0.30 50.0%Open Burning - Residential, Household Waste 0.16 0.17 6.3%Rubber Tire Production 0.16Refuse Systems 0.14Synthetic Organic Chemical Manufacturing (HON) 2.66 0.07 -97.4%Agricultural Chemicals and Pesticides Manufacturing 0.37 0.05 -86.5%Hydrochloric Acid Production 0.73Industrial Organic Chemical Manufacturing 0.52Other Categories ( 25 Other Categories) 0.13 0.16 23.1%TOTAL 4.77 1.05 -78.0%
Emissions (Tons)
• Hexachlorobenzene is only emitted from stationary sources. Significant stationary source reductions have
occurred due to the implementation of Maximum Achievable Control Technology (MACT) standards for the HON, Hydrochloric Acid Production, and Agricultural Chemicals and Pesticides Manufacturing.
• Utility and industrial/institutional/commercial boilers, pesticide application, and landfills emissions are reported in 2002 NEI but were not reported in the 1990 NEI.

Hexachlorobenzene (cont.)
2002 Emissions: Major Source Categorization
Fuel Combust ion
4%
Industrial50%
Other46%
2002 Emissions: Major HAP Categorization
Pest icide App.28%
Open Burning16%
Rubber Tire Prod.15%
Other6%
Chem. Preps2%
Ag. Chem/ Pesticides M fg
5%
Synth. Org. Chem. M fg
7%
Ind/Comm/Inst . Boilers
8%
Refuse Systems
13%
• The “Other” Category shown in the Major Source Categorization pie chart includes pesticide application
and incineration categories. 2002 Emissions Density Map
• The County Density map shows that hexachlorobenzene is emitted in 2649 counties of the 3141 counties in
the 50 states.

Hexamethylene 1,6-diisocyanate • HAP Category Name: Hexamethylene Diisocyanate • CAS Number: 822-06-0 • Chemical Formula: C8H12N2O2 Molecular Weight: 168.2 • Toxicity: Potential NonCancer Effects • 80 Source Categories (2002) • 2002 Total Emissions: 40 tons
Emissions Trends (1990 to 2002)
0
50
100
150
200
250
300
350
1990 2002
Tons
/Yea
r
Plast ics Products, NEC
Synthetic Organic Chemical M anufacturing(HON)M iscellaneous M etal Parts & Products(Surface Coat ing)Transportat ion Equipment M anufacturing
Engine Test Facilit ies
M iscellaneous Coat ing M anufacturing
Autobody Ref inishing Paint Shops
Industrial M achinery and Equipment: FinishingOperationsIndustrial and Commercial M achinery andEquipment M anufacturingOther Categories ( 54 source categories)
1990 2002 Pct ChangePlastics Products, NEC 15.14Synthetic Organic Chemical Manufacturing (HON) 300.42 4.77 -98%
Miscellaneous Metal Parts & Products (Surface Coating) 4.69Transportation Equipment Manufacturing 3.11Engine Test Facilities 3.06Miscellaneous Coating Manufacturing 2.49Autobody Refinishing Paint Shops 0.14 1.65 1079%Industrial Machinery and Equipment: Finishing Operations 1.09Industrial and Commercial Machinery and Equipment Manufacturing 1.08Other Categories ( 54 source categories) 0.1 2.51 2410%TOTAL 301 40 -87%
Emissions (Tons) 11/20/06
• Hexamethylene Diisocyanate is only emitted from stationary sources. Significant stationary source
reductions have occurred due to the implementation of Maximum Achievable Control Technology (MACT) standards for the HON.
• A number of solvent and surface coating categories are reported in 2002 NEI but were not reported in the 1990 NEI.
Source: 2002 NEI version 1. Emission estimates are subject to updates for subsequent revised versions of the 2002 NEI and do not reflect emission changes considered in ongoing regulatory rulemakings such as the Lead NAAQS or Risk and Technology Review Assessment (RTR).

Hexamethylene 1,6-diisocyanate (cont.)
2002 Emissions:Major HAP Categorization
Synth Organic Chem M fg
12%
Plast ics Prod.38%
Ind M ach/Eq: Finishing
3%
Ind/Comm M ach. & Eq.
M fg3%
Other6%
M isc M etal Parts & Prod:
Coatings12%
Transp. Eq. M fg8%
Engine Test Facil.8%
M isc Coating M fg6%
Autobody Refinish
4%
2002 Emissions:Major Source Categorization
Fuel Comb.8%
Industrial92%
2002 Emissions Density Map
• The County Density map shows that hexamethylene diisocyanate is emitted in 198 counties of the 3141 counties in the 50 states.
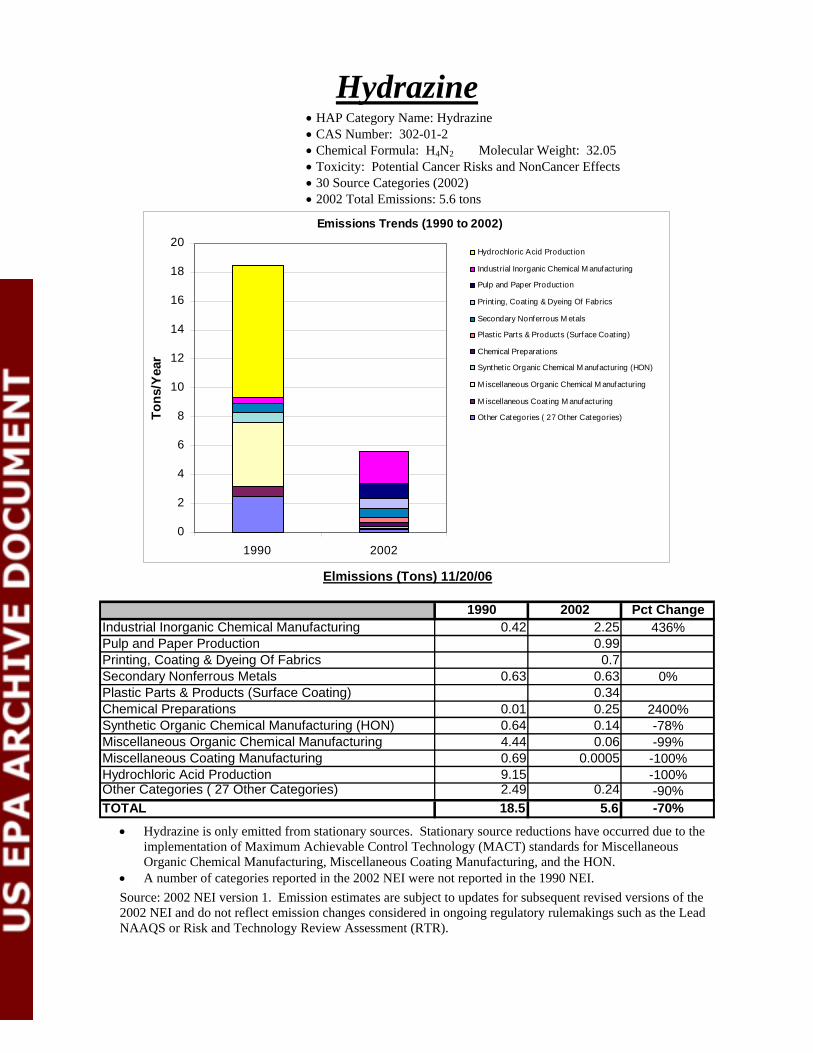
Hydrazine • HAP Category Name: Hydrazine • CAS Number: 302-01-2 • Chemical Formula: H4N2 Molecular Weight: 32.05 • Toxicity: Potential Cancer Risks and NonCancer Effects • 30 Source Categories (2002) • 2002 Total Emissions: 5.6 tons
Emissions Trends (1990 to 2002)
0
2
4
6
8
10
12
14
16
18
20
1990 2002
Tons
/Yea
r
Hydrochloric Acid Production
Industrial Inorganic Chemical M anufacturing
Pulp and Paper Product ion
Print ing, Coating & Dyeing Of Fabrics
Secondary Nonferrous M etals
Plast ic Parts & Products (Surface Coating)
Chemical Preparat ions
Synthet ic Organic Chemical M anufacturing (HON)
M iscellaneous Organic Chemical M anufacturing
M iscellaneous Coat ing M anufacturing
Other Categories ( 27 Other Categories)
1990 2002 Pct ChangeIndustrial Inorganic Chemical Manufacturing 0.42 2.25 436%Pulp and Paper Production 0.99Printing, Coating & Dyeing Of Fabrics 0.7Secondary Nonferrous Metals 0.63 0.63 0%Plastic Parts & Products (Surface Coating) 0.34Chemical Preparations 0.01 0.25 2400%Synthetic Organic Chemical Manufacturing (HON) 0.64 0.14 -78%Miscellaneous Organic Chemical Manufacturing 4.44 0.06 -99%Miscellaneous Coating Manufacturing 0.69 0.0005 -100%Hydrochloric Acid Production 9.15 -100%Other Categories ( 27 Other Categories) 2.49 0.24 -90%TOTAL 18.5 5.6 -70%
Elmissions (Tons) 11/20/06
• Hydrazine is only emitted from stationary sources. Stationary source reductions have occurred due to the
implementation of Maximum Achievable Control Technology (MACT) standards for Miscellaneous Organic Chemical Manufacturing, Miscellaneous Coating Manufacturing, and the HON.
• A number of categories reported in the 2002 NEI were not reported in the 1990 NEI. Source: 2002 NEI version 1. Emission estimates are subject to updates for subsequent revised versions of the 2002 NEI and do not reflect emission changes considered in ongoing regulatory rulemakings such as the Lead NAAQS or Risk and Technology Review Assessment (RTR).

Hydrazine (cont.)
2002 Emissions:Major HAP Categorization
Ind. Inorganic Chem. M fg
40%
Fabrics Print ing,
Coat ing & Dyeing
13%
Secondary Nonferrous
M etals11%
Plastic Parts & Prod. Coating
6%
Other5%Chem. Prep
4%
Synth Organic Chem. M fg
3%
Pulp/Paper Prod.18%
2002 Emissions:Major Source Categorization
Industrial99%
Fuel Comb.1%
2002 Emissions Density Map
• The County Density map shows that hydrazine is emitted in 52 counties of the 3141 counties in the 50 states.

Hydrochloric Acid • HAP Category Name: Hydrochloric Acid • CAS Number: 7647-01-0 • Chemical Synonym: Hydrogen Chloride [Gas Only] • Chemical Formula HCl Molecular Weight: 36.46 • Toxicity: Potential NonCancer Effects • 316 Source Categories (2002) • 2002 Total Emissions: 562,349 tons
Emissions Trends (1990 to 2002)
0
100,000
200,000
300,000
400,000
500,000
600,000
1990 2002
Tons
/Yea
r
Utility Boilers
Industrial/Commercial/ Inst itut ional Boilers & ProcessHeatersM uncipal Waste Combustors
Pulp and Paper Product ion
Port land Cement M anufacturing
Hazardous Waste Incinerat ion
Secondary Aluminum Production
Synthet ic Organic Chemical M anufacturing (HON)
Hydrochloric Acid Product ion
M edical Waste Incinerators
Other Categories ( 345 Other Categories)
1990 2002 Pct ChangeUtility Boilers 137,907 335,550 143%Industrial/Commercial/ Institutional Boilers & Process Heaters 23,278 186,871 703%Muncipal Waste Combustors 57,397 6,125 -89%Pulp and Paper Production 20,224 3,851 -81%Portland Cement Manufacturing 9,579 3,168 -67%Hazardous Waste Incineration 9,415 2,690 -71%Secondary Aluminum Production 17,262 1,452 -92%Synthetic Organic Chemical Manufacturing (HON) 23,100 539 -98%Hydrochloric Acid Production 6,080 254 -96%Medical Waste Incinerators 29,258 150 -99%Other Categories ( 345 Other Categories) 39,143 21,701 -45%TOTAL 372,645 562,349 51%
Emissions (Tons) 11/20/06
• Hydrochloric Acid is only emitted from stationary sources. • Significant stationary source reductions have occurred due to the implementation of Maximum Achievable
Control Technology (MACT) standards for the Muncipal Waste Combustors, Medical Waste Incinerators, HON, Secondary Aluminum Production, Pulp and Paper Production, Portland Cement Manufacturing, Hydrochloric Acid Production, Hazardous Waste Incineration, Primary Magnesium Refining, and Steel Pickling - HCL Process.
• Categories such as utility and industrial/institutional/commercial boilers are underestimated in the current 1990 NEI, which causes the trend in emissions to appear to be increasing by 50%.
Source: 2002 NEI version 1. Emission estimates are subject to updates for subsequent revised versions of the 2002 NEI and do not reflect emission changes considered in ongoing regulatory rulemakings such as the Lead NAAQS or Risk and Technology Review Assessment (RTR).

Hydrochloric Acid (cont.)
2002 Emissions:Major HAP Categorization
Utility Boilers60%
Ind/Comm/Inst Boilers
33%
M unc. Waste Comb.
1%
Other6%
2002 Emissions:Major Source Categorization
Industrial6%
Other3%
Fuel Comb.91%
• The “Other” Category shown in the Major Source Categorization pie chart includes open burning and
incineration categories.
2002 Emissions Density Map
• The emissions density map shows that hydrochloric acid is emitted in higher concentrations in UT. This is due to state reported industrial boiler data.

Maleic Anhydride • HAP Category Name: Maleic Anhydride • CAS Number: 108-31-6 • Chemical Formula: C4H2O3 Molecular Weight: 98.06 • Toxicity: Potential NonCancer Effects • 40 Source Categories (2002) • 2002 Total Emissions: 144 tons
Emissions Trends (1990 to 2002)
0
1,000
2,000
3,000
4,000
5,000
6,000
7,000
1990 2002
Tons
/Yea
r
Synthetic Organic Chemical M anufacturing(HON)M iscellaneous Organic ChemicalM anufacturingPlastic M aterials and Resins M anufacturing
Industrial Organic Chemical M anufacturing
Amino/Phenolic Resins Production
Industrial/Commercial/ Institutional Boilers& Process HeatersChemical Preparations
Other Categories ( 41 Other Categories)
1990 2002 Pct ChangeSynthetic Organic Chemical Manufacturing (HON) 6,096.6 98.6 -98%Miscellaneous Organic Chemical Manufacturing 146.3 18.3 -87%Plastic Materials and Resins Manufacturing 2.1 8.4 308%Industrial Organic Chemical Manufacturing 28.5 7.2 -75%Amino/Phenolic Resins Production 2.8Industrial/Commercial/ Institutional Boilers & Process Heaters 0.1 2.5 1714%Chemical Preparations 0.9 2.0 113%Other Categories ( 41 Other Categories) 69.4 4.4 -94%TOTAL 6,343.9 144.3 -98%
Emissions (Tons) 11/20/06
• Maleic anhydride is only emitted from stationary sources. • Significant stationary source reductions have occurred due to the implementation of Maximum Achievable
Control Technology (MACT) standards for the HON, Miscellaneous Organic Chemical Manufacturing, and Miscellaneous Coating Manufacturing sources.
• Some sources present in 2002 NEI are not present in the 1990 NEI. Source: 2002 NEI version 1. Emission estimates are subject to updates for subsequent revised versions of the 2002 NEI and do not reflect emission changes considered in ongoing regulatory rulemakings such as the Lead NAAQS or Risk and Technology Review Assessment (RTR).

Maleic Anhydride (cont.)
2002 Emissions:Major HAP Categorization
Chem. Prep.1%
Ind. Organic Chem. M fg
5%
Plast ic M at. & Resins M fg
6%
M isc Organic Chem. M fg
13%
Other3%
Synth Organic Chem. M fg
68%
Amino/Phenolic Resins Prod.
2%
Ind/Comm/ Inst Boilers
2%
2002 Emissions:Major Source Categorization
Fuel Comb.2%
Industrial98%
2002 Emissions Density Map
• The County Density map shows that maleic anhydride is emitted in 160 counties of the 3141 counties in the 50 states.

Manganese Compounds • HAP Category Name: Manganese Compounds • Includes 13 compounds in the NEI • Toxicity: Potential NonCancer Effects • 364 Source Categories (2002) • 2002 Total Emissions: 2,664 tons
Emissions Trends
0
500
1,000
1,500
2,000
2,500
3,000
3,500
4,000
1990 2002
Tons
/Yea
r
Industrial/Commercial/ Inst itut ional Boilers &Process HeatersStainless and Nonstainless Steel M anufacturing:Electric Arc Furnaces (EAF)Ut ility Boilers
Ferroalloys Production
Iron and Steel Foundries
Primary M etal Products M anufacturing
Integrated Iron & Steel M anufacturing
Industrial Inorganic Chemical M anufacturing
Other Categories (371 categories)
1990 2002 Pct ChangeIndustrial/Commercial/ Institutional Boilers & Process Heaters 626 635 1%Stainless and Nonstainless Steel Manufacturing: Electric Arc Furnaces (EAF) 13 527 3896%Utility Boilers 195 257 32%Ferroalloys Production 667 251 -62%Iron and Steel Foundries 588 134 -77%Primary Metal Products Manufacturing 15 105 589%Integrated Iron & Steel Manufacturing 646 46 -93%Industrial Inorganic Chemical Manufacturing 163 45 -72%Other Categories (371 categories) 664 663 0%TOTAL 3,578 2,664 -26%
Emissions (Tons) 11/20/06
• Stationary source reductions have occurred due to the implementation of Maximum Achievable Control
Technology (MACT) standards for the Ferroalloys Production, Integrated Iron & Steel Manufacturing, and Iron and Steel Foundries sources.
• Categories such as utility and industrial/commercial/institutional boilers and electric arc furnaces are underestimated in the 1990 NEI.
Source: 2002 NEI version 1. Emission estimates are subject to updates for subsequent revised versions of the 2002 NEI and do not reflect emission changes considered in ongoing regulatory rulemakings such as the Lead NAAQS or Risk and Technology Review Assessment (RTR).

Manganese Compounds (cont.)
2002 Emissions:Major HAP Categorization
Ind/Comm/Inst Boilers
24%
Stainless/ Nonstainless
Steel M fg20%
Other24%
Iron and Steel Foundries
5% Ferroalloys Prod.
9%
Utility Boilers10%
Primary M etal Prod. M fg
4%
Port land Cement M fg
4%
2002 Emissions:Major Source Categorization
Fuel Comb.34%
Industrial64%
M obile1%
Other1%
• The “Other” Category shown in the Major Source Categorization pie chart includes open burning, landfills, and incineration categories.
2002 Emissions Density Map

Mercury Compounds • HAP Category Name: Mercury Compounds • Includes: 9 compounds in the NEI • Toxicity: Potential NonCancer Effects • 213 Source Categories (2002) • 2002 Total Emissions: 111.6 tons
Emissions Trends (1990 to 2002)
0
50
100
150
200
250
300
1990 2002
Tons
/Yea
r
Utility coal boilers
Electric Arc Furnaces
Industrial/Commercial/ Inst itut ional Boilers &Process HeatersGold mining
M ercury Cell Chlor Alkali Plants
Hazardous waste incinerat ion
M unicipal waste combustors
M edical waste incinerators
Other categories
1990 2002 Pct ChangeUtility coal boilers 58.9 50.3 -14.6%Electric Arc Furnaces 7.5 10.7 42.7%Industrial/Commercial/ Institutional Boile 12 10 -16.7%Gold mining 3.3 6.5 97.0%Mercury Cell Chlor Alkali Plants 10.6 5.4 -49.1%Hazardous waste incineration 6.6 4.6 -30.3%Municipal waste combustors 57.3 4.2 -92.7%Medical waste incinerators 51 0.2 -99.6%Other categories 32.6 19.7 -39.6%TOTAL 239.8 111.6 -53.5%
Emissions (Tons)
• Significant stationary source reductions have occurred due to the implementation of Maximum Achievable
Control Technology (MACT) standards for the Municipal Waste Combustors, Medical Waste Incinerators, Mercury Cell Chlor-Alkali Plants, and Hazardous Waste Incineration sources.
• The mercury inventory data are some of the best in the NEI. The largest sources of mercury in the NEI are based on source test data.
• Mobile source estimates will be added in version 3.0 2002 NEI later this year. Mobile sources are currently not present in the NEI.
Source: 2002 NEI version 1. Emission estimates are subject to updates for subsequent revised versions of the 2002 NEI and do not reflect emission changes considered in ongoing regulatory rulemakings such as the Lead NAAQS or Risk and Technology Review Assessment (RTR).

Mercury Compounds (cont.)
2002 Emissions:Major Source Categorization
Fuel Combustion
57%
Industrial33%
Other10%
2002 Emissions: Major HAP Categorization
Utility Boilers43%
M WC4%
Indust. Boilers9%
Gold M ining6%
Waste Incin.4%
Furnaces10%
Chlor-Alkali5%
Other19%
M WI0%
2002 Emissions Density Map
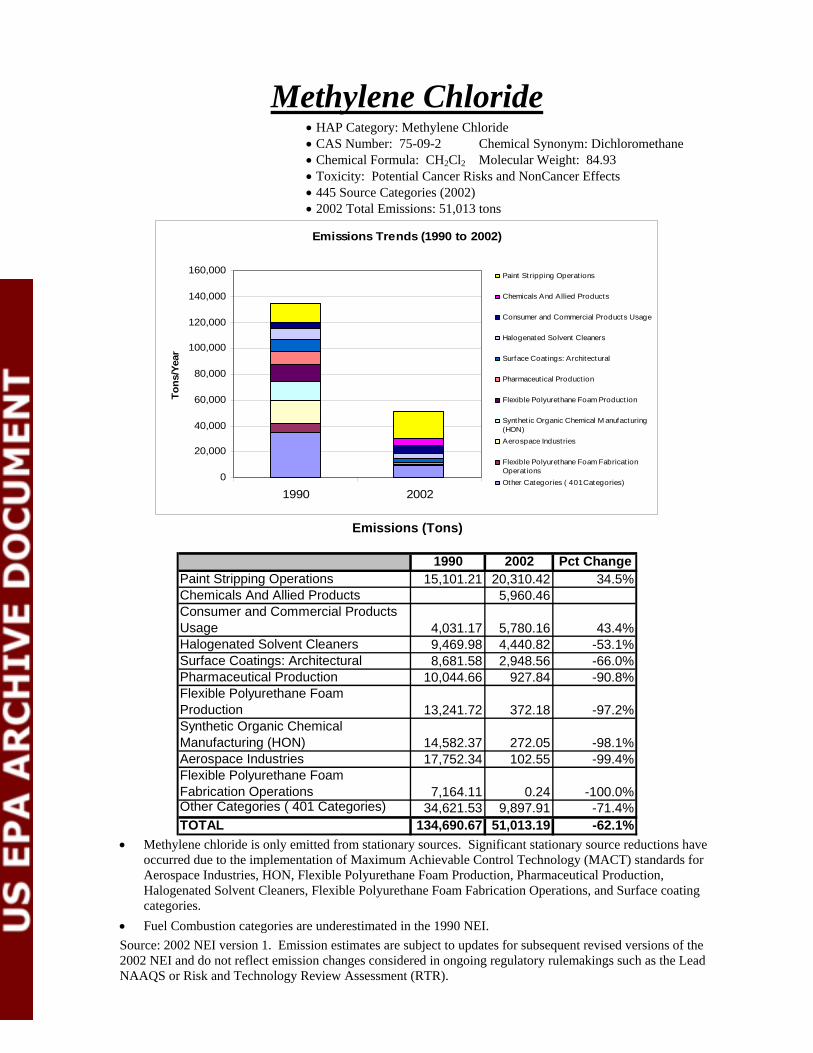
Methylene Chloride • HAP Category: Methylene Chloride • CAS Number: 75-09-2 Chemical Synonym: Dichloromethane • Chemical Formula: CH2Cl2 Molecular Weight: 84.93 • Toxicity: Potential Cancer Risks and NonCancer Effects • 445 Source Categories (2002) • 2002 Total Emissions: 51,013 tons
Emissions Trends (1990 to 2002)
0
20,000
40,000
60,000
80,000
100,000
120,000
140,000
160,000
1990 2002
Tons
/Yea
r
Paint Stripping Operat ions
Chemicals And Allied Products
Consumer and Commercial Products Usage
Halogenated Solvent Cleaners
Surface Coatings: Architectural
Pharmaceut ical Product ion
Flexible Polyurethane Foam Product ion
Synthet ic Organic Chemical M anufacturing(HON)Aerospace Industries
Flexible Polyurethane Foam Fabricat ionOperat ionsOther Categories ( 401 Categories)
1990 2002 Pct ChangePaint Stripping Operations 15,101.21 20,310.42 34.5%Chemicals And Allied Products 5,960.46Consumer and Commercial Products Usage 4,031.17 5,780.16 43.4%Halogenated Solvent Cleaners 9,469.98 4,440.82 -53.1%Surface Coatings: Architectural 8,681.58 2,948.56 -66.0%Pharmaceutical Production 10,044.66 927.84 -90.8%Flexible Polyurethane Foam Production 13,241.72 372.18 -97.2%Synthetic Organic Chemical Manufacturing (HON) 14,582.37 272.05 -98.1%Aerospace Industries 17,752.34 102.55 -99.4%Flexible Polyurethane Foam Fabrication Operations 7,164.11 0.24 -100.0%Other Categories ( 401 Categories) 34,621.53 9,897.91 -71.4%TOTAL 134,690.67 51,013.19 -62.1%
Emissions (Tons)
• Methylene chloride is only emitted from stationary sources. Significant stationary source reductions have
occurred due to the implementation of Maximum Achievable Control Technology (MACT) standards for Aerospace Industries, HON, Flexible Polyurethane Foam Production, Pharmaceutical Production, Halogenated Solvent Cleaners, Flexible Polyurethane Foam Fabrication Operations, and Surface coating categories.
• Fuel Combustion categories are underestimated in the 1990 NEI. Source: 2002 NEI version 1. Emission estimates are subject to updates for subsequent revised versions of the 2002 NEI and do not reflect emission changes considered in ongoing regulatory rulemakings such as the Lead NAAQS or Risk and Technology Review Assessment (RTR).

. Methylene Chloride (cont.)
2002 Emissions:Major HAP Categorization
Paint Stripping39%
Chem/Allied Prod.12%
Cons/Comm Prod.11%
Other14%
Pharm. Prod.2%
HF Prod.2%
Plast ic/Resins M fg1%
POTW1%
Coat ings: Archit
6%
Halogenated Solv. Cleaners
9%
M unic. Landfills3%
2002 Emissions: Major Source Categorization
Fuel Combust ion
1%
Industrial84%
Other15%
2002 Emissions Density Map
• The emissions density map shows that methylene chloride is emitted in higher concentrations in areas with greater population. The primary source of methylene chloride emissions in 2002 is solvent use, which can be correlated to population.

Naphthalene • HAP Category Name: Naphthalene • CAS Number: 91-20-3 • Chemical Formula: C10H8 Molecular Weight: 128.16 • Toxicity: Potential Cancer Risks and NonCancer Effects • 174 Source Categories (2002) • 2002 Total Emissions: 16,110 tons
Emissions Trends
0
5,000
10,000
15,000
20,000
25,000
30,000
1990 2002
Tons
/Yea
r
M obile sources
Consumer and Commercial Products Usage
Resident ial Boilers: Wood/Wood ResidueCombustionIndustrial/Commercial/ Inst itut ional Boilers & ProcessHeaters
Surface Coatings: Industrial M aintenance
Asphalt Paving
Synthetic Organic Chemical M anufacturing (HON)
Aerospace Industries
Other Categories (386 Other Categories)
1990 2002 Pct ChangeMobile sources 7,849.6 4,910.3 -37%Consumer and Commercial Products Usage 5,105.1 2,774.2 -46%
Residential Boilers: Wood/Wood Residue Combustion 1,257.1 2,546.1 103%Industrial/Commercial/ Institutional Boilers & Process Heaters 156.8 1,503.7 859%Surface Coatings: Industrial Maintenance 136.0 754.0 454%Asphalt Paving 510.7Synthetic Organic Chemical Manufacturing (HON) 3,330.4 125.8 -96%Aerospace Industries 1,620.3 22.3 -99%Other Categories (386 Other Categories) 6,147.3 2,962.6 -52%TOTAL 25,602.5 16,109.6 -37%
Emissions (Tons) 11/20/06
• Stationary source and mobile source regulations have reduced naphthalene emissions by approximately
37% since 1990. Significant stationary source reductions have occurred due to the implementation of Maximum Achievable Control Technology (MACT) standards for HON, Aerospace Industries, Petroleum Refineries, Pulp and Paper Production, and Miscellaneous Organic Chemical Manufacturing sources.
• Emission estimation methodologies are different in 1990 and 2002 for Gasoline Distribution (Stage I). • Categories such as Asphalt Paving, Architectural Surface Coatings and Charbroiling are reported in 2002
NEI but were not reported in the 1990 NEI. Other categories such as residential wood combustion and industrial/institutional/commercial boilers are underestimated in the 1990 NEI.
Source: 2002 NEI version 1. Emission estimates are subject to updates for subsequent revised versions of the 2002 NEI and do not reflect emission changes considered in ongoing regulatory rulemakings such as the Lead NAAQS or Risk and Technology Review Assessment (RTR).

Naphthalene (cont.)
2002 Emissions:Major HAP Categorization
Cons/Comm Prod. Usage
17%Res. Boilers: Wood
16%
Ind. Surface Coat ings
5%
Ind/Comm/ Inst Boilers
9%
Surface Coatings: Arch.
1%
Top/Body/ Upholstery
Repair1%
Other14%
M obile sources31%
Asphalt Paving3%
Gasoline Dist . (Stage I)
3%
2002: EmissionsMajor Source Categorization
Fuel Comb.25%
Industrial22%M obile
31%
Other22%
The “Other” Category shown in the Major Source Categorization pie chart includes asphalt paving, consumer/commercial solvent usage, open burning, incineration and charbroiling categories.
2002 Emissions Density Map
• The emissions density map shows that naphthalene is emitted in higher concentrations in areas with greater
population.

Nickel Compounds • HAP Category Name: Nickel Compounds • Includes 20 compounds in the NEI • Toxicity: Potential Cancer Risks and NonCancer Effects • 174 Source Categories (2002) • 2002 Total Emissions: 1,235 tons
Emissions Trends (1990 to 2002)
0
200
400
600
800
1,000
1,200
1,400
1990 2002
Tons
/Yea
r
Other Categories
Electric Services
Utility Boilers: Coal
Petroleum Refineries - Catalyt ic Cracking, Catalyt icReforming, & Sulfur Plant Units
Industrial/Commercial/ Inst itut ional Boilers & ProcessHeaters - oil
Ut ility Boilers: Oil
1990 2002 Pct ChangeUtility Boilers: Oil 395 153 -61%Industrial/Commercial/ Institutional Boilers & Process Heaters - oil 191 293 53%Petroleum Refineries - Catalytic Cracking, Catalytic Reforming, & Sulfur Plant Units 102 6 -94%Utility Boilers: Coal 57 162 182%Electric Services N/A 49Other Categories 527 572 9%TOTAL 1,273 1,235 -3%
Emissions (Tons)
• Stationary source reductions have occurred due to the implementation of Maximum Achievable Control
Technology (MACT) standards for the Petroleum Refineries and Integrated Iron & Steel Manufacturing sources.
• Categories such as utility and industrial/commercial/institutional boilers and electric arc furnaces are underestimated in the 1990 NEI.
Source: 2002 NEI version 1. Emission estimates are subject to updates for subsequent revised versions of the 2002 NEI and do not reflect emission changes considered in ongoing regulatory rulemakings such as the Lead NAAQS or Risk and Technology Review Assessment (RTR).

Nickel Compounds (cont.)
2002 Emissions:Major HAP Categorization
Indl/Comm/Inst Boilers
36%
Utility Boilers26%
Pulp/Paper Prod.
2%
M obile sources4%
Stat. Comb. Turbines
1%
Other19%
Iron/Steel Foundries
3%
On-site Incin.3%
Petro/Coal Products
4%
Stainless/ Nonstainless
Steel M fg2%
2002: EmissionsMajor Source Categorization
Industrial31%
M obile4%
Other4%
Fuel Comb.61%
The “Other” Category shown in the Major Source Categorization pie chart includes open burning, landfills, and incineration categories.
2002 Emissions Density Map
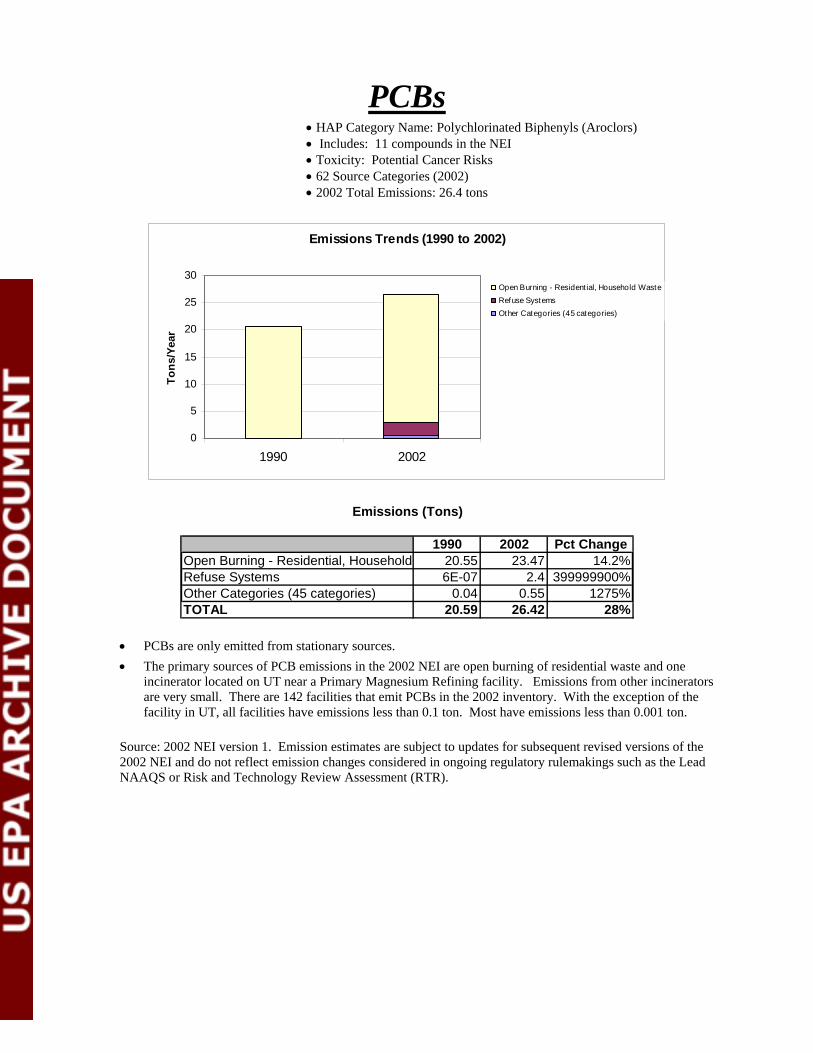
PCBs • HAP Category Name: Polychlorinated Biphenyls (Aroclors) • Includes: 11 compounds in the NEI • Toxicity: Potential Cancer Risks • 62 Source Categories (2002) • 2002 Total Emissions: 26.4 tons
Emissions Trends (1990 to 2002)
0
5
10
15
20
25
30
1990 2002
Tons
/Yea
r
Open Burning - Residential, Household WasteRefuse SystemsOther Categories (45 categories)
1990 2002 Pct ChangeOpen Burning - Residential, Household 20.55 23.47 14.2%Refuse Systems 6E-07 2.4 399999900%Other Categories (45 categories) 0.04 0.55 1275%TOTAL 20.59 26.42 28%
Emissions (Tons)
• PCBs are only emitted from stationary sources. • The primary sources of PCB emissions in the 2002 NEI are open burning of residential waste and one
incinerator located on UT near a Primary Magnesium Refining facility. Emissions from other incinerators are very small. There are 142 facilities that emit PCBs in the 2002 inventory. With the exception of the facility in UT, all facilities have emissions less than 0.1 ton. Most have emissions less than 0.001 ton.
Source: 2002 NEI version 1. Emission estimates are subject to updates for subsequent revised versions of the 2002 NEI and do not reflect emission changes considered in ongoing regulatory rulemakings such as the Lead NAAQS or Risk and Technology Review Assessment (RTR).

PCBs (cont.)
2002 Emissions: Major HAP Categorization
Res. Open Burning
89%
Refuse Systems
9%
Other2%
2002 Emissions: Major Source Categorization
Other89%
Fuel Combustion
1%Industrial
10%
• The “Other” Category shown in the Major Source Categorization pie chart includes open burning
categories and incineration.
2002 Emissions Density Map
• The County Density map shows that PCBs are emitted in 2717 counties of the 3141 counties in the 50
states.

Polycyclic Organic Matter • HAP Category Name: Polycyclic Organic Matter (POM); Total • Includes: 55 compounds (PAHs) in the NEI • Toxicity: Potential Cancer Risks and NonCancer Effects • 377 Source Categories (2002) • 2002 Total Emissions: 13,772 tons
Emission Trends (1990 to 2002)
0
2,000
4,000
6,000
8,000
10,000
12,000
14,000
16,000
1990 2002
Tona
/Yea
r
Resident ial Boilers: Wood/Wood ResidueCombustionOpen Burning - Forest , Wildf ires, andPrescribed FiresM obile sources
Open Burning - Resident ial, Household Waste
Coke Ovens
Industrial/Commercial/ Inst itut ional Boilers &Process HeatersPrimary Aluminum Product ion
Petroleum Refineries
Synthet ic Organic Chemical M anufacturing(HON)Integrated Iron & Steel M anufacturing
Other Categories (321 Categories)
1990 2002 Pct Change
Residential Boilers: Wood/Wood Residue Combustion 1937.56 6875.68 255%
Open Burning - Forest, Wildfires, and Prescribed Fires 3330.79 3972.53 19%Mobile sources 1367.37 844.83 -38%Open Burning - Residential, Household Waste 275.43 426.56 55%Coke Ovens 841.76 324.48 -61%Industrial/Commercial/ Institutional Boilers & Process Heaters 1410.38 160.14 -89%Primary Aluminum Production 701.61 104.92 -85%Petroleum Refineries 332.65 45.73 -86%Synthetic Organic Chemical Manufacturing (HON) 857.51 17.99 -98%Integrated Iron & Steel Manufacturing 662.85 15.69 -98%Other Categories (321 Categories) 726.09 983.41 35%Totals 12,444 13,772 11%
Emissions (Tons) 11/20/06
• Stationary source and mobile source regulations have reduced POM emissions since 1990. Stationary
source reductions have occurred due to the implementation of Maximum Achievable Control Technology (MACT) standards for Primary Aluminum Production, Integrated Iron & Steel Manufacturing, and Petroleum Refineries sources.
• Emission estimation methodologies are different in 1990 and 2002 for the categories of: Open Burning: Forest and Wildfires and Prescribed Burns.
• Categories, such as Residential Wood Combustion, are underestimated in the 1990 NEI. • In 1990, POM included naphthalene as part of the 16-PAH definition used. Source: 2002 NEI version 1. Emission estimates are subject to updates for subsequent revised versions of the 2002 NEI and do not reflect emission changes considered in ongoing regulatory rulemakings such as the Lead NAAQS or Risk and Technology Review Assessment (RTR).

Polycyclic Organic Matter (cont.)
2002 Emissions:Major HAP Categorizations
Ind/Comm/Inst Boilers 1%
Catastrophic/ Accidental Releases 1%
Comm. Cooking -
Charbroiling 2%
Other 5%
Open/Presc./ Wild Fires 29%
Res. Boilers: Wood 51%
Open Burning - Residential, Household Waste 3%
Coke Ovens 2%
M obile sources 6%
2002 Emissions: Major Source Categorizations
Fuel Comb. 52%
Industrial 6%
M obile 6%
Other 36%
2002 Emissions Density Map
• The emissions density map shows that POM is emitted in higher concentrations in areas with greater
population. The counties in Montana and Idaho with high emission densities are due to agricultural field burning.

Propylene dichloride • HAP Category Name: Propylene dichloride • CAS Number: 78-87-5 Chemical Synonym: 1,2-Dichloropropane • Chemical Formula: C3H6Cl2 Molecular Weight: 112.99 • Toxicity: Potential Cancer Risks and NonCancer Effects • 77 Source Categories (2002) • 2002 Total Emissions: 161 tons
Emissions Trends (1990 to 2002)
0
100
200
300
400
500
600
700
1990 2002
Tons
/Yea
r
Amino/Phenolic Resins Production
M iscellaneous Organic ChemicalM anufacturingM unicipal Landfills
Chemical Preparations
M agnetic Tapes (Surface Coating)
Synthetic Organic ChemicalM anufacturing (HON)Photographic Equipment and Supplies
Hydrochloric Acid Production
Other Categories (51 Other Categories)
1990 2002 Pct ChangeAmino/Phenolic Resins Production 62.43Miscellaneous Organic Chemical Manufacturing 92.72 37.08 -60.0%Municipal Landfills 0.28 26.64 9414.3%Chemical Preparations 139.44 12.67 -90.9%Magnetic Tapes (Surface Coating) 9.31Synthetic Organic Chemical Manufacturing (HON) 56.06 4.41 -92.1%
Photographic Equipment and Supplies 195 0.004 -100.0%Hydrochloric Acid Production 104.7 0.004 -100.0%Other Categories (51 Other Categories) 22.71 8.05 -64.6%TOTAL 610.9 160.6 -73.7%
Emissions (Tons)
• Propylene dichloride is only emitted from stationary sources. • Stationary source reductions have occurred due to the implementation of Maximum Achievable Control
Technology (MACT) standards for the Hydrochloric Acid Production, Miscellaneous Organic Chemical Manufacturing, and HON sources
• A number of source categories are reported in the 2002 NEI but were not reported in the 1990 NEI. Source: 2002 NEI version 1. Emission estimates are subject to updates for subsequent revised versions of the 2002 NEI and do not reflect emission changes considered in ongoing regulatory rulemakings such as the Lead NAAQS or Risk and Technology Review Assessment (RTR).

Propylene dichloride (cont.) 2002 Emissions:
Major HAP Categorization
Amino/Phenolic Resins Prod.
38%
M isc. Org. Chem. M fg
23%
Other3%
Landfills2%
Synth. Org. Chem M fg
3%
M ag. Tapes6%
Chem. Prep.8%
M unic. Landf ills17%
2002 Emissions: Major Source Categorization
Fuel Combustion
1%
Industrial80%
Other19%
• The “Other” Category shown in the Major Source Categorization pie chart includes consumer and
commercial products usage, incineration and landfill categories. 2002 Emissions Density Map
• The County Density map shows that propylene dichloride is emitted in 3065 counties of the 3141 counties
in the 50 states. • Lowest range extends below 10-9 tons/sq. mi. White areas identify counties with actual zero emissions.

Quinoline • HAP Category Name: Quinoline • CAS Number: 91-22-5 • Chemical Formula: C9H7N Molecular Weight: 129.16 • Toxicity: Potential Cancer Risks • 22 Source Categories (2002) • 2002 Total Emissions: 3.86 tons
Emissions (Tons)
0
10
20
30
40
50
60
70
80
1990 2002
Tons
/Yea
r
Organic Liquids Distribut ion (Non-Gasoline)
Wood Preserving
Synthet ic Organic Chemical M anufacturing(HON)Print ing, Coating & Dyeing Of Fabrics
Integrated Iron & Steel M anufacturing
M iscellaneous Organic ChemicalM anufacturingIndustrial Organic Chemical M anufacturing
Other Categories (10 Other Categories)
1990 2002 Pct ChangeOrganic Liquids Distribution (Non-Gasoline) 1.46Wood Preserving 0.09 0.9 900.0%Synthetic Organic Chemical Manufacturing (HON) 43.89 0.85 -98.1%
Printing, Coating & Dyeing Of Fabrics 0.15
Integrated Iron & Steel Manufacturing 9.18 0.14 -98.5%Miscellaneous Organic Chemical Manufacturing 11.72Industrial Organic Chemical Manufacturing 4.38Other Categories (10 Other Categories) 0.77 0.36 -53.2%TOTAL 70.03 3.86 -94.5%
Emissions (Tons)
• Quinoline is only emitted from stationary sources. • Stationary source reductions have occurred due to the implementation of Maximum Achievable Control
Technology (MACT) standards for the HON. • Some sources present in 2002 NEI are not present in the 1990 NEI. Source: 2002 NEI version 1. Emission estimates are subject to updates for subsequent revised versions of the 2002 NEI and do not reflect emission changes considered in ongoing regulatory rulemakings such as the Lead NAAQS or Risk and Technology Review Assessment (RTR).

Quinoline (cont.)
2002 Emissions: Major Source Categorization
Fuel Combustion
3%
Industrial96%
Other1%
2002 Emissions: Major HAP Categorization
Org Liquids Dist . (Non-Gasoline)
37%
Wood Preserving
23%
Cyclic Crude& Intermed. Prod.
2%
Ind/Comm/Inst. Boilers
3%Integ.
Iron/Steel M fg4%
Print ing/ Coat ing/
Dyeing: Fabrics4%
Synth. Org. Chem. M fg
22%
Petro. Ref.1% Other
4%
2002 Emissions Density Map
• The County Density map shows that quinoline is emitted in 26 counties of the 3141 counties in the 50
states.

Tetrachloroethylene • HAP Category Name: Tetrachloroethylene • CAS Number: 127-18-4 Chemical Synonym: Perchloroethylene • Chemical Formula: C2Cl4 Molecular Weight: 165.83 • Toxicity: Potential Cancer Risks and NonCancer Effects • 281 Source Categories (2002) • 2002 Total Emissions: 35,587 tons
Emissions Trends (1990 to 2002)
0
20,000
40,000
60,000
80,000
100,000
120,000
1990 2002
Tons
/Yea
r
Dry Cleaning Facilit ies
Consumer and Commercial Products Usage
Halogenated Solvent Cleaners
M unicipal Landfills
Aerospace Industries
Other Categories (336 Categories)
1990 2002 Pct ChangeDry Cleaning Facilities 77,698 22,117 -72%Consumer and Commercial Products Usage 3,126 3,733 19%Halogenated Solvent Cleaners 12,428 3,541 -72%Municipal Landfills 45 812 1713%Aerospace Industries 2,488 323 -87%Other Categories (336 Categories) 11,494 5,061 -56%TOTAL 107,280 35,587 -67%
Emissions (Tons)
• Tetrachloroethylene is only emitted from stationary sources. • Significant stationary source reductions have occurred due to the implementation of Maximum Achievable
Control Technology (MACT) standards for the Dry Cleaning, Halogenated Solvent Cleaners, Aerospace Industries and surface coating sources.
• Landfills are reported in 2002 NEI but were not reported in the 1990 NEI. Source: 2002 NEI version 1. Emission estimates are subject to updates for subsequent revised versions of the 2002 NEI and do not reflect emission changes considered in ongoing regulatory rulemakings such as the Lead NAAQS or Risk and Technology Review Assessment (RTR).
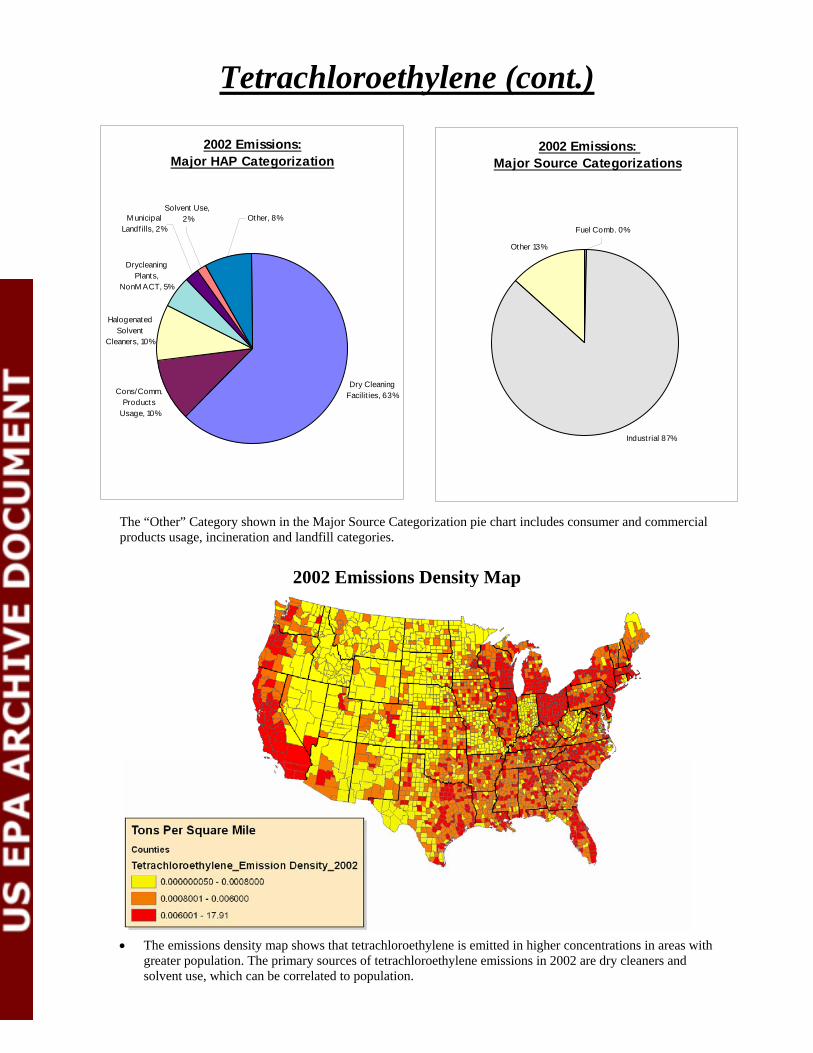
Tetrachloroethylene (cont.)
2002 Emissions:Major HAP Categorization
Dry Cleaning Facilit ies, 63%Cons/Comm.
Products Usage, 10%
Halogenated Solvent
Cleaners, 10%
Drycleaning Plants,
NonM ACT, 5%
Other, 8%M unicipal Landf ills, 2%
Solvent Use, 2%
2002 Emissions: Major Source Categorizations
Industrial 87%
Other 13%
Fuel Comb. 0%
The “Other” Category shown in the Major Source Categorization pie chart includes consumer and commercial products usage, incineration and landfill categories.
2002 Emissions Density Map
• The emissions density map shows that tetrachloroethylene is emitted in higher concentrations in areas with
greater population. The primary sources of tetrachloroethylene emissions in 2002 are dry cleaners and solvent use, which can be correlated to population.

Trichloroethylene • HAP Source Category Name: Trichloroethylene • CAS Number: 79-01-6 • Chemical Formula: C2HCl3 Molecular Weight: 131.39 • Toxicity: Potential Cancer Risks and NonCancer Effects • 344 Source Categories (2002) • 2002 Total Emissions: 10,847 tons
Emissions Trends (1990 to 2002
0
10,000
20,000
30,000
40,000
50,000
60,000
70,000
80,000
90,000
1990 2002
Tons
/Yea
r
Halogenated Solvent CleanersSolvent UsePlast ic Parts & Products (Surface Coat ing)M unicipal LandfillsPrimary M etal Products M anufacturingM etal Stamping, NECAerospace IndustriesConsumer and Commercial Products UsageOther Categories (305 Other Categories)
1990 2002 Pct ChangeHalogenated Solvent Cleaners 42,569.88 2,903.07 -93.2%Solvent Use 1,973.47Plastic Parts & Products (Surface Coat 2,099.81 559.08 -73.4%Municipal Landfills 11.94 482.56 3941.5%Primary Metal Products Manufacturing 46.79 389.87 733.2%Metal Stamping, NEC 619.60 325.44 -47.5%Aerospace Industries 13,450.15 278.01 -97.9%Consumer and Commercial Products U 53.84 243.99 353.2%Other Categories (305 Other Categorie 18,319.38 3,691.08 -79.9%TOTAL 77,171.39 10,846.57 -85.9%
Emissions (Tons)
• Trichloroethylene is only emitted from stationary sources. • Significant stationary source reductions have occurred due to the implementation of Maximum Achievable
Control Technology (MACT) standards for the Halogenated Solvent Cleaners, Aerospace Industries , HON, and surface coating sources.
• Landfills are underestimated in the 1990 NEI. Source: 2002 NEI version 1. Emission estimates are subject to updates for subsequent revised versions of the 2002 NEI and do not reflect emission changes considered in ongoing regulatory rulemakings such as the Lead NAAQS or Risk and Technology Review Assessment (RTR).

Trichloroethylene (cont.)
202 Emissions: Major HAP Categorization
Halogenated Solv. Cleaners
27%
Solvent Use18%
Other31%
Aerospace Ind.3%M etal
Stamping3% Plast ic
Parts/Prod. (Surface Coat ing)
5%
Dry Cleaning Fac.3%
Primary M etal Prod. M fg
4%
M unic. Landf ills4%
Cons/Comm Prod. Usage
2%
2002 Emissions: Major Source Categorization
Industrial92%
Other8%
Fuel Combustion
0%
• The “Other” Category shown in the Major Source Categorization pie chart includes consumer and
commercial products usage, incineration and landfill categories. 2002 Emissions Density Map
• The emissions density map shows that trichloroethylene is emitted in higher concentrations in areas with
greater population. The primary source of trichloroethylene emissions in 2002 is solvent use, which can be correlated to population.

Triethylamine • HAP Category Name: Triethylamine • CAS Number: 121-44-8 • Chemical Formula: C6H15N Molecular Weight: 101.19 • Toxicity: Potential NonCancer Effects • 106 Source Categories (2002) • 2002 Total Emissions: 851 tons
Emissions Trends (1990-2002)
0
200
400
600
800
1000
1200
1400
1600
1990 2002
Tons
/Yea
r
Iron and Steel Foundries
Primary Aluminum Product ion
Consumer and Commercial Products Usage
M iscellaneous M etal Parts & Products (SurfaceCoat ing)Animal and M arine Fats and Oils
Industrial/Commercial/ Inst itut ional Boilers &Process HeatersSurface Coatings: Architectural
Plywood and Composite Wood Products
Synthetic Organic Chemical M anufacturing (HON)
Pharmaceutical Product ion
Other Categories (96 Categories)
1990 2002 Pct ChangeIron and Steel Foundries 304.68Primary Aluminum Production 63.86Consumer and Commercial Products Usage 92.9 47.8 -49%
Miscellaneous Metal Parts & Products (Surface Coating) 0.29 37.18 12721%Animal and Marine Fats and Oils 37.16Industrial/Commercial/ Institutional Boilers & Process Heaters 33.26Surface Coatings: Architectural 29.45Plywood and Composite Wood Products 27.77Synthetic Organic Chemical Manufacturing (HON) 991.63 26.05 -97%Pharmaceutical Production 337.74 4.2 -99%Other Categories (96 Categories) 42.86 239.42 459%TOTAL 1,465.4 850.8 -42%
Emissions (Tons) 11/20/06
• Triethylamine is only emitted from stationary sources. • Significant stationary source reductions have occurred due to the implementation of Maximum Achievable
Control Technology (MACT) standards for the HON, Pharmaceutical Production, and surface coating sources.
• A number of sources present in 2002 NEI are not present in the 1990 NEI. Source: 2002 NEI version 1. Emission estimates are subject to updates for subsequent revised versions of the 2002 NEI and do not reflect emission changes considered in ongoing regulatory rulemakings such as the Lead NAAQS or Risk and Technology Review Assessment (RTR).

Triethylamine (cont.)
2002 Emissions:Major HAP Categorization
Iron & Steel Foundries, 36%
Animal/M arine Fats & Oils, 4%
Ind/Comm/Inst Boilers, 4%
Surface Coatings: Archit ., 3%
Synth Organic Chem M fg, 3%
Other, 29%
Plywood/ Wood Prod.,
3%
M isc M etal Coating, 4%
Cons/Comm Products Usage, 6%
Primary Al Prod., 8%
2002 Emissions:Major Source Categorizations
Industrial 90%
Other 6% Fuel Comb. 4%
2002 Emissions Density Map
• The emissions density map shows that triethylamine is emitted in higher concentrations in areas with
greater population. The primary source of triethylamine emissions in 2002 is solvent use, which can be correlated to population

Vinyl chloride • HAP Category Name: Vinyl chloride • CAS Number: 75-01-4 • Chemical Formula: C2H3Cl Molecular Weight: 62.5 • Toxicity: Potential Cancer Risks and NonCancer Effects • 137 Source Categories (2002) • 2002 Total Emissions: 1,308 tons
Emissions Trends (1990 to 2002)
0
1,000
2,000
3,000
4,000
5,000
6,000
7,000
1990 2002
Tons
/Yea
r
M unicipal Landf ills
Plast ic M aterials and Resins M anufacturing
Landf ills
Publicly Owned Treatment Works
Synthetic Organic Chemical M anufacturing(HON)Polyvinyl Chloride & Copolymers Product ion
M iscellaneous Organic ChemicalM anufacturingPolymers and Resins 1 2
Hydrochloric Acid Production
Other Categories (110 Categories)
1990 2002 Pct ChangeMunicipal Landfills 10.12 598.52 5814.2%Plastic Materials and Resins Manufactu 0.51 187.99 36760.8%Landfills 130.92Publicly Owned Treatment Works 0.42 119.14 28266.7%Synthetic Organic Chemical Manufactur 4,198.24 112.29 -97.3%Polyvinyl Chloride & Copolymers Produ 1,012.89 58.11 -94.3%Miscellaneous Organic Chemical Manu 304.48 0.26 -99.9%Polymers and Resins 1 2 457.14Hydrochloric Acid Production 93.08Other Categories (110 Categories) 159.44 101.05 -36.6%TOTAL 6,236.32 1,308.28 -79.0%
Emissions (Tons)
• Vinyl chloride is only emitted from stationary sources. • Significant stationary source reductions have occurred due to the implementation of Maximum Achievable
Control Technology (MACT) standards for the HON, Polyvinyl Chloride & Copolymers Production, and Miscellaneous Organic Chemical Manufacturing.
• Landfills, the largest source category in the 2002 NEI, are not characterized well in the 1990 NEI. Source: 2002 NEI version 1. Emission estimates are subject to updates for subsequent revised versions of the 2002 NEI and do not reflect emission changes considered in ongoing regulatory rulemakings such as the Lead NAAQS or Risk and Technology Review Assessment (RTR).

Vinyl chloride (cont.) 2002 Emissions:
Major HAP Categorization
M unic. Landf ills46%
Plast ic M at./Resins
M fg14%
Landf ills10%
POTW9%
Synth. Org. Chem. M fg
9%
Organic Liq. Dist. (Non-Gasoline)
1%Polyvinyl Chloride/
Copolymers Prod.
4%
Other7%
2002 Emissions: Major Source Categorization
Industrial44%
Other56%
Fuel Combust ion
0%
. 2002 Emissions Density Map
• The County Density map shows that vinyl chloride is emitted in 3060 counties of the 3141 counties in the
50 states. • Lowest range extends below 10-9 tons/sq. mi. White areas identify counties with actual zero emissions.