draft interagency risk assessment - listeria monocytogenes ... · draft interagency risk assessment...
TRANSCRIPT

Draft Technical Report 5/1/2013
Draft Interagency Risk Assessment – Listeria monocytogenes in Retail Delicatessens Technical Report
The Interagency Retail Listeria monocytogenes
Risk Assessment Workgroup
May 2013

Draft Technical Report 5/1/2013

Draft Technical Report 5/1/2013
i
Interagency Retail Listeria monocytogenes Risk Assessment Workgroup
(In alphabetical order)
DARE AKINGBADE1
NATHAN BAUER1
SHERRI DENNIS2
DANIEL GALLAGHER3
KARIN HOELZER2,4
JANELL KAUSE1
RÉGIS POUILLOT2
MERYL SILVERMAN1,5
JIA TANG3
1 Food Safety and Inspection Service, U.S. Department of Agriculture, Washington, DC 20250 2 Center for Food Safety and Applied Nutrition, Food and Drug Administration, College Park, MD 20740 3 Department of Civil and Environmental Engineering, Virginia Tech, Blacksburg, VA 24061 4 formerly with the Department of Food Science, Cornell University, Ithaca, NY 14850 5 formerly with the University of Maryland, Joint Institute of Food Safety and Applied Nutrition, College Park, MD 20740

Draft Technical Report 5/1/2013
ii
Acknowledgements
The Interagency Retail Listeria monocytogenes Workgroup would like to thank the many contributions
made by others in the U.S. Department of Agriculture, Food Safety and Inspection Service (FSIS), the
U.S. Food and Drug Administration (FDA), and the Centers for Disease Control and Prevention (CDC),
as well as coordination of an independent peer review by Versar, Inc., focused studies conducted by those
in academia to fulfill specific data needs in this risk assessment, and input from both consumer groups
and industry throughout this risk assessment. Specific recognition includes the following:
We acknowledge and thank FSIS scientists and risk managers for their input and support throughout the
development of this risk assessment: Kristina Barlow, Phil Bronstein, Vivian Chen, Phil Derfler, Denise
Eblen, Daniel Engeljohn, David Goldman, Steve Mamber, Evelyne Mbandi, Tim Mohr, and William
Shaw. We acknowledge and thank the members of the FDA Risk Management team: Beth Calvey, Ted
Elkin, Faye Feldstein, Mary Losikoff, Mickey Parish, Jenny Scott, Kevin Smith, Mark Wirtz, and Donald
Zink for advice throughout the development of this risk assessment. We also want to thank our colleagues
from the CDC for their valuable input: Ezra Barzilay, Patricia Griffin, Martha Iwamoto, K. Liane Ong,
Benjamin Silk, and Robert Tauxe.
We are grateful to the following individuals for their contributions to a successful public meeting to
initiate this risk assessment and active inclusion of stakeholder and public input: Frederick Angulo1,
Daphne Brown2, John Butts3, Greg DiNapoli2, Frances Ann Draughon4, Amanda Eamich2, Linda
Eckrich2, Rachel Edelstein2, Atiya Khan2, Ndidi Mojay2, Amirhossein Mokhtari5, Laura Reiser2, Peggy
Riek2, and Robert Tynan2. We want to thank the many individuals from industry and consumer groups
that provided useful input in the development and refinement of this risk assessment: Susan L. Backus6,
1 Centers for Disease Control and Prevention 2 Food Safety and Inspection Services, U.S. Department of Agriculture 3 Land O’Frost 4 University of Tennessee 5 Research Triangle Institute (RTI) International 6 American Meat Institute Foundation

Draft Technical Report 5/1/2013
iii
Betsy Booren6, Pat Buck7, Caitlin Catella8, Tony Corbo9, Joe Corby10, Nancy Donley11, Jill
Hollingsworth12, Susan Kendrick13, Sara Klein8, Larry Kohl12, Felicia Nestor9, Tanya Roberts7, Caroline
Smith DeWaal8, Warren Stone14, Kimberly Stryker15, Hilary Thesmar12 and Carol Tucker-Forman16.
We thank the following individuals for their role in studies involving retail deli employee behavior,
longitudinal study/risk mapping of L. monocytogenes in the retail grocery deli environment, and
transmission of L. monocytogenes in retail delis: Shirley Bohm17, Renee Boyer18, Laura Brown2,
Elizabeth Calvey19, Benjamin Chapman20, Philip G. Crandall21, Susan Duncan18, Joseph Eiffert18, Caren
Kieswetter17, Brenda Le1, Jessica Maitland18, Jianghong Meng19, Haley Oliver22, Carol Selman1, Courtney
Simmons23, Martin Wiedmann23, and Denita Williams1. We also thank Vangelia Campbell2 for her tireless
support and oversight of FSIS contracts with Cornell University to develop a risk map of
L. monocytogenes in the retail deli environment [FSIS contracts: AG-3A94-C-09-0027;
AG-3A94-C-09-0028; and AG-3A94-C-10-0016] and with Virginia Polytechnic Institute and State
University for both the study of L. monocytogenes transmission in retail delis [FSIS contract:
AG-3A94-C-10-0007] and quantitative risk assessment modeling support for this interagency risk
assessment [FSIS contract: AG-3A94-P-08-0166]. We also thank Kristin Holt2 for facilitating an
interagency agreement between FSIS and CDC to collect nationwide information on worker behaviors in
retail delis.
We are grateful for the insights from the peer reviewers Leila M. Barraj24, Edmund A.C. Crouch25, and
Renata Ivanek-Miojevic26. We thank David Bottimore27, Kathy Coon27, Keith Drewes27, Ruth Holt2, Lori
7 Center for Foodborne Illness Research & Prevention 8 Center for the Science in the Public Interest 9 Food & Water Watch 10 Association of Food and Drug Official 11 STOP Foodborne Illness 12 Food Marketing Institute 13 Oregon Department of Agriculture 14 Grocery Manufacturers Association 15 Alaska Division of Environmental Health 16 Consumer Federation of America 17 Center for Food Safety and Applied Nutrition, Food and Drug Administration 18 Virginia Polytechnic Institute and State University (Virginia Tech) 19 Joint Institute for Food Safety and Applied Nutrition 20 North Carolina State University 21 University of Arkansas 22 Purdue University 23 Cornell University 24 Exponent® Engineering and Scientific Consulting

Draft Technical Report 5/1/2013
iv
Papadakis17, and Stephanie Sarraino27 for facilitating and organizing this FDA-FSIS co-funded
independent peer review.
We thank Mike Mikailov28, Brian Fitzgerald28, Stuart Barkley28, and Luo Fu-Jyh28 for their invaluable
contributions to programming and supercomputing. We would also like to thank Eric Ebel2, Mike
Williams2, Yong Cao29, and Jennifer Hoeting29 for providing additional high performance computer
capacity.
We acknowledge Wendy Fanaselle17, David Weingaertner17, David LaBarre2, and Stacy Kish2 for support
in the development and preparation of this report.
This project was supported in part by appointments to the Research Participation Program at the Center
for Food Safety and Applied Nutrition administered by the Oak Ridge Institute for Science and Education
through an interagency agreement between the U.S. Department of Energy and the U.S. Food and Drug
Administration.
Notwithstanding the considerable help and valuable expertise provided by the abovementioned,
responsibility for the content of this report rests solely with the U.S. Department of Agriculture, Food
Safety and Inspection Service and the Food and Drug Administration, Center for Food Safety and
Applied Nutrition.
25 Cambridge Environmental Inc 26 Texas A&M University 27 Versar, Inc. 28 Center for Devices and Radiological Health, Food and Drug Administration 29 Colorado State University

Draft Technical Report 5/1/2013
v
List of Abbreviations
AFDO Association of Food and Drug Officials
AMIF American Meat Institute Foundation
ARS Agricultural Research Service
cfu Colony Forming Units
CDC Centers for Disease Control and Prevention
CFA Consumer Federation of America
CFR Code of Federal Regulations
CFSAN Center for Food Safety and Applied Nutrition
CSPI Center for Science in the Public Interest
DHHS Department of Health and Human Services
EHS-Net Environmental Health Specialists Network
EO Eating Occasion
FAO Food and Agriculture Organization of the United Nations
FCS Food Contact Surface
FDA Food and Drug Administration
FMI Food Marketing Institute
FSIS Food Safety and Inspection Service
GI Growth Inhibitors
GMA Grocery Manufacturers Association
GT Generation Time
IAFP International Association for Food Protection
NAFSS National Alliance for Food Safety and Security
NCBI National Center for Biotechnology Information
NFCS Non-Food Contact Surface
NFPA National Food Processors Association
NHANES National Health and Nutrition Examination Survey
NIFA National Institute of Food and Agriculture
OMB Office of Management and Budget

Draft Technical Report 5/1/2013
vi
ppm Parts Per Million
QRA Quantitative Risk Assessment
RAC Raw Agricultural Commodities
RTE Ready-to-Eat
sd Standard Deviation
U.S. United States
USDA United States Department of Agriculture
Virginia Tech Virginia Polytechnic Institute and State University
WHO World Health Organization

Draft Technical Report 5/1/2013
vii
List of Abbreviations for Baselines and Mitigations
The Table below introduces the abbreviations used to identify the various risk assessment model baselines
and scenarios denoted in the figures of the Results and Discussion section of this report (Section 7). Abbreviations Description
Baselines Multiple Niche 100W A retail deli with multiple niches on slicers, utensils, food contact surfaces (FCSs) and non-food
contact surfaces (NFCSs). Each niche contaminates its associated site at a mean frequency of once per week with a mean of 100 colony forming units (cfu) per event.
No niche A retail deli without any niches or environmental L. monocytogenes transfer. Temperature Control A retail deli without any niches that maintains its deli case to ≤5°C (≤41°F)
Incoming Growth Chub A retail deli without any niches with an incoming ready-to-eat (RTE) product that supports the growth of L. monocytogenes and has a mean incoming L. monocytogenes concentration increased from the observed -9.2 log10 cfu per gram to -5 log10 cfu per gram.
Incoming Non-Growth Chub A retail deli without any niches with an incoming RTE product that does not support the growth of L. monocytogenes and has a mean incoming L. monocytogenes concentration increased from the observed -9.2 log10 cfu per gram to -5 log10 cfu per gram
Niche & Temperature Control A retail deli with “Multiple Niche 100W” (see above) that maintains the temperature of the deli case to ≤5°C (≤41°F)
Scenarios: Worker Behaviors, Sanitation, and Cross contamination Wash & Sanitize Increase the effectiveness of retail deli cleaning from simply washing to washing and sanitizing. Clean 8 Sporadic Doubling the number of retail deli sites sporadically cleaned from 4 to 8.
No Sanitation Do not conduct any wiping, washing or sanitizing. No Sporadic Cleaning Retail deli workers clean FCSs as required by the 2009 FDA Food Code, but do not conduct any
additional sporadic cleanings. No Glove Retail deli workers do not use gloves when serving customers.
Gloves Every Serving Retail deli workers change gloves for every sale of RTE products. NFCS as FCS Retail deli workers clean deli NFCSs as if they were FCSs (i.e., every 4 hours in accordance with
the 2009 FDA Food Code). Transfers to 0 Scenario where L. monocytogenes cross contamination in the retail deli would only result from the
deli slicer (i.e., set cross contamination transfer coefficients to 0 for all sites except the slicer). Transfers and Slicer to 0 Scenario where there is no L. monocytogenes cross contamination in the retail deli (i.e., set cross
contamination transfer coefficients to 0, i.e., no cross contamination occurs for all sites, including the slicer).
No Contact Glove Case Retail deli workers do not use their hands (gloved or ungloved) to open the retail deli case (e.g., if a floor switch is used).
Reduce Level Lower the mean incoming L. monocytogenes concentration on all RTE products from the observed mean of -9.2 log10 cfu per gram to a mean of -9.5 log10 cfu per gram.
Preslice Retail deli workers pre-slice all chubs of RTE product (deli meat and deli cheese) in the morning after cleaning.

Draft Technical Report 5/1/2013
viii
Scenarios: Worker Behaviors, Sanitation, and Cross contamination (Continued) Separate Slicer Retail deli workers use a separate slicer for RTE products that support growth of L. monocytogenes
versus those RTE products that do not. Separate Slicer Case Retail deli workers use of a separate slicer and a separate deli case for RTE products that support
the growth of L. monocytogenes versus those RTE products that do not. Lower Env Cont Reduce transfer of L. monocytogenes among RTE products, FCSs, and NFCs (i.e., reduced transfer
coefficients by 50%) in the retail deli. Do Not Slice On Gloves Retail deli workers collect the slices of RTE products directly on tissue paper rather than on his or
her gloves. Scenarios: Temperature Control and Growth Inhibition
Temp = 5°C Set the retail deli case temperature for all retail delis to 5°C (41°F) (i.e., in compliance with the 2009 FDA Food Code) rather than utilizing real-world deli case temperatures reported by Ecosure.
No Growth (T = -5°C) Set all retail deli case temperatures to -5°C (23°F). At this temperature, no L. monocytogenes growth will occur.
Temp <= 5oC Use the retail deli case temperatures observed in the Ecosure dataset at or below 5°C (41°F). This implies that all retail delis with deli case temperatures exceeding the 2009 FDA Food Code recommendation come into compliance
Shorten time in retail deli Retail delis reduce the length of time RTE products are held before they are sold or disposed from 7 to 4 days.
All GI Reformulate all RTE products sold at the retail deli that would otherwise support L. monocytogenes growth to include growth inhibitors to restrict the growth (same growth inhibitor (GI) formulation as cured ham with GI).
No GI Reformulate all RTE products that support L. monocytogenes growth that are sold at the retail deli to not include GI to restrict L. monocytogenes growth.

Draft Technical Report 5/1/2013
ix
Table of Contents
Acknowledgements ....................................................................................................................................... ii
List of Abbreviations .................................................................................................................................... v
List of Abbreviations for Baselines and Mitigations .................................................................................. vii
Table of Contents ......................................................................................................................................... ix
List of Figures .............................................................................................................................................. xi
List of Tables .............................................................................................................................................. xv
Executive Summary ...................................................................................................................................... 1
1. Background ........................................................................................................................................... 5
2. Process for Conducting This Risk Assessment ................................................................................... 10
2.1. Partnership .................................................................................................................................. 10
2.2. Ensuring public participation in the process ............................................................................... 10
2.3. Collaboration with academia ...................................................................................................... 11
2.4. Scientific input and peer review .................................................................................................. 12
3. Scope and Objectives / Risk Management Questions ......................................................................... 14
3.1. Charge for the Interagency Risk Assessment and Risk Management questions ......................... 14
3.2. Scope and objectives of the risk assessment ............................................................................... 15
4. Conceptual Model and Framework ..................................................................................................... 17
4.1. A discrete-event simulation to track L. monocytogenes in the retail environment ..................... 17
4.2. Overview of the “virtual deli,” its operation and the impact on L. monocytogenes ................... 21
4.3. Considering model variability and uncertainty ........................................................................... 25
5. Data Collection ................................................................................................................................... 28
6. Comprehensive Description of the Risk Assessment Model .............................................................. 29
6.1. Modeling the basic processes for L. monocytogenes .................................................................. 29
6.2. Objects in the model ................................................................................................................... 44
6.3. Events in the model ..................................................................................................................... 46
6.4. From the retail deli to foodborne illness ..................................................................................... 54
6.5. Additional baseline inputs ........................................................................................................... 60
6.6. Implementation ........................................................................................................................... 64
6.7. Studying the model ..................................................................................................................... 65
7. Risk Assessment Results and Discussion ........................................................................................... 68
7.1. Risk management questions and model approaches ................................................................... 68

Draft Technical Report 5/1/2013
x
7.2. Baseline analysis ......................................................................................................................... 73
7.3. Responses to risk management questions ................................................................................. 101
7.4. Verification ............................................................................................................................... 121
8. Summary of Risk Assessment Results .............................................................................................. 126
8.1. Predictions of Absolute Risk ..................................................................................................... 126
8.2. Evaluation of the Impact of Differences in Baseline Conditions .............................................. 127
8.3. Scenario Analysis ...................................................................................................................... 129
9. Conclusions ....................................................................................................................................... 135
References ................................................................................................................................................. 137
Appendix 1: The Secondary Growth Model ............................................................................................. 149
Appendix 2: Consumption Data ................................................................................................................ 154
Draft Technical Report 5/1/2013
xi
List of Figures
Figure 1: Percentage of RTE meat and poultry products testing positive for L. monocytogenes in FSIS inspected
facilities compared to the incidence of listeriosis per 100,000 from CDC FoodNet surveillance. ....................... 7
Figure 2: Illustration of the discrete event cross contamination model component of the Interagency Risk
Assessment - L. monocytogenes in Retail Delicatessens. ................................................................................... 19
Figure 3: Illustration of stochastic decision tree within the discrete event model of the Interagency Risk Assessment
- L. monocytogenes in Retail Delicatessens. ....................................................................................................... 20
Figure 4: Diagram of “virtual deli” and cross contamination routes within the model of the Interagency Risk
Assessment - L. monocytogenes in Retail Delicatessens. ................................................................................... 22
Figure 5: Illustration of developed time-series based on variability within and among retail delis and uncertainty of
existence and location of niches within the retail deli. ....................................................................................... 27
Figure 6: The slicer model ........................................................................................................................................... 33
Figure 7: Illustration of the scooping model. ............................................................................................................... 35
Figure 8: The “tri linear” primary growth model and its parameters. .......................................................................... 37
Figure 9: Simulation of customer serving times .......................................................................................................... 51
Figure 10: Illustration of the Monte Carlo Markov Chain used to simulate the temperature changes in retail deli
cases. ................................................................................................................................................................... 54
Figure 11: Distribution of serving size for deli salad (black), deli meat (blue) and deli cheese (red) for the total
population ........................................................................................................................................................... 58
Figure 12: Empirical cumulative distribution of the size of RTE food serving in a retail deli .................................... 61
Figure 13: General scheme of simulations .................................................................................................................. 65
Figure 14: Structure of the L. monocytogenes transfer matrix in the model of the Interagency Risk Assessment -
L. monocytogenes in Retail Delicatessens. ......................................................................................................... 67
Figure 15. Sensitivity analysis for niches and contaminated RTE product. ................................................................ 74
Figure 16: Effect of various sanitation mitigation scenarios on the mean risk per serving and relative risk in the
susceptible population in a retail deli with multiple niches ................................................................................ 78
Figure 17: Effect of various sanitation mitigation scenarios on the prevalence and relative prevalence of
L. monocytogenes contaminated RTE products in a retail deli with multiple niches .......................................... 78
Figure 18: Effect of various growth mitigation scenarios on the mean risk per serving and relative risk in the
susceptible population in a retail deli with multiple niches ................................................................................ 79
Figure 19: Effect of various growth mitigation scenarios on the prevalence and relative prevalence of
L. monocytogenes contaminated RTE products in a retail deli with multiple niches .......................................... 79
Figure 20: Total L. monocytogenes cfu grown, inactivated, and transferred between pairs of sites for a baseline retail
deli with multiple niches (log10 scale). White squares indicate transfers that are not considered in the model or
that are not meaningful. ...................................................................................................................................... 80

Draft Technical Report 5/1/2013
xii
Figure 21: L. monocytogenes cfu transferred per actual contact between each pair of sites for a baseline retail deli
with multiple niches (log10 scale). White squares indicate transfers that are not considered in the model or that
are not meaningful. ............................................................................................................................................. 81
Figure 22: Contamination time analysis for sites in baseline retail deli with multiple contaminated niches. Upper
graph: fraction of time each site is contaminated during a baseline simulation. Bottom graph: mean number of
events a site stay contaminated. .......................................................................................................................... 82
Figure 23. Timeline illustration of sales, cross contamination, and subsequent risk of listeriosis............................... 85
Figure 24: Effect of various sanitation mitigation scenarios on the mean risk per serving and relative risk in the
susceptible population for sanitation mitigations in a retail deli without any niches .......................................... 87
Figure 25: Effect of various sanitation mitigation scenarios on the prevalence and relative prevalence of
L. monocytogenes contaminated RTE products for sanitation mitigations in a retail deli without any niches ... 87
Figure 26: Effect of various growth mitigation scenarios on the mean risk per serving and relative risk in the
susceptible population for growth mitigations in a retail deli without any niches .............................................. 88
Figure 27: Effect of various growth mitigation scenarios on the prevalence and relative prevalence of
L. monocytogenes contaminated RTE products in a retail deli without any niches ............................................ 88
Figure 28: Risk comparisons between niche retail deli and retail deli without any niches .......................................... 89
Figure 29: Effect of various sanitation mitigation scenarios on the mean risk per serving and relative risk in the
susceptible population for sanitation mitigations for retail delis with an incoming contaminated RTE product
that supports growth ............................................................................................................................................ 90
Figure 30: Effect of various sanitation mitigation scenarios on the prevalence and relative prevalence of
L. monocytogenes contaminated RTE products for retail delis with an incoming contaminated RTE product
that supports growth ............................................................................................................................................ 90
Figure 31: Effect of various growth mitigation scenarios on the mean risk per serving and relative risk in the
susceptible population for retail delis with an incoming contaminated RTE product that supports growth ....... 91
Figure 32: Effect of various growth mitigation scenarios on the prevalence and relative prevalence of
L. monocytogenes contaminated RTE products for retail delis with an incoming contaminated RTE product
that supports growth ............................................................................................................................................ 91
Figure 33: Risk comparison for niche retail deli versus retail deli with incoming RTE product that supports growth
............................................................................................................................................................................ 92
Figure 34: Effect of various sanitation mitigation scenarios on the mean risk per serving and relative risk in the
susceptible population for sanitation mitigations for retail delis with an incoming contaminated RTE product
that does not support growth ............................................................................................................................... 95
Figure 35: Effect of various sanitation mitigation scenarios on the prevalence and relative prevalence of
L. monocytogenes contaminated RTE products for sanitation mitigations for retail delis with an incoming
contaminated RTE product that does not support growth ................................................................................... 95
Draft Technical Report 5/1/2013
xiii
Figure 36: Effect of various growth mitigation scenarios on the mean risk per serving and relative risk in the
susceptible population for retail delis with an incoming contaminated RTE product that does not support
growth ................................................................................................................................................................. 96
Figure 37: Effect of various growth mitigation scenarios on the prevalence and relative prevalence of
L. monocytogenes contaminated RTE products for retail delis with an incoming contaminated RTE product
that does not support growth ............................................................................................................................... 96
Figure 38: Risk comparison for niche retail deli versus a retail deli with incoming product that does not support
growth ................................................................................................................................................................. 97
Figure 39: Risk comparison for niche retail deli versus retail deli with incoming RTE product that does not support
growth versus one that does support growth ....................................................................................................... 97
Figure 40. Effect of various sanitation mitigation scenarios on the mean risk per serving and relative risk in the
susceptible population for sanitation mitigations for retail deli with temperature control. ................................. 98
Figure 41. Effect of various sanitation mitigation scenarios on the prevalence and relative prevalence of
L. monocytogenes contaminated RTE products for sanitation mitigations for retail deli with temperature
control. ................................................................................................................................................................ 98
Figure 42. Effect of various growth mitigation scenarios on the mean risk per serving and relative risk in the
susceptible population for retail deli with temperature control. .......................................................................... 99
Figure 43. Effect of various growth mitigation scenarios on the prevalence and relative prevalence of
L. monocytogenes contaminated RTE products for retail deli with temperature control. ................................... 99
Figure 44. Effect of various sanitation mitigation scenarios on the mean risk per serving and relative risk in the
susceptible population for sanitation mitigations for retail deli with multiple niches and with temperature
control. .............................................................................................................................................................. 100
Figure 45. Effect of various sanitation mitigation scenarios on the prevalence and relative prevalence of
L. monocytogenes contaminated RTE products for sanitation mitigations for retail deli with multiple niches and
with temperature control. .................................................................................................................................. 100
Figure 46. Effect of various growth mitigation scenarios on the mean risk per serving and relative risk in the
susceptible population for retail deli with temperature control. ........................................................................ 101
Figure 47. Effect of various growth mitigation scenarios on the prevalence and relative prevalence of
L. monocytogenes contaminated RTE products for retail deli with temperature control. ................................. 101
Figure 48: Relative risk comparison for sanitation options ....................................................................................... 102
Figure 49: Relative risk comparison for glove use. ................................................................................................... 104
Figure 50: Relative risk comparison for treating NFCS as FCS ................................................................................ 105
Figure 51: Relative risk comparison for transfer coefficients .................................................................................... 107
Figure 52: Relative risk comparison for contact between gloves and case handle .................................................... 109
Figure 53: Relative risk comparison for reducing incoming level ............................................................................. 110
Figure 54: Relative risk comparison for preslicing .................................................................................................... 111
Figure 55: Relative risk comparison for separate slicers and cases ........................................................................... 113

Draft Technical Report 5/1/2013
xiv
Figure 56: Relative risk comparison for not slicing onto gloves ............................................................................... 115
Figure 57: Relative risk comparison for fixed temperature control ........................................................................... 116
Figure 58: Relative risk comparison for temperature control .................................................................................... 117
Figure 59: Relative risk comparison for shortening the time a RTE product can be used in a retail deli department
.......................................................................................................................................................................... 119
Figure 60: Relative risk comparison for growth inhibitor use ................................................................................... 120
Figure 61. Incoming and outgoing bacteria in the L. monocytogenes in retail model. .............................................. 122
Figure 62: Comparison of predicted model distributions with observed retail deli observations .............................. 123
Figure 63: Mock retail deli results [29]. Size and color intensity indicate amount of surrogate transferred from
source to recipient location. .............................................................................................................................. 124
Figure 64: Empirical cumulative density function of the serving size per eating occasion (unit: g/EO) for deli-meat
for the total population, the pregnant women and the seniors (55+): data NHANES 1999-2006. .................... 160
Figure 65: Empirical cumulative density function of the serving size per eating occasion (unit: g/EO) for deli-cheese
for the total population, the pregnant women and the seniors (55+): data NHANES 1999-2006 ..................... 161
Figure 66: Empirical cumulative density function of the serving size per eating occasion (unit: g/EO) for deli-salad
for the total population, the pregnant women and the seniors (55+): data NHANES 1999-2006 ..................... 161

Draft Technical Report 5/1/2013
xv
List of Tables
Table 1: Illustration of site interactions and cross contamination while serving a customer ....................................... 23
Table 2: Growth rate (µ, h-1) and Generation Time (GT) of various RTE foods modeled in this risk assessment. ..... 41
Table 3: Distribution of the predicted growth (log10 increase) during a 7 day storage at 10°C (50°F) ........................ 42
Table 4: Sequence of events when serving deli meat or deli cheese (derived from [28]). ........................................... 49
Table 5: Sequence of events when serving deli salad (derived from [28].) ................................................................. 50
Table 6. Observed Data for Calculation of Customer Serving Time. .......................................................................... 50
Table 7: Translation of the basic events in terms of basic processes. .......................................................................... 52
Table 8: Raw storage temperature data for “Sliced Meat” (°F and °C.) ...................................................................... 53
Table 9: Parameter of the fitted ln-normal distributions .............................................................................................. 55
Table 10: Fitted Laplace distribution of the refrigerator temperature data in Fahrenheit and Celsius. ........................ 57
Table 11: Fitted distribution of time to first consumption of RTE food using RTI International data. ....................... 57
Table 12: Summary statistics of the empirical distribution of serving sizes, as simulated in the L. monocytogenes
retail model (g/eating occasions). ....................................................................................................................... 58
Table 13: Characteristics of the distribution of bacteria in contaminated chubs (2270 grams) according to the mean
of the log10 normal-Poisson distribution. ............................................................................................................ 62
Table 14: Sales and characteristics of the RTE products. ............................................................................................ 63
Table 15: Characteristics of the RTE products. ........................................................................................................... 63
Table 16: Mean (standard deviation) of the log10 of the transfer coefficients for L. monocytogenes at retail. ............ 64
Table 17: Comparison of expert elicitation to cross contamination model structure ................................................. 125
Table 18: Predicted absolute risk of invasive listeriosis per serving of ready-to-eat food sliced or prepared and sold
at retail delis. ..................................................................................................................................................... 127
Table 19: Predicted percent change in the risk of invasive listeriosis per serving of ready-to-eat food sliced or
prepared and sold at retail delis for the susceptible population according to various scenarios, as estimated by
the L. monocytogenes in retail delicatessens risk assessment model ................................................................ 133
Table 20: Food items considered as including “Deli Meat”. ..................................................................................... 155
Table 21: Food items considered as including “Deli Cheese”. .................................................................................. 157
Table 22: Food items considered as “Deli Salad”. .................................................................................................... 157

Draft Technical Report 5/1/2013
xvi

Draft Technical Report 5/1/2013
1
Draft Interagency Risk Assessment - Listeria monocytogenes in Retail Delicatessens
Executive Summary
The Draft Interagency Risk Assessment - Listeria monocytogenes in Retail Delicatessens provides a
scientific assessment of the risk of foodborne illness associated with consumption of ready-to-eat (RTE)
foods commonly prepared and sold in the delicatessen (deli) of a retail food store and examines how that
risk may be impacted by changes to common or recommended practices. This quantitative risk
assessment (QRA) was conducted collaboratively by the Department of Health and Human Service
(DHHS), Food and Drug Administration’s Center for Food Safety and Applied Nutrition (FDA/CFSAN),
and United States Department of Agriculture’s (USDA) Food Safety and Inspection Service (FSIS), in
consultation with the DHHS Centers for Disease Control and Prevention (CDC) and input from industry,
academic institutions, and consumer advocacy group stakeholders. The White House Food Safety Work
Group identified this risk assessment as a priority. It provides information useful to those responsible for
implementing policies, programs and practices that target the prevention of listeriosis in the population.
Background
Listeria monocytogenes (L. monocytogenes) is a food safety concern, and control of this pathogen has
long been an objective of the public health community. The CDC has estimated that L. monocytogenes
causes approximately 1,600 illnesses, 1,500 hospitalizations, and 260 deaths annually. When compared
with other major foodborne diseases, listeriosis is a rare occurrence, but the fatality rate is very high (i.e.,
approximately 16%, compared with 0.5% for either Salmonella or Escherichia coli O157:H7).
Cross contamination in the deli environment is thought to contribute to L. monocytogenes contamination
of RTE foods, but little is known about the transfer of this pathogen in the retail setting.
L. monocytogenes is present in the environment and can survive and grow in foods held at ambient and
refrigeration temperatures. Therefore, adequate preventive controls must take into account contamination
as well as survival and proliferation of the organism. L. monocytogenes can contaminate foods via cross
contamination from one product to another or through contamination from the environment, or both.

Draft Technical Report 5/1/2013
2
Overview of Risk Assessment
The QRA simulates the retail deli environment and evaluates how various sanitary and food handling
practices may influence the U.S. risk of listeriosis associated with consuming RTE foods that are sliced,
prepared or packaged in retail grocery delis. The model is unique in its ability to quantitatively link
activities within a retail deli directly to predicted public health outcomes. The model simulates the
L. monocytogenes concentration and prevalence in products sold to customers, predicts changes in
concentrations during customer home storage, and finally estimates the risk of listeriosis from
consumption of these products in the home. The population was divided in two subpopulations for
purpose of this risk assessment: (1) the population with increased susceptibility (including neonates, older
adults, and the immunocompromised) and (2) the remaining population (i.e. referred to as the general
population).
Risk Management Questions
The questions initially posed to the Interagency Retail L. monocytogenes Risk Assessment Workgroup
were:
1. What is the exposure to L. monocytogenes from consuming RTE foods prepared in retail
delis?
2. What are the key processes that increase contamination of RTE foods at retail delis?
3. How much is the relative risk per serving reduced according to specific risk management
options?
The above questions are very broad in nature and were further refined to a list of risk mitigations
evaluated through scenario analyses within this risk assessment. Some of the specific ‘what if’ scenarios
were generated by FSIS and FDA risk managers while others were provided by stakeholders. Examples
include:
• What impact does improved compliance with the cold holding and storage duration
requirements found in the FDA Food Code have on the predicted listeriosis risk?
• What impact does improved compliance with food contact surface sanitation have on the
predicted listeriosis risk?
• What impact does using dedicated slicers for specific products have on the predicted
listeriosis risk?
• What impact does reducing the presence and level of L. monocytogenes on incoming RTE
foods have on the predicted listeriosis risk?

Draft Technical Report 5/1/2013
3
Key Findings of the Risk Assessment
The key findings from this assessment of risk of listeriosis associated with RTE foods prepared and
served in retail deli operations include:
• Control Growth. Employing practices that prevent bacterial growth dramatically reduced the
predicted risk of listeriosis, as observed in other L. monocytogenes risk assessments. The use of
growth inhibitors for suitable products prevents growth of L. monocytogenes in RTE foods both
at retail and during consumer home storage, leading to an overall dramatic reduction in the
predicted risk of listeriosis (ca. 95%). The strict control of temperature during refrigerated storage
in retail delis did reduce the predicted risk. The impact of this control is nevertheless lower as it
reduces growth only during this specific storage (5-20% reduction according to the baseline and
the scenario).
• Control Cross Contamination. Cross contamination of L. monocytogenes in the retail
environment dramatically increases the predicted risk of listeriosis. Cross contamination during
the routine operation of the retail deli is not amenable to a simple solution.
• Control Contamination at its Source. Increasing the concentration and transfers of
L. monocytogenes from incoming products, the environment, or niches directly increases the
predicted risk of illness. Increasing L. monocytogenes concentration in incoming product
increased the predicted risk of listeriosis whether or not the contaminated RTE product itself
supported growth. The increase in predicted risk was greater when the equivalent contamination
occurred on product that supported the growth of L. monocytogenes.
• Continue Sanitation. Sanitation practices that eliminate L. monocytogenes from the deli area
food contact surfaces results in a reduction in the predicted risk of illness. Cleaning and sanitizing
food contact surfaces reduced the predicted L. monocytogenes levels in the deli area. Wearing
gloves while serving customers reduces the estimated risk of listeriosis.
• Identify Key Routes of Contamination. The slicer (for deli meats and cheeses) and the salad
utensils (for deli salads) are sources of L. monocytogenes cross contamination to RTE foods.
Control of L. monocytogenes cross contamination at these points during retail preparation and
handling of RTE foods reduced the predicted risk of listeriosis.

Draft Technical Report 5/1/2013
4
In summary, this QRA improves our understanding of L. monocytogenes in the retail deli and should
encourage improvements to retail food safety practices and mitigation strategies to further control
L. monocytogenes in RTE foods. The ‘what if’ scenarios modeled in this QRA provide insight on how
cross contamination, sanitary practices, and temperature control impact the predicted risk of listeriosis.
This QRA is based on an extensive amount of information gathered through partnerships with academia
and input from stakeholders. Additional data would be useful to further explore how more specific retail
practices and conditions (e.g., equipment design) impact the risk of listeriosis.
Draft Technical Report 5/1/2013
5
Draft Interagency Risk Assessment -
Listeria monocytogenes in Retail Delicatessens
The Interagency Risk Assessment - Listeria monocytogenes in Retail Delicatessens provides a scientific
assessment of the risk of foodborne illness associated with consumption of ready-to-eat (RTE) foods
prepared in retail delicatessens (delis) and examines how that risk may be impacted by changes to current
practices. This risk assessment was conducted collaboratively by the Department of Health and Human
Service (DHHS), Food and Drug Administration’s Center for Food Safety and Applied Nutrition
(FDA/CFSAN), and United States Department of Agriculture’s (USDA) Food Safety and Inspection
Service (FSIS), in consultation with the DHHS Centers for Disease Control and Prevention (CDC), and
input from industry, academic institutions, and consumer advocacy group stakeholders. The conduct of
this risk assessment was identified as a priority by the White House Food Safety Work Group [1] and will
be used to evaluate current policies, programs, and practices intended to protect public health through the
prevention of listeriosis.
1. Background
L. monocytogenes is a food safety concern, and control of this pathogen has long been an objective of the
public health community including government, academia, industry, and consumer advocacy groups. The
CDC [2] has estimated that L. monocytogenes causes approximately 1,600 illnesses, 1,500
hospitalizations, and 260 deaths annually. When compared with other major foodborne diseases,
listeriosis is a rare occurrence, but the fatality rate is very high (i.e., approximately 16% compared with
0.5% for either Salmonella or Escherichia coli O157:H7).
To prevent listeriosis in the United States, it is important to identify the foods that pose the greatest risk of
listeriosis, the most effective mitigation in controlling L. monocytogenes, and the changes in processing,
handling and/or preparation practices can improve the safety of foods associated with listeriosis. Risk
assessment provides a useful framework to integrate scientific research, data, and evaluate the public
health implications of changes in food safety practices and policies.
During the past decade, FSIS and FDA have conducted several risk assessments to guide federal policies
intended to control and prevent listeriosis in the United States. In 2003, the FDA and FSIS developed a

Draft Technical Report 5/1/2013
6
QRA to determine the relative risk of listeriosis among 23 categories of RTE foods to the total U.S.
population and 3 age-based subpopulations [3]. This 2003 risk assessment supported the findings of
epidemiological investigations of sporadic illnesses and outbreaks of listeriosis. The risk assessment
identified and quantified the factors that affect exposure to L. monocytogenes including: (1) amount and
frequency of consumption of the food; (2) frequency and levels of L. monocytogenes in the food; (3)
potential of the food to support growth of L. monocytogenes; (4) refrigerated storage temperature; and (5)
duration of refrigerated storage before consumption. This 2003 risk assessment identified several RTE
foods as having a high risk per serving, including deli meats, soft cheeses, pate, and smoked seafood. Of
these RTE foods, deli meats were estimated to account for the most – approximately 67% – of all
listeriosis cases per year in the United States [3].
Following the release of the FDA/FSIS risk assessment in 2003, FDA and CDC issued an Action Plan to
reduce the risk of L. monocytogenes, which was subsequently updated in 2008 [4]. The 2008 update
provides a list of FDA's activities within six areas: (1) develop and revise guidance for processors that
manufacture or prepare RTE foods, retail and food service, and institutional establishments; (2) develop
and deliver training and technical assistance for industry and food safety regulatory employees; (3)
enhance consumer and health care provider information and education efforts; (4) review, redirect, and
revise enforcement and regulatory strategies; (5) enhance disease surveillance and outbreak response; and
(6) coordinate research activities to refine the risk assessment, enhance preventive controls, and support
regulatory, enforcement, and educational activities. FDA's activities related to the 2008 Action Plan are
publicly available [4]. Examples of these activities include (1) two draft guidance documents issued for
public comment in 2008: a draft “Compliance Policy Guide Sec. 555.320 Listeria monocytogenes” and a
draft “Guidance for Industry: Control of Listeria monocytogenes in Refrigerated or Frozen ready-To-Eat
Foods”; (2) modification of the 2005 FDA Food Code to amend the date marking provisions and
cold-holding times and temperatures; and (3) a public health educational campaign to provide advice to
consumers on refrigerator temperatures to prevent foodborne illness, including listeriosis.
Also, in response to the findings of the 2003 FDA/FSIS risk assessment, FSIS conducted a
complementary risk assessment to evaluate which food safety interventions during the processing of RTE
meat and poultry products are most effective in preventing listeriosis [5]. This FSIS QRA revealed that
formulating RTE products with growth inhibitors and the use of post-lethality interventions was more
effective in preventing foodborne illness compared to using either of these interventions alone or testing
and sanitizing food contact surfaces (FCSs). These findings directly formed the scientific basis of FSIS’s
interim final rule for L. monocytogenes encouraging federal establishments to adopt more effective food

Draft Technical Report 5/1/2013
7
safety interventions during the production of RTE meat and poultry products (9 CFR 430, 68FR 3422;
June 6, 2003). FSIS also used these findings and those from the 2003 FDA/FSIS risk assessment to guide
its verification sampling programs whereby RTE meat and poultry processing establishments (9 CFR
430) with less effective L. monocytogenes controls are sampled more frequently [6]. These findings were
used to inform FSIS’ compliance guidance to industry [7]. Finally, to aid in implementation of the interim
final rule, FSIS provided specialized training to its inspection workforce. These policies and programs
have resulted in industry adoption of more stringent L. monocytogenes controls during the processing of
RTE meat and poultry products in the United States. Correspondingly, FSIS has observed a steady decline
in the number of L. monocytogenes positive samples from its in-plant testing programs, an indication that
interventions during processing to mitigate risks from RTE meat and poultry products were succeeding
(Figure 1).
Year
1990 1995 2000 2005 2010
L. m
onoc
ytog
enes
ALL
RTE
Test
ing
(% P
ositi
ves)
0
1
2
3
4
5
Listeriosis Incidence Per 100,000
0.0
0.1
0.2
0.3
0.4
0.5
0.6Testing PrevalenceListeriosis Incidence
Figure 1: Percentage of RTE meat and poultry products testing positive for L. monocytogenes in FSIS
inspected facilities compared to the incidence of listeriosis per 100,000 from CDC FoodNet surveillance. (Source: [8] and [9]).
Despite a decline of L. monocytogenes in RTE meat and poultry products over the past several years,
epidemiological data from the CDC have shown a steady incidence of listeriosis in the United States [10,
11] (Figure 1). Recent estimates of listeriosis incidence did not meet the Healthy People 2010 target of
0.24 cases per 100,000 population [12]. [Note: The 2020 target is 0.20 cases per 100,000 population [13].]

Draft Technical Report 5/1/2013
8
The lack of a decline in listeriosis cases in the United States despite a corresponding dramatic decline of
the percentage of RTE meat and poultry products (primary foodborne vehicles for L. monocytogenes [3])
testing positive for L. monocytogenes at producing establishments suggests contamination of RTE
products at retail or in the consumer’s home. Surveillance studies conducted by industry and academia
[14, 15] have indicated that the prevalence of L. monocytogenes is approximately seven times higher in
deli meats sliced at retail, compared to those sliced and packaged at federally inspected facilities. These
surveys also indicated higher levels of L. monocytogenes on RTE meats sliced or packaged at retail. This
difference in L. monocytogenes contamination was further quantified by an FSIS comparative risk
assessment that indicated that approximately 83% of the listeriosis cases attributed to deli meat were
associated with deli meats sliced at retail [6, 16]. An independent study by Cornell University also
showed that the majority of listeriosis cases attributed to deli meats were associated with those sliced and
packaged at retail [17].
In addition, as part of a ten-year study of the occurrence of foodborne illness risk factors in retail and
foodservice establishments, FDA collected data on food safety practices in food stores, including retail
delis, in 1998, 2003, and 2008. They looked for trends that would indicate whether practices were
improving or regressing over the ten year timeframe. The report on the 2008 data collection revealed that
for retail delis, the foodborne illness risk factor most in need of attention was “Improper Holding for Time
and Temperature” [18]. In 60% of the 98 delis visited, at least one observation was made in which food
requiring temperature control was not held at 41ºF (5ºC) or below as specified in the FDA Food Code
[18]. Similar non-compliance with temperature control of retail deli cases was suggested in a study by
Ecosure [19].
Moreover, the analysis of trends in retail practices during the 10-year study period revealed no
statistically significant change in the overall percentage of compliance with the FDA Food Code for all
risk factors combined [20]. However, a statistically significant improvement in the poor personal hygiene
risk factor was observed, including an improvement in preventing bare hand contact with RTE foods.
Despite this positive trend, in roughly 50% of the 98 delis visited in 2008, at least one employee was
observed failing to wash his or her hands at the time or in the manner recommended in the FDA Food
Code. Also, improper temperature holding is one of several factors that may contribute to an increased
risk of listeriosis [3]. Another is improper sanitation of slicers [21-23]. The extent to which these
contribute to listeriosis is not well understood.

Draft Technical Report 5/1/2013
9
Little is known about how L. monocytogenes contamination of RTE foods occurs in retail delis.
L. monocytogenes strains are regularly found and often widely distributed in retail facilities [24, 25].
Retail practices may result in either cross contamination from one RTE product to another, or through
contamination from the retail environment, or both. Retail practices may also contribute to higher levels
of L. monocytogenes on RTE foods [14, 15]. A recent QRA suggests that retail cross contamination of
RTE foods has the potential to increase the risk of listeriosis considerably, and that frequency of cross
contamination has the greatest impact on the risk [26]. In addition to cross contamination, improper
holding temperatures, and insufficient sanitary practices are all likely contributors to L. monocytogenes
contamination and growth of L. monocytogenes on RTE foods at retail [27]. Concurrently, retail food
establishments are required to comply with a number of food safety requirements that are designed to
mitigate the risk of foodborne illness (e.g., cold holding, date marking, specified methods and frequency
of cleaning surfaces). However, the extent to which these requirements and other industry best practices
mitigate to the risk of listeriosis is not well understood.
Given several studies identifying retail delis as contributing to the risk of listeriosis from RTE foods in
the United States and limited understanding of the extent to which certain retail food safety practices
mitigate these food safety risks, the White House Food Safety Work Group identified the conduct of a
food safety risk assessment as a priority to guide efforts to prevent L. monocytogenes cross contamination
at retail to protect public health30. This interagency risk assessment fulfills this White House priority
through in-depth evaluations of the extent to which certain retail food safety practices mitigate the risk of
listeriosis and identifies those practices that contribute to this risk.
30 In 2009, the Federal Food Safety Workgroup identified the conduct of this interagency risk assessment as a food safety priority involving efforts to collaborate across federal agencies, with industry and consumer groups, and with the states. This risk assessment has remained a priority as highlighted in the Federal Food Safety Work Group Progress Report (December 2011).

Draft Technical Report 5/1/2013
10
2. Process for Conducting This Risk Assessment
In the planning and conduct of this risk assessment, a unique partnering of government agencies,
academia, industry, and consumer groups was actively pursued. FSIS and FDA had four primary goals for
the conduct of this risk assessment:
1) Shared partnership between FSIS and FDA in all aspects of the development of this risk
assessment (e.g., planning, budgeting, data acquisition, model development, peer review, and
outreach);
2) Engagement of consumer groups, retail and food industry (including Consumer Federation of
America (CFA), Center for Science in the Public Interest (CSPI), American Meat Institute
Foundation (AMIF), Food Marketing Institute (FMI), Grocery Manufacturers Association
(GMA), and the Association of Food and Drug Officials (AFDO) ) from the initiation to the
completion of this risk assessment;
3) Collaboration with academia and researchers (including Cornell University, the University of
Maryland, Virginia Polytechnic Institute and State University (Virginia Tech)) to fill specific
data needs identified in analyzing the framework for this risk assessment; and
4) Scientific input and review through frequent presentations of this risk assessment model and
data analyses at scientific conferences and through a rigorous independent peer review of this
risk assessment.
2.1. Partnership
FSIS and FDA formed an interagency workgroup, shared resources, and collaborated in the development
of this retail risk assessment. The interagency workgroup met frequently; worked together to commission,
collect, and analyze data; obtain stakeholder and public input; develop and refine the risk assessment
model; co-funded the peer review of this risk assessment, and, together; developed presentations, written
communications and reports.
2.2. Ensuring public participation in the process
In June 2009, FSIS and FDA held a meeting to garner input from the public and engage stakeholders at
the onset of the development of this risk assessment. The Agencies discussed the scope and objectives of
this interagency risk assessment (74 Federal Register, Vol 74, No 109, June 9, 2009 27276-27278) and
invited public comment and submission scientific data and information project (Federal Register Notice,
Vol 74, No 12, January 21, 2009. 3617-3619; Federal Register Notice, Vol 74, No 165, August 27, 2009.
43714-3619) . Comments were received from the AMIF, the GMA, and the CSPI.

Draft Technical Report 5/1/2013
11
During the course of conducting the risk assessment, the project was presented to various stakeholders
notably the AMIF, the FMI, the GMA, the CSPI, the CFA, and the AFDO. During these meetings, the
interagency work group received recommendations and suggestions from the stakeholders that were
considered in the development of this risk assessment.
2.3. Collaboration with academia
Studies to collect data for this risk assessment were undertaken in collaboration with the University of
Maryland, Virginia Tech, and Cornell University. Trade associations, including the FMI and AMIF
contributed to the planning and conduct of some of these studies. Specific studies include:
• Retail employee behavior studies. FDA, the University of Maryland, and the Joint Institute
for Food Safety and Applied Nutrition conducted an observational study of retail deli food
handling and sanitation practices in nine retail delis in the D.C.- metro area [28]. This
time-series study of retail behaviors over the course of a day formed the basis for the sequential
“events” modeled at retail in this risk assessment. The FMI was instrumental in facilitating the
conduct of this study. Additional data from 300 retail delis in 5 states (New York, including
New-York City, Tennessee, California, Minnesota, and Rhode Island) is currently being
gathered through a follow-on study conducted through a collaborative effort between FSIS and
the CDC with Environmental Health Specialists Network (EHS-Net) state partners. This
subsequent study was cleared by the Office of Management and Budget (OMB) in December
2012 and data from this study will be used in future updates of this risk assessment.
• L. monocytogenes transmission studies. A mock deli was set up at Virginia Tech to study the
dynamics of L. monocytogenes by evaluating semi-quantitatively transfer during events and
actions as RTE deli products are prepared, sliced, and/or packaged in retail delis [29].
Additional work was funded by the National Institute of Food and Agriculture at the University
of Arkansas [30].
• L. monocytogenes Contamination in the Retail Environment
o A risk mapping of L. monocytogenes in a retail environment was developed by Cornell
University through elicitation of expert opinion to validate where L. monocytogenes
occurs in a retail facility [31];
o Cornell University also collected data on environmental L. monocytogenes
contamination in 30 retail delis in Indiana, New York, and North Carolina, during

Draft Technical Report 5/1/2013
12
pre-operational and operational activities. This study has been completed and a
manuscript is in preparation. AMIF and FMI have extended this study, in collaboration
with Purdue University, to further evaluate the effectiveness of interventions to prevent
or control L. monocytogenes in retail delis.
2.4. Scientific input and peer review
As described in OMB’s Final Information Quality Bulletin for Peer Review (Federal Register Notice, Vol
70, No 10, January 14, 2005. 2664-2677,), FDA and FSIS are committed to ensuring the quality,
objectivity, utility, and integrity of all agency disseminated scientific information. Peer review is one of
the important procedures used to ensure that the quality of published scientific information meets the
standards of the scientific and technical community. The OMB bulletin describes the peer review
requirements for influential scientific information. A scientific assessment is defined by OMB as “an
evaluation of a body of scientific or technical knowledge that typically synthesizes multiple factual
inputs, data, models, assumptions, and/or applies best professional judgment to bridge uncertainties in the
available information.”
Consistent with the OMB peer review guidelines, the draft model of the Interagency Risk Assessment -
L. monocytogenes in Retail Delicatessens - was independently peer reviewed in 2010, through an external
contract with Versar, Inc. This review focused on an evaluation of the design, logic, and mathematics of
this risk assessment. The risk assessment model was further amended and modified in response to
peer-reviewer comments and input received from the scientific community. The reports of this external
peer review, as well as the specific FSIS and FDA answers to the various comments, are publicly
available31.
This interagency risk assessment model and related analyses also were presented at technical scientific
meetings including the 2009 and 2012 Society for Risk Analysis annual meetings (December 8, 2009,
Baltimore, Maryland.; December 11, 2012, San Francisco, California), the XVIIth International
Symposium on Problems of Listeriosis (May 6, 2010, Porto, Portugal), the 2010 Conference on Modeling
31 FDA Risk Assessment website: http://www.fda.gov/ScienceResearch/SpecialTopics/PeerReviewofScientificInformationandAssessments; FSIS Risk Assessment website: http://www.fsis.usda.gov/Science/Risk_Assessments/index.asp; FSIS peer review plan for this risk assessment: http://www.fda.gov/ScienceResearch/SpecialTopics/PeerReviewofScientificInformationandAssessments/
Draft Technical Report 5/1/2013
13
for Public Health Action (Centers for Disease Control and Prevention, December 10, 2010, Atlanta,
Georgia), the 2010 and 2012 IAFP International Association for Food Protection (IAFP) annual meetings
(June 1-4, 2010, Anaheim, California; July 22-25, 2012, Providence, Rhode Island) and the 2012
Conference for Food Protection (April 13-18, 2012, Indianapolis, Indiana).
Draft Technical Report 5/1/2013
14
3. Scope and Objectives / Risk Management Questions
3.1. Charge for the Interagency Risk Assessment and Risk Management questions
Some of the essential duties of risk managers are to determine what hazards or practices present more risk
than society is willing to accept and to consider what control options are available [32]. These options
need to be effective and efficient in mitigating risks in order to determine the appropriate actions that are
feasible to implement for the assurance of food safety. To accomplish this task, several options are
usually provided in the form of questions to be modeled. The risk management questions are answered by
converting them to the model framework and the results are compared to evaluate to what extent the
proposed mitigation strategies may reduce the relative risk.
At the onset of this risk assessment, three questions important to risk managers were considered:
1. What is the exposure to L. monocytogenes from consuming RTE foods prepared in retail
facilities?
2. What are the key processes that increase RTE food contamination at retail?
3. How much is the relative risk per serving reduced when specific risk management practices
are implemented?
These broad risk management questions were further expanded to a list of proposed risk mitigations to be
evaluated (e.g., via scenario analyses) within the interagency risk assessment. Some of the questions were
generated by FDA and FSIS risk managers while others were provided by stakeholders. These include
risk management questions related to sanitation, retail behavior, and levels of L. monocytogenes on RTE
products entering retail delis for further preparation.
1) What is the public health impact of more frequent or extensive retail deli cleaning procedures than
those specified in the 2009 FDA Food Code?
2) What is the potential public health impact of increasing the use of single-service gloves in the retail
environment?
3) What if scale touch pads, refrigerator and deli case handles, and other frequently touched non-food
contact surfaces were considered food contact surfaces and were therefore required to be cleaned and
sanitized at a minimum frequency?
4) What if practices were in place so that no cross contamination occurred in delis (i.e., no additional
L. monocytogenes added to incoming RTE products)?

Draft Technical Report 5/1/2013
15
5) What if display cases were not touched with gloved or bare hands (i.e., used tissues or had automatic
door open/shut)?
6) What would be the potential public health impact if the level of L. monocytogenes contamination on
RTE foods coming into the retail deli were at higher level (cfu/gram)?32
7) What would be the potential public health impact of “pre-slicing” all RTE products vs. “slicing to
order” (hypothesis: less cross contamination occurring in the morning prior to other cross
contamination events)?
8) What would be the potential public health impact of using separate slicers and/or separate counters for
RTE products that permit growth of L. monocytogenes and for those RTE products that do not support
the growth of L. monocytogenes?
9) What would be the potential public health impact of lowering the level of environmental transfers from
environment to food?
10) What if food workers do not slice RTE products directly onto their gloved hands?
11) What is the potential public health impact of L. monocytogenes growth in retail delis?
12) What would be the potential public health impact of complete compliance to the cold holding
requirements for certain RTE foods in deli cases (i.e., 2009 FDA Food Code guidance: hold at 41°F
(5°C) or less)?
13) What would be the public health impact of shortening the time a RTE product can be used in a deli
department (i.e., before it is discarded)?
14) What would be the potential public health impact if all (or no) RTE products (e.g., deli meats and deli
salads) coming into the deli were formulated with growth inhibitors?
3.2. Scope and objectives of the risk assessment
The objective of this risk assessment is to assess the risk of foodborne illness associated with current
practices and to examine how that risk may be impacted by mitigations that may reduce or prevent
L. monocytogenes growth or contamination in RTE foods prepared in retail deli settings.
The risk assessment is designed to cover RTE foods that are: i) regulated by both FSIS and FDA; ii)
sliced, prepared, and/or packaged in the retail deli environment and consumed in the home such as deli
meats, cheeses, and deli-type salads; iii) sold in a retail deli environment, which refers to a range of retail
32 This scenario would evaluate the potential increased risk posed from an increased contamination level of L. monocytogenes in RTE foods at retail delis.

Draft Technical Report 5/1/2013
16
types, such as delicatessen departments of major and large grocery chains, supermarket facilities and
other groceries (i.e., multipurpose, independent, small or local facilities). Restricting the scope of the risk
assessment to foods that are intended to be “consumed in the home” means that restaurants or other
establishments where the RTE foods are consumed on-site were not included.
The risk assessment model simulates the retail environment and evaluates how changes in various retail
sanitary and food handling practices may influence the U.S. risk of listeriosis from consuming RTE foods
that were sliced, handed, or prepared in retail grocery delis. The model also predicts which mitigation
strategies confer the greatest benefits in reducing the risk of listeriosis. This may provide risk managers
with information needed to inform retail food safety decisions regarding the policy changes in retail
facilities and promotion of industry “best practices.”
This risk assessment could be used to refine retail food safety practices and mitigation strategies to
control L. monocytogenes in RTE foods further.

Draft Technical Report 5/1/2013
17
4. Conceptual Model and Framework
The risk assessment model is unique in its ability to quantitatively link activities and mitigations within a
retail deli directly to public health outcomes. Model inputs are the stochastic working routines of deli
workers, L. monocytogenes concentrations of incoming product, environmental contamination to food
contact sites, and cross contaminations among those sites. The model simulates the L. monocytogenes
concentrations and prevalences in products sold to customers, predicts changes in concentrations during
customer home storage, and finally estimates the risk of listeriosis from these sales. By serving as a
“virtual deli,” the model allows for quantitative assessment of listeriosis risks from activities or proposed
changes to the retail deli operation.
In order to estimate the risk per serving and the prevalence, the processes that lead to the level of bacterial
contamination when the RTE product is sold, notably cross contamination, bacterial growth, and/or
bacterial inactivation/removal in the deli-department have to be considered. A specific discrete-event
simulation model was developed for this purpose. The output of the discrete event model is a distribution
of number of L. monocytogenes per RTE product sold by the retail deli. An estimate of growth of
L. monocytogenes on RTE product includes growth during the transport from the retail deli to the home,
as well as growth during the storage in the refrigerator at home. The risk of listeriosis per serving is
eventually derived from the concentration in the RTE product at the time of consumption, the serving
size, and a dose-response model.
4.1. A discrete-event simulation to track L. monocytogenes in the retail environment
Cross contamination is defined here as the transfer of bacteria from one food compartment or site to
another. It is commonly used to describe the transfer of pathogens among different food groups and
environmental surfaces during food production. Cross contamination models affect the analysis of
exposure in the risk assessment directly. In addition to the time-temperature growth modeling common to
most risk assessments, models of cross contamination in food usually distinguish between variables or
compartments that need to be simulated and events or handling procedures that allow the bacteria to
transfer from one compartment to another [e.g., 33, 34-37]. For each compartment, the bacterial
concentrations are modeled through time. Examples of compartments for a retail environment might
include:
• different food groups with possible distinction of surface concentrations versus interior
concentrations;

Draft Technical Report 5/1/2013
18
• workers hands and clothing;
• slicers and other equipment;
• food contact surfaces, such as countertops; and
• other environmental locations (e.g., refrigerated storage areas and floors).
The compartments established for a food processing plant may be different from those established when
modeling a retail deli environment.
Events over time that cause bacteria to be transferred from one compartment to another also must be
simulated. Examples of events in the retail environment might include
• handling chubs while transferring from storage to countertop and then from countertop to slicer;
• slicing a chub;
• washing hands;
• cleaning equipment; or
• cleaning food contact surfaces.
The compartments that are impacted and the frequency of each event are part of the cross contamination
model input.
Cross contamination is important because it leads to a greater number of contaminated servings of food
leaving the retail deli. Because L. monocytogenes can grow at refrigerated temperatures, initially low
levels of contamination could grow to high levels during retail storage and consumer transport and
storage, thereby increasing the risk of illness. Cross contamination at retail has the potential to change the
final dose at consumption. Cross contamination has the potential to impact the risk to increase the level of
L. monocytogenes on foods further, resulting in a higher consumer exposure and ability to increase the
risk of foodborne illness. As a result, cross contamination is an important process to model in food safety
risk assessments. However, risk assessments that incorporate cross contamination modeling have greater
data needs and require simulating a broader number of variables than typical quantitative microbial risk
assessments.
A discrete event type model was selected as the most appropriate framework for the charge of this risk
assessment. In discrete-event simulation, the operation of a system is represented as a chronological
sequence of events. Each event occurs at an instant in time and marks a change of state in the system.
Cross contamination occurs when specific sites are brought in contact (e.g., when a chub is placed on a

Draft Technical Report 5/1/2013
19
slicer). Bacterial transfer occurs only at these discrete events. A major advantage of this framework is the
flexibility and granularity that the approach provides. Additional events can be inserted or several events
merged into one without changing the overall model. The process is illustrated in Figure 2. A major event
is selected stochastically (e.g., serving a customer or cleaning the deli area). If appropriate, this major
event can be broken down into a series of more granular activities (e.g., removing a chub from the case or
slicing a chub). This sequence of events can also be developed stochastically, as shown in Figure 3.
Each ‘YES/NO’ branch can be based on probabilities. The level of granularity can be modified as needed.
This flexibility is especially important because risk management questions may be added.
Non deli time
Serve Customer
Sporadic Clean
Contaminate from Niche
Select Major Event
Determine mass sold
New chub if needed
Remove chub from case
Unwrap chub
Wrap chub
Slice chub
Replace chub in case
Grow all sites and chubs for duration of major event
Conc to Exposure
Assessment
Figure 2: Illustration of the discrete event cross contamination model component of the Interagency Risk
Assessment - L. monocytogenes in Retail Delicatessens.

Draft Technical Report 5/1/2013
20
Non deli time
Serve Customer
Sporadic Clean
Contaminate from Niche
Select Major Event
Determine mass sold
Wash hands?
Unwrap chub
YES Reduce Lm on hands
Put on Gloves?
Touch NFCS
Transfer LmHands <-> NFCS
Touch NFCS
Transfer LmGloves <-> NFCS
New chub?
Change gloves?
YESNO
Open chub in sink
Transfer Lmchub <-> sinkYES
NO YES
NO
NO
Transfer Lmchub <-> FCS
Figure 3: Illustration of stochastic decision tree within the discrete event model of the Interagency Risk
Assessment - L. monocytogenes in Retail Delicatessens. [Note Figure 3 is only an illustrative example of a part of the time sequence of serving a RTE food to a consumer.]

Draft Technical Report 5/1/2013
21
4.2. Overview of the “virtual deli,” its operation and the impact on L. monocytogenes
A graphical depiction of the “virtual deli” model, along with possible L. monocytogenes transfer routes is
provided in Figure 4. The retail deli food worker is depicted on the lower left.
Food RTE products are shown on the left. The current model is designed for three major food categories:
deli meats, deli cheeses, and deli salads. Although not shown here, each of these food categories is broken
down into more specific types. Each of these specific RTE products has associated growth rates and
probability of being sold. Each RTE food also is tracked for age of the product. Older product is disposed
of in this model (see section 6.5.2).
Sites within each retail deli are shown on the right. Vertical arrows at a site indicate the possibility of
L. monocytogenes growth (up arrow) or removal by cleaning (down arrow). In practice, only
L. monocytogenes growth for RTE products was actually used for model scenarios. Asterisks at a site
indicate the possibility of a niche. The model is flexible in that any site may harbor a niche. Those shown
are illustrative of the multiple niche scenarios describe below. Arrows between sites, workers, and RTE
products indicate the potential cross contamination routes. RTE food servings leaving the retail deli (i.e.,
RTE products sold) are depicted in the upper left.
The risk assessment model is flexible in that it readily allows the addition of new RTE products, sites, or
transfer routes. For example, this risk assessment model currently includes a floor as one of the sites, but
no transfer of L. monocytogenes route exists from the floor to RTE food based on an retail deli
observational study [28]. However, such a site, event, and transfer could be readily added to this flexible
risk assessment model.

Draft Technical Report 5/1/2013
22
Figure 4: Diagram of “virtual deli” and cross contamination routes within the model of the Interagency Risk
Assessment - L. monocytogenes in Retail Delicatessens.
The diagram in Figure 4 appears complicated with a large number of cross contamination routes.
However, the discrete event model framework considers a limited number of site interactions at any time,
over a long period. Table 1 depicts this scenario for a “serving a customer” event. At the beginning of the
event, the L. monocytogenes concentrations for each site and chub are known. The first activity is to wipe
down the slicer, which reduces the concentration of L. monocytogenes at that site (note the down arrow).
The next activity is for the worker to wash his hands and put on gloves. This reduces the concentration on
the worker’s hands and adds a new location (glove) to track. The third activity is to get the chub from the
case. This brings in contact the worker’s gloves and the case handle with subsequent potential cross
contamination between worker’s gloves and the case handle. The fourth activity is to slice the chub. This
allows cross contamination among the worker’s gloves, slicer, chub, and future serving. The fifth action is
to weigh the serving and touch the scale. Cross contamination can occur between the worker’s gloves and

Draft Technical Report 5/1/2013
23
the scale. Finally, the chub is placed back in the case, with a contact between the gloves and the case. At
each stage, the number of sites involved and level of contamination being updated is small, but the
cumulative effect is a mechanistic model of cross contamination over time in a retail environment.
Table 1: Illustration of site interactions and cross contamination while serving a customer
Example: Serve Customer Event.
1. Wipe Slicer.
Removes some bacteria from the slicer.

Draft Technical Report 5/1/2013
24
2. Wash hands and change gloves.
Removes some bacteria from hands.
3. Open case, remove chub, and close case.
Cross contamination between gloves and case.
4. Slice on gloves.
Cross contamination among gloves, slicer, and
chub.
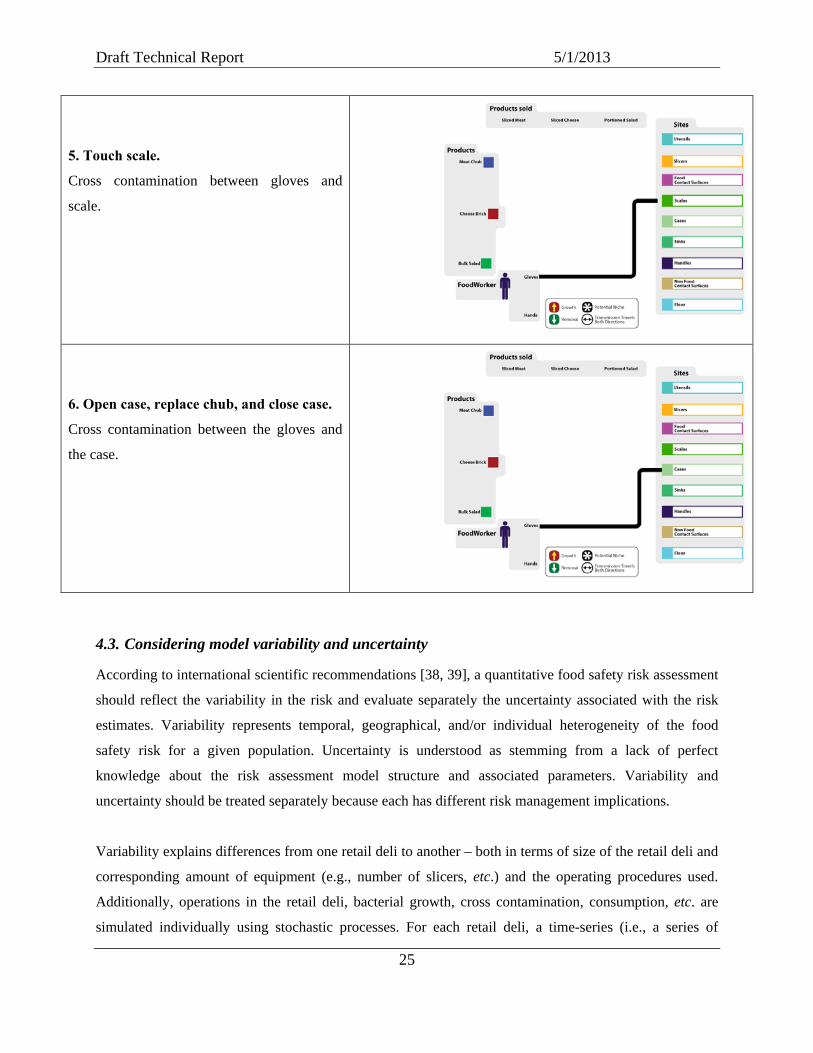
Draft Technical Report 5/1/2013
25
5. Touch scale.
Cross contamination between gloves and
scale.
6. Open case, replace chub, and close case.
Cross contamination between the gloves and
the case.
4.3. Considering model variability and uncertainty
According to international scientific recommendations [38, 39], a quantitative food safety risk assessment
should reflect the variability in the risk and evaluate separately the uncertainty associated with the risk
estimates. Variability represents temporal, geographical, and/or individual heterogeneity of the food
safety risk for a given population. Uncertainty is understood as stemming from a lack of perfect
knowledge about the risk assessment model structure and associated parameters. Variability and
uncertainty should be treated separately because each has different risk management implications.
Variability explains differences from one retail deli to another – both in terms of size of the retail deli and
corresponding amount of equipment (e.g., number of slicers, etc.) and the operating procedures used.
Additionally, operations in the retail deli, bacterial growth, cross contamination, consumption, etc. are
simulated individually using stochastic processes. For each retail deli, a time-series (i.e., a series of

Draft Technical Report 5/1/2013
26
L. monocytogenes concentrations at each location within the retail deli and for all servings sold
chronologically) is developed. The time series includes a sufficiently large number of servings to evaluate
specific operating practices (i.e., the statistics of the time series have stabilized).
The model is written as a full second order Monte Carlo model that distinguishes variability from
uncertainty [40] (Figure 5). It was assumed that the uncertainty surrounding the existence and the
“behavior” of the niches overwhelmed the other sources of uncertainty. It was thus decided to illustrate
this uncertainty through the comparison of various baselines (e.g., by comparing the various scenarios
within a retail deli with multiple niches versus within a retail deli without niches) (see section 7).
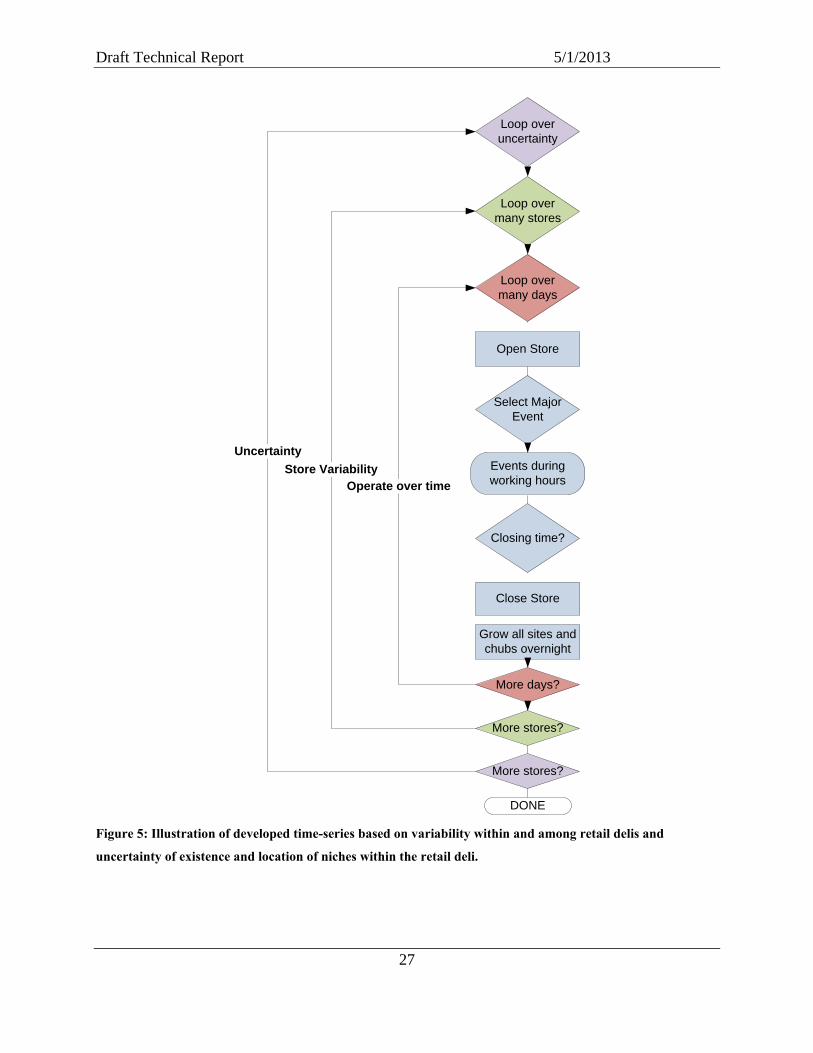
Draft Technical Report 5/1/2013
27
Loop over many stores
Loop over many days
Open Store
Close Store
Grow all sites and chubs overnight
Select Major Event
Closing time?
Operate over time
More stores?
More days?
Store Variability
DONE
Loop over uncertainty
More stores?
UncertaintyEvents during working hours
Figure 5: Illustration of developed time-series based on variability within and among retail delis and
uncertainty of existence and location of niches within the retail deli.

Draft Technical Report 5/1/2013
28
5. Data Collection
The Interagency Retail L. monocytogenes Risk Assessment Workgroup commissioned a number of
studies to fill specific data needs for the conduct of this risk assessment. These studies were listed in
Section 2.3 and include: retail worker behavior data (University of Maryland and CDC/EHS-Net studies);
environmental sources of L. monocytogenes in retail delis (Cornell University); and simulation of the
transmission of L. monocytogenes in mock retail delis (Virginia Tech).
In addition, the Interagency Retail L. monocytogenes Risk Assessment Workgroup conducted a
systematic review of the literature regarding the various domains covered by the considered model. This
systematic review included scientific literature on bacterial transfer (including during the slicing process),
bacterial growth, bacterial inactivation through cleaning and disinfection, retail data, and consumer
handling of food. The group synthesized the available scientific evidence to derive probability
distributions and mathematical models.
For that purpose, the relevant peer-reviewed scientific literature was identified using the National Center
for Biotechnology Information (NCBI) PubMed database, cross references in related published
manuscripts, and auxiliary data sources such as the Google® search engine. Literature searches for
transfer coefficients (including those specific to slicers) and for cleaning and sanitizing were performed in
June 2009 and December 2010, respectively. Initial queries for transfer coefficients were run in the NCBI
PubMed database using the terms ‘cross contamination’, ‘transfer,’ and ‘bacteria,’ followed by
identification of additional manuscripts through cross-referencing in the studies identified in the initial
query. For studies of cleaning and sanitization, the NCBI PubMed database and Google were searched
using 23 relevant keywords, screening all NCBI PubMed results and the first 15 pages in the Google®
database for each query. This meta-analysis of available data was published as a scientific paper in the
International Journal of Food Microbiology [37]. The probability distributions and mathematical models
derived within this study were used to predict L. monocytogenes cross contamination and inactivation in
the current model.
Other in-house data collection and meta-analyses were developed in the framework of this study. These
meta-analyses included studies on bacterial growth, including the presence of growth inhibitors,
consumption data, temperature data, dose-response models, etc. The results are provided within this
report in the corresponding sections or as appendixes.

Draft Technical Report 5/1/2013
29
6. Comprehensive Description of the Risk Assessment Model
6.1. Modeling the basic processes for L. monocytogenes
Within an exposure assessment, Nauta [41, 42] suggests describing and modeling the RTE product
pathway as a succession of “basic processes” impacting the prevalence and level of bacteria in the RTE
product. The basic processes are the six fundamental events that may affect the prevalence and/or level of
any microbial hazard in food process. The basic processes used in the current model are namely:
- cross contamination: a transmission of bacteria from one unit (object or food) to another one. The
terms “cross contamination” and “transfer will be used interchangeably;”
- bacterial growth: the multiplication of microorganisms (or growth of the population); this basic
process is a typical characteristic of quantitative microbial risk assessment;
- bacterial inactivation: sanitation process is frequently an applied food safety and food
preservation strategy. The chemical inactivation and physical removal of bacteria via washing
and wiping, as well as the removal of bacteria via the disposal of contaminated objects (e.g.,
putting gloves in the trash) are included in this basic process within this risk assessment;
- partitioning occurs when a large unit is split into several units.
In the current model, bacterial growth may occur in food all along the RTE product pathway, from entry
into the deli through to consumption. Bacterial inactivation occurs during sanitizing, washing, and
wiping. Partitioning will be encountered during the slicing of cheese and deli-meat, as well as during the
scooping of salad from a bulk container. Eventually, transfer of bacteria from the environment, i.e., cross
contamination, occurs in the deli.
This section describes the general rules, models and data used to model these basic processes. The
transfer of bacteria is a transfer of a finite number of cells. As a consequence, the number of bacteria per
site / food / niche is considered, and not the concentration of bacteria. In other words, bacteria are tracked
as colony forming units (cfu) at a location, not as a representative mass or area based concentration.
6.1.1 Cross contamination
In this report, the definition of cross contamination is enlarged to include any transfer of bacteria from
one site, food or niche to another.

Draft Technical Report 5/1/2013
30
Cross contamination between two objects
The probabilistic derivation of the model is as follow [37]: given N1, the initial number of bacteria on a
given object (#1), and N2 the initial number of bacteria on another object (#2). T12 is the transfer
coefficient (0 ≤ T12 ≤ 1) from the object #1 to the object #2 and T21 is the transfer coefficient (0 ≤ T21 ≤ 1)
from the object #2 to the object #1. F1, the final number of bacteria on the object #1, and F2 the final
number of bacteria on the object #2 are derived stochastically using the following algorithm:
x11 ~ binomial(N1, 1 - T12)
x21 ~ binomial(N2, T21)
F1 = x11 + x21
F2 = N1 + N2 – (x11 + x21)
The underlying assumptions for this model are:
1) the two populations N1 and N2 “act” independently;
2) within each population (N1 and N2), each bacterium “acts” independently (i.e., the probability of
transfer for all bacteria from one object to the other is equal and constant for a given cross
contamination). Using a binomial process assumes that the result is the sum of N1 independent
Bernoulli assays;
3) no bacteria are lost during the transfer; and
4) the transfer coefficients T12 and T21 are independent of the initial number of bacteria.
Various transfer models have been developed and used in the literature [5, 33-35, 43-49]. In most, the
independence of transfer (i.e., assumption #2) is assumed. The most discussed assumption is linked to the
independence of the transfer coefficient and the initial number of bacteria (i.e., assumption #4). Montville
and Schaffner [50] and Fravalo et al. [51] suggest that the transfer from contaminated objects is inversely
related to the initial load. Rodriguez et al. [52] did not confirm this observation. Eventually, Nauta [53]
shows that the observation of a relationship between the transfer rate and the initial level of contamination
can be explained by an artifact linked to the limit of detection. He concludes that “so far there is no
evidence that bacterial transfer rates are inversely related to the initial level of contamination,” and this
assumption is used in the model.
Transfer coefficients were thus considered as independent of the number of bacteria, while variable from
transfer to transfer. A complete literature review was performed [37] to develop the distribution of

Draft Technical Report 5/1/2013
31
transfer coefficient for various source – recipient couples (e.g., Stainless steel - Meat). The log1033 normal
distribution was eventually chosen on the basis of published data, and our assays ability to reflect the
variability of transfer coefficients for a given source – recipient couple. Given MTij (i.e., the mean of the
log10 of transfer coefficient from the object i to the object j) and STij (i.e., its standard deviation), a transfer
coefficient Tij is sampled for each new transfer using:
log10(Tij) ~ Normal(MTij, STij).
If the sampled value leads to Tij > 1, Tij is set to 1 (and thus all bacteria are transferred).
Cross contamination between more than two objects
The model can be extended to transfers between k objects [37]. Let Ni equal the initial number of bacteria
on object i before transfer, and Nj equal the initial number of bacteria on object j before transfer, with i,j ∈
[1, k]. Following the same notation and rational as above,
( )
−∏
≠∈ ijKjijiii TNx
,
1,binomial~
with K = (1, .., k), and xij, the number of bacteria transferred to object j from object i is distributed as
−∑
≠∈
≠≠
ijKjij
ijijiiiijij T
TxNx
,
,, ,lmultinomia~
.
For the same reasons as above, Fi, the final number of bacteria on object i after transfer equals:
.
Cross contamination during the slicing process
Slicing is a complex process in terms of bacterial transfer [54]. The objective here was to derive a model
that could mimic the cross contamination linked to the use of a slicer in retail and that could be in
accordance with the studies developed on the subject [21-23, 54-58]. Modeling the slicing process may
indeed be challenging: “The following are the factors that can impact the transfer of L. monocytogenes:
(1) the compositions of deli meat (moisture, fat content, formulation, and so on), (2) the cut surface
characteristics (texture, homogeneity) of deli meat, (3) the rotational speed or revolutions per minute
(rpm) of the cutting blade, (4) the diameter of the blade, (5) the sharpness (or profiles) and material of the
33 Note: in this document, ln is the logarithm of base e (natural logarithm) and log10 is the logarithm of base 10.
∑=
=k
jjii xF
1

Draft Technical Report 5/1/2013
32
blade, (6) the back pressure from meat loaf (weight force exerted to contact blade surface by gravity
and/or the end weight attachment), (7) the slicing speed (for example, slices per minute), (8) the contact
angle, area, and slice thickness, (9) the microorganism (age, strain, inoculum size, capability to adapt
different stresses, adhesion to surfaces, and so on), and (10) the environmental condition (for example,
temperature and so on).” [58].
The experimental assays provided in the literature are not sufficient to model the impact of all these
covariates. The models that are developed in the literature are empirical and cannot be used in a stochastic
discrete event model. A general compartmental model that is in accordance with the literature
observations had to be derived instead.
The model considers two parts for the chub (both meat and cheese):
- the head of the chub (HC), contaminated by the blade during the slicing process,
- the remainder of the chub (named here “core of the chub” CC), which may be contaminated due
to introduction of L. monocytogenes at the manufacturing stage or due to cross contamination
after opening.
The bacteria that are involved in the system have three origins:
- the contamination of the core of the chub;
- the contamination of the head of chub;
- the contamination of the slicer.
The following simulation process is used:
1. Given CC0, the number of bacteria in/on the core of the chub of mass M0, given m the mass of a
slice and assuming a homogeneous distribution of the L. monocytogenes on/in the chub, the
number of bacteria newly involved in the process is I0 ~ binomial(CC0, m/M). The remaining
number of bacteria in/on the core of the chub is then CC1 = CC0 – I0. The remaining mass of the
chub is M1 = M0 – m.
2. The number of bacteria from the chub, C0, eventually involved in the slicing process is the newly
involved number of bacteria I0 and the number of bacteria on the head of the chub HC0: C0 = I0 +
HC0.
3. During the slicing process,
• a part of these C0 bacteria are transferred to the slicer following Cs ~ binomial(C0, a),
with 0 ≤ a ≤ 0.5, a parameter. The remaining stay on what becomes the slice Cy = C0 – Cs;

Draft Technical Report 5/1/2013
33
• a part of the S0 bacteria stays on the slicer Ss ~ binomial(S0, 1 - 2a). On average, half of
the bacteria transferred from the slicer are transferred to the (new) head of the chub
according to HC1 ~ binomial(S0 – Ss, 0.5), and the remaining are transferred to the slice Sy
= S0 – S1 – HC1.
• Y = Cy + Sy is the number of bacteria on the slice. S1 = Ss + Cs is the number of bacteria
on the slicer at the end of the slicing process.
The process is repeated n times to obtain n slices.
Figure 6 illustrates this model, also described in Hoelzer et al. [37]. This process is in accordance with the
experimental data that i) generally shows a log linear decrease of the number of bacteria, which
contaminates successive slices of RTE products; and ii) suggest a cross contamination between the slicer,
the chub, and the RTE product that is sold [21-23, 54-58].
Figure 6: The slicer model
(Source: [37])
CC1
CC0
CC1
StSr
C0 : Number of bacteria from chub available for transfer at time 0C0 = I0 + HC0
HC0: Number of bacteria on head of chub at time 0
HC
0
CC1: Number of bacteria in chub core at time 1 CC1 = CC0 – I0
Cr: Number of bacteria remaining on slice during slicingCr = C0 – St with St : number of bacteria transferred from slice to blade
Cr
HC1: Contamination on head of chub at time 1 (origin: slicer blade) HC1 ~ binomial(S0 – Sr,0.5)
S1
C1 : Number of bacteria on slice at time 1C1 = Cr + (S0 – Sr – HC1)
Tim
e st
ep 0
befo
re s
licin
gTr
ansi
tion
from
ste
p 0
to 1
durin
g s
licin
gTi
me
step
1af
ter f
irst s
lice
Sr : Number of bacteria (fraction of S0) remaining on slicer blade during slicingSr ~ binomial(S0, 1 - 2a)
slic
er
chub
slicechub
chub slice
slic
ersl
icer
HC
1
C0
CC0 : Number of bacteria in chub core at time 0
I0I0 : Bacteria in chub core available for transfer
I0 ~ binomial (CC0, m/M0) with m and M0 the mass of slice and core at time 0
S1: Number of bacteria on slicer blade at the end of the first slicingS1= Sr + St
C1
S0
S0 : Number of bacteria initially present on the slicer blade
St : Number of bacteria transferred from slice to slicerSt ~ binomial(C0,a) where a equals the transfer coefficient
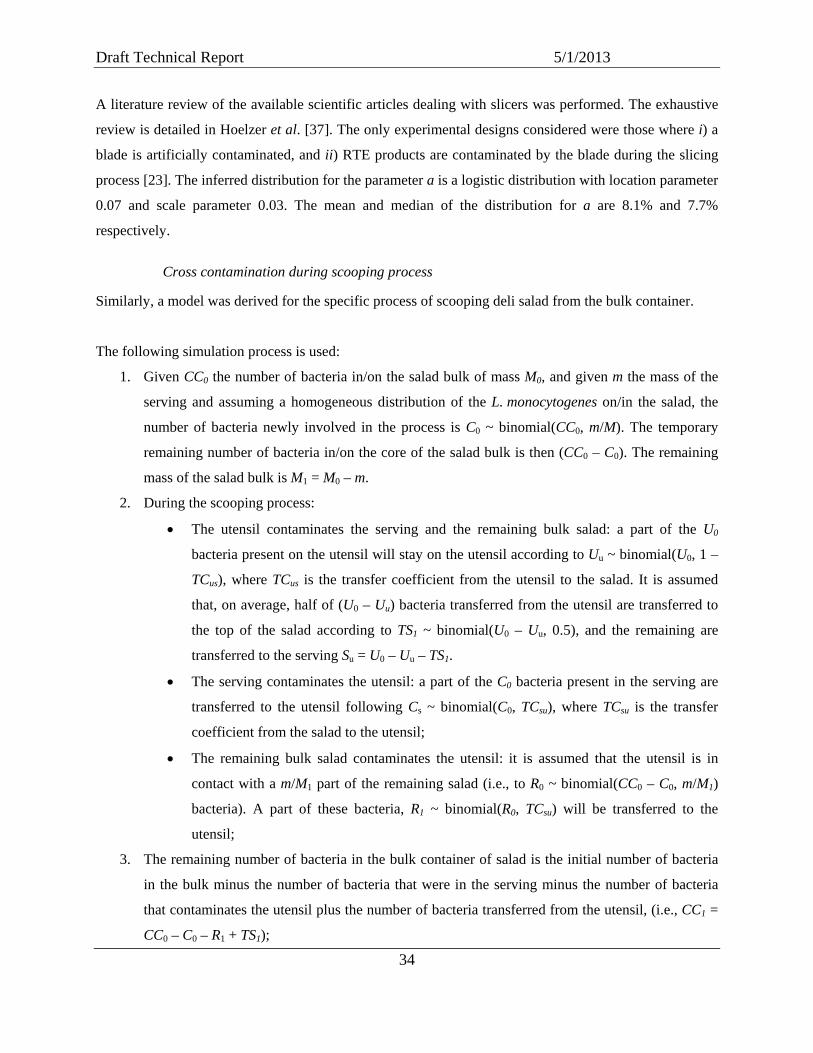
Draft Technical Report 5/1/2013
34
A literature review of the available scientific articles dealing with slicers was performed. The exhaustive
review is detailed in Hoelzer et al. [37]. The only experimental designs considered were those where i) a
blade is artificially contaminated, and ii) RTE products are contaminated by the blade during the slicing
process [23]. The inferred distribution for the parameter a is a logistic distribution with location parameter
0.07 and scale parameter 0.03. The mean and median of the distribution for a are 8.1% and 7.7%
respectively.
Cross contamination during scooping process
Similarly, a model was derived for the specific process of scooping deli salad from the bulk container.
The following simulation process is used:
1. Given CC0 the number of bacteria in/on the salad bulk of mass M0, and given m the mass of the
serving and assuming a homogeneous distribution of the L. monocytogenes on/in the salad, the
number of bacteria newly involved in the process is C0 ~ binomial(CC0, m/M). The temporary
remaining number of bacteria in/on the core of the salad bulk is then (CC0 – C0). The remaining
mass of the salad bulk is M1 = M0 – m.
2. During the scooping process:
• The utensil contaminates the serving and the remaining bulk salad: a part of the U0
bacteria present on the utensil will stay on the utensil according to Uu ~ binomial(U0, 1 –
TCus), where TCus is the transfer coefficient from the utensil to the salad. It is assumed
that, on average, half of (U0 – Uu) bacteria transferred from the utensil are transferred to
the top of the salad according to TS1 ~ binomial(U0 – Uu, 0.5), and the remaining are
transferred to the serving Su = U0 – Uu – TS1.
• The serving contaminates the utensil: a part of the C0 bacteria present in the serving are
transferred to the utensil following Cs ~ binomial(C0, TCsu), where TCsu is the transfer
coefficient from the salad to the utensil;
• The remaining bulk salad contaminates the utensil: it is assumed that the utensil is in
contact with a m/M1 part of the remaining salad (i.e., to R0 ~ binomial(CC0 – C0, m/M1)
bacteria). A part of these bacteria, R1 ~ binomial(R0, TCsu) will be transferred to the
utensil;
3. The remaining number of bacteria in the bulk container of salad is the initial number of bacteria
in the bulk minus the number of bacteria that were in the serving minus the number of bacteria
that contaminates the utensil plus the number of bacteria transferred from the utensil, (i.e., CC1 =
CC0 – C0 – R1 + TS1);
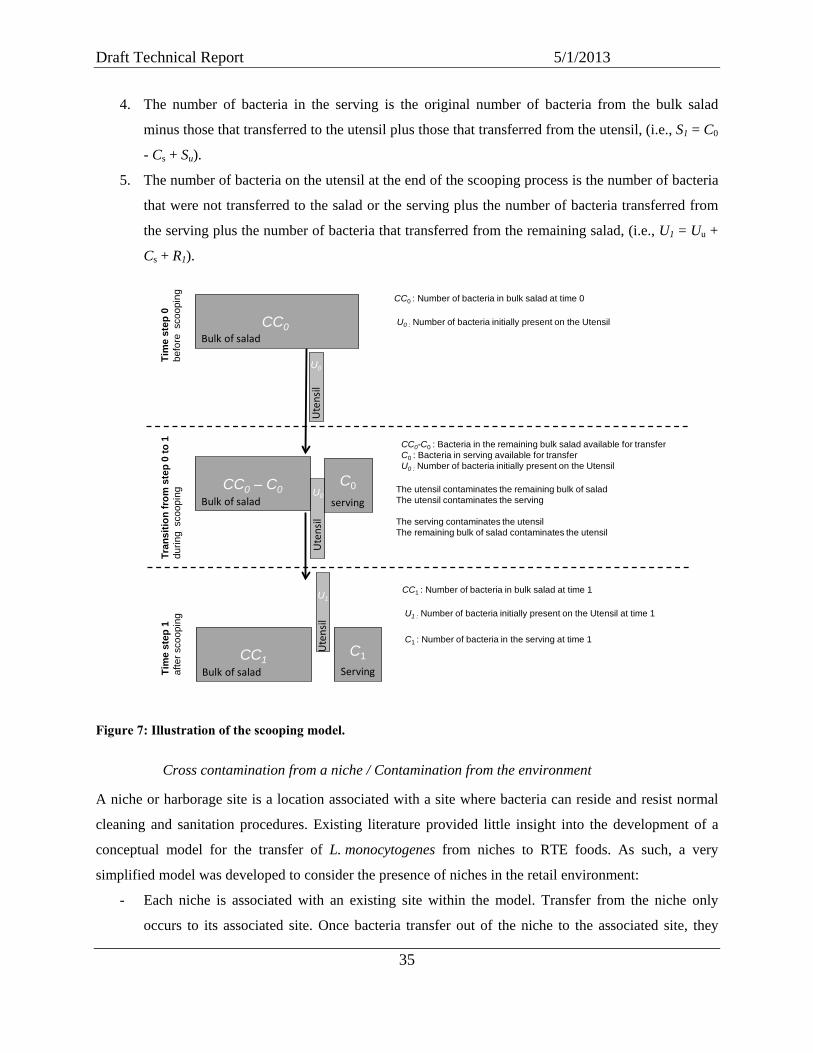
Draft Technical Report 5/1/2013
35
4. The number of bacteria in the serving is the original number of bacteria from the bulk salad
minus those that transferred to the utensil plus those that transferred from the utensil, (i.e., S1 = C0
- Cs + Su).
5. The number of bacteria on the utensil at the end of the scooping process is the number of bacteria
that were not transferred to the salad or the serving plus the number of bacteria transferred from
the serving plus the number of bacteria that transferred from the remaining salad, (i.e., U1 = Uu +
Cs + R1).
Figure 7: Illustration of the scooping model.
Cross contamination from a niche / Contamination from the environment
A niche or harborage site is a location associated with a site where bacteria can reside and resist normal
cleaning and sanitation procedures. Existing literature provided little insight into the development of a
conceptual model for the transfer of L. monocytogenes from niches to RTE foods. As such, a very
simplified model was developed to consider the presence of niches in the retail environment:
- Each niche is associated with an existing site within the model. Transfer from the niche only
occurs to its associated site. Once bacteria transfer out of the niche to the associated site, they
CC1
CC0
CC0 – C0 The utensil contaminates the remaining bulk of saladThe utensil contaminates the serving
The serving contaminates the utensilThe remaining bulk of salad contaminates the utensil
C0
C1 : Number of bacteria in the serving at time 1
Tim
e st
ep 0
befo
re s
coop
ing
Tran
sitio
n fr
om s
tep
0 to
1du
ring
sco
opin
gTi
me
step
1af
ter s
coop
ing
Ute
nsil
Bulk of salad
servingBulk of salad
Bulk of salad Serving
Ute
nsil
Ute
nsil
CC0 : Number of bacteria in bulk salad at time 0
CC0-C0 : Bacteria in the remaining bulk salad available for transferC0 : Bacteria in serving available for transferU0 : Number of bacteria initially present on the Utensil
C1
U0
U0 : Number of bacteria initially present on the Utensil
CC1 : Number of bacteria in bulk salad at time 1
U1 : Number of bacteria initially present on the Utensil at time 1
U1
U0

Draft Technical Report 5/1/2013
36
become part of the site’s bacteria count and can move to other sites through classical cross
contamination;
- The probability for a site to have a niche is specified by the user;
- From time-to-time, the niche releases a fixed number of bacteria to the site. This number is
specified by the user; and
- The occurrence of release is assumed to follow a Poisson process. The time to the next release
from the niche is then assumed to follow an exponential distribution with mean λ. λ is also
specified by the user.
As an example, the user can specify a probability of having a niche associated with a deli case as 0.5, a
number of transferred bacteria as 1,000 cfus with a release of bacteria occurring on average every 168
hours of operation. In this context, if a niche is present, 1,000 cfus will be transferred to the corresponding
case on average every 168 hours of operation.
Note that this concept could either simulate the presence of a niche or, similarly, the presence of a regular
contamination from an external source. This could mimic, as an example, a food worker that would
regularly (on average every 168 hours of operation) place a contaminated object such as a milk crate on
the food contact surface with a transfer of 1,000 cfus.
6.1.2 Bacterial growth
Bacterial growth is one of the important basic process that leads the exposure and the risk to
L. monocytogenes [3, 59].
Growth models in food
Predictive microbiology is a science whose object is to predict the size of a bacterial population according
to the environment of the bacteria. Predictive microbiology in food has expanded in the last years and
now provides interesting tools for risk assessment purposes [60, 61].
In predictive microbiology, a “primary model” is a model that predicts the evolution of the size of the
bacterial population according to time in a given environment. The “secondary model” is a model that
evaluates the evolution of the parameters of the primary model according to the environment.
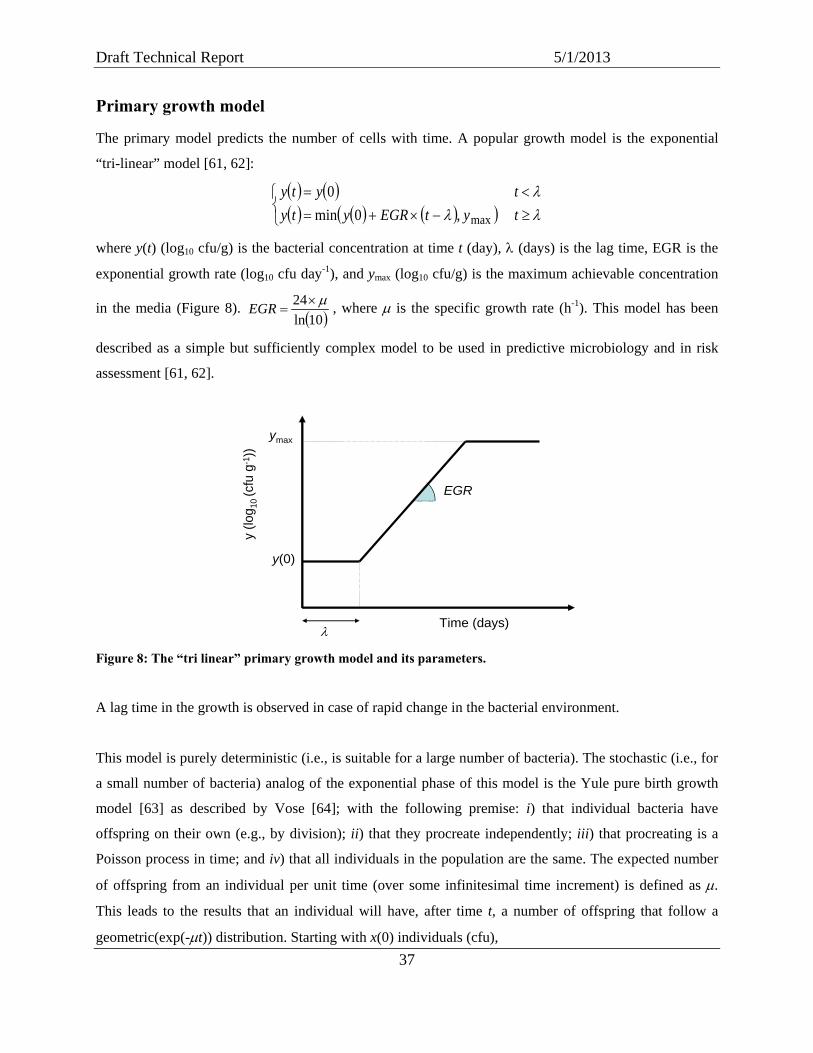
Draft Technical Report 5/1/2013
37
Primary growth model
The primary model predicts the number of cells with time. A popular growth model is the exponential
“tri-linear” model [61, 62]:
( ) ( )( ) ( ) ( )( )
≥−×+=<=λλλ
tytEGRytytyty
max,0min0
where y(t) (log10 cfu/g) is the bacterial concentration at time t (day), λ (days) is the lag time, EGR is the
exponential growth rate (log10 cfu day-1), and ymax (log10 cfu/g) is the maximum achievable concentration
in the media (Figure 8). ( )10ln
24 µ×=EGR , where µ is the specific growth rate (h-1). This model has been
described as a simple but sufficiently complex model to be used in predictive microbiology and in risk
assessment [61, 62].
Figure 8: The “tri linear” primary growth model and its parameters.
A lag time in the growth is observed in case of rapid change in the bacterial environment.
This model is purely deterministic (i.e., is suitable for a large number of bacteria). The stochastic (i.e., for
a small number of bacteria) analog of the exponential phase of this model is the Yule pure birth growth
model [63] as described by Vose [64]; with the following premise: i) that individual bacteria have
offspring on their own (e.g., by division); ii) that they procreate independently; iii) that procreating is a
Poisson process in time; and iv) that all individuals in the population are the same. The expected number
of offspring from an individual per unit time (over some infinitesimal time increment) is defined as µ.
This leads to the results that an individual will have, after time t, a number of offspring that follow a
geometric(exp(-µt)) distribution. Starting with x(0) individuals (cfu),
Time (days)
y (lo
g 10 (c
fu g
-1))
λ
ymax
EGR
y(0)

Draft Technical Report 5/1/2013
38
( ) ( ) ( ) ( )( )txNegBinxtx µ−+ exp,00~
where NegBin(n, p) is the negative binomial distribution34 with size parameter n and probability
parameter p. Note that, as desired, the expected value of x(t) is35 x(0) exp(µt). Then, y(t) = y(0) + EGR × t
and the expectation of the stochastic model is the deterministic model.
Secondary growth model on EGR or µ
The Gamma concept [65]
The secondary models predict the change in the primary model parameters according to a change in the
growth environment. Many secondary models are available [60, 61]. Most of these models may be
grouped either as polynomial models or models from the gamma concept family.
The gamma concept is a concept that considers the impact of multiple environmental factors on the
bacterial growth. The principles of the gamma concept [65] are:
- A µopt (or an )10ln(
24 optoptEGR
µ×= ) parameter is specified. This is the growth rate obtained when all
environmental parameters are optimal for the bacterial growth;
- For each considered environmental parameter xi (e.g., temperature (T), pH, water activity (aw),
nitrite concentration (nit), lactic acid concentration (LAC), and diacetate concentration (DAC)), a
function γi(xi) is defined, with 0 ≤ γi(xi) ≤ 1 reflecting the impact of this environmental parameter
on the growth. An additional function ξint is defined to consider the interaction between
parameters.
- Then, ( ) ( )ni
iiopt xxx ,...,1intξγµµ
= ∏ in the considered environment, i.e.,
( ) ( ) ( ) ( ) ( ) ( ) ( )DACLACnitapHTDACLACnitapHT wDACLACnitwapHTopt w,,,,,intξγγγγγγµµ ⋅⋅⋅⋅⋅⋅⋅=
The advantage of the gamma concept is that it allows independent consideration of a large number of
environmental parameters. It is extensively used in the predictive microbiology domain and claimed to be
universal, allowing Listeria growth to be modeled in a variety of different RTE products knowing some
34 Because the sum of n independent geometric distributions with parameter p is a negative binomial distribution with parameter n and p. 35 The expected value of a NegBin(n, p) distribution is ( ) ppn −1 . The expected value of x(t) is then ( ) ( )( ) ( ) ( ) ( ) ( )( ) ( ) ( ) ( )txxtxxttx µµµµ exp001exp00expexp10 =+−=+−−−
Draft Technical Report 5/1/2013
39
of their characteristics [66]. This gamma concept has already been used in QRAs (e.g., in an Australian
risk assessment for L. monocytogenes in RTE meats [67]).
The alternatives would be:
- the use of one exponential growth rate per food category, as was done within the 2003 FDA/FSIS
risk assessment [3]. Nevertheless, it might be difficult to obtain some data for all kinds of RTE
food (e.g., with and without growth inhibitors);
- the use of only the minimum of the γi factors. This is more common in environmental modeling
because of concerns that the multiplicative model is overly restrictive as more factors are
considered and that µopt thus becomes a function of the number of factors;
- the use of polynomial models that predict the bacterial growth. The major drawback of these later
models is that they are only applicable to the situation for which they were developed [61]. The
polynomial models are of great interest for one or a limited number of food RTE products but
could not be incorporated into this model.
The disadvantage of this gamma concept approach is that the chemical characteristics of the RTE
products are needed to evaluate the potential for L. monocytogenes growth in a RTE product, (i.e.at least
the pH and aw if no preservative is present).
The Mejlholm and Dalgaard model
The gamma concept was extended over time to include more and more parameters, as well as their
interactions [68-74]. In 2009, Mejlholm and Dalgaard gathered and evaluated those modules to build an
extensive model for growth [75]. This model included the impact of temperature, the water activity
(calculated from the concentration of NaCl in the water phase of the RTE product), the pH, the
concentration in smoke components (phenol), the concentration in nitrite, the concentration of dissolved
CO2 at equilibrium, the concentrations of undissociated lactic acid, diacetate, acetic acid, benzoic acid,
citric acid, and sorbic acid. The Mejlholm and Dalgaard model [75] was used in this study, but limited to
temperature, pH, water activity, nitrites, sodium lactate, potassium lactate, and sodium diacetate
concentration and their interactions. The model, its parameterization and its parameters are fully
described in the Appendix 1.
Validation of the model
In the original paper, Mejlholm and Dalgaard [75] obtained bias and accuracy factors [76] of 1.4 and 1.6,
respectively, after evaluating growth rates of L. monocytogenes in different types of meat products with
added organic acids obtained by various authors [77-80]. A second publication from these authors

Draft Technical Report 5/1/2013
40
compared the predictive values of this model against concurrent ones [66, 81, 82] for various RTE food
[83]. For that purpose, 1,014 growth responses of the pathogen in meat, seafood, poultry, and dairy
products were used for validation. For the Mejlholm and Dalgaard [75] model, bias and accuracy factors
for growth rate predictions were 1.0 and 1.5, respectively. The performance of three other models,
including the effect of five to seven environmental parameters, was lower, with bias factors of 1.2 to 1.3.
Less complex models that did not include the effect of acetic acid/diacetate and lactic acid were unable to
predict growth responses of L. monocytogenes accurately in a wide range of food.
Results
Table 2 illustrates the use and the results of the growth model in various RTE foods simulated in this risk
assessment (i.e., deli meat, cheese and deli salad). The growth rates (h-1) and the generation time (time for
the population to double) is affected by the intrinsic properties of the products, as well as the inclusion of
growth inhibitors.

Draft Technical Report 5/1/2013
41
Table 2: Growth rate (µ, h-1) and Generation Time (GT) of various RTE foods modeled in this risk
assessment.
T = 4°C (39.2°F)
T = 10°C (50°F)
RTE product Type (example*)
pH aw Nitrites (ppm)
Sodium Lactate
(%)
Potassium Lactate
(%)
Sodium Diacetate
(%)
µ (/h)
GT (h)
µ (/h)
GT (h)
Deli Meat (Uncured Ham) 6.4 0.97 0 0 0 0 0.015 47 0.052 13 Deli Meat Low Growth
(Cured Ham) 6.4 0.97 150 0 0 0 0.003 210 0.017 41
Deli Meat No Growth
(Cured Ham w GI) 6.4 0.97 150 0 1.65 0.12 0.000 Inf** 0.009 78
Deli Meat (Uncured Turkey) 6.3 0.96 0 0 0 0 0.012 60 0.041 17
Deli Meat Low Growth
(Cured Turkey) 6.3 0.96 150 0 0 0 0.002 376 0.013 52
Deli Meat No Growth
(Cured Turkey w GI) 6.3 0.96 150 0 1.65 0.12 0.000 Inf 0.004 183
Deli Meat (Uncured Bologna) 6.3 0.93 0 0 0 0 0.000 Inf 0.006 121
Deli Meat Low Growth
(Cured Bologna) 6.3 0.93 150 0 0 0 0.000 Inf 0.000 Inf
Deli Meat No Growth
(Cured Bologna w GI) 6.3 0.93 150 0 1.65 0.12 0.000 Inf 0.000 Inf
Deli Meat No Growth
(Pepperoni) 4.7 0.83 0 0 0 0 0.000 Inf 0.000 Inf
Deli Meat No Growth
(Salami) 5.0 0.91 0 0 0 0 0.000 Inf 0.000 Inf
Deli Cheese Low Growth
(Colby) 5.2 0.95 0 0 0 0 0.002 460 0.013 54
Deli Cheese No Growth
(Monterey Jack) 5.3 0.93 0 0 0 0 0.000 Inf 0.001 522
Deli Cheese No Growth
(American) 5.6 0.92 0 0 0 0 0.000 Inf 0.000 Inf
Deli Cheese No Growth
(Provolone) 5.2 0.91 0 0 0 0 0.000 Inf 0.000 Inf
Deli Cheese Low Growth
(Swiss) 5.2 0.92 0 0 0 0 0.000 Inf 0.000 Inf
Deli Salad (Potato) 4.6 0.998 0 0 0 0 0.000 Inf 0.000 Inf Deli Salad Low Growth
(Potato w GI) 4.6 0.998 0 0 1.65 0.12 0.000 Inf 0.000 Inf
Deli Salad (Protein) 5.0 0.998 0 0 0 0 0.000 Inf 0.003 252 Deli Salad Low Growth
(Protein w GI) 5.0 0.998 0 0 1.65 0.12 0.000 Inf 0.000 Inf
*Note that the example is provided only as illustration purpose; **: infinite. The generation time is infinite since the growth rate is 0.
Stochasticity in the µ parameter
The secondary model mentioned above is deterministic in the sense that one set of environmental
parameter leads to one expected value for µ. Augustin et al. [84] quantified the variability of growth
parameters of L. monocytogenes obtained by challenge testing in five food RTE products (vacuum-packed
pork pie, vacuum-packed smoked herring, sliced cooked ham packed under modified atmosphere, cooked
chicken, and surimi salad). The total variance obtained when adding different sources of variability

Draft Technical Report 5/1/2013
42
(residual, between-batch and between manufacturer) led to a total coefficient of variation36 for µ of 45%.
In order to consider these source of variability, the µref,i parameter (the specific growth rate at a reference
temperature) for a given RTE product i (chub, or deli salad bulk) was sampled from a normal distribution
with mean µref and standard deviation (0.45 × µref). Negative values were set to 0. The Table 3 illustrates
the distribution of the predicted growth during 7 days of storage at 10°C.
Table 3: Distribution of the predicted growth (log10 increase) during a 7 day storage at 10°C (50°F)
Example* 1st Quantile Median Mean 3rd Quantile Deli Meat (Uncured Ham) 2.66 3.82 3.82 4.97 Deli Meat Low Growth (Cured Ham) 0.87 1.25 1.25 1.63 Deli Meat No Growth (Cured Ham with GI) 0.69 0.98 0.98 1.28 Deli Meat (Uncured Turkey) 2.08 2.98 2.98 3.87 Deli Meat Low Growth (Cured Turkey) 0.68 0.97 0.97 1.27 Deli Meat No Growth (Cured Turkey with GI) 0.32 0.45 0.46 0.59 Deli Meat (Uncured Bologna) 0.29 0.42 0.42 0.55 Deli Meat Low Growth (Cured Bologna) 0.00 0.00 0.00 0.00 Deli Meat No Growth (Cured Bologna with GI) 0.00 0.00 0.00 0.00 Deli Meat No Growth (Pepperoni) 0.00 0.00 0.00 0.00 Deli Meat No Growth (Salami) 0.00 0.00 0.00 0.00 Deli Cheese Low Growth (Colby) 0.65 0.93 0.94 1.22 Deli Cheese No Growth (Monterey Jack) 0.07 0.10 0.10 0.13 Deli Cheese No Growth (American) 0.00 0.00 0.00 0.00 Deli Cheese No Growth (Provolone) 0.00 0.00 0.00 0.00 Deli Cheese Low Growth (Swiss) 0.00 0.00 0.00 0.00 Deli Salad (Potato Salad) 0.00 0.00 0.00 0.00 Deli Salad Low Growth (Potato Salad with GI) 0.00 0.00 0.00 0.00 Deli Salad (RTE Meat Deli Salad) 0.00 0.00 0.00 0.00 Deli Salad Low Growth (RTE Meat Deli Salad with GI) 0.00 0.00 0.00 0.00
*Note that the example is provided only as illustration purpose.
Other parameters
Lag time
A lag time is observed in the bacterial growth when an abrupt change in the bacterial environment is
observed. No abrupt change in the bacterial environment in retail, during transport, and at home is
considered in the model. The considered process consists only in slicing or scooping at retail and storage
at home. The shifts in temperature are probably not abrupt enough to induce a lag [3]. No consensual
model in the literature predicts the lag time following the transfer from a surface to food. As a
conservative choice favoring the model that leads to a higher risk [59, 85], no lag is considered in this risk
assessment model does not take into account a potential lag phase in bacterial growth that may occur
36 The coefficient of variation is the ratio of the standard deviation to the mean.
Draft Technical Report 5/1/2013
43
upon transfer of bacteria from one surface to another. A lag after a transfer from FCS or NFCS to food
could be considered in future versions of this risk assessment.
ymax (Maximum Population Density)
The maximal population density is a very important parameter for the prediction of the risk linked to
L. monocytogenes [86, 87]. Nevertheless, few studies evaluated this parameter. Within the 2003
FDA/FSIS risk assessment for example [3], the maximal population density was related to the
temperature. For deli meat, deli-type salads and cheeses, the growth was limited to 5 log10 cfu/g if the
temperature was <5°C (41°F), to 6.5 log10 cfu/g if the temperature was 5-7°C (41-44.6°F) and 8 log10
cfu/g if temperature was >7°C (44.6°F). As a safe choice, it will be considered that growth can reach 8
log10 cfu/g in all RTE products, including those with growth inhibitor, whatever the temperature of
storage.
Growth models on sites
The growth model used on sites is the stochastic derivation of an exponential model without lag, as the
one used for food:
( ) ( ) ( ) ( )
−+ tegrxNegBinxtx
10lnexp,00~
with egr ≥ 0, the exponential growth rate on the considered site. egr could be a function of the
temperature. Currently, egr is set to 0, meaning that no growth is considered on sites. Note that a decrease
in the number of bacteria with time may be observed on the various sites [88].
6.1.3 Inactivation
In the current risk assessment model, inactivation is limited to the removal and reduction of
L. monocytogenes on surfaces as the result of cleaning operations, (i.e., wiping, washing, and
sanitization). The inactivation process is modeled as following: given N the initial number of bacteria on
the site being treated, and W the efficacy of the inactivation process (0 ≤ Wi ≤ 1), F the final number of
bacteria on the site is derived stochastically using:
F ~ binomial(N, W)
This assumes that the bacteria are inactivated independently. W is currently sampled at each inactivation
process from:
log10(W) ~ Pert(min, mode, max)
where Pert is the Pert distribution [64], min, mode and max are specific to i) the object and ii) the level of
inactivation. Currently, three levels of inactivation are implemented: “Wipe,” “Wash,” “Wash and
Draft Technical Report 5/1/2013
44
Sanitize.” Note that W is minus the expected log10 reduction of the process. If log10(W) is -1, then W is 0.1
and the expected log10 reduction is 1; this leads to an expected 10-fold decrease of the number of bacteria
on the object. Following a complete literature review [37], (min, mode, max) is set to (-1, -0.5, 0) for all
“wiping” processes, to (-1.5, -0.5, 0) for all “washing” processes, and to (-8, -6, -1.5) for all “washing and
sanitizing” processes.
6.1.4 Partitioning
The only partitioning processes in the model are:
- partitioning a chub to a slice; and
- partitioning a serving of salad from a bulk container.
The partitioning process has already been described in the subsection dealing with cross contamination
during the slicing process and scooping process. Indeed, a homogeneous contamination of the chub and
the salad is assumed. As a consequence, given N0 the number of bacteria in the chub (or the salad bulk),
M is the mass of the chub (or the salad bulk) and m the mass of the slice (or the salad serving), while the
number of bacteria in the slice (or the salad serving) is
N1 ~ binomial(N0, m/M)
The number of bacteria in the remaining chub (or the salad bulk) will then be N1 – N0.
6.2. Objects in the model
6.2.1 Food
Three categories of food are considered in the model: deli meat, deli cheese and deli salad. Deli meat and
deli cheese will be served following a slicing process. Deli salad will be served by scooping from a bulk
container.
Any type of RTE products within these categories may be simulated in the risk assessment model. For
example, deli meat could be ham with high potential of L. monocytogenes, uncured ham, ham with
growth inhibitor, salami, etc. The model is flexible enough to support the addition of new RTE products.
The following characteristics must be known or estimated for each RTE product:
- “category”: “chub” or “salad”. When served, a “chub” will imply a process of slicing while a
“salad” will imply a process of scooping. “Chubs” are meats and cheeses;
- sale characteristics summarized
Draft Technical Report 5/1/2013
45
o by the probability to be present in the retail deli (for rare RTE products) or the number of
chub/salad bulk in the retail deli (for RTE products that are present in all deli
departments), and
o the relative frequency of sales of this RTE product and the mass of a slice (for “chubs”);
- some physical characteristics (i.e., the mean and the standard deviation of the mass of the chub /
bulk);
- some chemical characteristics (i.e., pH, water activity, nitrites (ppm), as well as the proportion
(w/w) of sodium lactate, potassium lactate and sodium diacetate). Those factors are used to
estimate the growth rate in the RTE product (see section 6.1);
- mean and standard deviation of the initial log10 concentration in L. monocytogenes;
- number of days the RTE product can be held in the retail deli after opening or preparation;
- mean and standard deviation of the log10 of the transfer coefficients (see p. 30) of bacteria from
these food category to other food or sites;
- probability to have this food item presliced in the morning, with a mean and standard deviation of
the weight of RTE product that would be presliced.
6.2.2 Sites
Sites are potentially contaminated objects that are present in a deli department. Those sites were chosen
following the observational study specifically developed for this model [28]. Currently, the following
objects are considered: “floor”, “sink”, “handle”, “case”, generic “Non Food Contact Surface” (NFCS),
“utensil” (and its “handle”), “slicer,” generic “Food Contact Surface” (FCS), and “scale.” Two additional
“sites” are associated with food workers: “hands” and “gloves”.
The sites are characterized by:
- their initial contamination at the beginning of the simulation;
- the probability to have a niche compartment/to be contaminated from the environment and, in this
case, the number of bacteria transferred to the considered site during a release of bacteria from
the niche/environment and the average time of operation between two releases (see p. 35);
- the mean and the standard deviation of the log10 reduction of L. monocytogenes when they are
wiped, washed, sanitized, or washed and sanitized (see p. 43);
- the mean and standard deviation of the log10 of the transfer coefficients (see p. 30) of bacteria
from these sites to other sites or food;
- the exponential growth rate (egr) of L. monocytogenes on this object, currently egr = 0.

Draft Technical Report 5/1/2013
46
More than one site of each category may be present in the retail deli. Additional objects could easily be
implemented, as soon as they are associated with specific events (potential cross contamination from/to
this object).
Structure of the deli departments
In the model, the user can build a variety of deli-department layouts or, using an associated relative
probability, may run simulations using a set of specific deli-department layouts. A layout is characterized
by:
- its hours of operation;
- its number (≥1) of various sites present in the deli-department (floor, sink, handle, scale, utensil,
slicer, FCS, NFCS),
- the probability (0≤ p ≤1) that gloves are worn by an employee handling unpackaged foods when
serving customers,
- the probability (0≤ p ≤1) the niche / environmental contamination occurs in the department,
- the time in hours between cleaning the food contact surfaces,
- the number of objects that are cleaned during a sporadic cleaning event.
Moreover, a matrix of contact has to be specified for a given retail deli. This matrix of contact allows one
to specifiy which objects or food worker can be in contact with which category of food. For example, in a
complex retail deli including three slicers, it is possible to specify that the slicer #1 is used only for
cheese, the slicer #2 for meat with no growth, the slicer #3 for all kind of RTE products. This matrix of
contact allows one to study various deli department patterns.
6.3. Events in the model
Importantly, the model tracks only the actions made by and the transfers resulting from the action of a
single food worker. More complex models could be derived for multiple food workers.
6.3.1 Main events
The main events simulated within the model are “Opening the deli,” “Closing the deli,” and “Operating
the deli”. Each is described below.
Opening the deli
The virtual deli is opened 7 days a week, during a given number of hours. This number of hours is
specified at the retail deli level.
Draft Technical Report 5/1/2013
47
When the retail deli opens, the food items that were opened or prepared more than a specified number of
days prior (e.g., 7 days for refrigerated RTE foods) [27]) are discarded. This mimics a date marking
system [27]. Additionally, when the retail deli opens, some food items may be “presliced” in large
quantity. Afterwards, presliced items will be sold throughout the day. A food item is presliced or not
according to a probability of preslicing defined by the user (if 1: some amount of RTE product will be
presliced each morning; if 0: this food item will never be presliced; if > 0 and <1: a random value will be
drawn each morning to decide whether or not the RTE product will be sliced). The amount of RTE
product (>0 g) that will be presliced will be randomly sampled from a normal distribution with mean and
standard deviation defined by the user. Then the RTE product will be presliced using the same process as
if a serving of this RTE product of that size was requested by a customer.
Closing the deli
When the retail deli closes (or every 24 hours of operation if the deli is opened 24/7), all hard surfaces
and equipment in the deli are washed and sanitized. The remaining presliced RTE products are discarded.
Bacterial growth on all sites and food is considered during the time the deli is closed.
Operating the deli
Within the operating hours, three main events are considered: i.e., “Non Deli Time,” “Sporadic Clean,”
and “Serve Customer.” Additionally, i) the FCSs are washed and sanitized regularly, according to a
planned schedule; ii) some transfer of bacteria from the niches may occur, according to a random
schedule.
During the “Non Deli Time” event, nothing happens cocerning our considered process (except bacterial
growth, see below).
During the “Sporadic Clean” event, some sites are cleaned within the deli. The number n of objects
cleaned during a sporadic clean event is characteristic of the retail deli (defined by the user). The
algorithm selects the n sites that have not been cleaned since the longest time, with a random selection in
case of ties. Those objects are then “washed” (i.e., not “washed and sanitized”).
Before all major events, the algorithm checks if one transfer from one niche to its corresponding site
occurred or not (see p.35).

Draft Technical Report 5/1/2013
48
At the end of a main event, the algorithm checks the “FCS clock”. This clock is set to 0 at the opening
time. Regularly, as specified by the user (in the baseline, every 4 hours according to the 2009 FDA Food
Code), the FCSs (in the baseline: the slicer(s), the generic FCS(s), the scale(s), and the utensil(s)), are
washed and sanitized. The FCS clock is then reset.
At the end of each main event, the bacterial growth that occurred during that period is evaluated and
bacterial population numbers are updated, according to the growth models.
Serve a customer
When this main event is chosen by the algorithm, the first action is the choice of the RTE product to be
sold. The choice of a RTE product is proportional to the global sale of this RTE product compared to the
other ones that are present in the retail deli. The mass sold is selected. Then the process varies if the RTE
product needs to be sliced (meat or cheese) or needs to be served (deli salad).
Serving meat or cheese
In Lubran et al.’s study of deli employee behavior [28], a regular baseline behavior sequence was
commonly observed in employees serving customers in a deli departments [28]. The food employee
would change gloves, open the deli case, pick up the chub, close the case, unwrap the chub, slice the RTE
product onto his gloves, put the RTE product on a deli tissue, put the deli tissue on the scale, touch the
scale, put the deli tissue in a plastic bag, put the label on the plastic bag, give the plastic bag to the
consumer, rewrap the chub, open the case, put the chub in the case, close the case. Of course, some
deviations from this baseline were observed. The frequencies of these alternatives were evaluated from
the observational study and incorporated into the risk assessment model (Table 4).

Draft Technical Report 5/1/2013
49
Table 4: Sequence of events when serving deli meat or deli cheese (derived from [28]).
Event Number of times observed / total observations Wipe the Slicer 7/83 Wash Hands and Change Gloves OR Do not Wash Hands and Change Gloves OR Do not Wash Hands and Do not Change Gloves
33/83 22/83 28/83
Touch a NFCS 4/83 Open the Case 68/83 Close the Case if had opened it Touch the Refrigerator Handle 2/66 Open a New Chub if the mass of the chub < mass to be sold No contact OR Contact New Chub - Sink OR Contact New Chub – FCS OR Contact New Chub - Slicer
If open a new Chub 6/17 4/17 1/17 1/17
Pick up a Chub 83/83 Change Gloves 1/83 Touch the Knob of the Slicer 18/83 Slice on Gloves or Slice on Deli Tissue
82/83 1/83
Touch the Scale 83/83 Contact Chub –- FCS 1/83 Open Case If had opened/closed it previously Put Chub in Case 83/83 Close Case If had opened it previously Wipe the Slicer if had not done it at the beginning
15/68
Serving salad
A similar baseline sequence was used for the main event “serve a deli salad.” The baseline sequence, as
observed in retail delis [28], consists of change gloves, open the case, take salad bulk, close the case, pick
up utensils, serve salad, put the RTE product on the scale, open the case, put salad bulk in case, close the
case, touch the scale, wash utensils. Alternatives are provided Table 5.

Draft Technical Report 5/1/2013
50
Table 5: Sequence of events when serving deli salad (derived from [28].)
Event Frequency / Condition Wash Hands and Change Gloves or Do Not Wash Hands and Change Gloves or Do Not Wash Hands and Do Not Change Gloves
1/11 6/11 4/11
Touch a NFCS 1/11 Open the Case or Open the Case Twice or Open the Refrigerator
9/11 1/11 1/11
Open a New Bulk of Salad if the remaining mass < mass to be sold Pick up Salad Bulk 11/11 Pick up Utensils 11/11 Serve Salad 11/11 Close the Case If it had been opened Touch the Scale 11/11 Wash and Sanitize the Utensil or Sanitize the Utensil or Do not Wash nor Sanitize the Utensil
6/11 2/11 2/11
Customer Serving Times
The duration of a serving (h) is assumed proportional to the serving size. Serving times were measured
through buying individual sales of various deli RTE products at different retail delis across different times
of the day. Weights and times are shown in Table 6. Times represent the time from when the order was
placed until the chub was returned to the case.
Table 6. Observed Data for Calculation of Customer Serving Time.
RTE product Ordered weight Serving time Pounds Grams minutes hours
American cheese 0.5 227 1.2 0.0200 Turkey 0.5 227 1.22 0.0203 Ham 0.5 227 3.03 0.0506 American cheese 1 454 2.33 0.0389 Turkey 1 454 2.67 0.0444 American cheese 1 454 4.27 0.0711 Turkey 1 454 3.02 0.0503 Ham 0.25 113 2.45 0.0408 American cheese 0.5 227 1.17 0.0194
A regression to predict time based on ordered weight was generated. Times were quite variable depending
on whether a new chub needed to be opened, the deli worker could easily find the chub ordered, etc.
Consequently the regression fit is rather poor. This high variability is captured by including a residual
standard error from the regression in the time generation within the risk assessment model.

Draft Technical Report 5/1/2013
51
Time (hr) = 0.00007017 weight (g) + 0.01745 R2 = 0.30 Residual standard error: 0.0155
A minimum time of 0.02 hours (1.2 minutes) was assumed for any size serving. An example random
draw of this approach is shown in the red symbols in Figure 9. The solid black circles represent the
observed data.
Figure 9: Simulation of customer serving times
Thus, the customer serving time is modeled as
duration = max(0.02, 0.01745 + 0.00007017 × SS + Normal(0, 0.0155)).
where SS is the serving size (g).
The duration of a deli-salad serving is also assumed proportional to the serving size. It is assumed that it
takes a time following a normal(4, 0.4) minutes per pound with a minimum of 30 s, that is, for a duration
expressed in hours and a serving size in grams,
duration = max(0.0083, SS × Normal(0.0001468, 0.00001468)).
100 150 200 250 300 350 400 450
0.02
0.03
0.04
0.05
0.06
0.07
weight (g)
time
(hr)

Draft Technical Report 5/1/2013
52
6.3.1 Sites
In the baseline and all alternatives, no bacterial growth is considered on the sites. It is considered that the
sites are not contaminated at the beginning of the simulation. However, the first 1% or 10,000 in
1,000,000 servings are removed from the simulation prior to analysis (burn-in period).
6.3.2 Basic processes
The main events are a single or a succession of basic processes. Table 7 provides the correspondence
between the main events used in the current model and the basic processes.
Table 7: Translation of the basic events in terms of basic processes.
Basic event Basic process Objects involved Remove Glove Remove all Bacteria Glove Change Glove Cross contaminationa Glove - Hand Put on Glove Changes Site for Hand/Glove
Cross Contamination with Other Sites.
Glove
Close Case Cross Contamination Case – Hand or Gloveb Open Case Cross Contamination Case – Hand or Glove Open Chub with Contact Chub FCS Cross Contamination Chub - FCS Open Chub with Contact Chub Sink Cross Contamination Chub - Sink Open Chub with Contact Chub Slicer Cross Contamination Chub - Slicer Pick-up Utensil Cross Contamination Utensil Handle – Hand or Glove Put Chub on FCS Cross Contamination Chub - FCS Serve Salad Cross Contamination
Partitioning RTE Product – Utensil RTE Product – RTE Product Sold
Slice Slice Chub - RTE Product Sold– Slicer Slice on Glove Cross Contamination First Slice – Hand or Glove Touch Knob Cross Contamination Slicer – Hand or Glove Touch NFCS Cross Contamination NFCS – Hand or Glove Touch Refrigerator Handle Cross Contamination Handle – Hand or Glove Touch Scale Cross Contamination Scale – Hand Or Glove Touch Scale Cross Contamination Scale – Hand or Glove Wash Hands Inactivation/Removal (Wash) Hands Wash Utensil Inactivation/Removal (Wash) Utensil and Utensil Handle Wash and Sanitize Utensil Inactivation/Removal (Wash
and Sanitize) Utensil and Utensil Handle
Wipe Slicer Inactivation/Removal (Wipe) Slicer a: “Cross contamination”:a: Possible cross contamination if one object carries some bacteria. b: “Hand or Glove”: Hand or glove according to the current hand status of the food employee.
6.3.3 Temperature in display cases
Temperature of a RTE product is assumed equal to the temperature in the cases in which it is displayed.

Draft Technical Report 5/1/2013
53
Data
Temperature of the RTE products in the display cases were inferred from a study conducted by Ecosure
[19]. The display case temperatures of a variety of RTE products were recorded in this study as following:
“when reaching a desired display case within their normal shopping pattern, some participants removed
the RTE product to be purchased and inserted a thermometer directly into the RTE product. Participants
left the thermometer in the RTE product until the temperature stabilized and then recorded the RTE
product temperature and time of day” [19]. Amongst the tested RTE products, the data obtained for
“Sliced meat” (Bologna) were used to derive a temperature distribution for deli cases in the model.
Recorded temperatures ranged from -3.33°C (26°F) to 18.33°C (65°F). The raw data are reported Table 8.
Table 8: Raw storage temperature data for “Sliced Meat” (°F and °C.)
°F 26 30 31 32 33 34 35 36 37 38 39 40 41 42
°C -3.33 -1.11 -0.56 0.00 0.56 1.11 1.67 2.22 2.78 3.33 3.89 4.44 5.00 5.56
n 1 2 1 9 8 11 11 23 23 68 45 120 51 61
°F 43 44 45 46 47 48 49 50 51 52 53 54 55 56
°C 6.11 6.67 7.22 7.78 8.33 8.89 9.44 10.00 10.56 11.11 11.67 12.22 12.78 13.33
n 25 64 54 47 30 73 22 63 10 20 7 9 6 7
°F 57 58 60 62 65
°C 13.89 14.44 15.56 16.67 18.33
n 1 5 10 2 2
(Source [19])
An analysis of the data leads to the conclusion that the collected data should be used directly, as an
empirical distribution, rather than as a parametric one.
Model
In the risk assessment model, every morning, the temperature of each display case is randomly sampled as
being -1°F, +0°F, or +1°F as the day before, using an algorithm preserving the empirical distribution
issued from the Ecosure dataset. For that purpose, a Metropolis-Hastings like algorithm was used. Given
Tn the current temperature (e.g., 40°F), Tn+1 the temperature of the following day, the algorithm is as
following:
- draw a proposed new temperature Tprop that is equal to the next higher temperature observed in
the dataset (e.g., 41°F) or equal to the next lower temperature observed in the dataset (e.g., 39°F)
with equal probabilities; Say that the draw is 41°F;
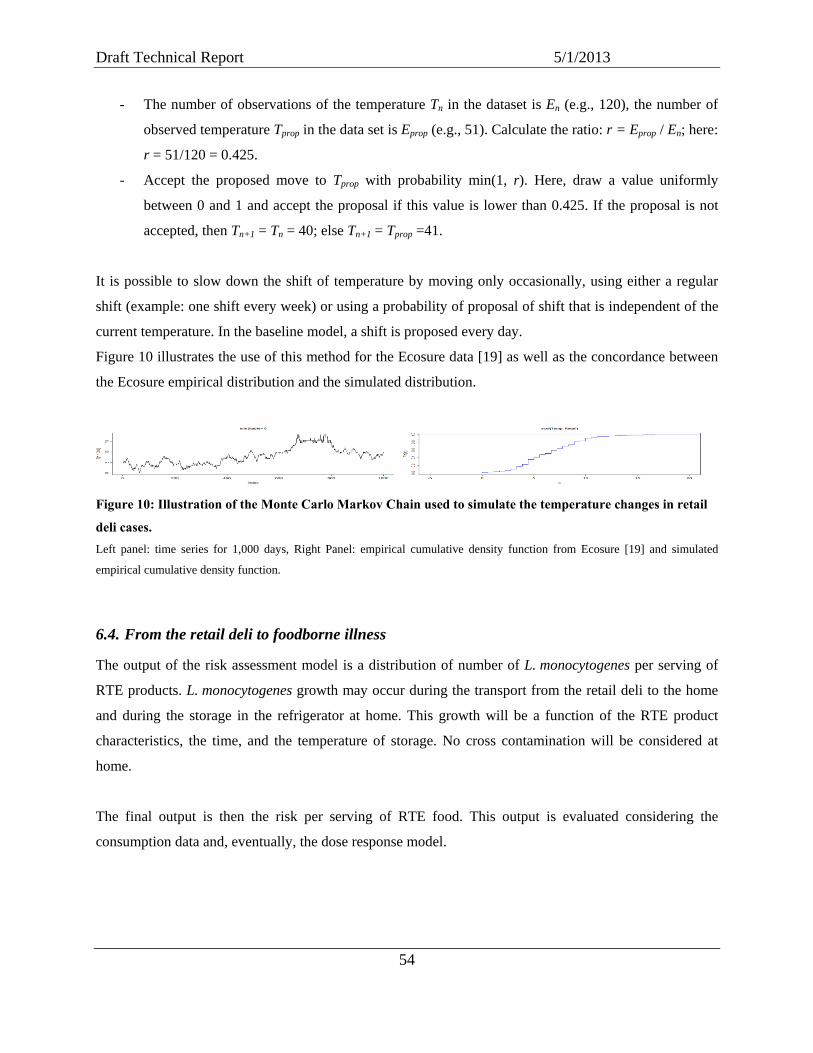
Draft Technical Report 5/1/2013
54
- The number of observations of the temperature Tn in the dataset is En (e.g., 120), the number of
observed temperature Tprop in the data set is Eprop (e.g., 51). Calculate the ratio: r = Eprop / En; here:
r = 51/120 = 0.425.
- Accept the proposed move to Tprop with probability min(1, r). Here, draw a value uniformly
between 0 and 1 and accept the proposal if this value is lower than 0.425. If the proposal is not
accepted, then Tn+1 = Tn = 40; else Tn+1 = Tprop =41.
It is possible to slow down the shift of temperature by moving only occasionally, using either a regular
shift (example: one shift every week) or using a probability of proposal of shift that is independent of the
current temperature. In the baseline model, a shift is proposed every day.
Figure 10 illustrates the use of this method for the Ecosure data [19] as well as the concordance between
the Ecosure empirical distribution and the simulated distribution.
Figure 10: Illustration of the Monte Carlo Markov Chain used to simulate the temperature changes in retail
deli cases. Left panel: time series for 1,000 days, Right Panel: empirical cumulative density function from Ecosure [19] and simulated
empirical cumulative density function.
6.4. From the retail deli to foodborne illness
The output of the risk assessment model is a distribution of number of L. monocytogenes per serving of
RTE products. L. monocytogenes growth may occur during the transport from the retail deli to the home
and during the storage in the refrigerator at home. This growth will be a function of the RTE product
characteristics, the time, and the temperature of storage. No cross contamination will be considered at
home.
The final output is then the risk per serving of RTE food. This output is evaluated considering the
consumption data and, eventually, the dose response model.

Draft Technical Report 5/1/2013
55
6.4.1 Transport
Time, temperature and model
The most pertinent datasets for time-temperature of transport is the Ecosure 2007 dataset [19]. The
protocol within this study was as following: when reaching a desired display case, participants recorded
the temperature of the RTE food and the time of day. “Immediately before placing products in the home
refrigerator or freezer, the temperature of each product was taken and the time recorded. The change in
temperature from the retail case to home is considered to be short term high temperature abuse resulting
from shopping, excessive ambient temperatures and delays between removal of product from its display
and re-refrigeration at home.” See details in [19] and corresponding data on www.FoodRisk.org.
Time to reach home
The best parametric distribution fitting the Ecosure data [19] on the duration between refrigerated storage
at the retail deli and refrigerated storage at home ∆t (h) is a ln-normal distribution (Table 9), as compared
to a normal, a Weibull, a gamma, a logistic, and a log-logistic distribution on the basis of the
Anderson-Darling statistic (results not shown).
Table 9: Parameter of the fitted ln-normal distributions
Delay to get home (h) mean (s.e. Wald)
[95% CI Bootstrap]
sd (s.e. Wald)
[95% CI Bootstrap] ρ spearman (p = 0)
Deli-meat 0.132 (.0143) [.104, .159] .403 (.0101) [.384, .422] -.06 (p = .03)
Increase in the temperature: Deli-Meat
A linear model was developed using Ecosure data. The explained variables was the increase of
temperature (∆T, °F) of the deli meat product and the duration of the transport (∆t, h), the weight of the
product (w, oz.), and the initial temperature (T0, °F) were explaining. The residuals are important and the
adjusted R2 is only 0.09. Given these variables, the variation of temperature is eventually modeled as:
( )( )19.5,0~
with2961.131.21276.27.13,0max 0
NormalwtTT
εε+×−∆×+×−=∆
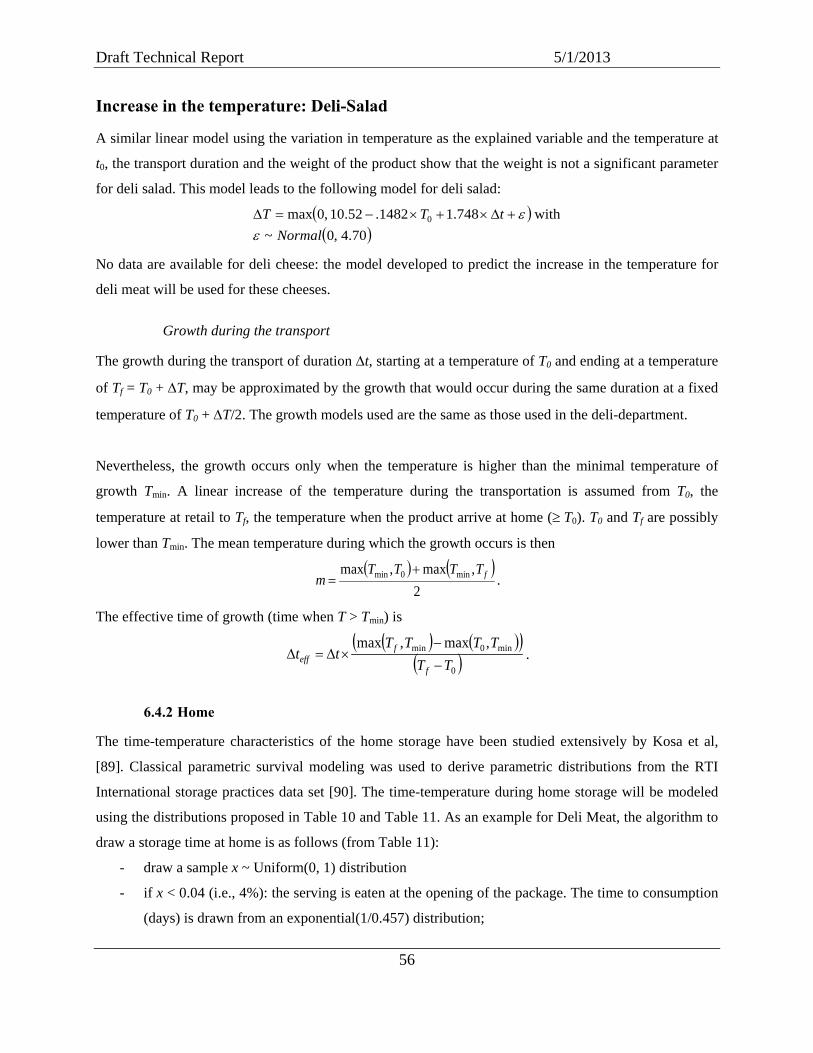
Draft Technical Report 5/1/2013
56
Increase in the temperature: Deli-Salad
A similar linear model using the variation in temperature as the explained variable and the temperature at
t0, the transport duration and the weight of the product show that the weight is not a significant parameter
for deli salad. This model leads to the following model for deli salad:
( )( )70.4,0~
with748.11482.52.10,0max 0
NormaltTT
εε+∆×+×−=∆
No data are available for deli cheese: the model developed to predict the increase in the temperature for
deli meat will be used for these cheeses.
Growth during the transport
The growth during the transport of duration ∆t, starting at a temperature of T0 and ending at a temperature
of Tf = T0 + ∆T, may be approximated by the growth that would occur during the same duration at a fixed
temperature of T0 + ∆T/2. The growth models used are the same as those used in the deli-department.
Nevertheless, the growth occurs only when the temperature is higher than the minimal temperature of
growth Tmin. A linear increase of the temperature during the transportation is assumed from T0, the
temperature at retail to Tf, the temperature when the product arrive at home (≥ T0). T0 and Tf are possibly
lower than Tmin. The mean temperature during which the growth occurs is then
( ) ( )2
,max,max min0min fTTTTm
+= .
The effective time of growth (time when T > Tmin) is
.
6.4.2 Home
The time-temperature characteristics of the home storage have been studied extensively by Kosa et al,
[89]. Classical parametric survival modeling was used to derive parametric distributions from the RTI
International storage practices data set [90]. The time-temperature during home storage will be modeled
using the distributions proposed in Table 10 and Table 11. As an example for Deli Meat, the algorithm to
draw a storage time at home is as follows (from Table 11):
- draw a sample x ~ Uniform(0, 1) distribution
- if x < 0.04 (i.e., 4%): the serving is eaten at the opening of the package. The time to consumption
(days) is drawn from an exponential(1/0.457) distribution;
( ) ( )( )( )0
min0min ,max,maxTT
TTTTtt
f
feff −
−×∆=∆

Draft Technical Report 5/1/2013
57
- else, the serving is eaten at the last occasion. The time to consumption (days) is drawn from a
Weibull(2.08, 8.33) distribution.
Note that no data on hard cheese sliced to order are available. Soft cheese data were used instead. All
simulated temperature <0°C (32°F) were set to 0°C.The bacterial growth is modeled as developed pages
36-43.
Table 10: Fitted Laplace distribution of the refrigerator temperature data in Fahrenheit and Celsius.
Location Scale Fahrenheit 39.3 4.23 Celsius 4.06 2.31
From [90]
Table 11: Fitted distribution of time to first consumption of RTE food using RTI International data.
Time to first consumption (day) Ate package at one time: weighted %
Time to last consumption (day)
Fitted Distribution Fitted Distribution Deli Meat – Sliced to Order Exponential(.457) 4% Weibull(2.08, 8.33) Soft Cheese Weibull(.873, 5.34) 8% Weibull(1.34, 18.7) Deli Salad Exponential(.475) 14% Weibull(1.34, 7.49) From [90]. Exponential(x) is the exponential distribution with mean x.
6.4.3 Consumption
Specific consumption data were extracted from the 1999-2006 National Health and Nutrition Examination
Survey (NHANES, a USDA/DHHS survey) using the FARE™ Program (Food Analysis and Residue
Evaluation Program, v. 8.63) developed by Exponent®. Details are given in the Appendix 2. Figure 11 is
the empirical cumulative distribution function of the serving size per eating occasion obtained from this
analysis for deli salad, deli meat, and deli cheese. Table 12 provides some basic statistics from this
distribution.

Draft Technical Report 5/1/2013
58
Figure 11: Distribution of serving size for deli salad (black), deli meat (blue) and deli cheese (red) for the total
population
Table 12: Summary statistics of the empirical distribution of serving sizes, as simulated in the
L. monocytogenes retail model (g/eating occasions).
Deli Meat Deli Salad Deli Cheese Minimum 1 1 1 1st Quartile 28 28 15 Median 51 69 24 Mean 63 99 31 3rd Quartile 83 138 39 Maximum 775 763 982
6.4.4 Dose-response model
The number of bacteria in the serving sold after transport and growth in the refrigerator is converted into a
concentration using the mass of the serving sold. This concentration is then multiplied by the serving size
(gram per serving) to obtain the ingested dose. Note that, at this level, the dose not a discrete number but
a continuous one, representing the mean of a Poisson distribution of the number of ingested cfus for the
exponential dose-response [91].
The dose response model is a function that links the ingested dose to the probability of a given specified
endpoint. A general review of the hazard characterization process may be obtained in FAO/WHO [92]. A
specific review for the characterization of L. monocytogenes (i.e., characterization of severity and the
selection of appropriate biological end points to be modeled, factors that affect dose-response relations for
0 200 400 600 800
0.0
0.2
0.4
0.6
0.8
1.0
g
Fn(x
)

Draft Technical Report 5/1/2013
59
L. monocytogenes, approaches to modeling dose-response) may be obtained in the FAO/WHO risk
assessment of L. monocytogenes in RTE foods [59].
Relative to a “general” population, an increased susceptibility is commonly associated with:
- pregnant women and neonates, resulting in stillbirth or neonatal infection;
- the older adults; and
- persons with particular conditions, including cancer and immunosuppressive therapy, AIDS,
cardiovascular disease, congestive heart failure, diabetes, cirrhosis and alcoholism [93, 94].
To date, two major dose-response models for humans scaled on epidemiological data are available: one
developed within the 2003 FDA/FSIS quantitative assessment of relative risk to public health from
foodborne L. monocytogenes among selected categories of RTE foods [3] and one developed within the
FAO/WHO risk assessment of L. monocytogenes in RTE foods [59]. The second model uses the latter
dose-response relationship. All details on this dose-response can then be obtained in the FAO/WHO risk
assessment [59].
The FAO/WHO risk assessment considers invasive listeriosis as endpoint. It considers two
subpopulations: the population with “increased susceptibility” [59] (including neonates, older adults and
immunocompromised), and the population with “decreased susceptibility” [59] (all others). The model is
an exponential dose-response model [91] that might be written as
Pr(inf|D)=1-exp(-r D)
where Pr(inf|D) is the marginal probability of invasive listeriosis in a population that ingests a food where
the serving-to-serving variability of contamination follows a Poisson distribution of mean D. The
exponential dose response model is a single-hit model; it considers that pathogens act independently and
that ≥1 pathogen is enough within the host to evoke the endpoint [91]. Parameter r, the unique parameter
of this model, is the probability that 1 cell evokes the endpoint in a consumer at random from the
reference population. It is considered in the exponential dose-response model that r is a constant for the
specific population on which the model is applied. Note that the marginal dose-response relationships in
the FAO/WHO [59] and the 2003 FDA/FSIS [3] risk assessment models closely compare, because they
rely mostly on the same data. These models are almost linear at low to medium dose.
Indeed, the unique r parameter per subpopulation of the FAO/WHO [59] model is estimated from
exposure data issued from a draft FDA/FSIS report [95] and from the annual number of cases of
listeriosis estimated in the United States [96]. The point estimates for r used in this model are 1.06 × 10⁻¹²

Draft Technical Report 5/1/2013
60
for the susceptible population and 2.37 × 10⁻¹⁴ for the other population [see Table 2.17, p. 56 and Table
2.20, p.58, 59].
Uncertainty for the r parameters was derived based on four parameters that influence the dose-response
relations, namely the percentage of the population with increased susceptibility to L. monocytogenes in
the United States, the percentage of cases of total severe listeriosis cases associated with the increased
susceptibility population in the United States, the total number of cases in the United States and the
maximum achievable dose of L. monocytogenes per serving [59]. Using the FAO/WHO [59] assumptions,
a Monte-Carlo simulation was built to derive an empirical distribution of uncertainty for each of the two r
parameters. A median r estimates is 7.76 × 10⁻¹³ [1.32 × 10⁻¹³; 6.98 × 10⁻¹²] for the susceptible population
and 1.76 × 10⁻¹⁴ for a 95% CI of [2.07 × 10⁻¹⁵; 2.10 × 10⁻¹³] for the other population. Note the scale of the
uncertainty. The fraction of the population in the two subpopulations is also uncertain. No uncertainty is
included for any dose-response parameter for this risk assessment because the emphasis is on comparing
outputs for different deli operating rules. Because this confounding uncertainty is not the purpose of this
study, it was chosen to use the point estimates for r.
6.5. Additional baseline inputs
6.5.1 Retail deli characteristics
Two categories of retail deli are currently considered: a retail deli A type (20% of simulated retail delis)
and retail deli B type (80% of simulated retail delis). Retail deli A type includes one of each considered
category of object, (i.e., one Floor, one Sink, one Refrigerator [handle], one Scale, one Case, one Utensil
(and its handle), one Slicer, one Food Contact Surface, and one Non Food Contact Surface). The retail
deli B type includes two of each considered category of object. Each retail deli is opened 14 hours per
day.
In the baseline risk assessment model, the “food contact surfaces” (FCSs) are washed and sanitized once
every 4 hours of operation. When food workers engage in sporadic cleaning, it is assumed that they wash
four objects. Also, it is considered that food workers wear gloves while serving customers 100% of time
(as observed by Lubran et al. [28] in States with the glove policy).
In the baseline, it is assumed that one slicer is used only for deli meat and that the other slicer is used for
deli cheese in larger retail delis with two slicers. There is no separation of deli cases or any other type of
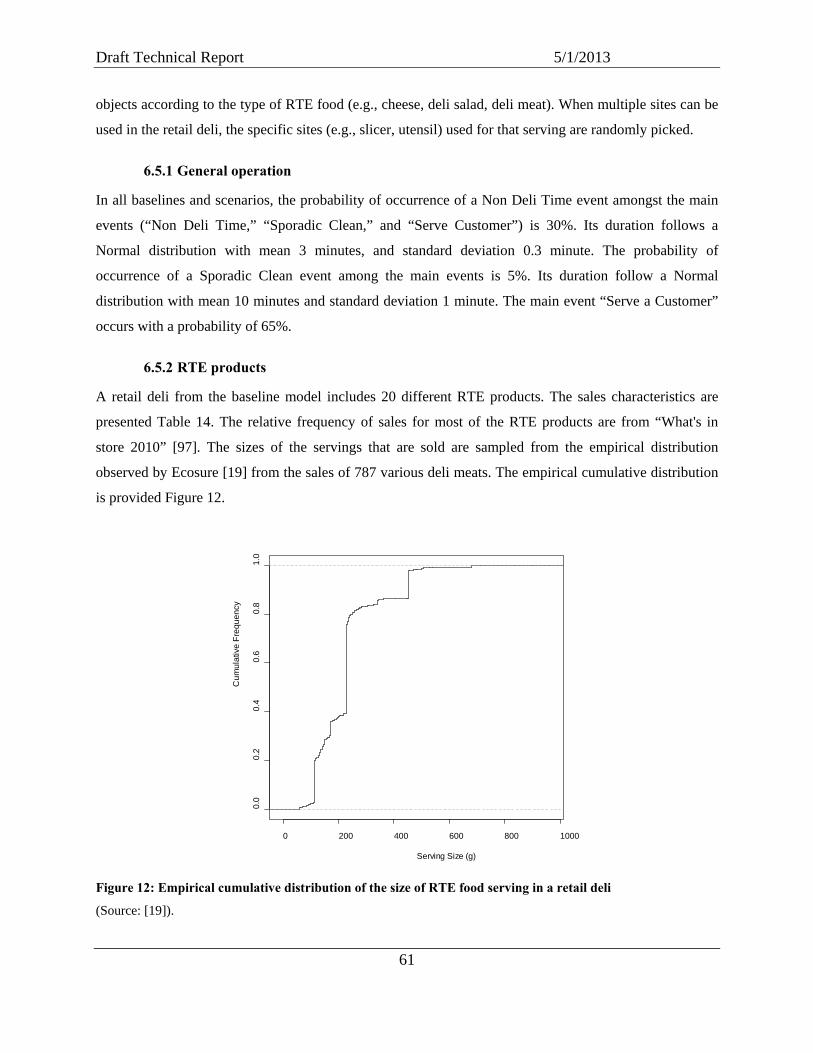
Draft Technical Report 5/1/2013
61
objects according to the type of RTE food (e.g., cheese, deli salad, deli meat). When multiple sites can be
used in the retail deli, the specific sites (e.g., slicer, utensil) used for that serving are randomly picked.
6.5.1 General operation
In all baselines and scenarios, the probability of occurrence of a Non Deli Time event amongst the main
events (“Non Deli Time,” “Sporadic Clean,” and “Serve Customer”) is 30%. Its duration follows a
Normal distribution with mean 3 minutes, and standard deviation 0.3 minute. The probability of
occurrence of a Sporadic Clean event among the main events is 5%. Its duration follow a Normal
distribution with mean 10 minutes and standard deviation 1 minute. The main event “Serve a Customer”
occurs with a probability of 65%.
6.5.2 RTE products
A retail deli from the baseline model includes 20 different RTE products. The sales characteristics are
presented Table 14. The relative frequency of sales for most of the RTE products are from “What's in
store 2010” [97]. The sizes of the servings that are sold are sampled from the empirical distribution
observed by Ecosure [19] from the sales of 787 various deli meats. The empirical cumulative distribution
is provided Figure 12.
Figure 12: Empirical cumulative distribution of the size of RTE food serving in a retail deli
(Source: [19]).
0 200 400 600 800 1000
0.0
0.2
0.4
0.6
0.8
1.0
Serving Size (g)
Cum
ulat
ive
Freq
uenc
y

Draft Technical Report 5/1/2013
62
Importantly, the initial concentration distribution (cfu/gram) for all RTE products is assumed to be a log10
normal distribution. The mean and standard deviation of this log10 normal distribution are assumed to be
issued from a multinormal distribution with mean (-9.228, 2.923) and covariance matrix
−
−=
032.0085.0085.0232.0
C . These parameters are maximum likelihood estimates from the FSIS
L. monocytogenes verification sampling program data [8, 98]. Data from 2006–2010 were used to
estimate this distribution [99]. The dataset consisted of 56,985 samples with an observed prevalence of
0.42% (239 positives). Twenty-two of the samples had quantifiable concentrations above the detection
limit. The highest observed concentration was 230 MPN/g. A maximum likelihood estimation algorithm,
which accounted for the censoring of the data due to the multiple detection limits [16], was used to fit the
lognormal model to the data. In order to avoid any unrealistic concentration using this unbounded, heavily
tailed, log10 normal distribution, this distribution was truncated to 500 cfu per gram
For a 2,270 gram chub, and assuming a Poisson-lognormal(-9.228, 2.923) distribution of the bacteria, this
distribution leads to a prevalence (percentage of chubs containing >0 bacteria) of 2.97%. Table 13
presents some characteristics of this distribution and of distributions that will be used in some of the
alternatives.
Table 13: Characteristics of the distribution of bacteria in contaminated chubs (2270 grams) according to the
mean of the log10 normal-Poisson distribution.
Mean sd prevalence (prob > 0 cfu)
prob > 2270 cfu (1 cfu/g)
prob > 22,700 cfu (100 cfu/g)
Baseline -9.228 2.923 2.97% 0.08% 0.01% Alternatives -9.529 2.923 2.35% 0.06% 0.00% -8.928 2.923 3.71% 0.11% 0.01% -7.000 2.923 12.71% 0.83% 0.10% -5.000 2.923 31.94% 4.36% 0.83% -3.000 2.923 58.04% 15.24% 4.36%
The characteristics of the various RTE products are reported Table 15. These characteristics are extracted
from the chemical analysis results provided in the predictive microbiology literature [72, 77, 79, 80, 82,
100-120].

Draft Technical Report 5/1/2013
63
Table 14: Sales and characteristics of the RTE products.
RTE Product Type (Example*) Number of Chub/Bulk in
each Retail Deli
Sales quantity (Relative Quantity)
Mass of a Chub/Bulk
in g.
(Sd)
Deli Meat (Uncured Ham) 2 4.7 2724 (227) Deli Meat Low Growth (Cured Ham) 2 4.7 2724 (227) Deli Meat No Growth (Cured Ham w GI) 1 4.7 2724 (227) Deli Meat (Uncured Turkey) 2 5 2724 (227) Deli Meat Low Growth (Cured Turkey) 2 5 2724 (227) Deli Meat No Growth (Cured Turkey w GI) 1 5 2724 (227) Deli Meat (Uncured Bologna) 1 1 2724 (227) Deli Meat Low Growth (Cured Bologna) 1 1 2724 (227) Deli Meat No Growth (Cured Bologna w GI) 1 1 2724 (227) Deli Meat No Growth (Pepperoni) 1 1 2724 (227) Deli Meat No Growth (Salami) 1 3 2724 (227) Deli Cheese Low Growth (Colby) 1 1 3178 (227) Deli Cheese No Growth (Monterey Jack) 1 1.4 3632 (227) Deli Cheese No Growth (American) 1 7.6 3632 (227) Deli Cheese No Growth (Provolone) 1 1.4 3632 (227) Deli Cheese Low Growth (Swiss) 1 1.4 3632 (227) Deli Salad (Potato) 1 5 4540 (227) Deli Salad Low Growth (Potato w GI) 1 5 4540 (227) Deli Salad (Protein) 1 2 4540 (227) Deli Salad Low Growth (Protein w GI) 1 3 4540 (227)
* Examples are proposed as illustrative purposes
Table 15: Characteristics of the RTE products.
RTE Product Type (Example*) pH aw Nitrites (ppm)
Potassium Lactate
(w/w %)
Sodium Diacetate (w/w %)
Deli Meat (Uncured Ham) 6.4 0.97 0 0 0 Deli Meat Low Growth (Cured Ham) 6.4 0.97 150 0 0 Deli Meat No Growth (Cured Ham w GI) 6.4 0.97 150 1.65 0.12 Deli Meat (Uncured Turkey) 6.3 0.96 0 0 0 Deli Meat Low Growth (Cured Turkey) 6.3 0.96 150 0 0 Deli Meat No Growth (Cured Turkey w GI) 6.3 0.96 150 1.65 0.12 Deli Meat (Uncured Bologna) 6.3 0.93 0 0 0 Deli Meat Low Growth (Cured Bologna) 6.3 0.93 150 0 0 Deli Meat No Growth (Cured Bologna w GI) 6.3 0.93 150 1.65 0.12 Deli Meat No Growth (Pepperoni) 4.67 0.83 0 0 0 Deli Meat No Growth (Salami) 5 0.91 0 0 0 Deli Cheese Low Growth (Colby) 5.2 0.95 0 0 0 Deli Cheese No Growth (Monterey Jack) 5.25 0.93 0 0 0 Deli Cheese No Growth (American) 5.6 0.92 0 0 0 Deli Cheese No Growth (Provolone) 5.2 0.91 0 0 0 Deli Cheese Low Growth (Swiss) 5.2 0.92 0 0 0 Deli Salad (Potato) 4.6 0.998 0 0 0 Deli Salad Low Growth (Potato w GI) 4.6 0.998 0 1.65 0.12 Deli Salad (Protein) 5 0.988 0 0 0 Deli Salad Low Growth (Protein w GI) 5 0.988 0 1.65 0.12
* Examples are proposed as illustrative purposes
The FDA Food Code [27] specifies that RTE, potentially hazardous food (time/temperature control for
safety food) prepared and held refrigerated for more than 24 hours in a food establishment must be
marked at the time the original container or package is opened in a food establishment to indicate the date

Draft Technical Report 5/1/2013
64
by which the food shall be consumed or discarded. In the baseline model, chubs of ham, turkey, bologna
and salads are discarded if they are not used 7 days after the date they are opened. Foods that do not
require a 7-day limit after opening according to the FDA Food Code [27] (e.g., pepperoni, salami, and
cheese (Colby, Monterey Jack, American, Provolone, Swiss)) are discarded after 30 days if they are not
used.
In the baseline model, RTE products are not presliced; they are sliced and served at the consumer request.
6.5.3 Transfer coefficients
The current values of the parameters defining the transfer coefficient distributions (MTij and STij see
section 6.1.1), following the analysis described in Hoelzer et al. [37], are reported in Table 16. The
parameters are shown only for the transfers that are currently simulated in the model. See Hoelzer et al.
[37] for details.
Table 16: Mean (standard deviation) of the log10 of the transfer coefficients for L. monocytogenes at retail. To
Meat Cheese Salad Floor Sink Handle Case Utensil Utensil
Handle Slicer Scale FCS NFCS Glove Hand
From Meat
-0.28 (0.2)
-0.28 (0.2)
-0.28 (0.2)
-0.28 (0.2)
-0.28 (0.2)
-1.69 (0.81)
-1.69 (0.81)
Deli Cheese
-0.28 (0.2)
-0.28 (0.2)
-0.28 (0.2)
-0.28 (0.2)
-0.28 (0.2)
-1.69 (0.81)
-4.96 (0.37)
Salad -0.28 (0.2)
-0.28 (0.2)
-0.28 (0.2)
-0.28 (0.2)
-1.69 (0.81)
-4.96 (0.37)
Floor -1.84 (0.87)
-1.84 (0.87)
Sink -0.28 (0.2)
-0.28 (0.2)
-1.84 (0.87)
-1.84 (0.87)
Handle -1.84 (0.87)
-1.84 (0.87)
Case -1.84 (0.87)
-1.84 (0.87)
Utensil -0.28 (0.2)
-0.28 (0.2)
-0.28 (0.2)
-1.84 (0.87)
-1.84 (0.87)
Utensil Handle
-1.84 (0.87)
-1.84 (0.87)
Slicer -0.28 (0.2)
-0.28 (0.2)
-1.84 (0.87)
-1.84 (0.87)
Scale -1.84 (0.87)
-1.84 (0.87)
FCS -0.28 (0.2)
-0.28 (0.2)
-0.28 (0.2)
-1.84 (0.87)
-1.84 (0.87)
NFCS -0.28 (0.2)
-0.28 (0.2)
-0.28 (0.2)
-1.84 (0.87)
-1.84 (0.87)
Glove -4.96 (0.37)
-4.96 (0.37)
-4.96 (0.37)
-1.84 (0.87)
-1.84 (0.87)
-1.84 (0.87)
-1.84 (0.87)
-1.84 (0.87)
-1.84 (0.87)
-1.84 (0.87)
-1.84 (0.87)
-1.84 (0.87)
-1.84 (0.87)
-3.43 (0.79)
-3.43 (0.79)
Hand -1.69 (0.81)
-4.96 (0.37)
-4.96 (0.37)
-1.84 (0.87)
-1.84 (0.87)
-1.84 (0.87)
-1.84 (0.87)
-1.84 (0.87)
-1.84 (0.87)
-1.84 (0.87)
-1.84 (0.87)
-1.84 (0.87)
-1.84 (0.87)
-3.43 (0.79)
-3.43 (0.79)
6.6. Implementation
The model is written in the open source language R version > 2.11.1 [121], which is freely available for
download at http://www.r-project.org/. The parameters are specified in a Microsoft® Excel workbook read
by R through an ODBC (Open Database Connectivity)(RODBC package).

Draft Technical Report 5/1/2013
65
The major disadvantage of discrete event models is that their computing times are long. Any state being
dependent on the preceding one, this prevents vectorization and requires loops in R, which run much
slower. A lot of effort has been made while writing the code in order i) to be able to launch the code on
parallelized processors, using the R SNOW package ; ii) to profile the time of computing.
The Interagency Retail L. monocytogenes Risk Assessment Workgroup has access to High Performance
Computing (HPC) tools brought by the Office of Science and Engineering Laboratories, Center for
Devices and Radiological Health, FDA. This allowed the group to run the model on up to 2,016 cores
(Figure 13). Running the code in parallel greatly reduced run time and was used to provide results.
Figure 13: General scheme of simulations
The current general algorithm is as provided Figure 13. On 101 cores, it takes about 0.45 hour to run 100
retail delis in parallel, 1,100,000 sales for each retail deli.
6.7. Studying the model
6.7.1 RTE products
Given that each simulation is run for periods measured in years (1,000,000 servings) for 100 retail delis, a
resulting output file size that would record each sale would be too large to be handled. Thus, the risk
assessment model outputs include summary statistics of the servings and of the events for each
simulation. The summary for the serving includes for each retail deli and food sub category:
CSV Outputs
R model
“Blue Meadow” cluster2,016 cores, 21 TFlops
Brought by the Office of Science and Engineering Laboratories, CDRH - FDA
Parallel computing
ParametersExcel Data File

Draft Technical Report 5/1/2013
66
- the number of servings;
- the number of contaminated serving;
- the mean number of L. monocytogenes cfus amongst positive RTE product servings;
- the mean number of L. monocytogenes cfus per gram of RTE product amongst positive servings;
- the mean L. monocytogenes concentration amongst positive RTE product servings when sold and
when eaten;
- the mean ingested dose of L. monocytogenes;
- the mean risk of invasive listeriosis in the two subpopulations;
- the mean of the log10 of these outputs;
- the sum of square of these outputs.
These few statistics are sufficient to build various other statistics, such as the mean for all servings
(negative and positive), the variance, the standard error, within sub-category of RTE food, within
uncertainty loop, within repetition, etc. It also is sufficient to build an analysis of variance.
Moreover, in order to better characterize the cumulative density function of these outputs, another
summary provides the number of contaminated serving that falls in some contamination level bins. These
statistics count the number of deli sales that fall in the (-∞; 0.001), [0.001; 0.01), [0.01; 0.1),... [1E6,
1E7), [1E7, ∞) bin of contamination (in cfu/g of RTE products). Knowing these counts, it is easy to
rebuild the interval based cumulative density function within sub-category of food, within repetition, etc.
If needed, a file containing a record for each of the simulated servings may be built. It includes all
characteristics of the product sold (e.g., growth characteristics, final size, associated risk). This file is
usually too large to be handled, but may be built and studied for shorter runs to study a very specific
situation.
6.7.2 Sites
A file is provided to track the contamination of the sites: the summary reports for each retail deli and for
each site, the kind of retail deli (e.g., “A” or “ B”), the fraction of time a site is contaminated, and the
mean number of events during which the given site stays contaminated.
The model also can output the time series of L. monocytogenes counts at each site each time an event
occurs or for one selected type of event. This file is usually too large to be handled for a complete run.

Draft Technical Report 5/1/2013
67
6.7.3 Transfer matrix
Within the risk assessment model, a matrix was developed to track each transfer of L. monocytogenes
during a simulation. The structure of the matrix is depicted in Figure 14.
Figure 14: Structure of the L. monocytogenes transfer matrix in the model of the Interagency Risk
Assessment - L. monocytogenes in Retail Delicatessens.
The risk assessment model summarizes the information from a run by proving i) the number of contacts
between objects; ii) the number of effective contacts (i.e., number of contacts with at least one cfu
involved); iii) the average number of L. monocytogenes cfu transferred per contact, and; iv) the overall
number of transferred cfu of L. monocytogenes.
The intensity of the transfers occurring in a model may be graphically illustrated as in Figure 20 to study
the dynamics of the transfer of L. monocytogenes in the risk assessment model as well as the impact of
mitigations on each L. monocytogenes transfer.
from Food
from Sites
from Niche
to Sites to Food
from Growth
0No current Food to Food Contact
0 No direct Niche to Food Transfer
SoldWashed
TrashCurrent
Mass Balance: Niche + Incoming Raw Food + Growth =Sold + Washed + Trashed + Current
00
Draft Technical Report 5/1/2013
68
7. Risk Assessment Results and Discussion
7.1. Risk management questions and model approaches
7.1.1 Baseline retail deli and RTE product conditions
The model requires the input of bacterial loadings and frequencies of bacterial transfer from the niches
and the mean bacterial concentration in the contaminated product type. Baseline conditions needed to be
established to evaluate the public health impact of changes in retail deli practices and the effectiveness of
the various retail deli food safety mitigations. The conditions in different retail stores and within a single
retail deli at different times may vary a great deal in terms of L. monocytogenes levels of environmental
and product contamination. A sensitivity analysis of the levels and frequencies of L. monocytogenes
contamination from niches and the mean levels of L. monocytogenes on RTE products entering the retail
deli for further preparation (e.g., slicing) before being sold to the consumer was conducted in section
7.2.1.
The approach used in this risk assessment was to evaluate the public health effect of various food safety
mitigations under six different baseline conditions that may characterize a retail deli and the RTE product
its serves at different times over the course of operations. These six baseline conditions are:
• A retail deli with multiple niches that releases L. monocytogenes to food contact surfaces. This
approach would also represent retail delis where general environmental contamination of
non-food contact surfaces is transferred to surfaces that may be in contact with food. This
baseline assumes that on average 100 L. monocytogenes are released to food contact surfaces
periodically, with an average period between two releases of one week (W). The level selected
for this specific baseline was selected amongst other levels (see section 7.2.1). This baseline will
be denoted: Multiple Niche 100W (1st baseline model condition).
• A retail deli with no niches or environmental L. monocytogenes transfer. This baseline will be
denoted: No niche (2nd baseline model condition).
• A retail deli with no niche with an incoming RTE product more highly contaminated with
L. monocytogenes than current average federally inspected plant data indicate [99]. Theses
baselines assume (see section 7.2.1) a mean concentration in that incoming RTE product of 10-5
cfu/g, increased from the monitored 10-9.2 cfu/g. The level selected for these specific baselines
were selected to generate a readily observable increase in the predicted risk and were further
evaluated by a sensitivity analysis (see section 7.2.1). Two types of retail deli situations are
examined, including:

Draft Technical Report 5/1/2013
69
o The incoming contaminated RTE product supports growth. (Sales volume and other RTE
product specific data based on available data on RTE food that support L. monocytogenes
growth). This baseline will be denoted: Incoming Growth Chub (3rd baseline model
condition).
o The incoming RTE product does not support growth. (Sales and other RTE product
specific data were based on available data on RTE food that does not support
L. monocytogenes growth). This baseline will be denoted: Incoming Non-Growth Chub
(4th baseline model condition).
• A retail deli compliant with the 2009 FDA Food Code guidance to maintain deli cases at ≤41°F
(≤5 °C).
o A retail deli with multiple niches and compliant temperature control. This baseline will
be denoted: Niche & Temperature Control (5th baseline model condition).
o A retail deli without any niches with compliant temperature control. This baseline will be
denoted: Temperature Control (6th baseline model condition).
When evaluating the impact of incoming contaminated product, sales and product composition were taken
from typical high sale deli meat and cheese food products. The incoming concentrations were selected as
a range to be higher than actually observed so that the potential public health impact of these higher levels
could be evaluated.
In the absence of ad-hoc data, the specific values defining each baseline type are merely representative.
For example, the Multiple Niche 100W baseline considers that niches transfer 100 cfu on an average
weekly frequency. The baseline values are thus representative of a type of retail delis. A range of values
for niche characteristics and levels of contamination of incoming products are evaluated in a sensitivity
analysis in Section 7.2.1.
7.1.2 Retail deli food safety mitigation scenarios
Various retail deli food safety mitigation scenarios were evaluated to inform the specific risk management
questions posed for this risk assessment (see Section 3). The food safety intervention scenarios that were
run for each of the baseline conditions are given below. The abbreviations used on the graphs are shown
first in bold, followed by a brief explanation. The reader can refer to a list of these abbreviations in the
Table page vii. These scenarios are grouped according to the risk management question the scenario
illustrates.

Draft Technical Report 5/1/2013
70
Because of the large number of retail deli food safety mitigations considered in this risk assessment, the
scenarios were divided into two categories:
• Category 1: those mitigations primarily based on improving sanitation; and
• Category 2: worker/industry behavior and those mitigations primarily directed at
restricting growth through time and temperature control.
Risk assessment model scenario analyses were conducted to inform specific risk management questions
as follows:
1) What would be the potential public health impact of practicing more frequent or more extensive
cleaning procedures for food contact surfaces and/or NFCS on the prevalence of L. monocytogenes in
RTE products sold in retail delis and on the corresponding mean risk of invasive listeriosis than is
currently specified in the 2009 FDA Food Code? The corresponding tested scenarios were:
• Wash & Sanitize: Increase the effectiveness of retail deli cleaning from simply washing to
washing and sanitizing (i.e., from an average log10 reduction obtained from a Pert(-1.5, -0.5, 0) to
a Pert(-8, -6, -1.5)).
• Clean 8 Sporadic: doubling the number of retail deli sites sporadically cleaned from 4 to 8;
• No Sanitation: do not conduct any wiping, washing, or sanitizing of retail deli FCSs;
• No Sporadic Cleaning: retail deli workers clean FCSs as required by the 2009 FDA Food Code,
but do not conduct any additional sporadic cleanings as observed by Lubran et al. [28].
2) What is the potential public health impact of increasing the use of single-service gloves in the retail
delis?
• No Glove: retail deli workers do not use gloves when serving customers;
• Gloves Every Serving: retail deli workers change gloves for every sale of RTE products.
3) What if scale touch pads, refrigerator and deli case handles, and other frequently touched non-food
contact surfaces were considered food contact surfaces and were therefore cleaned and sanitized at a
minimum frequency as per FDA Food Code [27] requirements?
• NFCS as FCS: retail deli workers clean deli NFCSs as if they were FCSs (i.e., every 4 hours in
accordance with the 2009 FDA Food Code).

Draft Technical Report 5/1/2013
71
4) What if practices were in place so that no cross contamination occurred in delis (i.e., no additional
L. monocytogenes added to incoming RTE products)?
• Transfers to 0: scenario where L. monocytogenes cross contamination in the retail deli would
only result from the deli slicer (i.e., set cross contamination transfer coefficients to 0 for all sites
except the slicer);
• Transfers and Slicer to 0: scenario where there is no L. monocytogenes cross contamination in
the retail deli (i.e., set cross contamination transfer coefficients to 0, meaning no cross
contamination occurs for all sites, including the slicer).
5) What if display cases were not touched with gloved or bare hands (i.e., used tissues or had automatic
door open/shut)?
• No Contact Glove Case: retail deli workers do not use their hands (gloved or ungloved) to open
the deli case (e.g., if a floor switch is used).
6) What would be the potential public health impact if the level of L. monocytogenes contamination is
reduced in RTE foods coming into the retail deli?
• Reduce Level: lower the mean incoming L. monocytogenes concentration on all RTE products
from a mean of the log10 of -9.228 to a mean of the log10 of -9.529 (see Section 7.2.1). This leads
to an average prevalence for a 2,270 g chub of 2.35% vs. 2.97% in the baseline.
7) What would be the potential public health impact of “preslicing” all RTE products vs. “slicing to
order” (hypothesis: less cross contamination occurring in morning prior to other cross contamination
events).
• Preslice: retail deli workers pre-slice all chubs of RTE product (deli meat and deli cheese) in the
morning after cleaning. A quantity equal to the median of the daily sales is presliced every
morning. When a consumer orders a RTE product, the food worker serves the presliced RTE
product, until the presliced quantity is all sold. If needed, additional RTE product is sliced to
order. At the end of the day, the remaining presliced RTE product is discarded.

Draft Technical Report 5/1/2013
72
8) What would be the potential public health impact of using separate slicers and/or separate counters for
RTE products that permit growth of L. monocytogenes and for RTE products that do not?
• Separate Slicer: retail deli workers use a separate slicer for RTE products that support growth of
L. monocytogenes versus those RTE products that do not;
• Separate Slicer Case: retail deli workers use a separate slicer and a separate deli case for RTE
products that support the growth of L. monocytogenes versus those RTE products that do not.
9) What would be the potential public health impact of lowering the level of environmental contamination
of food contact surfaces?
• Lower Env Contam: reduce transfer of L. monocytogenes among RTE products, FCSs, and
NFCs (i.e., reduced transfer coefficients by 50%) in the retail deli.
10) What if food workers do not slice RTE products directly on their gloved hands?
• Do Not Slice Onto Gloves: during the observational study, it was observed that the food worker
usually gets the slices on their gloves before putting them on the deli tissue (rather than slicing it
directly on the deli tissue). In this alternative, retail deli workers collect the slices RTE products
directly on tissue paper rather than on his or her gloves.
11) What is the potential public health impact of bacterial growth in retail delis?
• Temp = 5°C: set the retail deli case temperature for all retail delis to 5°C (41°F) (i.e., in
compliance with the 2009 FDA Food Code) rather than utilizing real-world deli case
temperatures reported by Ecosure [19];
• No Growth (T = -5°C): set all retail deli case temperatures to -5°C (23°F). At this temperature,
no L. monocytogenes growth will occur.
12) What would be the potential public health impact of a complete compliance to the cold holding
requirements for certain RTE foods in deli cases (hold at ≤41°F i.e., ≤5 °C)?
• Temp ≤ 5°: use the retail deli case temperatures observed in the Ecosure dataset [19] at or below
5°C (41°F). This implies that all retail delis with deli case temperatures exceeding the 2009 FDA
Food Code recommendation come into compliance.

Draft Technical Report 5/1/2013
73
13) What would be the impact of shortening the time a RTE product can be used in a deli department?
• Shorten time in retail deli: retail delis reduce the length of time RTE products are held before they
are sold or disposed from 7 to 4 days..
14) What would be the impact if all (or no) RTE products (e.g., RTE meat and poultry products, RTE deli
salads) coming into the deli were formulated with growth inhibitors?
• All GI: reformulate all RTE products sold at the retail deli that would otherwise support
L monocytogenes growth to include growth inhibitors to restrict the growth (same growth
inhibitor (GI) formulation as cured ham with GI);
• No GI: reformulate all RTE products that support L. monocytogenes growth that are sold at the
retail deli and do not include GI to restrict L. monocytogenes growth.
7.2. Baseline analysis
This section provides the results of the various baselines and compares the various risk mitigation
scenarios within each baseline. The following section (7.3) compares the risk mitigation scenarios across
the various baselines.
The actual levels selected for specific baselines (“Retail deli with Multiple Niches” and “Retail delis with
contaminated incoming RTE products”) were selected to be large enough to show an increased predicted
risk relative to the “no niche” baseline. Before providing the results of the various baselines, Section 7.2.1
provides a sensitivity analysis of the levels of specific baselines.
7.2.1 Sensitivity analysis
Figure 15 shows a sensitivity analysis of the mean predicted risk of listeriosis per serving of RTE food for
a susceptible population [59] as these choices change. The blue bars to the left are for different niche
loadings. “W” and “D” respectively stand for mean weekly or mean daily transfers. The number
represents the mean number of cfu transferred to the site when transfer occurs. For contaminated RTE
product, the number in parentheses represents the mean log10 concentration (e.g., the baselines scenarios
“Retail delis with contaminated incoming RTE product” are from the (-5) bars).
Importantly, unlike the results presented for incoming contaminated RTE products baselines (see
respective Sections page 89 and page 93), the estimated risk presented here specifically exclude sales of
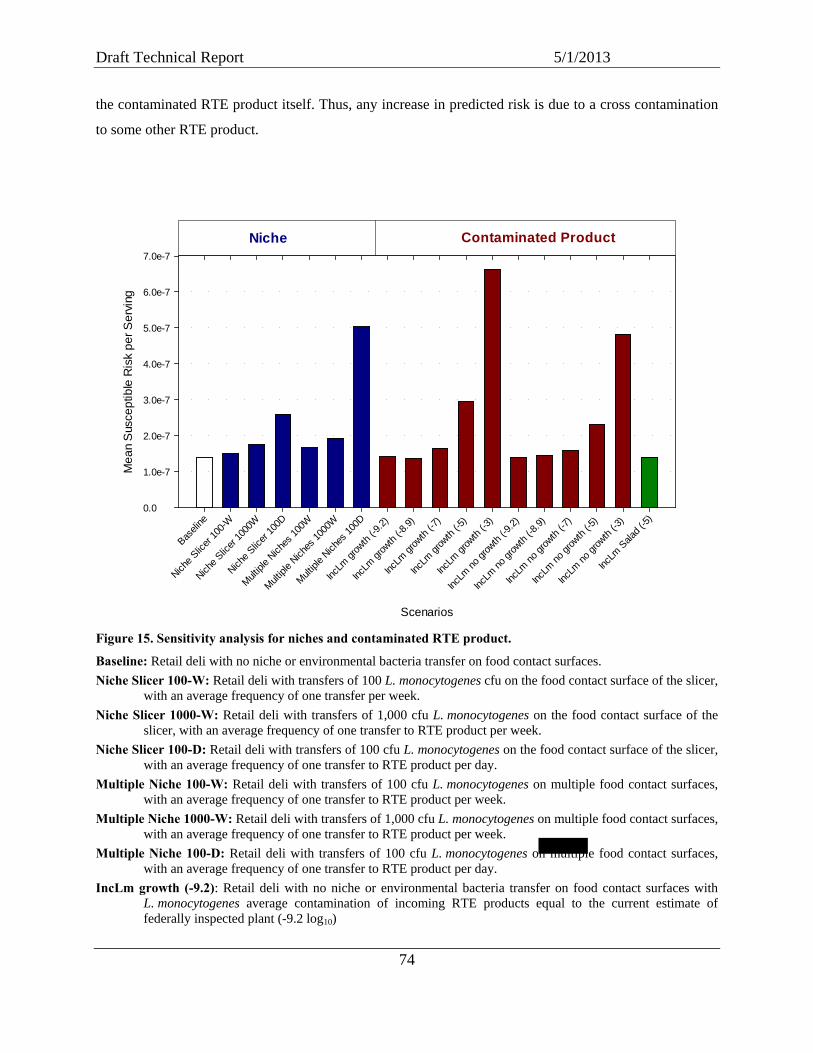
Draft Technical Report 5/1/2013
74
the contaminated RTE product itself. Thus, any increase in predicted risk is due to a cross contamination
to some other RTE product.
Scenarios
Baseli
ne
Niche S
licer
100-W
Niche S
licer
1000
W
Niche S
licer
100D
Multipl
e Nich
es 10
0W
Multipl
e Nich
es 10
00W
Multipl
e Nich
es 10
0D
IncLm
grow
th (-9
.2)
IncLm
grow
th (-8
.9)
IncLm
grow
th (-7
)
IncLm
grow
th (-5
)
IncLm
grow
th (-3
)
IncLm
no gr
owth
(-9.2)
IncLm
no gr
owth
(-8.9)
IncLm
no gr
owth
(-7)
IncLm
no gr
owth
(-5)
IncLm
no gr
owth
(-3)
IncLm
Sala
d (-5)
Mea
n S
usce
ptib
le R
isk
per S
ervi
ng
0.0
1.0e-7
2.0e-7
3.0e-7
4.0e-7
5.0e-7
6.0e-7
7.0e-7
Niche Contaminated Product
Figure 15. Sensitivity analysis for niches and contaminated RTE product.
Baseline: Retail deli with no niche or environmental bacteria transfer on food contact surfaces. Niche Slicer 100-W: Retail deli with transfers of 100 L. monocytogenes cfu on the food contact surface of the slicer,
with an average frequency of one transfer per week. Niche Slicer 1000-W: Retail deli with transfers of 1,000 cfu L. monocytogenes on the food contact surface of the
slicer, with an average frequency of one transfer to RTE product per week. Niche Slicer 100-D: Retail deli with transfers of 100 cfu L. monocytogenes on the food contact surface of the slicer,
with an average frequency of one transfer to RTE product per day. Multiple Niche 100-W: Retail deli with transfers of 100 cfu L. monocytogenes on multiple food contact surfaces,
with an average frequency of one transfer to RTE product per week. Multiple Niche 1000-W: Retail deli with transfers of 1,000 cfu L. monocytogenes on multiple food contact surfaces,
with an average frequency of one transfer to RTE product per week. Multiple Niche 100-D: Retail deli with transfers of 100 cfu L. monocytogenes on multiple food contact surfaces,
with an average frequency of one transfer to RTE product per day. IncLm growth (-9.2): Retail deli with no niche or environmental bacteria transfer on food contact surfaces with
L. monocytogenes average contamination of incoming RTE products equal to the current estimate of federally inspected plant (-9.2 log10)

Draft Technical Report 5/1/2013
75
IncLm growth (-8.9): Retail deli with L. monocytogenes average contamination of incoming RTE products that support growth of L. monocytogenes equal to -8.9 log10, other RTE products having an average contamination equal to -9.2 log10
IncLm growth (-5): Retail deli with L. monocytogenes average contamination of incoming RTE products that support growth of L. monocytogenes equal to -5 log10, other RTE products having an average contamination equal to -9.2 log10
IncLm growth (-3): Retail deli with L. monocytogenes average contamination of incoming RTE products that support growth of L. monocytogenes equal to -8.9 log10, other RTE products having an average contamination equal to -3 log10
IncLm no growth (-9.2): Retail deli with no niche or environmental bacteria transfer on food contact surfaces with L. monocytogenes average contamination of incoming RTE products equal to the current estimate of federally inspected plant (-9.2 log10). Same situation as in S-IncLm growth (-9.2).
IncLm no growth (-8.9): Retail deli with L. monocytogenes average contamination of incoming RTE products that do not support growth of L. monocytogenes equal to -8.9 log10, other RTE products having an average contamination equal to -9.2 log10
IncLm no growth (-5): Retail deli with L. monocytogenes average contamination of incoming RTE products that do not support growth of L. monocytogenes equal to -5 log10, other RTE products having an average contamination equal to -9.2 log10
IncLm no growth (-3): Retail deli with L. monocytogenes average contamination of incoming RTE products that do not support growth of L. monocytogenes equal to -8.9 log10, other RTE products having an average contamination equal to -3 log10
Note: For the specific objective of this sensitivity analysis, the estimated risks for the simulations that incorporated a contaminated RTE product exclude the sales of the contaminated product itself. These results should not be compared to those presented in the later sections. For example, if the mean incoming level is increased to -5 log10, the mean risk per serving for the susceptible population with an incoming product that supports growth is estimated to be 16.6 × 10⁻⁷ when the sales of the contaminated RTE product are considered. If the contaminated product sales are excluded, the mean risk is 2.9 × 10⁻⁷ as shown in the graph. These figures are 2.8 × 10⁻⁷ vs. 2.3 × 10⁻⁷ when the incoming contaminated product does not support growth, respectively.
The main conclusions of the sensitivity analysis are that:
• allowing more L. monocytogenes into the retail deli environment increases the predicted risk,
regardless of whether these bacteria come from a niche(s) in the retail deli environment or from
L. monocytogenes on RTE product from the processor;
• highly contaminated RTE product cross contaminates other RTE products, leading to an increase
predicted risk per serving from consumption of these cross contaminated RTE products. This is
especially true for highly contaminated RTE products that permit growth, but it is also true for
those that do not permit growth.
• allowing more frequent environmental cross contamination (daily vs. weekly) has proportionally
more impact than allowing more bacteria per cross contamination event (100 vs. 1,000 cfus per
contamination event);
Based on this sensitivity analysis, the following baselines were chosen:
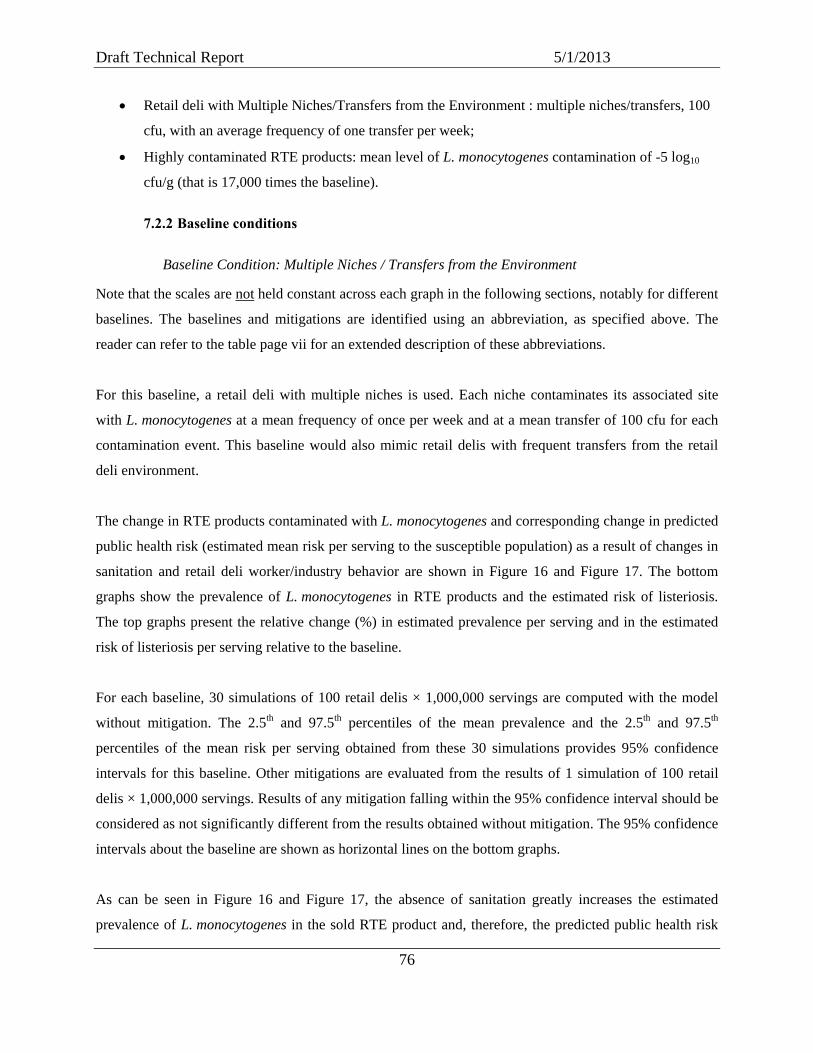
Draft Technical Report 5/1/2013
76
• Retail deli with Multiple Niches/Transfers from the Environment : multiple niches/transfers, 100
cfu, with an average frequency of one transfer per week;
• Highly contaminated RTE products: mean level of L. monocytogenes contamination of -5 log10
cfu/g (that is 17,000 times the baseline).
7.2.2 Baseline conditions
Baseline Condition: Multiple Niches / Transfers from the Environment
Note that the scales are not held constant across each graph in the following sections, notably for different
baselines. The baselines and mitigations are identified using an abbreviation, as specified above. The
reader can refer to the table page vii for an extended description of these abbreviations.
For this baseline, a retail deli with multiple niches is used. Each niche contaminates its associated site
with L. monocytogenes at a mean frequency of once per week and at a mean transfer of 100 cfu for each
contamination event. This baseline would also mimic retail delis with frequent transfers from the retail
deli environment.
The change in RTE products contaminated with L. monocytogenes and corresponding change in predicted
public health risk (estimated mean risk per serving to the susceptible population) as a result of changes in
sanitation and retail deli worker/industry behavior are shown in Figure 16 and Figure 17. The bottom
graphs show the prevalence of L. monocytogenes in RTE products and the estimated risk of listeriosis.
The top graphs present the relative change (%) in estimated prevalence per serving and in the estimated
risk of listeriosis per serving relative to the baseline.
For each baseline, 30 simulations of 100 retail delis × 1,000,000 servings are computed with the model
without mitigation. The 2.5th and 97.5th percentiles of the mean prevalence and the 2.5th and 97.5th
percentiles of the mean risk per serving obtained from these 30 simulations provides 95% confidence
intervals for this baseline. Other mitigations are evaluated from the results of 1 simulation of 100 retail
delis × 1,000,000 servings. Results of any mitigation falling within the 95% confidence interval should be
considered as not significantly different from the results obtained without mitigation. The 95% confidence
intervals about the baseline are shown as horizontal lines on the bottom graphs.
As can be seen in Figure 16 and Figure 17, the absence of sanitation greatly increases the estimated
prevalence of L. monocytogenes in the sold RTE product and, therefore, the predicted public health risk

Draft Technical Report 5/1/2013
77
resulting from these RTE products. Not conducting any sanitation increase the estimated risk by 41%
(x-axis label: No Sanitation). Risk reductions can be predicted by reducing the incoming level of
L. monocytogenes on RTE products (Reduce Level). A reduction in incoming level of L. monocytogenes
on RTE products yields a 22% decrease in the predicted per-serving risk from RTE products.
Conceptually, preventing cross contamination by setting all the transfer coefficients to 0 (Transfers and
Slicer to 0) also significantly reduces the predicted risk (34%). When the slicer transfer coefficients were
not included (Transfers to 0), the predicted risk was not significantly different from the baseline,
emphasizing the importance of the slicer in RTE product cross contamination. Any improvement in the
design of the slicer that would reduce the transfer coefficients could have a potential beneficial impact in
mitigating the predicted risk of listeriosis.
Figure 18 and Figure 19 display the effect that the growth mitigation scenarios on the mean predicted risk
per serving and the prevalence of L. monocytogenes in RTE product sold to the consumer when multiple
niches are present. While the effects of most scenarios on prevalence are insignificant, the effects on
relative risk are profound. Including a growth inhibitor in all RTE products (All GI) almost does away
with any predicted risk (96% reduction). Conversely, removing growth inhibitors (No GI) increases the
predicted risk by almost a factor of two (184%). These results emphasize the importance of mitigations
that control for the growth of L. monocytogenes in RTE product in the retail deli and in the home. The
inclusion of growth inhibitors in RTE product that supports L. monocytogenes growth is a mitigation
scenario that will continue to have an effect once the RTE product is sold and leaves the retail deli. While
they have little impact on prevalence, they have a significant impact on L. monocytogenes concentrations
at the time of consumption, and thus on the predicted risk. Proper holding temperatures and reduced
holding times at home also would reduce the predicted risk, but this is out of the scope of this study and
improvement of cold holding at home was not tested here. As previously observed in L. monocytogenes
risk assessment [3, 59], time and temperature abuse during home storage is considered a major
contributor to the predicted risk of contracting listeriosis from RTE foods.
While difficult to tell because of the scales, Figure 19 also shows that improved temperature control is an
effective risk reduction mitigation. Maintaining all display case temperatures at 5°C (41°F) or less
resulted in a 9% reduction in the predicted risk when compared to the current estimated industry practice .
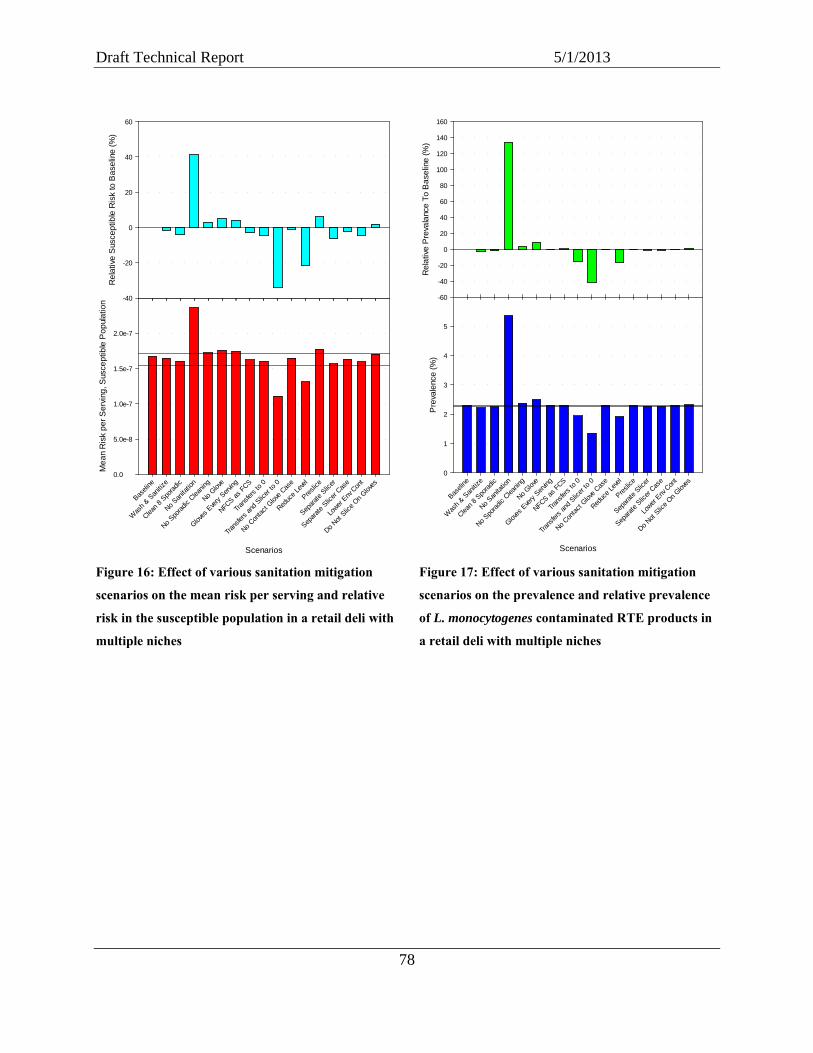
Draft Technical Report 5/1/2013
78
Figure 16: Effect of various sanitation mitigation
scenarios on the mean risk per serving and relative
risk in the susceptible population in a retail deli with
multiple niches
Figure 17: Effect of various sanitation mitigation
scenarios on the prevalence and relative prevalence
of L. monocytogenes contaminated RTE products in
a retail deli with multiple niches
Scenarios
Baseli
ne
Was
h & S
anitiz
e
Clean 8
Spo
radic
No San
itatio
n
No Spo
radic
Cleanin
g
No Glov
e
Gloves
Ever
y Serv
ing
NFCS as FCS
Trans
fers t
o 0
Trans
fers a
nd S
licer
to 0
No Con
tact G
love C
ase
Reduc
e Leve
l
Preslic
e
Separa
te Slic
er
Separa
te Slic
er Cas
e
Lower
Env Con
t
Do Not
Slice O
n Glov
es
Mea
n R
isk
per S
ervi
ng, S
usce
ptib
le P
opul
atio
n
0.0
5.0e-8
1.0e-7
1.5e-7
2.0e-7
Rel
ativ
e S
usce
ptib
le R
isk
to B
asel
ine
(%)
-40
-20
0
20
40
60
Rel
ativ
e P
reva
lanc
e To
Bas
elin
e (%
)
-60
-40
-20
0
20
40
60
80
100
120
140
160
Scenarios
Baseli
ne
Was
h & S
anitiz
e
Clean 8
Spo
radic
No San
itatio
n
No Spo
radic
Cleanin
g
No Glov
e
Gloves
Ever
y Serv
ing
NFCS as FCS
Trans
fers t
o 0
Trans
fers a
nd S
licer
to 0
No Con
tact G
love C
ase
Reduc
e Leve
l
Preslic
e
Separa
te Slic
er
Separa
te Slic
er Cas
e
Lower
Env Con
t
Do Not
Slice O
n Glov
es
Pre
vale
nce
(%)
0
1
2
3
4
5

Draft Technical Report 5/1/2013
79
Figure 18: Effect of various growth mitigation
scenarios on the mean risk per serving and relative
risk in the susceptible population in a retail deli with
multiple niches
Figure 19: Effect of various growth mitigation
scenarios on the prevalence and relative prevalence
of L. monocytogenes contaminated RTE products in
a retail deli with multiple niches
Analyses of the growth, transfers, and inactivation for a typical baseline run are shown in Figure 20 and
Figure 21.
Figure 20 illustrates the total number of bacteria transferred between each pair of sites as well as the total
number of new bacteria from growth and the total number of bacteria that are discarded from
inactivation/removal. Note that the overall number of bacteria transferred from/to RTE products (meat,
cheese, and salad) is influenced by their relative sales for this figure: a RTE product rarely sold would
lead to a lower total number of transferred bacteria. Significant growth is observed, particularly in deli
meats. A significant number of bacteria end in the “washed” or “trashed” compartment (i.e., the
compartments that count the number of bacteria that are eliminated from sanitation practices). This
reinforces the importance of sanitation. A large number of colored cells, both in the “From” and “To”
R
elat
ive
Sus
cept
ible
Ris
k to
Bas
elin
e (%
)
-100
-50
0
50
100
150
200
Scenarios
Baseli
ne
Temp =
5°C
No Grow
th (T=
-5°C)
Temp
<=5°C
Shorte
n tim
e in r
etail d
eliAll G
INo G
I
Mea
n R
isk
per S
ervi
ng, S
usce
ptib
le P
opul
atio
n
0.0
1.0e-7
2.0e-7
3.0e-7
4.0e-7
Rel
ativ
e P
reva
lanc
e To
Bas
elin
e (%
)
-3
-2
-1
0
1
2
3
4
Scenarios
Baseli
ne
Temp =
5°C
No Grow
th (T=
-5°C)
Temp
<=5°C
Shorte
n tim
e in r
etail d
eliAll G
INo G
I
Pre
vale
nce
(%)
0.0
0.5
1.0
1.5
2.0
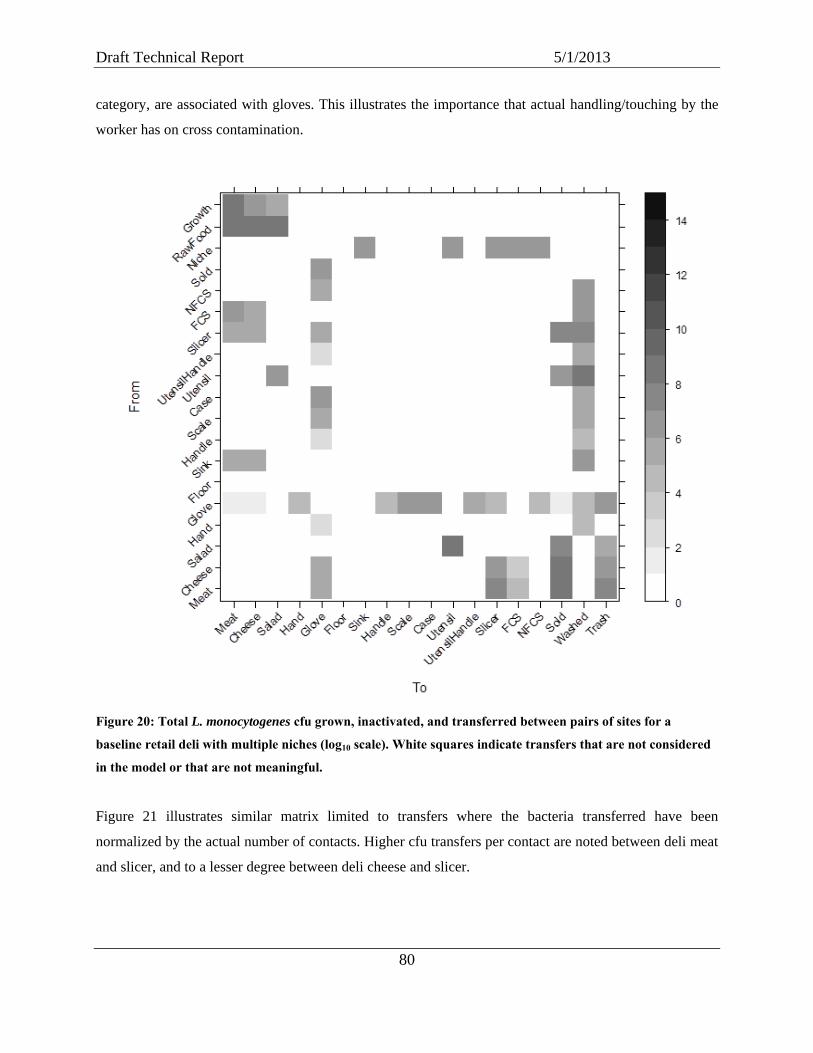
Draft Technical Report 5/1/2013
80
category, are associated with gloves. This illustrates the importance that actual handling/touching by the
worker has on cross contamination.
Figure 20: Total L. monocytogenes cfu grown, inactivated, and transferred between pairs of sites for a
baseline retail deli with multiple niches (log10 scale). White squares indicate transfers that are not considered
in the model or that are not meaningful.
Figure 21 illustrates similar matrix limited to transfers where the bacteria transferred have been
normalized by the actual number of contacts. Higher cfu transfers per contact are noted between deli meat
and slicer, and to a lesser degree between deli cheese and slicer.

Draft Technical Report 5/1/2013
81
Figure 21: L. monocytogenes cfu transferred per actual contact between each pair of sites for a baseline retail
deli with multiple niches (log10 scale). White squares indicate transfers that are not considered in the model or
that are not meaningful.
Figure 22 evaluates the duration of site contamination. The upper graph indicates that for a retail deli with
multiple niches/transfer from the environment, the NFCS are contaminated most often (upper graph).
When contaminated, the contamination persist the longest (lower graph). Nevertheless, this graph shows
that the contamination remains transient on sites even in case of regular transfer from the
niche/environment.

Draft Technical Report 5/1/2013
82
Figure 22: Contamination time analysis for sites in baseline retail deli with multiple contaminated niches.
Upper graph: fraction of time each site is contaminated during a baseline simulation. Bottom graph: mean
number of events a site stay contaminated.
For a listeriosis case to occur through a retail deli sale, several events must occur. Contamination must be
present in or enter the retail environment. Within this model, contamination can enter the retail deli by
means of a contaminated chub or be present in the retail deli in a niche or other environmental source.
Figure 23 illustrates the process leading from a contaminated chub to a high risk of listeriosis from
consumption of a RTE product sold from the deli-department. Thirty sales are shown from a baseline
retail deli with transfer from the environment, although the environment contamination itself does not
factor into this analysis. The sales and actual RTE products are shown in Figure 23a (bottom). A chub of
cured ham with a high L. monocytogenes concentration is used for two sales: #84903 and #84909. All
other RTE products sold are at much lower concentrations. When the RTE products are sliced, the total
number of bacteria leaving with each sale is shown in Figure 23b. (These values are total cfus, not
adjusted for weight of the sale. As expected, the two sales from the contaminated chub have very high cfu
counts, over 2,000 and over 6,000 cfus, respectively. The pattern after the contaminated chub is sliced
changes. Sale #84904 is a deli cheese RTE product, so a different slicer was used and cross contamination

Draft Technical Report 5/1/2013
83
does not occur. The two subsequent sales (#84905 and #84906) are for salami and uncured turkey
respectively. Bacterial transfers from the contaminated slicer contaminate these sales, in a typical
exponentially decreasing amount until the slicer is either sanitized or all of the available bacteria are
transferred from the slicer to sales. Subsequent sales (#84907 and #84908) are thus not contaminated.
Therefore, this first cross contamination event contaminates two additional sales. The second
contamination event (#84909) contaminates three additional sales. Sale #84912 is potato salad, and so
does not contact the slicer and is not involved in the cross contamination.
The dose at consumption for each of these sales is shown in Figure 23c. For listeriosis to occur, the
FAO/WHO dose-response model [59] indicates that very large numbers of bacteria must be consumed –
more than is almost ever present in the retail sale itself. Therefore the next process that must occur prior
to a listeriosis case is significant growth during consumer handling (i.e., from the time of the sale to the
time of consumption). This implies that the RTE product itself must support growth and typically
consumer mishandling (i.e., the RTE product is retail deli for an extended period and/or at an elevated
temperature). Only one of the sales in this example has both these features: sale #84906. On the cross
contaminated uncured turkey, L. monocytogenes grew to its maximum concentration of 108 cfu/g and was
consumed in an approximate 100 g serving. The other contaminated sales are either in low/non-growth
RTE products or are not mishandled.
Finally, a listeriosis case usually results when a susceptible person consumes a high dose of
L. monocytogenes. Figure 23d shows the resulting risks of invasive listeriosis following the consumption
of one serving from these sales. For this run, the one high dose was consumed by an individual from the
general population, so the resulting risk of illness, evaluated using the corresponding dose response
model, was less than 0.03%.
Given this required chain of events for each listeriosis case, it is much more likely that retail
contamination results in very sporadic cases of listeriosis, unlike the major outbreaks where large
numbers of illnesses are traced back to insanitary conditions or loss of process control. Currently, cases
known to be outbreak-associated are <1% of reported cases to the Foodborne Diseases Active
Surveillance Network (FoodNet) [10]
The model also illustrates the difficulty of tracing back sporadic illnesses to a specific food. Assuming
RTE product was still available to be tested at the home and at the retail deli, testing the uncured turkey at
the home would indicate a high concentration. However, testing at retail the exact chub the serving was
Draft Technical Report 5/1/2013
84
taken from would find L. monocytogenes absent. Even without consideration of the long incubation
period for listeriosis [122], identifying contaminated RTE food and linking this to retail deli cross
contamination would be very difficult.

Draft Technical Report 5/1/2013
85
Figure 23. Timeline illustration of sales, cross contamination, and subsequent risk of listeriosis
Sale ID and Product
84893-Cured Turkey
84894-Potato w
GI
84895-Uncured Turkey
84896-Potato w
GI
84897-Am
erican84898-P
rotein w G
I84899-C
ured Turkey84900-C
ured Bologna
84901-Cured H
am w
GI
84902-Salam
i84903-C
ured Ham
84904-Monterey Jack
84905-Salam
i84906-U
ncured Turkey84907-U
ncured Ham
84908-Uncured H
am84909-C
ured Ham
84910-Uncured Turkey
84911-Cured H
am84912-P
otato84913-C
ured Bologna w
GI
84914-Am
erican84915-C
ured Turkey w G
I84916-C
ured Ham
w G
I84917-C
ured Ham
84918-Cured B
ologna84919-P
epperoni84920-C
ured Turkey w G
I84921-U
ncured Ham
84922-Potato w
GI
84923-Am
erican84924-C
ured Turkey84925-A
merican
Chu
b C
on e
ntra
tion,
cfu
/g
0
2
4
6
8
10
12
14
Sal
e To
tal c
fu
0
20
40
60
80
1002776 6050
Dos
e, c
fu
0.0
2.0e+9
4.0e+9
6.0e+9
8.0e+9
1.0e+10
1.2e+10
Ris
k of
Lis
terio
sis
0.0
5.0e-5
1.0e-4
1.5e-4
2.0e-4
2.5e-4 Healthy Susceptible
a.
b.
c.
d.

Draft Technical Report 5/1/2013
86
Baseline Condition: No niche
For this baseline, a retail deli without any niches or highly contaminated RTE product was evaluated. The
sanitation mitigations are shown in Figure 24 and Figure 25 and the growth mitigations in Figure 26 and
Figure 27. Here, sanitation has a much lower impact because there are fewer bacteria to remove.
Preslicing increases the predicted risk by 25%. As with the niches-contaminated retail deli, reducing
incoming L. monocytogenes levels reduces the predicted risk (24% reduction) and preventing any cross
contamination does as well (19% reduction). Only no sanitation had a noticeable impact on the
prevalence.
The growth mitigations are shown in Figure 26 and Figure 27. As with a niche retail deli, growth inhibitor
impact was overwhelming. Temperature control was even more effective for retail delis without any
niches than for niche retail delis. Simply maintaining case temperatures at less than 5°C (41°F) resulted in
a 16% reduction in the predicted risk. For a retail deli without any niches, the only way for external
bacteria to enter the deli area is through the incoming RTE product at low concentrations. Preventing
L. monocytogenes from growing becomes more important. In the niche retail deli, even when growth was
completely controlled, new L. monocytogenes regularly entered because of the niches.
A comparison of the relative effectiveness of the mitigation strategies for a retail deli without any niches
and a retail deli with multiple niches is shown in Figure 28. The growth inhibitor options have been
removed for scaling reasons. A 1:1 line (dashed) and a regression line (solid) have been added for
reference. A linear regression is not expected. The predicted risks from a retail deli with multiple niches
are logically higher; all the points but one fall below the 1:1 line. The degree to which they fall below this
line is based on the arbitrary assumption of a frequency of contamination from a niche at 1 week with a
mean transfer of 100 cfu. Different niche loadings would have moved the points closer or farther from the
1:1 line, as evaluated in the sensitivity analysis of Section 7.2.1. What this graph illustrates is which
mitigations perform significantly better or worse for the different retail deli types.
For example, preslicing falls far above the regression line. Pre-slicing in a retail deli without any niches is
a relatively worse mitigation than in a niche-contaminated retail deli. Conversely, the three temperature
control options all fall far below the regression line. Temperature control is a relatively better mitigation
for retail delis without any niches than for niche-contaminated retail delis. The lack of sanitation impacts
a niche contaminated retail deli more than a retail deli without any niches.

Draft Technical Report 5/1/2013
87
Figure 24: Effect of various sanitation mitigation
scenarios on the mean risk per serving and relative
risk in the susceptible population for sanitation
mitigations in a retail deli without any niches
Figure 25: Effect of various sanitation mitigation
scenarios on the prevalence and relative prevalence
of L. monocytogenes contaminated RTE products for
sanitation mitigations in a retail deli without any
niches
Scenarios
Baseli
ne
Was
h & S
anitiz
e
Clean 8
Spo
radic
No San
itatio
n
No Spo
radic
Cleanin
g
No Glov
e
Gloves
Ever
y Serv
ing
NFCS as FCS
Trans
fers t
o 0
Trans
fers a
nd S
licer
to 0
No Con
tact G
love C
ase
Reduc
e Leve
l
Preslic
e
Separa
te Slic
er
Separa
te Slic
er Cas
e
Lower
Env Con
t
Do Not
Slice O
n Glov
es
Mea
n R
isk
per S
ervi
ng, S
usce
ptib
le P
opul
atio
n
0.0
2.0e-8
4.0e-8
6.0e-8
8.0e-8
1.0e-7
1.2e-7
1.4e-7
1.6e-7
1.8e-7
Rel
ativ
e S
usce
ptib
le R
isk
to B
asel
ine
(%)
-30
-20
-10
0
10
20
30
Rel
ativ
e P
reva
lanc
e To
Bas
elin
e (%
)
-40
-20
0
20
40
60
Scenarios
Baseli
ne
Was
h & S
anitiz
e
Clean 8
Spo
radic
No San
itatio
n
No Spo
radic
Cleanin
g
No Glov
e
Gloves
Ever
y Serv
ing
NFCS as FCS
Trans
fers t
o 0
Trans
fers a
nd S
licer
to 0
No Con
tact G
love C
ase
Reduc
e Leve
l
Preslic
e
Separa
te Slic
er
Separa
te Slic
er Cas
e
Lower
Env Con
t
Do Not
Slice O
n Glov
es
Pre
vale
nce
(%)
0.0
0.5
1.0
1.5
2.0

Draft Technical Report 5/1/2013
88
Figure 26: Effect of various growth mitigation
scenarios on the mean risk per serving and relative
risk in the susceptible population for growth
mitigations in a retail deli without any niches
Figure 27: Effect of various growth mitigation
scenarios on the prevalence and relative prevalence
of L. monocytogenes contaminated RTE products in
a retail deli without any niches
Scenarios
Baseli
ne
Temp =
5°C
No Grow
th (T=
-5°C)
Temp
<=5°C
Shorte
n tim
e in r
etail d
eliAll G
INo G
I
Mea
n R
isk
per S
ervi
ng, S
usce
ptib
le P
opul
atio
n
0.0
1.0e-7
2.0e-7
3.0e-7
4.0e-7
Rel
ativ
e S
usce
ptib
le R
isk
to B
asel
ine
(%)
-100
-50
0
50
100
150
200
Rel
ativ
e P
reva
lanc
e To
Bas
elin
e (%
)
-6
-4
-2
0
2
4
6
Scenarios
Baseli
ne
Temp =
5°C
No Grow
th (T=
-5°C)
Temp
<=5°C
Shorte
n tim
e in r
etail d
eliAll G
INo G
I
Pre
vale
nce
(%)
0.0
0.2
0.4
0.6
0.8
1.0
1.2
1.4
1.6

Draft Technical Report 5/1/2013
89
Baseline: Niche StoreMean Risk per Serving, Susceptible Population
1.0e-7 1.2e-7 1.4e-7 1.6e-7 1.8e-7 2.0e-7 2.2e-7 2.4e-7
Bas
elin
e: C
lean
Sto
reM
ean
Ris
k pe
r Ser
ving
, Sus
cept
ible
Pop
ulat
ion
1.0e-7
1.2e-7
1.4e-7
1.6e-7
1.8e-7
2.0e-7
Reduce LevelNo Growth (T=-5°C)
Temp <= 5°C
Preslice
No Sanitation
Temp = 5°CTransfers & Slicer to 0
Figure 28: Risk comparisons between niche retail deli and retail deli without any niches
Baseline Condition: highly contaminated incoming RTE product that supports growth
For these scenarios, the incoming growth-supporting RTE product had the mean incoming
L. monocytogenes concentration increased from -9.2 log10 cfu/g to -5 log10 cfu/g (i.e., over a four order of
magnitude increase). This level of contamination is fairly high. It leads to a probability for a 2,270 g chub
to be positive (≥1 cfu in the chub) of 32%, and a probability for this chub to have an average
concentration ≥100 cfu/g of 0.83% (Table 13). The predicted risks include the risk linked to the incoming
contaminated RTE product, (i.e., the contaminated RTE product was sold and consumed) and these sales
were included in the risk calculation. A different approach to contaminated RTE product was taken during
the sensitivity analysis of Section 7.2.1, where sales from the contaminated RTE product were not
recorded.
Sanitation mitigations are shown in Figure 29 and Figure 30, while growth mitigations are shown in
Figure 31 and Figure 32. In this baseline, only preslicing significantly increased the predicted risk (50%).
Removing all cross contamination had a slight beneficial effect (10% reduction). None of the other
mitigations were notably different from the baseline.

Draft Technical Report 5/1/2013
90
Figure 29: Effect of various sanitation mitigation
scenarios on the mean risk per serving and relative
risk in the susceptible population for sanitation
mitigations for retail delis with an incoming
contaminated RTE product that supports growth
Figure 30: Effect of various sanitation mitigation
scenarios on the prevalence and relative prevalence
of L. monocytogenes contaminated RTE products for
retail delis with an incoming contaminated RTE
product that supports growth
R
elat
ive
Sus
cept
ible
Ris
k to
Bas
elin
e (%
)
-20
-10
0
10
20
30
40
50
60
Scenarios
Baseli
ne
Was
h & S
anitiz
e
Clean 8
Spo
radic
No San
itatio
n
No Spo
radic
Cleanin
g
No Glov
e
Gloves
Ever
y Serv
ing
NFCS as FCS
Trans
fers t
o 0
Trans
fers a
nd S
licer
to 0
No Con
tact G
love C
ase
Reduc
e Leve
l
Preslic
e
Separa
te Slic
er
Separa
te Slic
er Cas
e
Lower
Env Con
t
Do Not
Slice O
n Glov
es
Mea
n R
isk
per S
ervi
ng, S
usce
ptib
le P
opul
atio
n
0.0
5.0e-7
1.0e-6
1.5e-6
2.0e-6
Rel
ativ
e P
reva
lanc
e To
Bas
elin
e (%
)
-40
-20
0
20
40
Scenarios
Baseli
ne
Was
h & S
anitiz
e
Clean 8
Spo
radic
No San
itatio
n
No Spo
radic
Cleanin
g
No Glov
e
Gloves
Ever
y Serv
ing
NFCS as FCS
Trans
fers t
o 0
Trans
fers a
nd S
licer
to 0
No Con
tact G
love C
ase
Reduc
e Leve
l
Preslic
e
Separa
te Slic
er
Separa
te Slic
er Cas
e
Lower
Env Con
t
Do Not
Slice O
n Glov
es
Pre
vale
nce
(%)
0
2
4
6

Draft Technical Report 5/1/2013
91
Figure 31: Effect of various growth mitigation
scenarios on the mean risk per serving and relative
risk in the susceptible population for retail delis with
an incoming contaminated RTE product that supports
growth
Figure 32: Effect of various growth mitigation
scenarios on the prevalence and relative prevalence
of L. monocytogenes contaminated RTE products
for retail delis with an incoming contaminated RTE
product that supports growth
In this situation, the prevalences increase with no sanitation, even though there is little corresponding
change in the predicted risk.
Growth mitigations showed more promise. As with all of the other retail deli types, use of growth
inhibitors dominated the responses, and growth inhibitors for all RTE products virtually removed any
risk. Controlling the case temperature to ≤5°C (41°F) resulted in a 12% reduction.
The risk comparison to a niche retail deli for different mitigations is shown in Figure 33. The growth
inhibitor scenarios were not included on the graph to allow the risk scale to focus on the remaining
R
elat
ive
Sus
cept
ible
Ris
k to
Bas
elin
e (%
)
-100
-80
-60
-40
-20
0
20
40
Scenarios
Baseli
ne
Temp =
5°C
No Grow
th (T=
-5°C)
Temp
<=5°C
Shorte
n tim
e in r
etail d
eliAll G
INo G
I
Mea
n R
isk
per S
ervi
ng, S
usce
ptib
le P
opul
atio
n
0.0
5.0e-7
1.0e-6
1.5e-6
2.0e-6
Rel
ativ
e P
reva
lanc
e To
Bas
elin
e (%
)
-12
-10
-8
-6
-4
-2
0
2
Scenarios
Baseli
ne
Temp =
5°C
No Grow
th (T=
-5°C)
Temp
<=5°C
Shorte
n tim
e in r
etail d
eliAll G
INo G
I
Pre
vale
nce
(%)
0
1
2
3
4
5

Draft Technical Report 5/1/2013
92
scenarios. The 1:1 line is not included because the scales are so different. Temperature controls are more
effective in the retail delis which have an incoming RTE food that support growth than for retail delis
with multiple niches. Preslicing is correspondingly worse for retail delis that have an incoming RTE food
that support growth.
Baseline: Niche StoreMean Risk per Serving, Susceptible Population
1.0e-7 1.2e-7 1.4e-7 1.6e-7 1.8e-7 2.0e-7 2.2e-7 2.4e-7 2.6e-7
Bas
elin
e: In
com
ing
Gro
wth
Chu
b S
tore
Mea
n R
isk
per S
ervi
ng, S
usce
ptib
le P
opul
atio
n
1.2e-6
1.4e-6
1.6e-6
1.8e-6
2.0e-6
2.2e-6
2.4e-6
2.6e-6
Preslice
No Sanitation
No Growth (T=-5°C)
ReduceLevel
Temp <= 5°CTransfers &Slicer to 0
Figure 33: Risk comparison for niche retail deli versus retail deli with incoming RTE product that supports
growth
It appears that the incoming levels of L. monocytogenes in the contaminated RTE product for this baseline
are relatively high and represent a higher overall loading than the niche retail deli. In this case, preslicing
of the contaminated RTE product actually makes the situation worse. Controlling the growth in the
relatively highly contaminated RTE product is effective, because the model does not include growth at
FCS or NFCS. Therefore, while a niche contaminates an associated site, growth does not occur at the site.

Draft Technical Report 5/1/2013
93
Baseline Condition: highly contaminated incoming RTE product that does not support growth
As with the previous scenario, a retail deli with a highly contaminated incoming RTE product is modeled.
In this case, the product does not support growth. As before, the mean L. monocytogenes in the incoming
RTE product is increased by more than four orders of magnitude from -9.2 log10 cfu/g to -5 log10 cfu/g.
Sanitation mitigations are presented in Figure 34 and Figure 35; growth mitigations are shown in Figure
36 and Figure 37. The theoretical “no cross contamination” scenario (Transfers and Slicer to 0) in the deli
is quite effective (61 % reduction). If cross contamination is completely prevented, the high bacteria
concentrations in the contaminated RTE product cannot spread to other RTE products, notably to RTE
products that support growth. For this situation, preslicing also reduces the predicted risk (34 %
reduction). As expected, the theoretical “no sanitation” scenario increases the predicted risk (24%
increase). In our setting, the “Separate Slicer” scenario implies that deli meat products that support
growth are sliced on a specific slicer and all other products are sliced on the other slicer. In this baseline,
this scenario leads to a higher number of potentially cross contaminated RTE products. As a consequence,
separate slicers for deli meat that support growth (with or without separate cases) increase the predicted
risk by 23% in this baseline. More specific settings could be tested in future runs of this model.
Growth inhibitors are still critically important. For an incoming contaminated RTE product that does not
support growth, temperature control is significantly different from the baseline, although slightly.
Controlling the case temperature to ≤5°C (41°F) resulted in an 8% reduction. Because the contaminated
RTE product does not support growth at any temperature, temperature control only affects the other RTE
products.
The risk comparisons between retail delis with multiple niches and retail delis with incoming
contaminated non-growth RTE product is shown in Figure 38. The points are above the 1:1 reference line
indicating higher predicted risk for the incoming contaminated chubs baseline compared to the baseline
with multiple niches. “No cross contamination,” “preslicing,” and “no sanitation” scenarios lead to lower
risks relatively to the niche retail deli. Separate slicers lead to relatively higher risks.
A comparison between the conditions with increased contamination in a growth versus non-growth RTE
product is shown in Figure 39. Both incoming contaminated RTE products have the same mean
L. monocytogenes levels (increased from -9.2 to -5 log10 cfu/g). The non-growth RTE product actually has

Draft Technical Report 5/1/2013
94
higher sales level, but the predicted risks from the growth-permitting RTE product are always
substantially higher. The 1:1 line cannot be shown because of the difference in scale. Having “no cross
contamination” while instituting effective temperature controls appears to reduce risk more for RTE
product that supports growth than for RTE products that do not support growth. Growth, especially when
the RTE product is heavily contaminated, is a major source of new bacteria within the retail environment.
Temperature control to reduce or prevent growth reduces the predicted risk when the contaminated RTE
product supports growth. Similarly preventing cross contamination from the growth chubs, particularly as
growth increases the concentrations further, also reduces the risk well. On the other hand, preslicing RTE
foods increases the predicted risk significantly more when foods support the growth of L. monocytogenes.

Draft Technical Report 5/1/2013
95
Figure 34: Effect of various sanitation mitigation
scenarios on the mean risk per serving and relative
risk in the susceptible population for sanitation
mitigations for retail delis with an incoming
contaminated RTE product that does not support
growth
Figure 35: Effect of various sanitation mitigation
scenarios on the prevalence and relative prevalence
of L. monocytogenes contaminated RTE products for
sanitation mitigations for retail delis with an
incoming contaminated RTE product that does not
support growth
R
elat
ive
Sus
cept
ible
Ris
k to
Bas
elin
e (%
)
-80
-60
-40
-20
0
20
40
Scenarios
Baseli
ne
Was
h & S
anitiz
e
Clean 8
Spo
radic
No San
itatio
n
No Spo
radic
Cleanin
g
No Glov
e
Gloves
Ever
y Serv
ing
NFCS as FCS
Trans
fers t
o 0
Trans
fers a
nd S
licer
to 0
No Con
tact G
love C
ase
Reduc
e Leve
l
Preslic
e
Separa
te Slic
er
Separa
te Slic
er Cas
e
Lower
Env Con
t
Do Not
Slice O
n Glov
es
Mea
n R
isk
per S
ervi
ng, S
usce
ptib
le P
opul
atio
n
0.0
1.0e-7
2.0e-7
3.0e-7
Rel
ativ
e P
reva
lanc
e To
Bas
elin
e (%
)
-40
-20
0
20
40
Scenarios
Baseli
ne
Was
h & S
anitiz
e
Clean 8
Spo
radic
No San
itatio
n
No Spo
radic
Cleanin
g
No Glov
e
Gloves
Ever
y Serv
ing
NFCS as FCS
Trans
fers t
o 0
Trans
fers a
nd S
licer
to 0
No Con
tact G
love C
ase
Reduc
e Leve
l
Preslic
e
Separa
te Slic
er
Separa
te Slic
er Cas
e
Lower
Env Con
t
Do Not
Slice O
n Glov
es
Pre
vale
nce
(%)
0
2
4
6

Draft Technical Report 5/1/2013
96
Figure 36: Effect of various growth mitigation
scenarios on the mean risk per serving and relative
risk in the susceptible population for retail delis with
an incoming contaminated RTE product that does not
support growth
Figure 37: Effect of various growth mitigation
scenarios on the prevalence and relative prevalence
of L. monocytogenes contaminated RTE products for
retail delis with an incoming contaminated RTE
product that does not support growth
R
elat
ive
Sus
cept
ible
Ris
k to
Bas
elin
e (%
)
-100
-50
0
50
100
150
200
Scenarios
Baseli
ne
Temp =
5°C
No Grow
th (T=
-5°C)
Temp
<=5°C
Shorte
n tim
e in r
etail d
eliAll G
INo G
I
Mea
n R
isk
per S
ervi
ng, S
usce
ptib
le P
opul
atio
n
0.0
2.0e-7
4.0e-7
6.0e-7
8.0e-7
Rel
ativ
e P
reva
lanc
e To
Bas
elin
e (%
)
-1.0
-0.5
0.0
0.5
1.0
1.5
2.0
Scenarios
Baseli
ne
Temp =
5°C
No Grow
th (T=
-5°C)
Temp
<=5°C
Shorte
n tim
e in r
etail d
eliAll G
INo G
I
Pre
vale
nce
(%)
0
1
2
3
4
5

Draft Technical Report 5/1/2013
97
Baseline: Niche StoreMean Risk per Serving, Susceptible Population
1.0e-7 1.2e-7 1.4e-7 1.6e-7 1.8e-7 2.0e-7 2.2e-7 2.4e-7 2.6e-7
Bas
elin
e: In
com
ing
No
Gro
wth
Chu
b S
tore
Mea
n R
isk
per S
ervi
ng, S
usce
ptib
le P
opul
atio
n
1e-7
2e-7
3e-7
4e-7
Transfers & Slicer to 0
Preslice
Separate SlicerSeparate Slicer Case No Sanitation
Figure 38: Risk comparison for niche retail deli versus a retail deli with incoming product that does not
support growth
Baseline: Incoming No Growth Chub StoreMean Risk per Serving, Susceptible Population
5.0e-8 1.0e-7 1.5e-7 2.0e-7 2.5e-7 3.0e-7 3.5e-7 4.0e-7
Bas
elin
e: In
com
ing
Gro
wth
Chu
b S
tore
Mea
n R
isk
per S
ervi
ng, S
usce
ptib
le P
opul
atio
n
1.2e-6
1.4e-6
1.6e-6
1.8e-6
2.0e-6
2.2e-6
2.4e-6
2.6e-6
Preslice
No Growth (T=-5°C)Temp <= 5°C
Temp = 5°CTransfers and Slicer to 0
Figure 39: Risk comparison for niche retail deli versus retail deli with incoming RTE product that does not
support growth versus one that does support growth

Draft Technical Report 5/1/2013
98
Baseline Condition: No niche with required temperature control
The mitigations for a retail deli without any niches that maintains its deli case at ≤5°C (41°F) are shown in
Figure 40 through Figure 43. As expected, the absolute magnitudes of the predicted risks are lower than
even a retail deli without any niches baseline. “No sanitation” and “preslicing” increase the predicted risk
by 12% and 19% respectively. Preventing all retail cross contamination and reducing the incoming
L. monocytogenes level reduce the estimated risk by 19% and 22% respectively. Growth inhibitors are
still extremely effective.
Figure 40. Effect of various sanitation mitigation
scenarios on the mean risk per serving and relative
risk in the susceptible population for sanitation
mitigations for retail deli with temperature control.
Figure 41. Effect of various sanitation mitigation
scenarios on the prevalence and relative prevalence
of L. monocytogenes contaminated RTE products for
sanitation mitigations for retail deli with
temperature control.
Rel
ativ
e S
usce
ptib
le R
isk
to B
asel
ine
(%)
-20
-10
0
10
Scenarios
Baseli
ne
Was
h & S
anitiz
e
Clean 8
Spo
radic
No San
itatio
n
No Spo
radic
Cleanin
g
No Glov
e
Gloves
Ever
y Serv
ing
NFCS as FCS
Trans
fers t
o 0
Trans
fers a
nd S
licer
to 0
No Con
tact G
love C
ase
Reduc
e Leve
l
Preslic
e
Separa
te Slic
er
Separa
te Slic
er Cas
e
Lower
Env Con
t
Do Not
Slice O
n Glov
es
Mea
n R
isk
per S
ervi
ng, S
usce
ptib
le P
opul
atio
n
0.0
2.0e-8
4.0e-8
6.0e-8
8.0e-8
1.0e-7
1.2e-7
1.4e-7
Rel
ativ
e P
reva
lanc
e To
Bas
elin
e (%
)
-20
0
20
40
Scenarios
Baseli
ne
Was
h & S
anitiz
e
Clean 8
Spo
radic
No San
itatio
n
No Spo
radic
Cleanin
g
No Glov
e
Gloves
Ever
y Serv
ing
NFCS as FCS
Trans
fers t
o 0
Trans
fers a
nd S
licer
to 0
No Con
tact G
love C
ase
Reduc
e Leve
l
Preslic
e
Separa
te Slic
er
Separa
te Slic
er Cas
e
Lower
Env Con
t
Do Not
Slice O
n Glov
es
Pre
vale
nce
(%)
0.0
0.5
1.0
1.5
2.0

Draft Technical Report 5/1/2013
99
Figure 42. Effect of various growth mitigation
scenarios on the mean risk per serving and relative
risk in the susceptible population for retail deli with
temperature control.
Figure 43. Effect of various growth mitigation
scenarios on the prevalence and relative prevalence
of L. monocytogenes contaminated RTE products for
retail deli with temperature control.
Baseline retail deli with multiple niches and temperature control
Results for retail delis with multiple niches but temperature control of the deli case at ≤5°C (41°F) are
provided in Figure 44 to Figure 47. Lack of any sanitation increases the predicted risk by 50%;
eliminating cross contamination and reducing incoming L. monocytogenes levels reduces the predicted
risk by 30% and 16% respectively. Growth inhibitors remain extremely effective.
R
elat
ive
Sus
cept
ible
Ris
k to
Bas
elin
e (%
)
-100
-50
0
50
100
150
200
Scenarios
Baseli
ne
Temp =
5°C
No Grow
th (T=
-5°C)
Temp
<=5°C
Shorte
n tim
e in r
etail d
eliAll G
INo G
I
Mea
n R
isk
per S
ervi
ng, S
usce
ptib
le P
opul
atio
n
0.0
1.0e-7
2.0e-7
3.0e-7
NA NA NA
Rel
ativ
e P
reva
lanc
e To
Bas
elin
e (%
)
-1.0
-0.5
0.0
0.5
1.0
1.5
2.0
2.5
3.0
Scenarios
Baseli
ne
Temp =
5°C
No Grow
th (T=
-5°C)
Temp
<=5°C
Shorte
n tim
e in r
etail d
eliAll G
INo G
I
Pre
vale
nce
(%)
0.0
0.2
0.4
0.6
0.8
1.0
1.2
1.4
1.6
NA NA NA

Draft Technical Report 5/1/2013
100
Figure 44. Effect of various sanitation mitigation
scenarios on the mean risk per serving and relative
risk in the susceptible population for sanitation
mitigations for retail deli with multiple niches and
with temperature control.
Figure 45. Effect of various sanitation mitigation
scenarios on the prevalence and relative prevalence
of L. monocytogenes contaminated RTE products for
sanitation mitigations for retail deli with multiple
niches and with temperature control.
Scenarios
Baseli
ne
Was
h & S
anitiz
e
Clean 8
Spo
radic
No San
itatio
n
No Spo
radic
Cleanin
g
No Glov
e
Gloves
Ever
y Serv
ing
NFCS as FCS
Trans
fers t
o 0
Trans
fers a
nd S
licer
to 0
No Con
tact G
love C
ase
Reduc
e Leve
l
Preslic
e
Separa
te Slic
er
Separa
te Slic
er Cas
e
Lower
Env Con
t
Do Not
Slice O
n Glov
es
Mea
n R
isk
per S
ervi
ng, S
usce
ptib
le P
opul
atio
n
0.0
5.0e-8
1.0e-7
1.5e-7
2.0e-7
Rel
ativ
e S
usce
ptib
le R
isk
to B
asel
ine
(%)
-40
-20
0
20
40
60
Rel
ativ
e P
reva
lanc
e To
Bas
elin
e (%
)
-60
-40
-20
0
20
40
60
80
100
120
140
160
Scenarios
Baseli
ne
Was
h & S
anitiz
e
Clean 8
Spo
radic
No San
itatio
n
No Spo
radic
Cleanin
g
No Glov
e
Gloves
Ever
y Serv
ing
NFCS as FCS
Trans
fers t
o 0
Trans
fers a
nd S
licer
to 0
No Con
tact G
love C
ase
Reduc
e Leve
l
Preslic
e
Separa
te Slic
er
Separa
te Slic
er Cas
e
Lower
Env Con
t
Do Not
Slice O
n Glov
es
Pre
vale
nce
(%)
0
1
2
3
4
5

Draft Technical Report 5/1/2013
101
Figure 46. Effect of various growth mitigation
scenarios on the mean risk per serving and relative
risk in the susceptible population for retail deli with
temperature control.
Figure 47. Effect of various growth mitigation
scenarios on the prevalence and relative prevalence
of L. monocytogenes contaminated RTE products for
retail deli with temperature control.
7.3. Responses to risk management questions
The relative risk to the susceptible population associated with an alternative scenario as compared to the
risk calculated for a baseline condition was evaluated within each baseline. The scenarios were developed
according to risk management questions as provided in Section 3. Figure 48 through Figure 60 illustrates
the results for the various alternative practices across baselines. Remember, the absolute values for the
predicted risk change drastically for each baseline. With the exception of the growth inhibitor analysis, all
the relative risks in the graphs are scaled the same to make comparison between the predicted risks
associated with different risk management scenarios more apparent. The baseline conditions and the
mitigation scenarios are described in 7.1.1 and 7.2.2 respectively.
Scenarios
Baseli
ne
Temp =
5°C
No Grow
th (T=
-5°C)
Temp
<=5°C
Shorte
n tim
e in r
etail d
eliAll G
INo G
I
Mea
n R
isk
per S
ervi
ng, S
usce
ptib
le P
opul
atio
n
0.0
1.0e-7
2.0e-7
3.0e-7
4.0e-7
Rel
ativ
e S
usce
ptib
le R
isk
to B
asel
ine
(%)
-100
-50
0
50
100
150
200
NA NA NA
Rel
ativ
e P
reva
lanc
e To
Bas
elin
e (%
)
-0.4
-0.2
0.0
0.2
0.4
0.6
0.8
1.0
1.2
1.4
1.6
1.8
Scenarios
Baseli
ne
Temp =
5°C
No Grow
th (T=
-5°C)
Temp
<=5°C
Shorte
n tim
e in r
etail d
eliAll G
INo G
I
Pre
vale
nce
(%)
0.0
0.5
1.0
1.5
2.0
NA NA NA

Draft Technical Report 5/1/2013
102
7.3.1 What would be the impact on the prevalence of L. monocytogenes in RTE products
sold in retail delis and on the corresponding mean risk of invasive listeriosis per
serving of practicing more frequent or more extensive cleaning procedures for food
contact surfaces and/or non-food contact surfaces than is currently specified in the
2009 FDA Food Code 2009?
Figure 48: Relative risk comparison for sanitation options
Wash & Sanitize: increase the effectiveness of cleaning from simply washing to washing and sanitizing (i.e., from
an average log10 reduction issued from a Pert(-1.5, -0.5, 0) to a Pert(-8, -6, -1.5)); Clean 8 Sporadic: increase the
number of sites sporadically cleaned from 4 to 8; No Sanitation: do not conduct any wiping, washing, or sanitizing;
No Sporadic Cleaning: only clean FCS to the minimum required by the 2009 FDA Food Code, but do not conduct
the additional sporadic cleanings (as was observed by Lubran et al. [28]).
R
elat
ive
Sus
cept
ible
Ris
k to
Bas
elin
e (%
)
-60
-40
-20
0
20
40
60
Baseline
Multiple Niche 100W
No Niche
Temperature Control
Incoming Growth Chub
Incoming Non-Growth Chub
Niche & Temperature Control
-60
-40
-20
0
20
40
Baseline
Multiple Niche 100W
No Niche
Temperature Control
Incoming Growth Chub
Incoming Non-Growth Chub
Niche & Temperature Control
a. Wash & Sanitize b. Clean 8 Sporadic
c. No Sanitation d. No Sporadic Cleaning

Draft Technical Report 5/1/2013
103
The relative risks for changes in sanitation are shown in Figure 48. Figure 48c clearly indicates that
failing to clean and sanitize all together results in a significant increase in the predicted risk of listeriosis.
Nevertheless, it seems that modifying any of the single sanitation-related practices individually (i.e.,
cleaning more effectively (Figure 48a). Increasing the number of sporadic cleaning sites (Figure 48b) and
not conducting any sporadic cleaning (Figure 48d) had little impact on the relative risk in each retail deli
condition studied. Specific scenario for the cleaning frequency and disinfection of the slicer could be
developed in future version of this model.

Draft Technical Report 5/1/2013
104
7.3.2 What is the impact of increasing the use of single-service gloves in the retail
environment?
Rel
ativ
e S
usce
ptib
le R
isk
to B
asel
ine
(%)
-40
-20
0
20
40
60
Baseline
Multiple Niche 100W
No Niche
Temperature Control
Incoming Growth Chub
Incoming Non-Growth Chub
Niche & Temperature Control
Rel
ativ
e S
usce
ptib
le R
isk
to B
asel
ine
(%)
-60
-40
-20
0
20
40
60
a. No Gloves
b. Gloves Every Serving
Figure 49: Relative risk comparison for glove use.
No Glove: do not use gloves when serving customers; Gloves Every Serving: change gloves for every serving.
The lack of glove use consistently increases the predicted risk across all retail deli types (Figure 49a)
often at statistically significant levels. Thus glove use is recommended to aid in L. monocytogenes control

Draft Technical Report 5/1/2013
105
and would be expected to be critical for other foodborne pathogens such as norovirus or Shigella [123].
Changing gloves for every serving did not result in a significant change (Figure 49b), but recall that
gloves are changed for approximately 65% of servings in baselines already.
7.3.3 What if scale touch pads, refrigerator and deli case handles and other frequently
touched non-food contact surfaces were considered food contact surfaces and were
therefore required to be cleaned and sanitized at a minimum frequency?
these items were required to be cleaned and sanitized every four hours and, as a result could then be
touched by gloved hands without requiring a decontamination action afterwards.
Baseline
Multiple Niche 100W
No Niche
Temperature Control
Incoming Growth Chub
Incoming Non-Growth Chub
Niche & Temperature Control
Rel
ativ
e S
usce
ptib
le R
isk
to B
asel
ine
(%)
-60
-40
-20
0
20
40
60
a. NFCS as FCS
Figure 50: Relative risk comparison for treating NFCS as FCS
NFCS as FCS: treat NFCS as if they were FCS that must be cleaned every 4 hours according to the FDA Food
Code.
Treating NFCS as FCS for cleaning purposes had little impact on the predicted risk. The only retail deli
type where the risk reduction was statistically significant was for a retail deli without any niches that
Draft Technical Report 5/1/2013
106
implemented temperature control. In this case, where L. monocytogenes levels are low and growth is
limited, the additional cleaning might be beneficial relatively to the baseline low risk.
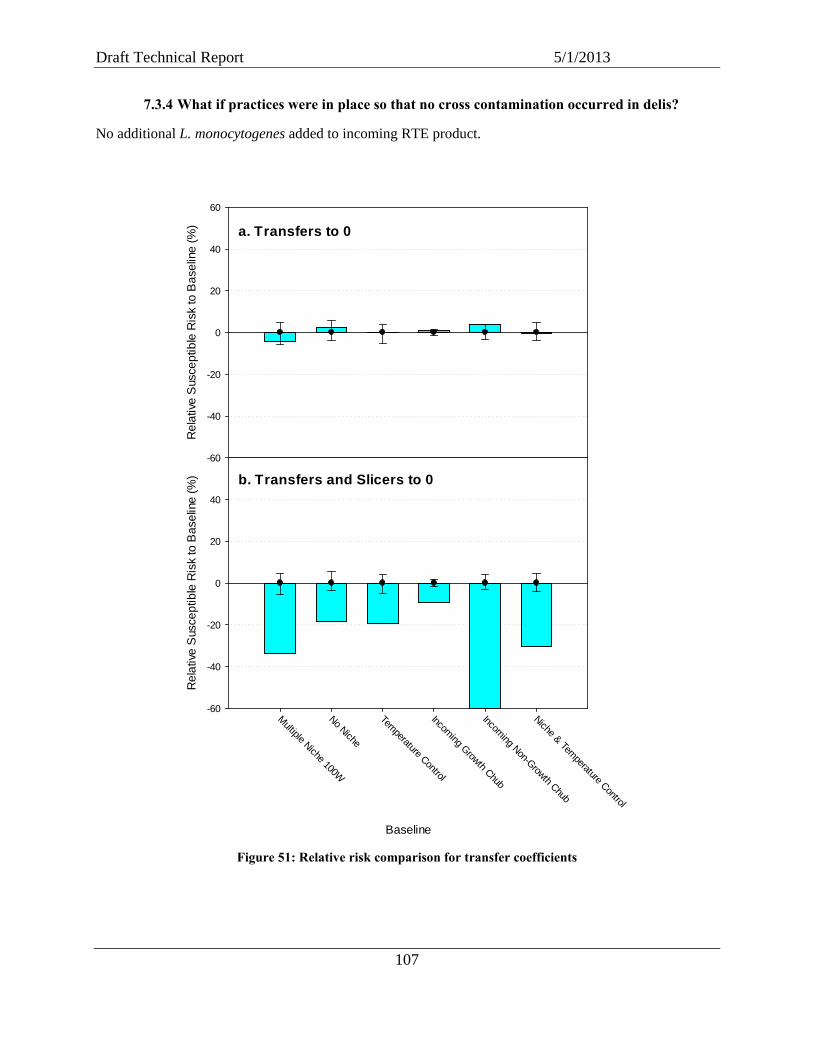
Draft Technical Report 5/1/2013
107
7.3.4 What if practices were in place so that no cross contamination occurred in delis?
No additional L. monocytogenes added to incoming RTE product.
Rel
ativ
e S
usce
ptib
le R
isk
to B
asel
ine
(%)
-60
-40
-20
0
20
40
60
Baseline
Multiple Niche 100W
No Niche
Temperature Control
Incoming Growth Chub
Incoming Non-Growth Chub
Niche & Temperature Control
Rel
ativ
e S
usce
ptib
le R
isk
to B
asel
ine
(%)
-60
-40
-20
0
20
40
a. Transfers to 0
b. Transfers and Slicers to 0
Figure 51: Relative risk comparison for transfer coefficients

Draft Technical Report 5/1/2013
108
Transfers to 0: set cross contamination transfer coefficients to 0 (i.e., no cross contamination occurs). This setting
does not affect the slicer, (i.e., cross contamination can still occur from one sale to the next through the slicer). See
the next mitigation; Transfers and Slicer to 0: set cross contamination transfer coefficients to 0 (i.e., no cross
contamination occurs, for all sites including the slicer).
Setting the transfer coefficients to 0 prevents cross contamination for all sites except the slicer. This
approach had no significant impact on the relative risk (Figure 51a). Including the slicer in the sites,
however, greatly reduced the predicted risk (Figure 51b) across all retail deli types evaluated. This
highlights the importance of the slicer in cross contamination. The importance of the slicer in potential
cross contamination has been demonstrated experimentally [see for example 23, 37, 54, 58, 124]. Our
results confirm that this element may be of major importance when all cross contamination events are
considered in a deli department setting.

Draft Technical Report 5/1/2013
109
7.3.5 What if display cases were not touched with gloved or bare hands?
Used tissues or automatic door to open/shut display case to reduce cross contamination.
Baseline
Multiple Niche 100W
No Niche
Temperature Control
Incoming Growth Chub
Incoming Non-Growth Chub
Niche & Temperature Control
Rel
ativ
e S
usce
ptib
le R
isk
to B
asel
ine
(%)
-60
-40
-20
0
20
40
60
a. No Contact Glove Case
Figure 52: Relative risk comparison for contact between gloves and case handle
No Contact Glove Case: glove/hands are not used to open the deli case (e.g., if a floor switch is used.)
Preventing contact between the case handle and hand/gloves had no significant impact in any of the
baselines studied. Actually, this scenario is a subset of the scenario Transfers to 0 (cross contamination
transfer coefficients to 0 (i.e., no cross contamination occurs)), with one transfer set to 0. This result
confirms that, within a baseline, no single cross contamination event has a major impact on the predicted
risk, with the exception of the cross contamination within the slicer.

Draft Technical Report 5/1/2013
110
7.3.6 What would be the impact if the level/frequency of L. monocytogenes contamination is
reduced in RTE foods coming into the retail deli?
Baseline
Multiple Niche 100W
No Niche
Temperature Control
Incoming Growth Chub
Incoming Non-Growth Chub
Niche & Temperature Control
Rel
ativ
e S
usce
ptib
le ri
sk to
Bas
elin
e (%
)
-60
-40
-20
0
20
40
60a. Reduce Level
Figure 53: Relative risk comparison for reducing incoming level
Reduce Level: lower the mean incoming L. monocytogenes concentration on all RTE products from a mean of the
log10 of -9.228 to a mean of the log10 of -9.529. This leads to an average prevalence for a 2,270 g chub of 2.35% vs.
2.97% in the baseline (Section 6.5.2).
Reducing the incoming L. monocytogenes concentration significantly reduced the predicted risk.
Incoming L. monocytogenes represents one of the major routes that the bacteria can come in contact with
FCS and cross contaminate in this model. Even in situations where L. monocytogenes from the
environment are regularly introduced in the deli department, the level of bacteria in incoming RTE
product does have an impact on the final relative risk of listeriosis from the consumption of RTE products
from the deli department.
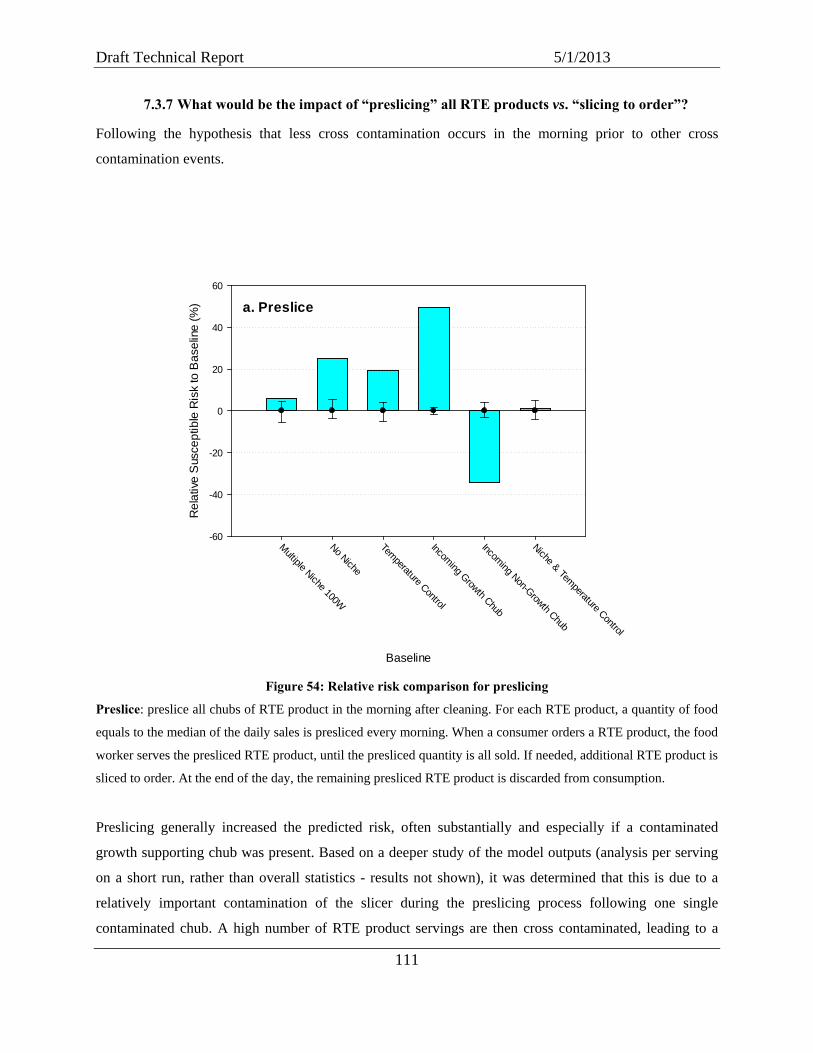
Draft Technical Report 5/1/2013
111
7.3.7 What would be the impact of “preslicing” all RTE products vs. “slicing to order”?
Following the hypothesis that less cross contamination occurs in the morning prior to other cross
contamination events.
Figure 54: Relative risk comparison for preslicing
Preslice: preslice all chubs of RTE product in the morning after cleaning. For each RTE product, a quantity of food
equals to the median of the daily sales is presliced every morning. When a consumer orders a RTE product, the food
worker serves the presliced RTE product, until the presliced quantity is all sold. If needed, additional RTE product is
sliced to order. At the end of the day, the remaining presliced RTE product is discarded from consumption.
Preslicing generally increased the predicted risk, often substantially and especially if a contaminated
growth supporting chub was present. Based on a deeper study of the model outputs (analysis per serving
on a short run, rather than overall statistics - results not shown), it was determined that this is due to a
relatively important contamination of the slicer during the preslicing process following one single
contaminated chub. A high number of RTE product servings are then cross contaminated, leading to a
Baseline
Multiple Niche 100W
No Niche
Temperature Control
Incoming Growth Chub
Incoming Non-Growth Chub
Niche & Temperature Control
Rel
ativ
e S
usce
ptib
le R
isk
to B
asel
ine
(%)
-60
-40
-20
0
20
40
60
a. Preslice
Draft Technical Report 5/1/2013
112
higher predicted risk. A retail deli with an incoming contaminated non-growth chub was the only baseline
situation where preslicing lead to a significantly lower predicted risk. In this situation, preslicing leads to
a distribution of the bacteria to the same category of (non-growth) RTE products rather than to various
(growth and non-growth) RTE product if sliced throughout the day. This limits the contamination of the
RTE product that supports growth that leads the predicted risk.

Draft Technical Report 5/1/2013
113
7.3.8 What would be the potential public health impact of using separate slicers and/or
separate counters for RTE products that permit growth of L. monocytogenes and for
RTE products that do not?
Rel
ativ
e S
usce
ptib
le R
isk
to B
asel
ine
(%)
-60
-40
-20
0
20
40
60
Baseline
Multiple Niche 100W
No Niche
Temperature Control
Incoming Growth Chub
Incoming Non-Growth Chub
Niche & Temperature Control
Rel
ativ
e S
usce
ptib
le R
isk
to B
asel
ine
(%)
-60
-40
-20
0
20
40
a. Separate Slicers
b. Separate Slicers and Cases
Figure 55: Relative risk comparison for separate slicers and cases
Separate Slicer: use a separate slicer for RTE products that support growth versus those that do not; Separate
Slicer Case: use a separate slicer and a separate case for RTE products that support growth versus those that do not.

Draft Technical Report 5/1/2013
114
Figure 55 shows that there was minimal impact on the predicted risk relative to the baseline associated
with establishing one slicer for RTE product that supports the growth of L. monocytogenes and another
for RTE product that does not support the growth of L. monocytogenes. The exception was the condition
where a contaminated chub did not support the growth of L. monocytogenes. Similar impacts on the
calculated relative risk were observed when separate slicers were used and the different RTE products
were put into separate deli cases. This may be related to the fact that in the baseline matrix of contacts
(Section 6.5.1), it was assumed that in larger retail deli with two slicers, one slicer is used only for deli
cheese and that the other slicer is used for deli meat and deli cheese. In the separate slicer scenario, since
one slicer would be used exclusively for high growth product, the slicer for the contaminated cheese
would be used for more products, and, as a consequence, the contaminated cheese would incidentally
contaminate more products than in the baseline, including some additional “low growth” product. The
resulting risk would be higher. Other matrix of contacts could be tested in the future.

Draft Technical Report 5/1/2013
115
7.3.9 What if food workers do not slice RTE products directly onto their gloved hands?
Baseline
Multiple Niche 100W
No Niche
Temperature Control
Incoming Growth Chub
Incoming Non-Growth Chub
Niche & Temperature Control
Rel
ativ
e S
usce
ptib
le R
isk
to B
asel
ine
(%)
-60
-40
-20
0
20
40
60
a. Not Slice on Gloves
Figure 56: Relative risk comparison for not slicing onto gloves
Do Not Slice Onto Gloves: the food worker collects the sliced RTE product directly onto a deli tissue rather than
slicing it directly onto a gloved hand, which represents the baseline condition..
Figure 56 suggests that slicing RTE product onto deli paper rather than onto gloves had little impact on
the relative risk predicted by the model. Slicing onto gloves was a behavior observed during the
observational study [28]. The model suggests that eliminating this practice would not play a major role
compared to some of the other mitigations directed at preventing cross contamination.

Draft Technical Report 5/1/2013
116
7.3.10 What is the impact of L. monocytogenes growth in retail delis?
Rel
ativ
e S
usce
ptib
le R
isk
to B
asel
ine
(%)
-60
-40
-20
0
20
40
60
a. Temperature = 5oC
Baseline
Multiple Niche 100W
No Niche
Temperature Control
Incoming Growth Chub
Incoming Non-Growth Chub
Niche & Temperature Control
Rel
ativ
e S
uscc
eptib
le R
isk
to B
asel
ine
(%)
-60
-40
-20
0
20
40
b. Temperature = -5°C (no growth)
NANA
NANA
Figure 57: Relative risk comparison for fixed temperature control
Baseline: Retail deli all RTE product in cases maintained at the actual temperatures observed in Ecosure dataset
[19];
Temp = 5°C: Retail deli all RTE products in cases consistently maintained at a temperature of 5°C (41°F); No
Growth (T = -5°C): Retail deli all RTE products in case consistently maintained at a temperature of -5°C (23°F) (no
potential L. monocytogenes growth).

Draft Technical Report 5/1/2013
117
Improving temperature controls in display cases to limit growth resulted in a lower predicted relative risk
across all retail deli types. Baseline retail delis that included temperature control as part of the baseline are
not shown. Note that the Temp = 5ºC (41°F) alternative represents an increase in the temperature for
some of the RTE products, compared to the baseline. By reducing temperature of display cases to 5ºC, the
overall predicted risk was still reduced. The “no growth” scenario (i.e., deli case temperature set to -5ºC)
results in a 20% reduction in predicted risk. This further demonstrates the importance of controlling the
growth of L. monocytogenes in RTE products, as suggested in previous risk assessments [3, 59].
7.3.11 What would be the potential public health impact of complete compliance to the
cold holding requirements for certain RTE foods in deli cases (hold at 41°F (5°C) or
less)?
Baseline
Multiple Niche 100W
No Niche
Temperature Control
Incoming Growth Chub
Incoming Non-Growth Chub
Niche & Temperature Control
Rel
ativ
e S
usce
ptib
le R
isk
to B
asel
ine
(%)
-60
-40
-20
0
20
40
60
a. Temperature <= 5oC
NANA
Figure 58: Relative risk comparison for temperature control
Temp <= 5°: Use the case temperature distribution as observed [19], but remove any temperatures greater than 5°C
(41°F). This implies that all retail delis exceeding the FDA Food Code recommendation come into compliance.

Draft Technical Report 5/1/2013
118
Unlike the previous analysis where all retail delis were set to a fixed temperature, this analysis uses the
existing temperature distribution but removes those which exceed 5ºC. The model was used to study the
effect that full compliance with the 2009 FDA Food Code [27] temperature requirements would have on
the predicted risk as compared to what Ecosure data suggests is typical practice. An approximate 10-15%
reduction in predicted risk was achieved. The effect was greatest in a retail deli without any niches. The
model predictions suggest that a reduction of the risk of listeriosis could be achieved by a better
compliance with recommended RTE product storage temperatures in the deli environment. FDA’s 2008
Retail Risk Factor Study revealed that in delis the failure to control RTE product holding temperatures
and times was the risk factor with the highest “Out of Compliance” percentage. For example, in 60% of
the 98 retail delis studied by FDA in 2008, at least one observation was made in which food requiring
temperature control was not held at 41ºF or below as specified in the FDA Food Code [18].

Draft Technical Report 5/1/2013
119
7.3.12 What would be the potential public health impact of shortening the time a RTE
product can be used in retail deli departments?
Baseline
Multiple Niche 100W
No Niche
Temperature Control
Incoming Growth Chub
Incoming Non-Growth Chub
Niche & Temperature Control
Rel
ativ
e S
usce
ptib
le R
isk
to B
asel
ine
(%)
-60
-40
-20
0
20
40
60
a. Shorten time in retail deli
Figure 59: Relative risk comparison for shortening the time a RTE product can be used in a retail deli
department
Shorten the time a RTE product can be used: shorten the length of time RTE product can be held in the retail deli
before being sold or disposed from 7 to 4 days.
Figure 59 suggests that shortening, from 7 days to 4 days, the maximum time that a refrigerated RTE
product that supports the growth of L. monocytogenes is allowed remain on-hand in the retail deli after
opening or preparation has a little effect on the predicted risk. Under the current model, the time from
when the chub is opened until it is completely sold is generally shorter than the 7-day FDA Food Code
requirement. Note that the model does not currently simulate refrigerated storage prior to the chub/deli
salad bulk being opened.

Draft Technical Report 5/1/2013
120
7.3.13 What would be the potential public health impact if all or none of the RTE products
(e.g., deli meat, deli salads, and cheese) coming into the retail deli were formulated
with growth inhibitors?
Figure 60: Relative risk comparison for growth inhibitor use
All GI: all RTE products sold that support growth are considered to have growth inhibitors; No GI: none of the
RTE products that support growth are considered to have growth inhibitors
Of all the mitigations tested, increasing or decreasing the percentage of RTE meat and poultry products
and deli salads that contain L. monocytogenes growth inhibitors consistently had the greatest impact on
the relative risk of listeriosis predicted by the model. Note that the risk scale (y-axis) is different for
Rel
ativ
e S
suce
ptib
le R
isk
to B
asel
ine
(%)
-100
-50
0
50
100
150
200
Baseline
Multiple Niche 100W
No Niche
Temperature Control
Incoming Growth Chub
Incoming Non-Growth Chub
Niche & Temperature Control
Rel
ativ
e S
usce
ptib
le R
isk
to B
asel
ine
(%)
-100
-50
0
50
100
150
b. no GI
a. all GI

Draft Technical Report 5/1/2013
121
Figure 60 than for the other figures. Using growth inhibitors in deli meats and deli salads almost
completely mitigated the risk of listeriosis – by almost 100% reduction for all risk assessment model
baselines considered in this analysis. Growth inhibitors continue to prevent growth even after the RTE
product leaves the retail deli. If all RTE meat and poultry products and deli salads contained no growth
inhibitors, then the risk assessment model predicts an almost doubled risk of listeriosis from these
products over most baseline conditions. The exception was for a contaminated growth-supporting deli
meat chub where the absolute risk of listeriosis was greatest. Therefore the percentage increase in relative
risk was more modest. This result confirms the overwhelming importance of the growth of
L. monocytogenes during retail and home storage compared to other parameters in L. monocytogenes risk
assessments, as has been consistently observed [3, 59].
7.4. Verification
Given the over parameterization in the risk assessment model, a formal calibration (e.g., minimizing some
objective function) or a validation is currently not possible. Nevertheless, some checks and controls were
done with regards to the available literature and through studies specifically developed to inform the
current risk assessment model.
7.4.1 Mass balance
Mass Balance, Transfer Matrix
Figure 61 depicts the sources of incoming and outgoing L. monocytogenes for the retail deli system.
L. monocytogenes enter the retail deli through i) contaminated incoming raw RTE products; ii) niches (as
currently written, the risk assessment model does differentiated the source of L. monocytogenes from a
niche in the retail deli versus those resulting from contaminated incoming RTE product); or iii) the
growth of L. monocytogenes on RTE product. L. monocytogenes are either on outgoing RTE product sold
to consumers, eliminated through wiping, washing and disinfection of retail deli surfaces, or disposed of
in the trash (e.g., on used gloves or expired RTE product).

Draft Technical Report 5/1/2013
122
Figure 61. Incoming and outgoing bacteria in the L. monocytogenes in retail model.
At any time, the sum of the L. monocytogenes entered in the system was equal to the sum of the
L. monocytogenes currently in the system with the sum of the L. monocytogenes that went out of the
system. The checking of this mass balance was additionally afforded a cross-check of proper functioning
of this risk assessment model. The mass balance was controlled in all scenarios described in this report.
7.4.2 Surveys of L. monocytogenes in RTE foods
While validation is preferable, survey data were used to help establish parameters within the model. Two
large data sets are available that describe the distribution of L. monocytogenes concentrations in RTE
products. The first is a study by the National Food Processors Association [14] and the second is derived
from a National Alliance for Food Safety and Security (NAFSS) study [16] [6]. Figure 62 illustrates the
upper predicted tail of the cumulative distribution function for the incoming deli products and the deli
products leaving the retail deli with niches and those without any niches (baselines). Superimposed are
the NAFSS points for deli meat, the only food groups studied. It appears that the different retail deli
baselines capture this critical portion of the distribution.
Deli Department
Niche Growth
Incoming Raw
Product(Chubs,
Salad Bulks)
Wiped, Washed,
Disinfected
Trashed(Gloves, End of Chub)
Sold

Draft Technical Report 5/1/2013
123
Figure 62: Comparison of predicted model distributions with observed retail deli observations
While this comparison should not be considered as a complete validation because various pathways could
lead to these results, this graph indicates that the model results are not inconsistent with observed data.
7.4.3 Virginia Tech mock deli
A mock retail deli study [29] was conducted where known sites were contaminated using an abiotic
surrogate (GloGermTM), the mock retail deli was operated for a fixed period, and the resulting
contaminated location recorded. Photographs under UV light were evaluated by a trained sensory panel to
estimate levels of surrogate contamination. As a manipulative study, the research directly links
contaminated sites to resulting contaminated locations. Early results from this research were used to
identify missing transfer events within the cross contamination model. Results are shown in Figure 63,
with the color intensity and size of the circle indicating the amount of GloGermTM transfer from an
initially contaminated site to another site in the deli. In general, initial glove and initial slicer blade
contamination spread the surrogate across the most sites. This study serves as a validation of the
conceptual model shown in Figure 4 and mass transfers illustrated in Figure 63.

Draft Technical Report 5/1/2013
124
Figure 63: Mock retail deli results [29]. Size and color intensity indicate amount of surrogate transferred
from source to recipient location.
7.4.4 Cornell University expert elicitation
Hoelzer et al. [31] published an expert elicitation study on L. monocytogenes transfer within retail delis.
Table 17 presents the major conclusions and compares these to the conceptual cross contamination model.
The first four columns are adapted from the authors’ paper. The “Median Result” represents the
percentage of experts who believe that the given transfer can occur. The “Percent Very Confident
Experts” indicates a self-reported degree of confidence in their answers. The final column added for this
report represents whether a given transfer can occur within the model.
Floor Drain
Gloves
Blade
Meat Chub
Prep Table
Door Handle
Floo
r D
Glo
ves
Bla
de
Mea
t Ch
Pre
p Ta
Han
ds
Contaminated Source Location
Reci
pien
t Loc
atio
n
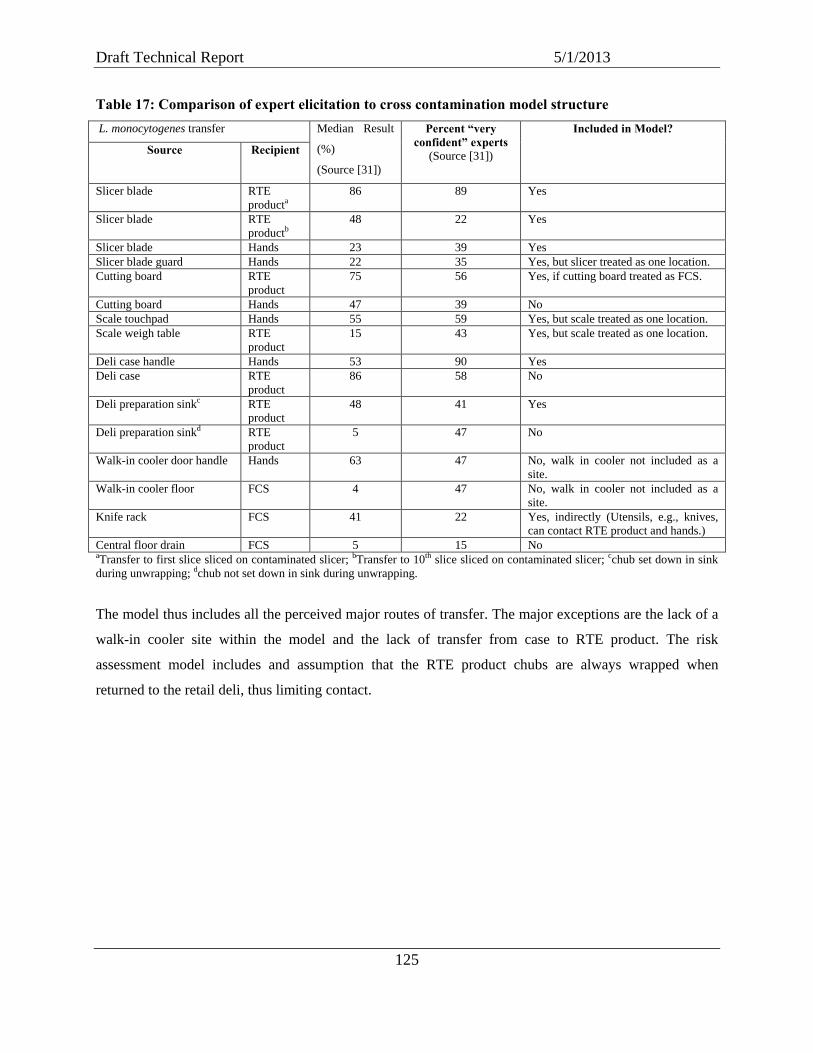
Draft Technical Report 5/1/2013
125
Table 17: Comparison of expert elicitation to cross contamination model structure L. monocytogenes transfer Median Result
(%)
(Source [31])
Percent “very confident” experts
(Source [31])
Included in Model?
Source Recipient
Slicer blade RTE producta
86 89 Yes
Slicer blade RTE productb
48 22 Yes
Slicer blade Hands 23 39 Yes Slicer blade guard Hands 22 35 Yes, but slicer treated as one location. Cutting board RTE
product 75 56 Yes, if cutting board treated as FCS.
Cutting board Hands 47 39 No Scale touchpad Hands 55 59 Yes, but scale treated as one location. Scale weigh table RTE
product 15 43 Yes, but scale treated as one location.
Deli case handle Hands 53 90 Yes Deli case RTE
product 86 58 No
Deli preparation sinkc RTE product
48 41 Yes
Deli preparation sinkd RTE product
5 47 No
Walk-in cooler door handle Hands 63 47 No, walk in cooler not included as a site.
Walk-in cooler floor FCS 4 47 No, walk in cooler not included as a site.
Knife rack FCS 41 22 Yes, indirectly (Utensils, e.g., knives, can contact RTE product and hands.)
Central floor drain FCS 5 15 No aTransfer to first slice sliced on contaminated slicer; bTransfer to 10th slice sliced on contaminated slicer; cchub set down in sink during unwrapping; dchub not set down in sink during unwrapping.
The model thus includes all the perceived major routes of transfer. The major exceptions are the lack of a
walk-in cooler site within the model and the lack of transfer from case to RTE product. The risk
assessment model includes and assumption that the RTE product chubs are always wrapped when
returned to the retail deli, thus limiting contact.

Draft Technical Report 5/1/2013
126
8. Summary of Risk Assessment Results
This QRA provides information on the predicted risk of listeriosis associated with the consumption of
RTE foods prepared and sold in the deli of a retail food store and examines how the predicted risk may be
impacted by different practices in a retail deli (e.g., sanitation, temperature control, and worker behavior).
8.1. Predictions of Absolute Risk
The predicted risk of listeriosis per serving of RTE food (hereinafter referred as “absolute risk”37) was
evaluated for two U.S. populations: 1) the “susceptible population” (e.g., older adults, fetuses, newborns,
and those who have immune-compromising conditions, as defined by FAO/WHO [59]); and 2) the
remaining U.S. population (i.e., referred to as the “general population” in this QRA). Table 18 shows the
predicted absolute risk to the two populations and six different baseline conditions that may characterize a
retail deli and the RTE food it serves at different times over the course of operations. The baseline
conditions are:
1) a retail deli with multiple niches or environmental transfers that regularly releases
L. monocytogenes to food contact surfaces;
2) a retail deli with no niches or environmental L. monocytogenes transfer;
3) a retail deli with no niche and with an incoming RTE product more highly contaminated with
L. monocytogenes than current average FSIS inspected plant data indicate and the incoming
contaminated RTE product supports growth;
4) a retail deli with no niche and with an incoming RTE product more highly contaminated with
L. monocytogenes than current average FSIS inspected plant data indicate and the incoming
contaminated RTE product does not support growth;
5) a retail deli with multiple niches and compliant with the 2009 FDA Food Code guidance for
temperature control (≤41°F); and,
6) a retail deli without any niches and with compliant temperature control (≤41°F).
In general, across all six baseline conditions, the predicted absolute risk for the susceptible population is
much higher compared to the general population (Table 18). This result is expected because of the
37 When interpreting the results, it is important to keep in mind that the specific values used in the QRA to characterize the baseline conditions are merely representative of a range of values that could possibly occur. For example, not all retail deli niches will transfer a mean of 100 cfu on a weekly frequency, as modeled in the “Multiple Niche 100W” baseline. Also, not all incoming contaminated product will have a mean contamination of -5 log10 cfu/g as the incoming product baselines are modeled. The range of values used in the models for various scenarios are evaluated through the sensitivity analysis discussed in Section 7.2.1.
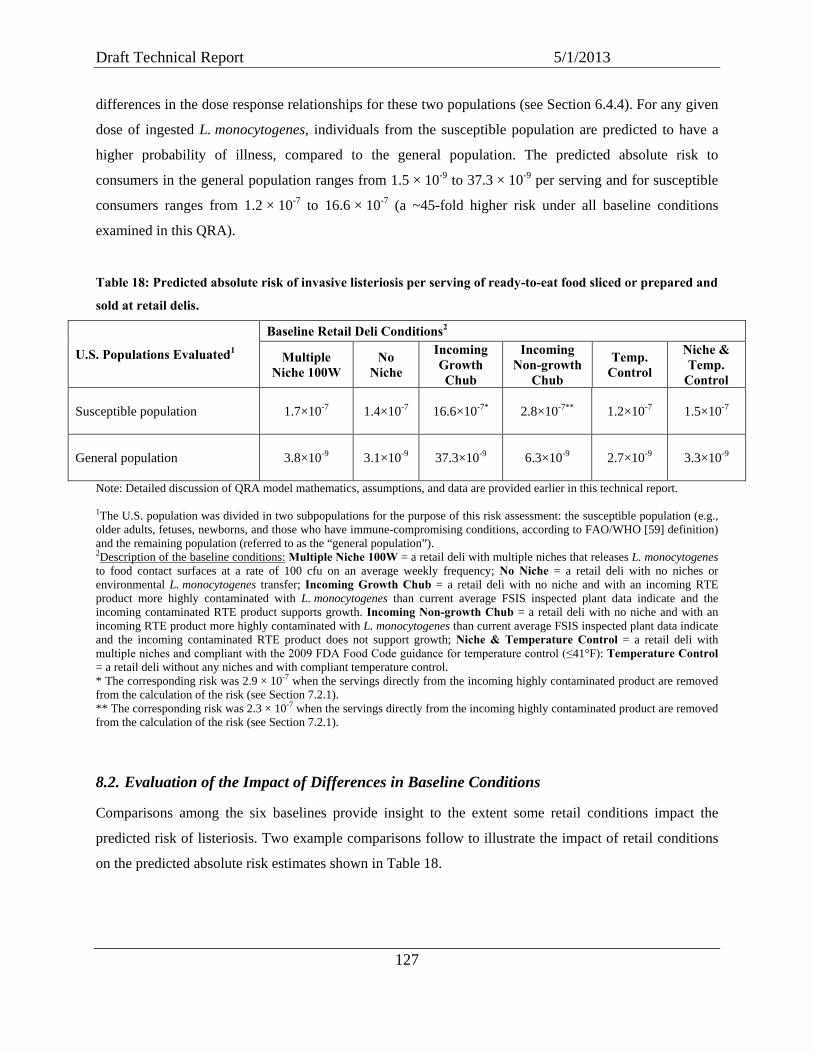
Draft Technical Report 5/1/2013
127
differences in the dose response relationships for these two populations (see Section 6.4.4). For any given
dose of ingested L. monocytogenes, individuals from the susceptible population are predicted to have a
higher probability of illness, compared to the general population. The predicted absolute risk to
consumers in the general population ranges from 1.5 × 10⁻⁹ to 37.3 × 10⁻⁹ per serving and for susceptible
consumers ranges from 1.2 × 10⁻⁷ to 16.6 × 10⁻⁷ (a ~45-fold higher risk under all baseline conditions
examined in this QRA).
Table 18: Predicted absolute risk of invasive listeriosis per serving of ready-to-eat food sliced or prepared and
sold at retail delis.
U.S. Populations Evaluated1
Baseline Retail Deli Conditions2
Multiple Niche 100W
No Niche
Incoming Growth Chub
Incoming Non-growth
Chub
Temp. Control
Niche & Temp.
Control Susceptible population
1.7×10⁻⁷ 1.4×10⁻⁷ 16.6×10-7* 2.8×10-7** 1.2×10⁻⁷ 1.5×10⁻⁷
General population
3.8×10⁻⁹ 3.1×10⁻⁹ 37.3×10⁻⁹ 6.3×10⁻⁹ 2.7×10⁻⁹ 3.3×10⁻⁹
Note: Detailed discussion of QRA model mathematics, assumptions, and data are provided earlier in this technical report. 1The U.S. population was divided in two subpopulations for the purpose of this risk assessment: the susceptible population (e.g., older adults, fetuses, newborns, and those who have immune-compromising conditions, according to FAO/WHO [59] definition) and the remaining population (referred to as the “general population”). 2Description of the baseline conditions: Multiple Niche 100W = a retail deli with multiple niches that releases L. monocytogenes to food contact surfaces at a rate of 100 cfu on an average weekly frequency; No Niche = a retail deli with no niches or environmental L. monocytogenes transfer; Incoming Growth Chub = a retail deli with no niche and with an incoming RTE product more highly contaminated with L. monocytogenes than current average FSIS inspected plant data indicate and the incoming contaminated RTE product supports growth. Incoming Non-growth Chub = a retail deli with no niche and with an incoming RTE product more highly contaminated with L. monocytogenes than current average FSIS inspected plant data indicate and the incoming contaminated RTE product does not support growth; Niche & Temperature Control = a retail deli with multiple niches and compliant with the 2009 FDA Food Code guidance for temperature control (≤41°F): Temperature Control = a retail deli without any niches and with compliant temperature control. * The corresponding risk was 2.9 × 10⁻⁷ when the servings directly from the incoming highly contaminated product are removed from the calculation of the risk (see Section 7.2.1). ** The corresponding risk was 2.3 × 10⁻⁷ when the servings directly from the incoming highly contaminated product are removed from the calculation of the risk (see Section 7.2.1).
8.2. Evaluation of the Impact of Differences in Baseline Conditions
Comparisons among the six baselines provide insight to the extent some retail conditions impact the
predicted risk of listeriosis. Two example comparisons follow to illustrate the impact of retail conditions
on the predicted absolute risk estimates shown in Table 18.

Draft Technical Report 5/1/2013
128
Temperature Control:
A comparison of retail delis that do not have niches or environmental transfer of L. monocytogenes (“No
Niche” column) to those that also ensure storage temperatures are maintained at ≤41°F (“Temp. Control”
column), results in a reduction in the predicted absolute risk (from 1.4 × 10⁻⁷ to 1.2 × 10⁻⁷ for the
susceptible population). A similar reduction (i.e., from 1.7 × 10⁻⁷ to 1.5 × 10⁻⁷ for the susceptible
population) was predicted for retail delis with niches (“Multiple Niche 100W” column) when compared to
those with niches that also maintained strict temperature control (“Niche & Temp. Control” column). The
importance of the temperature control within a baseline condition is further illustrated in the Scenario
Analysis section below.
L. monocytogenes on Incoming RTE Products:
A comparison of retail delis that do not have niches or environmental transfer of L. monocytogenes (“No
Niche” column) to similar retail delis that also have more highly contaminated incoming RTE products
(whether or not they support growth) provides information on the increased predicted risk from both the
highly contaminated incoming product and those products subsequently cross contaminated in the deli.
When the incoming highly contaminated RTE product is one that does not support the growth of
L. monocytogenes the predicted absolute risk increases from 1.4 ×10⁻⁷ to 2.8 × 10⁻⁷ for the susceptible
population (compare “No Niche” with “Incoming Non-growth Chub”; Table 18). When the highly
contaminated incoming RTE product is one that supports the growth of L. monocytogenes, the predicted
absolute risk increases to 16.6 × 10⁻⁷ for the susceptible population (compare “No Niche” with “Incoming
Growth Chub”). The predicted absolute risk of product from stores that have a highly contaminated
incoming RTE product that supports growth of L. monocytogenes is 6-times higher than the risk from
stores that have a highly contaminated incoming RTE product that does not support growth of
L. monocytogenes (16.6 × 10⁻⁷ vs. 2.8 × 10⁻⁷).
However, when the servings directly associated with the incoming highly contaminated product are
removed from the calculation of the risk, the increase in the predicted absolute risk is only the risk
associated with retail cross contamination. When the highly contaminated incoming RTE product is one
that does not support the growth of L. monocytogenes, the predicted absolute risk increases from 1.4 ×10⁻⁷
(“No niche”; Table 18) to 2.3 × 10⁻⁷ (Table 18 footnote and Section 7.2.1). This is almost the same
increase in predicted absolute risk as when all RTE servings are included in the risk calculation (i.e.,
2.8 × 10⁻⁷). Most of the increase in the predicted absolute risk of products from these stores results from
cross contamination. This result, in addition to the ones evaluating cross contamination (see Scenario

Draft Technical Report 5/1/2013
129
Analysis section below), illustrates the importance of retail cross contamination for RTE products that do
not support the growth of L. monocytogenes.
When the servings directly associated with the incoming highly contaminated product are removed from
the calculation of the risk for the highly contaminated incoming RTE product that supports the growth of
L. monocytogenes, the predicted absolute risk increases from 1.4 ×10⁻⁷ (“No niche”; Table 18) to
2.9 × 10⁻⁷ for the susceptible population (Table 18 footnote and Section 7.2.1). The slightly higher
predicted absolute risk for highly contaminated incoming RTE products that support growth (2.9 × 10⁻⁷
vs. 2.3 × 10⁻⁷) is due to growth of L. monocytogenes on the products while in the retail delis, allowing for
additional L. monocytogenes to cross contaminate other RTE foods. Most notably, however, is that the
majority of the predicted absolute risk results directly from product contaminated during processing and
growth of L. monocytogenes on these products during retail and home storage (i.e., 16.6 × 10⁻⁷ vs.
2.9 × 10⁻⁷ when only cross contaminated servings are considered). This result, in addition to the ones
evaluating the impact of growth inhibitors (see “Scenario analysis” section below), illustrates the
overwhelming importance of the growth of L. monocytogenes during retail and home storage for RTE
products that support the growth of L. monocytogenes.
Overall the baseline conditions indicate that 1) retail delis without niches and retail delis that control
temperature lead to lower predicted risk of listeriosis; and 2) retail delis with incoming RTE products that
are highly contaminated with L. monocytogenes, notably if this product supports growth, or retail delis
with niches lead to higher predicted risk of listeriosis.
8.3. Scenario Analysis
For each of the six baseline retail conditions (listed above), this QRA was used to evaluate the public
health impact of twenty-two different “what if” scenarios (i.e., changes in sanitary practices, worker
behaviors, product formulation, cross contamination, and product storage temperature and duration). In
total, this QRA provides 126 summary public health findings related to retail practices (Table 19).
In Table 19, each column represents one of six different baseline conditions that may be present in retail
delis. Each row shows the percentage change in the risk per serving for the susceptible population relative
to the baseline condition for each “what if” scenario (hereinafter referred as “relative risk”). The scenarios
are organized by those that evaluate changes in: 1) sanitation; 2) worker behavior; 3) use of growth
inhibitors; 4) cross contamination; and 5) storage temperature control. In this table, positive values
represent an increase, while negative values represent a decrease in the predicted relative risk per serving.

Draft Technical Report 5/1/2013
130
[Note: Table 19 provides a summary of the results for each scenario, relative to the baseline for only the
susceptible population. While the predicted absolute risks were different between the susceptible
populations and general population, the predicted relative change in risk is similar for both populations].
The relative effectiveness of a mitigation applied to a specific baseline condition can be assessed by
reading Table 19 down a column. The effectiveness of a single mitigation across different operating
conditions can be assessed by reading the Table 19 across each row, keeping in mind the magnitude of the
predicted risk for that scenario (shown in Table 18). Some scenarios predict that the mitigation would not
be very effective in reducing the predicted risk on a per serving basis (e.g., no contact between the glove
and the case), while others (e.g., pre-slicing) can either be slightly beneficial or highly detrimental
depending on retail deli baseline conditions.
Sanitation Related Scenarios
Sanitation practices were a key driver in reducing the predicted risk of listeriosis. When sanitation
activities were not modeled (“No Sanitation”), the predicted increase in risk could be as much as 50.2%
(i.e., under retail deli conditions in which there were niches of L. monocytogenes and lack of temperature
control to prevent growth. see “Niche & Temp. Control” column). The smallest predicted increase in risk
from omitting sanitation was 2.9% (“Incoming Growth Chub” column); in this scenario, the impact of
sanitation was overwhelmed by the additional bacteria from the incoming product and the potential
growth of L. monocytogenes while the product is in the retail deli. While no individual changes in
sanitation practices appear to substantively reduce the relative risk of listeriosis per serving of RTE food
sliced or prepared in retail delis for all baselines, the substantive increase in risk (up to 50%) when
sanitation is omitted is an indicator of the importance of sanitation at retail.
Worker Behavior Related Scenarios
The impact of QRA simulated changes to worker behavior on the change in predicted relative risk varied
depending on the baseline retail deli condition. For example, if the retail deli had multiple niches
(“Multiple Niche 100W), using separate slicers reduced the predicted relative risk by 6.3%. If workers did
not use gloves, the predicted relative risk increased (5.1 to 8.5 %). In other cases, the public health
benefits of some interventions appear to have been overwhelmed by other factors. For example the benefit
of pre-slicing product in the morning after cleaning was offset when incoming RTE products that support
the growth of L. monocytogenes were highly contaminated.

Draft Technical Report 5/1/2013
131
Growth Inhibitor Related Scenarios
Of all the scenarios tested, growth inhibitor usage had the greatest impact on the predicted relative risk.
The use of growth inhibitors in all products almost completely eliminated the predicted relative risk
(reductions ranged from 94.4 to 97.5%). This level of predicted relative risk reduction (approximately
95%) is a significant finding, given that a 100% reduction would indicate no risk. In practice, however,
not all products are amenable to incorporating growth inhibitors, and therefore these results represent
upper bounds in potential effectiveness.
The baseline scenarios consider that products in the retail deli are a mixture of products that include
growth inhibitors and products that do not. In a comparison scenario where no products in the retail deli
contained growth inhibitors (“No GI”), the predicted risk nearly doubles to between 184.1 and 191.5%, as
compared to the baselines. The only apparent exception is in the “Incoming Growth Chub” baseline,
where the estimated relative increase in risk was only 35.1%. This relatively low value is somewhat
misleading, because as mentioned above (see Table 18), the predicted absolute risk for this baseline was
already almost 10 times higher than other baselines.
These findings illustrate the importance of the growth of L. monocytogenes during retail and home storage
for RTE products that support the growth of L. monocytogenes.
Cross Contamination Related Scenarios
Table 19 shows that controlling cross contamination in retail delis is important in mitigating the risk of
listeriosis. The QRA scenarios where cross contamination does not occur in the retail deli (i.e., the
transfer coefficient for all sites and slicer were set to 0; see “Transfers and Slicer to 0” column), the
predicted relative risk reduction was significant (ranging from 9.5% and 60.8%). However, when
L. monocytogenes transfers from the slicer were not eliminated (“Transfers to 0” scenario), there was no
significant reduction in the predicted relative risk. This highlights the importance of the slicer in retail
delis as the nexus for cross contamination.
In addition to examining the relative risk values in Table 19, examining the absolute risk estimates
reported in Section 7.2 of this report provides further insight to the role that cross contamination plays in
the risk of RTE products prepared in retail delis. The absolute risk for a “No Niche” baseline when cross
contamination is eliminated (i.e., “Transfer and Slicer to 0”) is 1.1 × 10⁻⁷ (see Figure 24). The absolute
risk increases to 1.4 × 10⁻⁷ when there is cross contamination (see Table 18, “No Niche”). When an
“Incoming Non-growth Chub” is introduced to a “No Niche” retail deli where there is no cross
contamination, the risk remains essentially the same as the “No Niche, Transfer and Slicer to 0” scenario

Draft Technical Report 5/1/2013
132
(1.1 × 10⁻⁷; Figure 34), indicating that if there is no cross contamination at retail, then the introduction of
highly contaminated incoming RTE that does not support growth of L. monocytogenes does not result in
any substantive increase in risk. However, when cross contamination does occur in these situations, the
predicted absolute risk significantly increases (to 2.8 × 10⁻⁷; Table 18). This QRA illustrates that any
increase in L. monocytogenes on incoming RTE product (even those that do not support the growth of
L. monocytogenes) increases the predicted risk of listeriosis on a per serving basis as a result of cross
contamination.
Interestingly, Table 19 also shows that reducing the mean incoming L. monocytogenes levels in all RTE
foods by a factor of 2 (0.3 log10 units) significantly reduces the predicted relative risk (between 1.1 and
24.2%, see “Reduce Level” scenario). This finding suggests that a continued effort to prevent even low
levels of L. monocytogenes contamination during processing prevents illnesses from these products and
other RTE foods.
Storage Temperature and Duration Control Related Scenarios
Controlling the deli case temperature significantly reduced the predicted risk. For the scenario where the
RTE foods are held at the recommended temperature (“Temp ≤5°C”), the predicted reduction in risk is
roughly the same as the reduction associated with holding RTE foods at temperatures that completely
prevents growth of L. monocytogenes (“No Growth, T=-5°C”). This is an important finding because
maintaining products in the deli display at a temperature recommended by the FDA Food Code prevents
almost all additional risk linked to the bacterial growth in retail. These findings highlight the importance
of temperature control at retail.

Draft Technical Report 5/1/2013
133
Table 19: Predicted percent change in the risk of invasive listeriosis per serving of ready-to-eat food sliced or
prepared and sold at retail delis for the susceptible population according to various scenarios, as estimated by
the L. monocytogenes in retail delicatessens risk assessment model.
(percent change in the risk relative to the respective baseline condition) 1
Scenario
Baseline Conditions2 Multiple
Niche 100W
No Niche Incoming Growth Chub
Incoming Non-growth Chub
Temp. Control
Niche & Temp.
Control Sanitation Related Scenarios: Wash & Sanitize: Increase the effectiveness of cleaning from simply washing to washing and sanitizing.
-1.6 1.7 -0.6 2.0 -1.3 -7.6*
Clean 8 Sporadic: Double the number of sites cleaned from 4 to 8. -4.2 -4.1* -0.7 -1.9 -0.5 1.3
No Sanitation: No wiping, washing, or sanitizing. 41.3* 7.9* 2.9* 23.5* 11.9* 50.2* No Sporadic Cleaning: Clean as required by the 2009 FDA Food Code, but no additional sporadic cleanings.
3.0 -3.0 -0.4 1.7 1.7 3.5
NFCS As FCS: Workers clean deli NFCSs at same rate as FCSs -3.0 0.7 -0.6 0.3 -5.4* 0.9
Worker Behavior Related Scenarios: No Glove: Workers do not use gloves when serving customers. 5.1* 2.5 1.2 8.5* 6.0* 7.0*
Gloves Every Serving: Workers change gloves before every sale. 4.1 0.7 0.7 0.6 -0.2 0.6
No Contact Glove Case: Workers do not use their hands to open the deli case (e.g. if a floor switch is used).
-1.4 -3.4 -1.3 1.3 1.3 -0.3
Pre-slice: Workers pre-slice RTE products in the morning, after cleaning 6.0* 24.9* 49.5* -34.4* 19.2* 1.0
Separate Slicer: Workers use a separate slicer for RTE products that support growth of L. monocytogenes.
-6.3* -0.6 -1.7* 22.7* -0.8 4.6
Do Not Slice On Gloves: Workers collect the slices of RTE products on tissue paper rather than on his/her gloved hand.
1.9 1.0 0.2 3.8 -1.9 8.0*
Growth Inhibitor Related Scenarios: All GI: Reformulate all RTE products sold at the retail deli that would otherwise support L. monocytogenes growth to include growth inhibitors.
-96.0* -95.2* -97.5* -94.5* -94.4* -94.8*
No GI: Reformulate all RTE products that support L. monocytogenes growth that are sold at the retail deli to not include GI to restrict L. monocytogenes growth.
184.1* 191.5* 35.1* 190.5* 187.7* 188.9*

Draft Technical Report 5/1/2013
134
Scenario
Baseline Conditions2 Multiple
Niche 100W
No Niche Incoming Growth Chub
Incoming Non-growth Chub
Temp. Control
Niche & Temp.
Control
Cross Contamination Related Scenarios:
Transfers to 0: Cross contamination would only result from the deli slicer. -4.3 2.5 1.0 3.7 0.2 -0.3
Transfers and Slicer to 0: No cross contamination in the retail deli. -33.8* -18.6* -9.5* -60.8* -19.2* -30.4*
Reduce Level: Mean incoming L. monocytogenes concentration in all RTE products lowered from -9.2 to -9.5 log10 cfu/g.
-21.6* -24.2* -1.1 -9.8* -22.5* -15.6*
Separate Slicer Case: Workers use a separate slicer and a separate deli case for RTE products that support the growth of L. monocytogenes.
-2.5 -1.6 -1.2 21.0* -0.9 7.5*
Lower Env Cont: Reduce transfer of L. monocytogenes among RTE products, FCSs, and NFCs (i.e., reduce transfer coefficients by 50%).
-4.5 -4.4* -1.4 0.4 1.6 0.9
Storage Temperature and Duration Control Related Scenarios: Temp = 5°C: Set the retail deli case temperature to 5°C (41°F) (i.e., in compliance with the 2009 FDA Food Code) for all delis, instead of using the deli case temperatures reported by Ecosure.
-4.8 -14.3* -8.1* -2.8 NA NA
No Growth (T=-5°C): At this temperature, no L. monocytogenes growth will occur. -16.5* -21.3* -18.2* -5.7* NA NA
Temp ≤ 5°C: Use only the retail deli case temperatures observed in the Ecosure dataset at or below 5°C (41°F).
-9.0* -16.3* -12.3* -8.2* NA NA
Shorten Time in Retail Delis: Reduce the length of time RTE products are held before they are sold or disposed from 7 to 4 days.
-2.5 3.3 -1.2 2.0 -0.2 1.7
Readers should refer to the body of the document for further details on the assumptions, model, data, baselines and scenarios. See Table 18 for the predicted absolute risk of the baseline conditions.
* bold: Outside the 95% confidence interval for the median. NFCS = non-food contact surface; FCS = food contact surface; Temp. = Temperature; NA= not applicable to this scenario; Chub refers to bulk product (deli meat or cheese) before it is sliced. 1the US population was split in two subpopulations for purpose of this risk assessment: the susceptible population (e.g., older adults, fetuses, newborns, and those who have immune-compromising conditions, according to FAO/WHO 2004 definition) and the remaining population. The results for the susceptible population only are presented as this population comprises 80-98% of the public health burden for listeriosis 2Description of the baseline conditions: Multiple Niche 100W = a retail deli with multiple niches that releases L. monocytogenes to food contact surfaces at a rate of 100 cfu on an average weekly frequency; No Niche = a retail deli with no niches or environmental L. monocytogenes transfer; Incoming Growth Chub = a retail deli with no niche and with an incoming RTE product more highly contaminated with L. monocytogenes than current average FSIS inspected plant data indicate and the incoming contaminated RTE product supports growth. Incoming Non-growth Chub = a retail deli with no niche and with an incoming RTE product more highly contaminated with L. monocytogenes than current average FSIS inspected plant data indicate and the incoming contaminated RTE product does not support growth; Niche & Temperature Control = a retail deli with multiple niches and compliant with the 2009 FDA Food Code guidance for temperature control (≤41°F): Temperature Control = a retail deli without any niches and with compliant temperature control.

Draft Technical Report 5/1/2013
135
9. Conclusions
This QRA represents the first large-scale effort to model L. monocytogenes cross contamination at retail.
The risk assessment model contributes to our understanding of L. monocytogenes transmission, survival,
and growth in the retail environment and was used to evaluate how retail practices may impact the
predicted risk of listeriosis. The approach used was to evaluate the public health effect of various
mitigations under six different baseline conditions that may characterize a retail deli and the RTE food its
serves.
The key findings from this assessment of risk of listeriosis associated with RTE foods prepared and
served in retail deli operations include:
• Control Growth. Employing practices that prevent bacterial growth dramatically reduced the
predicted risk of listeriosis, as observed in other L. monocytogenes risk assessments. The use of
growth inhibitors for suitable products prevents growth of L. monocytogenes in RTE foods both
at retail and during consumer home storage, leading to an overall dramatic reduction in the
predicted risk of listeriosis (ca. 95%, see table). The strict control of temperature during
refrigerated storage in retail delis did reduce the predicted risk. The impact of this control is
nevertheless lower as it reduces growth only during this specific storage (5-20% reduction
according to the baseline and the scenario) (cf. “Temperature Control” baseline and growth
inhibitor scenarios).
• Control Cross Contamination. Cross contamination of L. monocytogenes in the retail
environment dramatically increases the predicted risk of listeriosis. Cross contamination during
the routine operation of the retail deli is not amenable to a simple solution (cf. “Transfers and
Slicer to 0” scenarios).
• Control Contamination at its Source. Increasing the concentration and transfers of
L. monocytogenes from incoming products, the environment, or niches directly increases the
predicted risk of illness. Increasing L. monocytogenes concentration in incoming product
increased the predicted risk of listeriosis whether or not the contaminated RTE product itself
supported growth. The increase in predicted risk was greater when the equivalent contamination
occurred on product that supported the growth of L. monocytogenes (cf. predicted risks for
“Incoming Growth Chub” baseline and “Incoming Non-growth Chub” baseline, as well as
“Reduce Level” scenarios).

Draft Technical Report 5/1/2013
136
• Continue Sanitation. Sanitation practices that eliminate L. monocytogenes from the deli area
food contact surfaces results in a reduction in the predicted risk of illness. Cleaning and sanitizing
food contact surfaces reduced the predicted L. monocytogenes levels in the deli area (cf. “No
Sanitation” scenario). Wearing gloves while serving customers reduces the estimated risk of
listeriosis.
• Identify Key Routes of Contamination. The slicer (for deli meats and cheeses) and the salad
utensils (for deli salads) are sources of L. monocytogenes cross contamination to RTE foods.
Control of L. monocytogenes cross contamination at these points during retail preparation and
handling of RTE foods reduced the predicted risk of listeriosis (cf. “Transfers to 0” versus
“Transfers and Slicer to 0” scenarios).
In summary, this risk assessment improves our understanding of L. monocytogenes in the retail deli and
should encourage improvements to retail food safety practices and mitigation strategies to further control
L. monocytogenes in RTE foods. The ‘what if’ scenarios modeled in this risk assessment provide insight
on how cross contamination, sanitary practices, and temperature control impact the predicted risk of
listeriosis. This risk assessment is based on an extensive amount of information gathered through
partnerships with academia and input from stakeholders. Additional data would be useful to refine and
improve the predictions made by the “Virtual Deli” model. Additional data would be useful to further
explore how more specific retail practices and conditions (e.g., equipment design) impact the risk of
listeriosis.
Draft Technical Report 5/1/2013
137
References
1. Federal Food Safety Working Group, The Federal Food Safety Working Group Progress Report,
2011. p. 31.Available from: http://www.whitehouse.gov/sites/default/files/fswg_report_final.pdf.
2. Scallan, E., Hoekstra, R.M., Angulo, F.J., Tauxe, R.V., Widdowson, M.A., Roy, S.L., Jones, J.L.,
and Griffin, P.M., Foodborne illness acquired in the United States—major pathogens. Emerging
Infectious Diseases, 2011. 17(1): p. 7-12.
3. FDA/FSIS, Quantitative assessment of relative risk to public health from foodborne Listeria
monocytogenes among selected categories of ready-to-eat foods, 2003, Food and Drug
Administration, United States Department of Agriculture, Centers for Disease Control and
Prevention. p. 541.Available from:
http://www.fda.gov/Food/FoodScienceResearch/RiskSafetyAssessment/ucm183966.htm.
4. FDA. Current FDA Activities Related to the Listeria monocytogenes. Action Plan February 6,
2008. 2008 [cited 2012 June, 14]; Available from:
http://www.fda.gov/Food/FoodScienceResearch/RiskSafetyAssessment/ucm208995.htm.
5. FSIS, FSIS Risk Assessment for Listeria monocytogenes in deli meats, 2003, FSIS.Available
from: http://www.fsis.usda.gov/PDF/Lm_Deli_Risk_Assess_Final_2003.pdf.
6. FSIS, FSIS Comparative Risk Assessment for Listeria monocytogenes in Ready-to-eat Meat and
Poultry Deli Meats, 2010: Washington, DC. p. 58.Available from:
http://www.fsis.usda.gov/PDF/Comparative_RA_Lm_Report_May2010.pdf.
7. FSIS, Compliance Guideline: Controlling Listeria monocytogenes in Post-Lethality Exposed
Ready-to-Eat Meat and Poultry Products. [April 2006/revised Nov. 2012; Draft for public
comment through November 16, 2012, 2012.
8. FSIS. The FSIS Microbiological Testing Program for Ready-to-Eat (RTE) Meat and Poultry
Products, 1990–2011. 2012 [cited 2013 March, 26]; Available from:
http://www.fsis.usda.gov/Science/Micro_Testing_RTE/.
9. CDC. Incidence of laboratory-confirmed bacterial and parasitic infections in 2009† and
postdiarrheal hemolytic uremic syndrome (HUS) in 2008, by year and pathogen, Foodborne
Diseases Active Surveillance Network (FoodNet), United States. 2009 [cited 2013 March, 26];
Available from:
http://www.cdc.gov/foodnet/factsandfigures/2009/Table1b_all_incidence_96-09.pdf.
10. Silk, B.J., Date, K.A., Jackson, K.A., Pouillot, R., Holt, K.G., Graves, L.M., Ong, K.L., Hurd, S.,
Meyer, R., Marcus, R., Shiferaw, B., Norton, D.M., Medus, C., Zansky, S.M., Cronquist, A.B.,
Henao, O.L., Jones, T.F., Vugia, D.J., Farley, M.M., and Mahon, B.E., Invasive Listeriosis in the

Draft Technical Report 5/1/2013
138
Foodborne Diseases Active Surveillance Network (FoodNet), 2004-2009: Further Targeted
Prevention Needed for Higher-Risk Groups. Clinical Infectious Diseases, 2012. 54 Suppl 5: p.
S396-404.
11. CDC, Preliminary FoodNet Data on the Incidence of Infection with Pathogens Transmitted
Commonly Through Food --- 10 States, 2009. Morbidity and Mortality Weekly Report, 2010.
59(14): p. 418-422.
12. CDC. CDC Wonder, the Healthy People 2010 Database. 2011 [cited 2013 March, 26]; Available
from: http://wonder.cdc.gov/data2010/focus.htm.
13. CDC. Trends in Foodborne Illness in the United States. 2013 [cited 2013 March, 26]; Available
from: http://www.cdc.gov/foodborneburden/trends-in-foodborne-illness.html.
14. Gombas, D.E., Chen, Y., Clavero, R.S., and Scott, V.N., Survey of Listeria monocytogenes in
ready-to-eat foods. Journal of Food Protection, 2003. 66(4): p. 559-69.
15. Draughon, A.F. A collaborative analysis/risk assessment of Listeria monocytogenes in
ready-to-eat processed meat and poultry collected in four FoodNet states. in International
Association for Food Protection 93rd Annual Meeting. 2006. Calgary, Alberta, Canada.
16. Endrikat, S., Gallagher, D., Pouillot, R., Hicks Quesenberry, H., Labarre, D., Schroeder, C.M.,
and Kause, J., A Comparative Risk Assessment for Listeria monocytogenes in Prepackaged
versus Retail-Sliced Deli Meat. Journal of Food Protection, 2010. 73(4): p. 612-9.
17. Pradhan, A.K., Ivanek, R., Grohn, Y.T., Bukowski, R., Geornaras, I., Sofos, J.N., and Wiedmann,
M., Quantitative Risk Assessment of Listeriosis-Associated Deaths Due to Listeria
monocytogenes Contamination of Deli Meats Originating from Manufacture and Retail. Journal
of Food Protection, 2010. 73(4): p. 620-30.
18. FDA, FDA Report on the Occurrence of Foodborne Illness Risk Factors in Selected Institutional
Foodservice, Restaurant, and Retail Food Store Facility Types (2009), 2010.Available from:
http://www.fda.gov/downloads/Food/FoodSafety/RetailFoodProtection/FoodborneIllnessandRisk
FactorReduction/RetailFoodRiskFactorStudies/UCM224682.pdf.
19. EcoSure. 2007 U.S. Cold Temperature Evaluation: Design and Summary Pages. 2008 [cited
2008 June, 4]; Available from: http://foodrisk.org/exclusives/EcoSure/.
20. FDA, FDA Trend Analysis Report on the Occurrence of Foodborne Illness Risk Factors in
Selected Institutional Foodservice, Restaurant, and Retail Food Store Facility Types (1998 –
2008), 2010. p. 156.Available from:
http://www.fda.gov/downloads/Food/FoodSafety/RetailFoodProtection/FoodborneIllnessandRisk
FactorReduction/RetailFoodRiskFactorStudies/UCM224152.pdf.

Draft Technical Report 5/1/2013
139
21. Perez-Rodriguez, F., Valero, A., Todd, E.C., Carrasco, E., Garcia-Gimeno, R.M., and Zurera, G.,
Modelling transfer of Escherichia coli O157:H7 and Staphylococcus aureus during slicing of a
cooked meat product. Meat Science, 2007. 76(4): p. 692-699.
22. Vorst, K.L., Todd, E.C., and Ryser, E.T., Transfer of Listeria monocytogenes during slicing of
turkey breast, bologna, and salami with simulated kitchen knives. Journal of Food Protection,
2006. 69(12): p. 2939-46.
23. Vorst, K.L., Todd, E.C., and Rysert, E.T., Transfer of Listeria monocytogenes during mechanical
slicing of turkey breast, bologna, and salami. Journal of Food Protection, 2006. 69(3): p. 619-26.
24. Sauders, B.D., Sanchez, M.D., Rice, D.H., Corby, J., Stich, S., Fortes, E.D., Roof, S.E., and
Wiedmann, M., Prevalence and molecular diversity of Listeria monocytogenes in retail
establishments. Journal of Food Protection, 2009. 72(11): p. 2337-49.
25. Hoelzer, K., Sauders, B.D., Sanchez, M.D., Olsen, P.T., Pickett, M.M., Mangione, K.J., Rice,
D.H., Corby, J., Stich, S., Fortes, E.D., Roof, S.E., Grohn, Y.T., Wiedmann, M., and Oliver, H.F.,
Prevalence, distribution, and diversity of Listeria monocytogenes in retail environments, focusing
on small establishments and establishments with a history of failed inspections. Journal of Food
Protection, 2011. 74(7): p. 1083-95.
26. Pradhan, A.K., Ivanek, R., Grohn, Y.T., Bukowski, R., and Wiedmann, M., Comparison of Public
Health Impact of Listeria monocytogenes Product-to-Product and Environment-to-Product
Contamination of Deli Meats at Retail. Journal of Food Protection, 2011. 74(11): p. 1860-8.
27. FDA, Food Code 2009, 2009: College Park, MD, USA.Available from:
http://www.fda.gov/downloads/Food/FoodSafety/RetailFoodProtection/FoodCode/FoodCode200
9/UCM189448.pdf.
28. Lubran, M.B., Pouillot, R., Bohm, S., Calvey, E.M., Meng, J., and Dennis, S., Observational
Study of Food Safety Practices in Retail Deli Departments. Journal of Food Protection, 2010.
73(10): p. 1849-1857.
29. Maitland, J., Boyer, R., Gallagher, D., Duncan, S., Bauer, N., Kause, J., and Eifert, J., Tracking
Cross Contamination Transfer Dynamics at a Mock Retail Deli Market using GloGermTM.
Journal of Food Protection, 2013. 76(2): p. 272-282.
30. Gibson, K.E., Koo, O.K., O'Bryan, C.A., Neal, J.A., Ricke, S.C., and Crandall, P.G., Observation
and relative quantification of cross-contamination within a mock retail delicatessen environment.
Food Control, 2013. 31(1): p. 116-124.
31. Hoelzer, K., Oliver, H.F., Kohl, L.R., Hollingsworth, J., Wells, M.T., and Wiedmann, M.,
Structured expert elicitation about Listeria monocytogenes cross-contamination in the
environment of retail deli operations in the United States. Risk analysis, 2012. 32(7): p. 1139-56.

Draft Technical Report 5/1/2013
140
32. American Chemical Society, Understanding Risk Analysis: A Short Guide for Health, Safety, and
Environmental Policy Making, 1998, American Chemical Society: Washington, DC.Available
from: http://www.rff.org/rff/publications/upload/14418_1.pdf.
33. Ivanek, R., Grohn, Y.T., Wiedmann, M., and Wells, M.T., Mathematical model of Listeria
monocytogenes cross-contamination in a fish processing plant. Journal of Food Protection, 2004.
67(12): p. 2688-97.
34. Mylius, S.D., Nauta, M.J., and Havelaar, A.H., Cross-contamination during food preparation: a
mechanistic model applied to chicken-borne Campylobacter. Risk analysis, 2007. 27(4): p.
803-13.
35. Schaffner, D.W., Mathematical frameworks for modelling Listeria cross-contamination in
food-processing plants. Journal of Food Science, 2004. 69(6): p. R155-R159.
36. Mokhtari, A. and Jaykus, L.A., Quantitative exposure model for the transmission of norovirus in
retail food preparation. International Journal of Food Microbiology, 2009. 133(1-2): p. 38-47.
37. Hoelzer, K., Pouillot, R., Gallagher, D., Silverman, M.B., Kause, J., and Dennis, S., Estimation of
Listeria monocytogenes transfer coefficients and efficacy of bacterial removal through cleaning
and sanitation. International Journal of Food Microbiology, 2012. 157(2): p. 267-277.
38. Codex alimentarius Commission, Principles and guidelines for the conduct of microbiological
risk assessment, 1999, FAO edition: Rome. p. 6.Available from:
http://www.codexalimentarius.net/download/standards/357/CXG_030e.pdf.
39. European Commission, Updated Opinion of the Scientific Steering Committee on Harmonisation
of Risk Assessment Procedures, 2003, EC, . p. 5.Available from:
http://ec.europa.eu/food/fs/sc/ssc/out355_en.pdf.
40. Frey, H.C., Quantitative Analysis of Uncertainty and Variability in Environmental Policy
Making, 1992, American Association for the Advancement of Science / U.S. Environmental
Protection Agency.Available from: www4.ncsu.edu/~frey/reports/frey_92.pdf.
41. Nauta, M., The Modular Process Risk Model (MPRM): a structured approach to food chain
exposure assessment, in Microbial Risk Analysis of Foods, Schaffner, D.W., Editor 2008, ASM
Press: Washington, D.C. p. 99-136.
42. Nauta, M.J., A modular process risk model structure for quantitative microbiological risk
assessment and its application in an exposure assessment of Bacillus Cereus in a REPFED, 2001,
RIVM: Bilthoven.Available from: http://www.rivm.nl/bibliotheek/rapporten/149106007.pdf.
43. Aziza, F., Mettler, E., Daudin, J.J., and Sanaa, M., Stochastic, compartmental, and dynamic
modeling of cross-contamination during mechanical smearing of cheeses. Risk analysis, 2006.
26(3): p. 731-745.

Draft Technical Report 5/1/2013
141
44. Keeratipibul, S. and Lekroengsin, S., Risk assessment of Listeria spp. contamination in the
production line of ready-to-eat chicken meat products. Journal of Food Protection, 2008. 71(5):
p. 946-52.
45. den Aantrekker, E.D., Recontamination in food processing: quantitative modelling for risk
assessment, 2002, Wageningen University. p. 1-128.
46. den Aantrekker, E.D., Beumer, R.R., van Gerwen, S.J., Zwietering, M.H., van, S.M., and Boom,
R.M., Estimating the probability of recontamination via the air using Monte Carlo simulations.
International Journal of Food Microbiology, 2003. 87(1-2): p. 1-15.
47. Kusumaningrum, H.D., van Asselt, E.D., Beumer, R.R., and Zwietering, M.H., A quantitative
analysis of cross-contamination of Salmonella and Campylobacter spp. via domestic kitchen
surfaces. Journal of Food Protection, 2004. 67(9): p. 1892-903.
48. Yang, H., Mokhtari, A., Jaykus, L.A., Morales, R.A., Cates, S.C., and Cowen, P., Consumer
phase risk assessment for Listeria monocytogenes in deli meats. Risk analysis, 2006. 26(1): p.
89-103.
49. Perez-Rodriguez, F., Valero, A., Carrasco, E., Garcia, R.M., and Zurera, G., Understanding and
modelling bacterial transfer to foods: a review. Trends in Food Science & Technology, 2008.
19(3): p. 131-144.
50. Montville, R. and Schaffner, D.W., Inoculum size influences bacterial cross contamination
between surfaces. Applied and Environmental Microbiology, 2003. 69(12): p. 7188-93.
51. Fravalo, P., Laisney, M.-J., Gillard, M.-O., Salvat, G., and Chemaly, M., Campylobacter transfer
from naturally contaminated chicken thighs to cutting boards is inversely related to initial load.
Journal of Food Protection, 2009. 72(5): p. 1836-40.
52. Rodriguez, A., Autio, W.R., and McLandsborough, L.A., Effects of inoculation level, material
hydration, and stainless steel surface roughness on the transfer of Listeria monocytogenes from
inoculated bologna to stainless steel and high-density polyethylene. Journal of Food Protection,
2007. 70(6): p. 1423-8.
53. Nauta, M.J., "Campylobacter transfer from naturally contaminated chicken thighs to cutting
boards is inversely related to initial load," a comment on: J. Food Prot. 72(9): 1836-1840 (2009).
Journal of Food Protection, 2010. 73(1): p. 6-7; author reply 7-8.
54. Sheen, S. and Hwang, C.A., Modeling transfer of Listeria monocytogenes from slicer to deli meat
during mechanical slicing. Foodborne Pathogens and Disease, 2008. 5(2): p. 135-46.
55. Aarnisalo, K., Sheen, S., Raaska, L., and Tamplin, M., Modelling transfer of Listeria
monocytogenes during slicing of 'gravad' salmon. International Journal of Food Microbiology,
2007. 118(1): p. 69-78.
Draft Technical Report 5/1/2013
142
56. Keskinen, L.A., Todd, E.C., and Ryser, E.T., Transfer of surface-dried Listeria monocytogenes
from stainless steel knife blades to roast turkey breast. Journal of Food Protection, 2008. 71(1):
p. 176-81.
57. Keskinen, L.A., Todd, E.C., and Ryser, E.T., Impact of bacterial stress and biofilm-forming
ability on transfer of surface-dried Listeria monocytogenes during slicing of delicatessen meats.
International Journal of Food Microbiology, 2008. 127(3): p. 298-304.
58. Sheen, S., Modeling surface transfer of Listeria monocytogenes on salami during slicing. Journal
of Food Science, 2008. 73(6): p. E304-E311.
59. FAO/WHO, Risk assessment of Listeria monocytogenes in ready to eat foods - Technical report,
in Microbiological Risk Assessment Series, no 52004, Food and Agriculture Organization of the
United Nations and World Health Organization: Rome. p. 269.Available from:
http://www.fao.org/docrep/010/y5394e/y5394e00.htm.
60. Ross, T. and McMeekin, T.A., Modeling microbial growth within food safety risk assessments.
Risk analysis, 2003. 23(1): p. 179-97.
61. van Gerwen, S.J.C. and Zwietering, M.H., Growth and inactivation models to be used in
quantitative risk assessments. Journal of Food Protection, 1998. 61(11): p. 1541-1549.
62. Buchanan, R.L., Whiting, R.C., and Damert, W.C., When is simple good enough: a comparison
of the Gompertz, Baranyi, and three-phase linear models for fitting bacterial growth curves. Food
Microbiology, 1997. 14(4): p. 313-326.
63. Yule, G.U., The growth of population and the factors which control it. Journal of the Royal
Statistical Society: Series B, 1925. 25(1): p. 1-58.
64. Vose, D., Risk Analysis: a quantitative guide. third edition ed2008, Chichester, UK: Wiley and
Sons.
65. Zwietering, M.H., de Wit, J.C., and Notermans, S., Application of predictive microbiology to
estimate the number of Bacillus cereus in pasteurised milk at the point of consumption.
International Journal of Food Microbiology, 1996. 30(1-2): p. 55-70.
66. Augustin, J.C., Zuliani, V., Cornu, M., and Guillier, L., Growth rate and growth probability of
Listeria monocytogenes in dairy, meat and seafood products in suboptimal conditions. Journal of
Applied Microbiology, 2005. 99(5): p. 1019-42.
67. Ross, T., Rasmussen, S., Fazil, A., Paoli, G., and Summer, J., Quantitative risk assessment of
Listeria monocytogenes in ready-to-eat meats in Australia. International Journal of Food
Microbiology, 2009. 131(2-3): p. 128-37.
68. Ratkowsky, D.A., Olley, J., McMeekin, T.A., and Ball, T.A., Relationship between temperature
and growth rate of bacterial cultures. Journal of Bacteriology, 1982. 149(1): p. 1-5.

Draft Technical Report 5/1/2013
143
69. Zwietering, M.H., de Koos, J.T., Hasenack, B.E., de Witt, J.C., and van't Riet, K., Modeling of
bacterial growth as a function of temperature. Applied and Environmental Microbiology, 1991.
57(4): p. 1094-101.
70. Presser, K.A., Ratkowsky, D.A., and Ross, T., Modelling the growth rate of Escherichia coli as a
function of pH and lactic acid concentration. Applied and Environmental Microbiology, 1997.
63(6): p. 2355-2360.
71. Le Marc, Y., Huchet, V., Bourgeois, C.M., Guyonnet, J.P., Mafart, P., and Thuault, D., Modelling
the growth kinetics of Listeria as a function of temperature, pH and organic acid concentration.
International Journal of Food Microbiology, 2002. 73(2-3): p. 219-37.
72. Devlieghere, F., Geeraerd, A.H., Versyck, K.J., Vandewaetere, B., Van Impe, J., and Debevere,
J., Growth of Listeria monocytogenes in modified atmosphere packed cooked meat products: a
predictive model. Food Microbiology, 2001. 18(1): p. 53-66.
73. Tienungoon, S., Ratkowsky, D.A., McMeekin, T.A., and Ross, T., Growth limits of Listeria
monocytogenes as a function of temperature, pH, NaCl, and lactic acid. Applied and
Environmental Microbiology, 2000. 66(11): p. 4979-87.
74. Gimenez, B. and Dalgaard, P., Modelling and predicting the simultaneous growth of Listeria
monocytogenes and spoilage micro-organisms in cold-smoked salmon. Journal of Applied
Microbiology, 2004. 96(1): p. 96-109.
75. Mejlholm, O. and Dalgaard, P., Development and Validation of an extensive growth and growth
boundary model for Listeria monocytogenes in lightly preserved and ready-to-eat shrimp. Journal
of Food Protection, 2009. 72(10): p. 2132-2143.
76. Ross, T., Indices for performance evaluation of predictive models in food microbiology. Journal
of Applied Bacteriology, 1996. 81(5): p. 501-8.
77. Wederquist, H.J., Sofos, J.N., and Schmidt, G.R., Listeria monocytogenes inhibition in
refrigerated vacuum-packaged turkey bologna by chemical additives. Journal of Food Science,
1994. 59(3): p. 498-500.
78. Blom, H., Nerbrink, E., Dainty, R., Hagtvedt, T., Borch, E., Nissen, H., and Nesbakken, T.,
Addition of 2.5% lactate and 0.25% acetate controls growth of Listeria monocytogenes in
vacuum-packed, sensory-acceptable servelat sausage and cooked ham stored at 4°C. International
Journal of Food Microbiology, 1997. 38(1): p. 71-76.
79. Glass, K., Preston, D., and Veesenmeyer, J., Inhibition of Listeria monocytogenes in turkey and
pork-beef bologna by combinations of sorbate, benzoate, and propionate. Journal of Food
Protection, 2007. 70(1): p. 214-217.

Draft Technical Report 5/1/2013
144
80. Glass, K.A., McDonnell, L.M., Rassel, R.C., and Zierke, K.L., Controlling Listeria
monocytogenes on sliced ham and turkey products using benzoate, propionate, and sorbate.
Journal of Food Protection, 2007. 70(10): p. 2306-2312.
81. Delignette-Muller, M.L., Cornu, M., Pouillot, R., and Denis, J.B., Use of Bayesian modelling in
risk assessment: Application to growth of Listeria monocytogenes and food flora in cold-smoked
salmon. International Journal of Food Microbiology, 2006. 106(2): p. 195-208.
82. Zuliani, V., Lebert, I., Augustin, J.C., Garry, P., Vendeuvre, J.L., and Lebert, A., Modelling the
behaviour of Listeria monocytogenes in ground and pork as a function of pH, water activity,
nature and concentration of organic acid salts. Journal of Applied Microbiology, 2007. 103(3): p.
536-550.
83. Mejlholm, O., Gunvig, A., Borggaard, C., Blom-Hanssen, J., Mellefont, L., Ross, T., Leroi, F.,
Else, T., Visser, D., and Dalgaard, P., Predicting growth rates and growth boundary of Listeria
monocytogenes – an international validation study with focus on processed and ready-to-eat meat
and seafood. International Journal of Food Microbiology, 2010. 141(3): p. 137-150.
84. Augustin, J.C., Bergis, H., Midelet-Bourdin, G., Cornu, M., Couvert, O., Denis, C., Huchet, V.,
Lemonnier, S., Pinon, A., Vialette, M., Zuliani, V., and Stahl, V., Design of challenge testing
experiments to assess the variability of Listeria monocytogenes growth in foods. Food
Microbiology, 2011. 28(4): p. 746-54.
85. FAO/WHO, Exposure assessment of microbiological hazards in food, in Microbiological Risk
Assessment Series, no 72008, Food and Agriculture Organization of the United Nations and
World Health Organization: Rome. p. 92.
86. Ellouze, M., Gauchi, J.P., and Augustin, J.C., Global sensitivity analysis applied to a
contamination assessment model of Listeria monocytogenes in cold smoked salmon at
consumption. Risk analysis, 2010. 30(5): p. 841-52.
87. Pouillot, R., Goulet, V., Delignette-Muller, M.L., Mahe, A., and Cornu, M., Quantitative Risk
Assessment of Listeria monocytogenes in French Cold-Smoked Salmon: II. Risk
Characterization. Risk analysis, 2009. 29(6): p. 806-819.
88. Todd, E.C.D., Greig, J.D., Bartleson, C.A., and Michaels, B.S., Outbreaks where food workers
have been implicated in the spread of foodborne disease. Part 6. Transmission and survival of
pathogens in the food processing and preparation environment. Journal of Food Protection, 2009.
72: p. 202-219.
89. Kosa, K.M., Cates, S.C., Karns, S., Godwin, S.L., and Chambers, D., Consumer home
refrigeration practices: results of a web-based survey. Journal of Food Protection, 2007. 70(7): p.
1640-1649.
Draft Technical Report 5/1/2013
145
90. Pouillot, R., Lubran, M.B., Cates, S.C., and Dennis, S., Estimating parametric distributions of
storage time and temperature of ready-to-eat foods for U.S. households. Journal of Food
Protection, 2010. 73(2): p. 312-21.
91. Haas, C.N., Rose, J.B., and Gerba, C.P., Quantitative microbial risk assessment1999, New York:
Wiley.
92. FAO/WHO, Hazard characterization for pathogens in food and water. Guidelines, in
Microbiological Risk Assessment Series, no 32003, Food and Agriculture Organization of the
United Nations and World Health Organization: Rome. p. 269.
93. Rocourt, J., Risk factors for listeriosis. Food Control, 1996. 7(4-5): p. 195-202.
94. Goulet, V., Hebert, M., Hedberg, C., Laurent, E., Vaillant, V., De Valk, H., and Desenclos, J.C.,
Incidence of listeriosis and related mortality among groups at risk of acquiring listeriosis. Clinical
Infectious Diseases, 2012. 54(5): p. 652-60.
95. FDA/FSIS, Draft assessment of the relative risk to public health from foodborne Listeria
monocytogenes among selected categories of ready-to-eat foods, 2001, Food and Drug
Administration, United States Department of Agriculture, Centers for Disease Control and
Prevention. p. 381.
96. Mead, P.S., Slutsker, L., Dietz, V., McCaig, L.F., Bresee, J.S., Shapiro, C., Griffin, P.M., and
Tauxe, R.V., Food-related illness and death in the United States. Emerging Infectious Diseases,
1999. 5(5): p. 607-25.
97. Mary Kay O’Connor, M.K., Hlebert, A., Johnson, J., Kingsburg, K., and Peckham, K., What’s in
store 2010. , 2010, International dairy deli bakery association: Madison, WI.
98. FSIS, Isolation and Identification of Listeria monocytogenes from Red Meat, Poultry and Egg
Products, and Environmental Samples, 2009: Washington, DC. p. 21.Available from:
http://www.fsis.usda.gov/PDF/MLG-8.pdf.
99. Gallagher, D., Ebel, E.D., Gallagher, O., Labarre, D., Williams, M.S., Golden, N.J., Pouillot, R.,
Dearfield, K.L., and Kause, J., Characterizing uncertainty when evaluating risk management
metrics: Risk assessment modeling of Listeria monocytogenes contamination in ready-to-eat deli
meats. International Journal of Food Microbiology, 2013. 162(3): p. 266-275.
100. Barmpalia, I.M., Geornaras, I., Belk, K.E., Scanga, J.A., Kendall, P.A., Smith, G.C., and Sofos,
J.N., Control of Listeria monocytogenes on frankfurters with antimicrobials in the formulation
and by dipping in organic acid solutions. Journal of Food Protection, 2004. 67(11): p. 2456-64.
101. Barmpalia, I.M., Koutsoumanis, K.P., Geornaras, I., Belk, K.E., Scanga, J.A., Kendall, P.A.,
Smith, G.C., and Sofos, J.N., Effect of antimicrobials as ingredients of pork bologna for Listeria
Draft Technical Report 5/1/2013
146
monocytogenes control during storage at 4 or 10 degrees C. Food Microbiology, 2005. 22(2-3): p.
205-211.
102. Glass, K.A., Granberg, D.A., Smith, A.L., McNamara, A.M., Hardin, M., Mattias, J., Ladwig, K.,
and Johnson, E.A., Inhibition of Listeria monocytogenes by sodium diacetate and sodium lactate
on wieners and cooked bratwurst. Journal of Food Protection, 2002. 65(1): p. 116-123.
103. Houtsma, P.C., Kusters, B.J.M., de Wit, J.C., Rombouts, F.M., and Zwietering, M.H., Modelling
growth rates of Listeria innocua as a function of lactate concentration. International Journal of
Food Microbiology, 1994. 24(1-2): p. 113-123.
104. Houtsma, P.C., de Wit, J.C., and Rombouts, F.M., Minimum inhibitory concentration (MIC) of
sodium lactate for pathogens and spoilage organisms occurring in meat products. International
Journal of Food Microbiology, 1993. 20(4): p. 247-257.
105. Hwang, C.A. and Tamplin, M.L., Modeling the lag phase and growth rate of Listeria
monocytogenes in ground ham containing sodium lactate and sodium diacetate at various storage
temperatures. Journal of Food Science, 2007. 72(7): p. M246-M253.
106. Jacobsen, T. and Koch, A.G., Influence of different histories of the inoculum on lag phase and
growth of Listeria monocytogenes in meat models. Journal of Food Protection, 2006. 69(3): p.
532-41.
107. Lianou, A., Geornaras, I., Kendall, P.A., Belk, K.E., Scanga, J.A., Smith, G.C., and Sofos, J.N.,
Fate of Listeria monocytogenes in commercial ham, formulated with or without antimicrobials,
under conditions simulating contamination in the processing or retail environment and during
home storage. Journal of Food Protection, 2007. 70(2): p. 378-85.
108. Maks, N., Zhu, L., Juneja, V.K., and Ravishankar, S., Sodium lactate, sodium diacetate and
pediocin: Effects and interactions on the thermal inactivation of Listeria monocytogenes on
bologna. Food Microbiology, 2010. 27(1): p. 64-69.
109. Mbandi, E. and Shelef, L.A., Enhanced antimicrobial effects of combination of lactate and
diacetate on Listeria monocytogenes and Salmonella spp. in beef bologna. International Journal
of Food Microbiology, 2002. 76(3): p. 191-198.
110. Samelis, J., Bedie, G.K., Sofos, J.N., Belk, K.E., Scanga, J.A., and Smith, G.C., Control of
Listeria monocytogenes with combined antimicrobials after postprocess contamination and
extended storage of frankfurters at 4 degrees C in vacuum packages. Journal of Food Protection,
2002. 65(2): p. 299-307.
111. Samelis, J., Sofos, J.N., Kain, M.L., Scanga, J.A., Belk, K.E., and Smith, G.C., Organic acids and
their salts as dipping solutions to control Listeria monocytogenes inoculated following processing

Draft Technical Report 5/1/2013
147
of sliced pork bologna stored at 4 degrees C in vacuum packages. Journal of Food Protection,
2001. 64(11): p. 1722-1729.
112. Thompson, R.L., Carpenter, C.E., Martini, S., and Broadbent, J.R., Control of Listeria
monocytogenes in ready-to-eat meats containing sodium levulinate, sodium lactate, or a
combination of sodium lactate and sodium diacetate. Journal of Food Science, 2008. 73(5): p.
M239-44.
113. Zhu, M.J., Mendonca, A., Ismail, H.A., Du, M., Lee, E.J., and Ahn, D.U., Impact of antimicrobial
ingredients and irradiation on the survival of Listeria monocytogenes and the quality of
ready-to-eat turkey ham. Poultry Science, 2005. 84(4): p. 613-20.
114. Pal, A., Labuza, T.P., and Diez-Gonzalez, F., Evaluating the growth of Listeria monocytogenes in
refrigerated ready-to-eat frankfurters: influence of strain, temperature, packaging, lactate and
diacetate, and background microflora. Journal of Food Protection, 2008. 71(9): p. 1806-16.
115. Seman, D.L., Borger, A.C., Meyer, J.D., Hall, P.A., and Milkowski, A.L., Modeling the growth
of Listeria monocytogenes in cured ready-to-eat processed meat products by manipulation of
sodium chloride, sodium diacetate, potassium lactate, and product moisture content. Journal of
Food Protection, 2002. 65(4): p. 651-8.
116. Glass, K.A. and Doyle, M.P., Fate of Listeria monocytogenes in processed meat products during
refrigerated storage. Applied and Environmental Microbiology, 1989. 55(6): p. 1565-9.
117. Holley, R.A., Doyon, G., Fortin, J., Rodrigue, N., and Carbonneau, M., Post-process,
packaging-induced fermentation of delicatessen meats. Food Research International, 1996. 29(1):
p. 35-48.
118. Ryser, E.T. and Marth, E.H., Behavior of Listeria monocytogenes during manufacture and
ripening of brick cheese. Journal of Dairy Science, 1989. 72(4): p. 838-53.
119. Genigeorgis, C., Carniciu, M., Dutulescu, D., and Farver, T.B., Growth and survival of Listeria
monocytogenes in market cheeses stored at 4 degrees C to 30 degrees C. Journal of Food
Protection, 1991. 54(9): p. 662-668.
120. Refrigerated Foods Association, RE: Update of the 2003 Interagency Quantitative Assessment of
the Relative Risk to Public Health From Foodborne Listeria Monocytogenes Among Selected
Categories of Ready-To-Eat Foods; Request for Comments, Scientific Data and Information,
FSIS-2010-0035, D.N., Editor 2011.
121. R Development Core Team. R: a language and environment for statistical computing. 2008 [cited
2012 March 20]; Available from: http://www.R-project.org.
122. Riedo, F.X., Pinner, R.W., Tosca, M.L., Cartter, M.L., Graves, L.M., Reeves, M.W., Weaver,
R.E., Plikaytis, B.D., and Broome, C.V., A point-source foodborne listeriosis outbreak:

Draft Technical Report 5/1/2013
148
documented incubation period and possible mild illness. Journal of infectious Diseases, 1994.
170(3): p. 693-6.
123. Todd, E.C., Michaels, B.S., Greig, J.D., Smith, D., and Bartleson, C.A., Outbreaks where food
workers have been implicated in the spread of foodborne disease. Part 8. Gloves as barriers to
prevent contamination of food by workers. Journal of Food Protection, 2010. 73(9): p. 1762-73.
124. Perez-Rodriguez, F., Castro, R., Posada-Izquierdo, G.D., Valero, A., Carrasco, E.,
Garcia-Gimeno, R.M., and Zurera, G., Evaluation of hygiene practices and microbiological
quality of cooked meat products during slicing and handling at retail. Meat Science, 2010. 86(2):
p. 479-85.
125. Nims, L.F. and Smith, P.K., The Ionization of lactic acid from zero to fifty degrees. Journal of
Biological Chemistry, 1936. 113: p. 145-152.

Draft Technical Report 5/1/2013
149
Appendix 1: The Secondary Growth Model
The Mejlholm and Dalgaard model [75] is a predictive microbiology secondary models. It predicts the
change in the primary model parameters according to a change in the growth environment. This model
use the gamma concept [65]. The model used here is limited to T, pH, aw, nitrites, LAC, DAC, and their
interaction. It is written:
( ) ( ) ( ) ( ) ( ) ( ) ( )DACLACnitapHTDACLACnitapHT wDACLACnitwapHTref w,,,,,intξγγγγγγµµ ⋅⋅⋅⋅⋅⋅⋅=
where
- 1h419.0 −=refµ is equal to µopt at a reference temperature (Tref) of 25°C in the RTE product;
- ( )
°−≤
°−>
++
=
CTif
CTifT
TT
refT
83.20
83.283.2
83.22
γ with T, the temperature in degrees Celsius.
Note that this model for temperature is equivalent to a Ratkowsky [68] model, as used in [3], with
Tmin, the minimal temperature of growth for Listeria equals to -2.83°C (26.91°F);
- ( )( )( )
≤
>−−
=923.00
923.0923.01923.0
w
ww
waaif
aifa
aw
γ with aw , the water activity of the RTE product;
- ( )( )
≤>−=
−
97.4097.4101 97.4
pHifpHifpH
pHpHγ with pH, the pH of the RTE product;
- ( )
≥
<
−
=ppmnitif
ppmnitifnitnitnit
3500
350350
350 2
γ with nit the concentration of nitrites (ppm);
- [ ]( )[ ] [ ]
[ ]
≥
<
−=mMLACf
mMLACifLAC
LACU
UU
ULAC79.30
79.379.3
1γ with [LACU], the concentration (mM)
of undissociated lactic acid.
- [ ]( )[ ] [ ]
[ ]
≥
<
−=
mMDACif
mMDACifDACDAC
U
UU
UDAC
80.40
80.480.4
1γ with [DACU], the concentration (mM)
of undissociated diacetate.

Draft Technical Report 5/1/2013
150
The value of [LACU] from the concentration of growth inhibitors in the RTE product is evaluated in two
steps: First, the total lactic acid concentration (LACtot, %) is evaluated from the concentration in sodium
lactate (NaL, %), the concentration in potassium lactate (KL, %), and the concentration in lactic acid
(LAC, %) using their respective molecular weight, as:
++×=
08.902.1281.11208.90 LACKLNaLLACtot .
Then, the concentration in undissociated lactic acid (mM) is evaluated from the total concentration of
lactic acid using the Henderson-Hasselbach equation:
[ ][ ]U
a AApKpH −
+= 10log
leading to
[ ]86.310108.90
10000
−+
×= pH
totU
LACLAC ;
The pKa dependence on temperature was found to be negligible for lactic acid [125] and assumed so for
diacetate. Similarly, the total diacetate concentration (DACtot, %) is evaluated from the concentration in
sodium lactate (NaDAC, %) and the concentration in diacetate (DAC, %) using their respective molecular
weight, as:
+×=
1.11909.1421.119 DACNaDACDACtot .
The concentration in undissociated diacetate (mM) is evaluated from the total concentration of diacetate
using:
[ ]76.4101
1.11910000
−+
×= pH
totU
DACDAC ;
As for the interaction term, Mejlholm and Dalgaard [75] use the Le Marc [71] approach, i.e.:
[ ] [ ]( ) ( )
≥<<−
≤=
1015.012
5.01,,,,,
ψψψ
ψξ
ifif
ifDACLACnitpHaT UUw
where
( )( )( )
( ) ( )( )
( )( )
−
−
×=
−=
∏
∑∑ ∏
≠ i
i
iij
i
ii
ji
ϕ
ϕϕ
ϕϕψ
1
15.0
12
with

Draft Technical Report 5/1/2013
151
( )2
83.283.21
++
−=refTTTϕ ,
( )2
923.01923.0
1
−−
−= ww
aaϕ ,
( ) ( ) 297.41011
−−= − pHpHϕ ,
( )2
3503501
−−=
nitnitϕ and
[ ] [ ]( ) [ ] [ ]2
80.41
79.311;
−⋅
−−= UU
UuDACLAC
DACLACϕ .
The growth model was slightly adapted to fit the structure of the present model. Nevertheless, these
adaptations were made with no change in the mathematical model.
Simplification of the model
We first simplify the final evaluation of ξ . We have:
( )( ) ( )
( )
≥−<−<−
≤−=
1121112012
0120
ψψψ
ψξ
.
Define χ = 2(1 - ψ). We have:
( )
( )∏
∑−
−
−=
ii
iii
ϕ
ϕϕ
χ1
12
Then we can rewrite ξ simply as:
≥<<
≤=
1110
00
χχχ
χξ
Mathematical derivation when one parameter only is varying
A given RTE product has a set of chemical characteristics (pH, aw, [LAC]tot, [DAC]tot, nit). We will
consider those characteristics as constant all over the process, from the entry in the deli to the

Draft Technical Report 5/1/2013
152
consumption. Only one parameter is considered: temperature T. The following procedure will help us to
evaluate the growth of the RTE product while the temperature varies in the process.
The gamma concept with interaction is written, for i ∈ {T, pH, aw, nit, [LAC]tot, [DAC]tot}:
( ) ( ) ( ) ξγγµξγµµ ××
×=××= ∏∏
≠
Txx TTi
iiopti
iiopt .
( )
×∏
≠Tiiiopt xγµ is characteristic of the RTE product. In our particular process, it is a constant.
We have:
( )
( )
( ) ( )
( ) ( )TTi
i
TTTi
ii
ii
iii
ϕϕ
ϕϕϕϕ
ϕ
ϕϕ
χ−×−
−+−
−=−
−
−=∏
∑
∏
∑
≠
≠11
112
1
12 , then
( )
( ) ( ) ( )∏∏
∑
≠≠
≠−
−−×−
−
−=
Tii
T
TTi
i
Tiii
ϕϕ
ϕϕ
ϕϕ
χ111
12
Define Ti≠χ the factor χ for all parameters but T. We have:
( )
( )∏
∑
≠
≠≠ −
−
−=
Tii
Tiii
Ti ϕ
ϕϕ
χ1
12
Then:
( )( ) ( )∏
≠
≠−
−−−
−=
Tii
T
T
Tiϕ
ϕϕχ
χ11
22
Then, ξ = χ if 0 < χ < 1; ξ = 1 if χ > 1 and ξ = 0 if χ < 0.
Note moreover that at T = Tref, γT = 1, ϕT = 0. We can thus define our parameters at T = Tref since
γTref = γi≠T, χTref = χi≠T.
In practice
For a given RTE product with a different set of parameters (pH, aw, [LAC], [DAC]) and a µref. Assume
that only the temperature changes. The following process may be used to evaluate the growth at a
temperature T.
For a given RTE product, at T = Tref
1. Evaluate and store ∏=i
iTrefγγ . If γTref = 0 ⇒ No growth T∀

Draft Technical Report 5/1/2013
153
2. Evaluate and store ( )∏ −=i
iTrefA ϕ1
3. Evaluate and store ( )
refref
T
iii
T A
∑ −
−=
ϕϕ
χ
12 . If χTref ≤ 0 ⇒ No growth T∀
For a given temperature T If T ≤ Tmin ⇒ No growth for T
4. Evaluate
5. Evaluate ( )TTT γϕ −=
+
−= 183.27
83.212
6. Evaluate ref
ref
T
T
T
T
Aϕ
ϕ
χχ −
−
−−=
1
22 If χ ≤ 0 ⇒ No growth for T
7. If if χ ≥ 1, set ξ = 1; else ξ = χ
8. Evaluate ( ) ξγγµµ ×××= TTref ref
22
min
min83.27
83.2
+
=
−−
=T
TTTT
refTγ

Draft Technical Report 5/1/2013
154
Appendix 2: Consumption Data
The objective was to derive a distribution for serving sizes for “Deli meat,” “Deli Cheese,” and “Deli
Salad.” Consumption data were extracted from the 1999-2006 National Health and Nutrition Examination
Survey (NHANES, a USDA / DHHS survey) results using the FARE™ Program (Food Analysis and
Residue Evaluation Program, v. 8.63) developed by Exponent®. Briefly, the nutritional assessment
component of the NHANES includes a 24-hour dietary recall interview for participants of all ages.
Dietary recall interviews are conducted in person by trained dietary interviewers fluent in Spanish and
English. Each dietary interview room contains a standard set of measuring guides. These tools are used to
help the respondent report the volume and dimensions of the food items consumed. They are not intended
to represent any one particular food, but rather are designed to help respondents estimate portion sizes.
This set of measuring guides is designed specifically for use in the current NHANES setting with a target
population of non-institutionalized U.S. civilians.
Method
All analyses were performed using the following options:
- Database: NHANES, combined 1999-2006 data, using only the first day of intake data;
- Use statistical weights, does not divide intake by body weight;
- Intake timing by specific meal and snack period. For meal and snack period, brunch and lunch
were combined, as well as supper and dinner. All snacks were gathered daily as a single eating
occasion;
- The population was the standard U.S. population (all season, region, age, sex, and ethnicity), the
pregnant 13+ population and the senior (55+) population.
Deli Meat
An analysis by ingredient (“RAC”, Raw Agricultural Commodities) was used, because a part of this deli
meat is used within complex food, such as sandwiches. First, the software extracted from the NHANES
database all recorded eating occasions of any of the foods-as-eaten items listed, considered as including a
“Deli Meat” as ingredient (Table 20). The list is an update of the 2003 FDA/FSIS risk assessment list
(provided in [3], appendix 5, p.419). Then, the “Meat” part of these food items was extracted using recipe
translation files included with the FARE™ program.

Draft Technical Report 5/1/2013
155
Table 20: Food items considered as including “Deli Meat”.
CODE Description 22301000 Ham, fresh, cooked, NS as to fat eaten 22301110 Ham, fresh, cooked, lean and fat eaten 22301120 Ham, fresh, cooked, lean only eaten 22311000 Ham, smoked or cured, cooked, NS as to fat eaten 22311010 Ham, smoked or cured, cooked, lean and fat eaten 22311020 Ham, smoked or cured, cooked, lean only eaten 22311200 Ham, smoked or cured, low sodium, cooked, NS as to fat eaten 22311210 Ham, smoked or cured, low sodium, cooked, lean and fat eaten 22311220 Ham, smoked or cured, low sodium, cooked, lean only eaten 22311450 Ham, prosciutto 23322100 Deer bologna 24201500 Turkey, light or dark meat, smoked, cooked, NS as to skin eaten 24201510 Turkey, light or dark meat, smoked, cooked, skin eaten 24201520 Turkey, light or dark meat, smoked, cooked, skin not eaten 25220010 Cold cut, NFS 25220390 Bologna, beef, lowfat 25220400 Bologna, pork and beef 25220410 Bologna, NFS 25220420 Bologna, Lebanon 25220430 Bologna, beef 25220440 Bologna, turkey 25220450 Bologna ring, smoked 25220460 Bologna, pork 25220470 Bologna, beef, lower sodium 25220480 Bologna, chicken, beef, and pork 25220490 Bologna, with cheese 25220500 Bologna, beef and pork, lowfat 25220710 Chorizos 25221210 Mortadella 25221250 Pepperoni 25221480 Mettwurst 25221500 Salami, NFS 25221510 Salami, soft, cooked 25221520 Salami, dry or hard 25221530 Salami, beef 25221710 Souse 25221810 Thuringer 25230110 Luncheon meat, NFS 25230210 Ham, sliced, prepackaged or deli, luncheon meat 25230220 Ham, sliced, low salt, prepackaged or deli, luncheon meat 25230230 Ham, sliced, extra lean, prepackaged or deli, luncheon meat 25230310 Chicken or turkey loaf, prepackaged or deli, luncheon meat 25230410 Ham loaf, luncheon meat 25230430 Ham and cheese loaf 25230450 Honey loaf 25230510 Ham, luncheon meat, chopped, minced, pressed, spiced, not canned 25230520 Ham, luncheon meat, chopped, minced, pressed, spiced, lowfat, not canned 25230560 Liverwurst 25230610 Luncheon loaf (olive, pickle, or pimiento) 25230710 Sandwich loaf, luncheon meat 25230790 Turkey ham, sliced, extra lean, prepackaged or deli, luncheon meat 25230800 Turkey ham

Draft Technical Report 5/1/2013
156
CODE Description 25230810 Veal loaf 25230820 Turkey pastrami 25230840 Turkey salami 25230900 Turkey or chicken breast, prepackaged or deli, luncheon meat 25230905 Turkey or chicken breast, low salt, prepackaged or deli, luncheon meat 25231110 Beef, sliced, prepackaged or deli, luncheon meat 25231150 Corned beef, pressed 27500050 Sandwich, NFS 27500100 Meat sandwich, NFS 27500200 Wrap sandwich, filled with meat, poultry, or fish, vegetables, and cheese 27500300 Wrap sandwich, filled with meat, poultry, or fish, and vegetables 27510910 Corned beef sandwich 27510950 Reuben sandwich (corned beef sandwich with sauerkraut and cheese), with spread 27511010 Pastrami sandwich 27513010 Roast beef sandwich 27513020 Roast beef sandwich, with gravy 27513030 Roast beef sandwich dipped in egg, fried, with gravy and spread 27513040 Roast beef submarine sandwich, with lettuce, tomato and spread 27513050 Roast beef sandwich with cheese 27513060 Roast beef sandwich with bacon and cheese sauce 27513070 Roast beef submarine sandwich, on roll, au jus 27520110 Bacon sandwich, with spread 27520120 Bacon and cheese sandwich, with spread 27520130 Bacon, chicken, and tomato club sandwich, with lettuce and spread 27520135 Bacon, chicken, and tomato club sandwich, with cheese, lettuce and spread 27520140 Bacon and egg sandwich 27520150 Bacon, lettuce, and tomato sandwich with spread 27520160 Bacon, chicken, and tomato club sandwich, on multigrain roll with lettuce and spread 27520165 Bacon, chicken fillet (breaded, fried), and tomato club with lettuce and spread 27520166 Bacon, chicken fillet (breaded, fried), and tomato club sandwich with cheese, lettuce
and spread 27520170 Bacon on biscuit 27520250 Ham on biscuit 27520300 Ham sandwich, with spread 27520310 Ham sandwich with lettuce and spread 27520320 Ham and cheese sandwich, with lettuce and spread 27520330 Ham and egg sandwich 27520350 Ham and cheese sandwich, with spread, grilled 27520360 Ham and cheese sandwich, on bun, with lettuce and spread 27520370 Hot ham and cheese sandwich, on bun 27520380 Ham and cheese on English muffin 27520390 Ham and cheese submarine sandwich, with lettuce, tomato and spread 27520410 Cuban sandwich, (Sandwich cubano), with spread 27520540 Ham and tomato club sandwich, with lettuce and spread 27540110 Chicken sandwich, with spread 27540130 Chicken barbecue sandwich 27540290 Chicken submarine sandwich, with lettuce, tomato, and spread 27540310 Turkey sandwich, with spread 27540330 Turkey sandwich, with gravy 27540350 Turkey submarine sandwich, with cheese, lettuce, tomato and spread 27541000 Turkey, ham, and roast beef club sandwich, with lettuce, tomato and spread 27560000 Luncheon meat sandwich, NFS, with spread 27560110 Bologna sandwich, with spread 27560120 Bologna and cheese sandwich, with spread
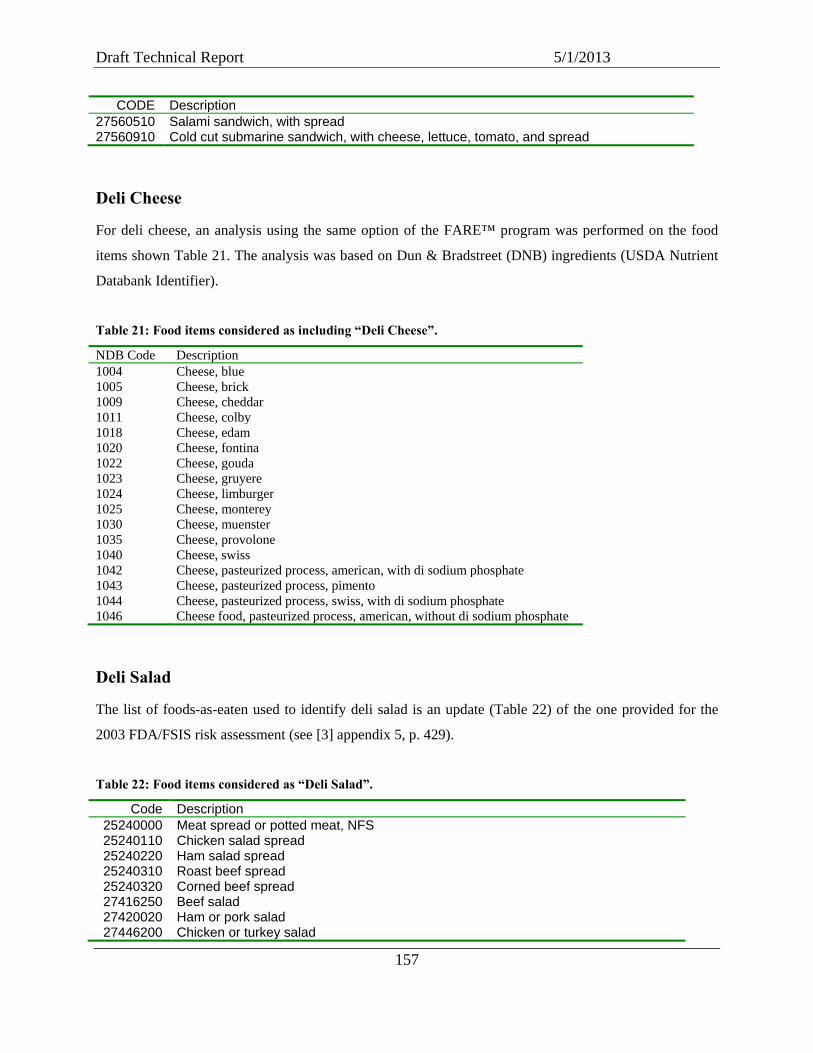
Draft Technical Report 5/1/2013
157
CODE Description 27560510 Salami sandwich, with spread 27560910 Cold cut submarine sandwich, with cheese, lettuce, tomato, and spread
Deli Cheese
For deli cheese, an analysis using the same option of the FARE™ program was performed on the food
items shown Table 21. The analysis was based on Dun & Bradstreet (DNB) ingredients (USDA Nutrient
Databank Identifier).
Table 21: Food items considered as including “Deli Cheese”.
NDB Code Description 1004 Cheese, blue 1005 Cheese, brick 1009 Cheese, cheddar 1011 Cheese, colby 1018 Cheese, edam 1020 Cheese, fontina 1022 Cheese, gouda 1023 Cheese, gruyere 1024 Cheese, limburger 1025 Cheese, monterey 1030 Cheese, muenster 1035 Cheese, provolone 1040 Cheese, swiss 1042 Cheese, pasteurized process, american, with di sodium phosphate 1043 Cheese, pasteurized process, pimento 1044 Cheese, pasteurized process, swiss, with di sodium phosphate 1046 Cheese food, pasteurized process, american, without di sodium phosphate
Deli Salad
The list of foods-as-eaten used to identify deli salad is an update (Table 22) of the one provided for the
2003 FDA/FSIS risk assessment (see [3] appendix 5, p. 429).
Table 22: Food items considered as “Deli Salad”.
Code Description 25240000 Meat spread or potted meat, NFS 25240110 Chicken salad spread 25240220 Ham salad spread 25240310 Roast beef spread 25240320 Corned beef spread 27416250 Beef salad 27420020 Ham or pork salad 27446200 Chicken or turkey salad

Draft Technical Report 5/1/2013
158
Code Description 27446205 Chicken or turkey salad with nuts and/or fruits 27446220 Chicken or turkey salad with egg 27446300 Chicken or turkey garden salad (chicken and/or turkey, tomato and/or carrots, other
vegetables), no dressing 27446310 Chicken or turkey garden salad (chicken and/or turkey, other vegetables excluding
tomato and carrots), no dressing 27446315 Chicken or turkey garden salad with bacon (chicken and/or turkey, bacon, cheese,
lettuce and/or greens, tomato and/or carrots, other vegetables), no dressing 27446320 Chicken or turkey (breaded, fried) garden salad with bacon (chicken and/or turkey,
bacon, cheese, lettuce and/or greens, tomato and/or carrots, other vegetables), no dressing
27446350 Oriental chicken or turkey garden salad (chicken and/or turkey, lettuce, fruit, nuts), no dressing
27446355 Oriental chicken or turkey garden salad with crispy noodles (chicken and/or turkey, lettuce, fruit, nuts, crispy noodles), no dressing
27446360 Chicken or turkey caesar garden salad (chicken and/or turkey, lettuce, tomato, cheese), no dressing
27446362 Chicken or turkey (breaded, fried) caesar garden salad (chicken and/or turkey, lettuce, tomatoes, cheese), no dressing
27450010 Crab salad 27450020 Lobster salad 27450030 Salmon salad 27450060 Tuna salad 27450070 Shrimp salad 27450080 Seafood salad 27450090 Tuna salad with cheese 27450100 Tuna salad with egg 27450110 Shrimp garden salad (shrimp, lettuce, eggs, tomato and/or carrots, other vegetables),
no dressing 27450120 Shrimp garden salad (shrimp, lettuce, eggs, vegetables excluding tomato and
carrots), no dressing 27450130 Crab salad made with imitation crab 27450180 Seafood garden salad with seafood, lettuce, vegetables excluding tomato and
carrots, no dressing 27450190 Seafood garden salad with seafood, lettuce, tomato and/or carrots, other vegetables,
no dressing 27450200 Seafood garden salad with seafood, lettuce, eggs, vegetables excluding tomato and
carrots, no dressing 27450210 Seafood garden salad with seafood, lettuce, eggs, tomato and/or carrots, other
vegetables, no dressing 27460490 Julienne salad (meat, cheese, eggs, vegetables), no dressing 27460510 Antipasto with ham, fish, cheese, vegetables 27520340 Ham salad sandwich 27540120 Chicken salad or chicken spread sandwich 27540320 Turkey salad or turkey spread sandwich 27550710 Tuna salad sandwich, with lettuce 27550720 Tuna salad sandwich 27550750 Tuna salad submarine sandwich, with lettuce and tomato 32103000 Egg salad 32203010 Egg salad sandwich 41203020 Kidney bean salad 41205070 Hummus 58101930 Taco or tostada salad with beef, beans and cheese, fried flour tortilla 58101940 Taco or tostada salad, meatless, with cheese, fried flour tortilla

Draft Technical Report 5/1/2013
159
Code Description 58148110 Macaroni or pasta salad 58148120 Macaroni or pasta salad with egg 58148130 Macaroni or pasta salad with tuna 58148140 Macaroni or pasta salad with crab meat 58148150 Macaroni or pasta salad with shrimp 58148160 Macaroni or pasta salad with tuna and egg 58148170 Macaroni or pasta salad with chicken 58148180 Macaroni or pasta salad with cheese 58148500 Pasta or macaroni salad with oil and vinegar-type dressing 58148550 Pasta or macaroni salad with meat 71601010 Potato salad with egg 71602010 Potato salad, German style 71603010 Potato salad 72116140 Caesar salad (with romaine) 73101010 Carrots, raw 73101110 Carrots, raw, salad 73101210 Carrots, raw, salad with apples 74506000 Tomato and cucumber salad made with tomato, cucumber, oil, and vinegar 75140500 Broccoli salad with cauliflower, cheese, bacon bits, and dressing 75141000 Cabbage salad or coleslaw, with dressing 75141100 Cabbage salad or coleslaw with apples and/or raisins, with dressing 75141200 Cabbage salad or coleslaw with pineapple, with dressing 75142500 Cucumber salad with creamy dressing 75142550 Cucumber salad made with cucumber, oil, and vinegar 75142600 Cucumber salad made with cucumber and vinegar 75143000 Lettuce, salad with assorted vegetables including tomatoes and/or carrots, no
dressing 75143050 Lettuce, salad with assorted vegetables excluding tomatoes and carrots, no dressing 75143100 Lettuce, salad with avocado, tomato, and/or carrots, with or without other vegetables,
no dressing 75143200 Lettuce, salad with cheese, tomato and/or carrots, with or without other vegetables,
no dressing 75143300 Lettuce, salad with egg, tomato, and/or carrots, with or without other vegetables, no
dressing 75143350 Lettuce salad with egg, cheese, tomato, and/or carrots, with or without other
vegetables, no dressing 75144100 Lettuce, wilted, with bacon dressing 75145000 Seven-layer salad (lettuce salad made with a combination of onion, celery, green
pepper, peas, mayonnaise, cheese, eggs, and/or bacon) 75146000 Greek Salad 75147000 Spinach salad, no dressing 75148000 Cobb salad with dressing 75201030 Artichoke salad in oil 75302080 Bean salad, yellow and/or green string beans 75416500 Pea salad 75416600 Pea salad with cheese
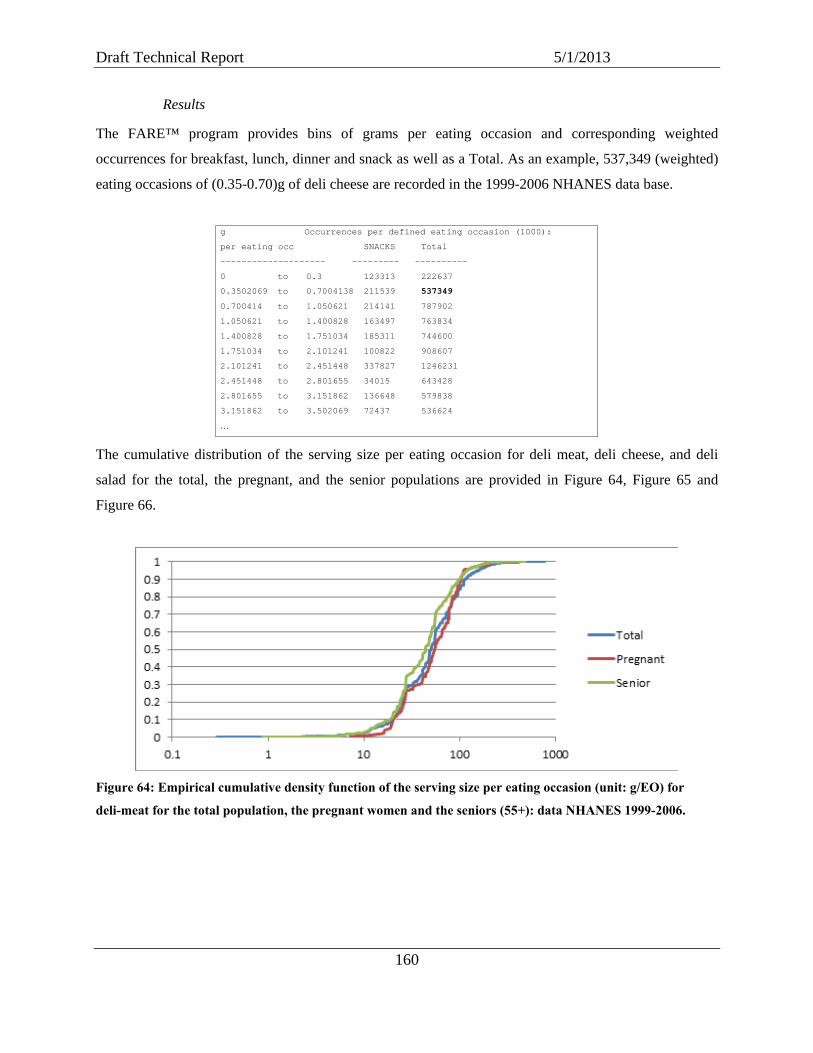
Draft Technical Report 5/1/2013
160
Results
The FARE™ program provides bins of grams per eating occasion and corresponding weighted
occurrences for breakfast, lunch, dinner and snack as well as a Total. As an example, 537,349 (weighted)
eating occasions of (0.35-0.70)g of deli cheese are recorded in the 1999-2006 NHANES data base.
The cumulative distribution of the serving size per eating occasion for deli meat, deli cheese, and deli
salad for the total, the pregnant, and the senior populations are provided in Figure 64, Figure 65 and
Figure 66.
Figure 64: Empirical cumulative density function of the serving size per eating occasion (unit: g/EO) for
deli-meat for the total population, the pregnant women and the seniors (55+): data NHANES 1999-2006.
g Occurrences per defined eating occasion (1000):
per eating occ SNACKS Total
-------------------- --------- ----------
0 to 0.3 123313 222637
0.3502069 to 0.7004138 211539 537349
0.700414 to 1.050621 214141 787902
1.050621 to 1.400828 163497 763834
1.400828 to 1.751034 185311 744600
1.751034 to 2.101241 100822 908607
2.101241 to 2.451448 337827 1246231
2.451448 to 2.801655 34015 643428
2.801655 to 3.151862 136648 579838
3.151862 to 3.502069 72437 536624
…

Draft Technical Report 5/1/2013
161
Figure 65: Empirical cumulative density function of the serving size per eating occasion (unit: g/EO) for
deli-cheese for the total population, the pregnant women and the seniors (55+): data NHANES 1999-2006
Figure 66: Empirical cumulative density function of the serving size per eating occasion (unit: g/EO) for
deli-salad for the total population, the pregnant women and the seniors (55+): data NHANES 1999-2006
Simulation
In order to provide simulated serving sizes within this interagency L. monocytogenes in retail risk
assessment model, we use the following algorithm:
- from the FARE results, one bin is randomly sampled proportionally to its number of occurrence;
- then, a serving size is randomly sampled uniformly within the bounds of this bin;
- the value is rounded to the upper gram.
The resulting empirical cumulative distributions and their relative statistics for the overall population are
provided Figure 11 of this document.