draft management plan for the namibian hake fishery for...
TRANSCRIPT

Republic of Namibia
Ministry of Fisheries and Marine Resources
DRAFT
Management Plan for the Namibian Hake Fishery
for the period May 2011 to April 2014
31 March 2011

DRAFT Management Plan for the Namibian Hake Fishery
Foreword
The hake fishery is the most valuable fishery in Namibia. It generates almost half of the
final value of all Namibian fisheries. The fishery is the largest provider of employment
in the fishing industry and generates a considerable amount of foreign currency.
It is vital for Namibia as a nation to manage this fishery properly. In particular we need
to ensure the responsible and sustainable utilisation of the resource itself. Without the
hake, there will be no industry, no employment and no benefits to Namibia.
This management plan brings together in one document all of the relevant policies for
the hake fishery. It explains how we will manage the hake fishery during the next few
years and identifies where we would like the fishery to be in the future. The plan out-
lines the goals we have for this fishery, using Vision 2030 as its basis, and sets objec-
tives and strategies for us to achieve these goals.
The development of this management plan represents a new beginning in our fisheries.
Most of our policies were created when Namibia was a new nation. When we had no
local fishing industry to speak of. At that time we needed to set in place a fisheries man-
agement system that would create a Namibian fishing industry. An industry that would
contribute significantly to the Namibian economy, both through income and employ-
ment. An industry that would bring valuable foreign exchange into our country. This we
have successfully done. We have put in place a management system in Namibian fisher-
ies that is praised by most outside observers, and the hake fishery is no exception.
In spite of our success, the time has come to look carefully at our policies and review
them. There is no doubt that the current policies have achieved many of the objectives
that were set out in the beginning. In fact, I am of the opinion that given the situation at
Independence, these policies were excellent. However, 21 years have passed since our
Independence. We are not the same country as back then. The hake industry is not the
same industry as back then. We have developed. Therefore, the policies that have served
us well in the past may not be the best policies for our future.
The development of the management plan for the hake fishery represents the first step in
our assessment of our policies as they relate to the hake fishery. It will give us an over-
view of the fishery, allowing us to identify gaps in our policies and areas that may need
adjustment and improvement.
Once the plan is in place we will begin assessment of the policies. Are they in fact
achieving what we want them to achieve? Once we have answered that question we will
look for ways to improve our policies and our management plan. This is a long term
process. In fact it will never end as our environment constantly changes.
________________________________
Honourable Bernard Esau
Minister of Fisheries and Marine Resources

DRAFT Management Plan for the Namibian Hake Fishery
Acknowledgements
The preparation of this management plan for the Namibian hake fishery was funded by
the 9th
cycle of the European Development Fund (EDF) “Strengthening Fisheries Man-
agement in ACP Countries” (9 ACP RPR 12), known as ACP-Fish II, project
CU/PE1/MZ/10/005. The compilation of the plan was undertaken by Vilhjálmur Wiium
and Dave Boyer on behalf of NFDS Africa.
We would like to acknowledge the cooperation and interest from the Namibia Hake As-
sociation and other members of the fishing industry, and the many other stakeholders
who participated in the workshops and consultative meetings. The Honourable Minister
gave personal guidance which we appreciate greatly. Personnel of the Ministry of Fish-
eries and Marine Resources provided valuable inputs, guidance and information to the
consultants. In particular, our thanks go to Anna Erastus, Titus Iilende, Carola Kirchner
and the Technical Team from the Ministry: Lucia Haufiku, Paul Kainge, John Kathena,
Sam Goreseb and Victor Pea.

DRAFT Management Plan for the Namibian Hake Fishery
Table of contents
Foreword .......................................................................................................................................................... i
Acknowledgements ......................................................................................................................................... ii
List of tables .................................................................................................................................................... v
List of acronyms ............................................................................................................................................. vi
1 Purpose .................................................................................................................................................... 1
2 Current situation ...................................................................................................................................... 2 2.1 Biology of hake .............................................................................................................................. 2
2.1.1 Distribution ........................................................................................................................... 2 2.1.2 Spawning ............................................................................................................................... 2 2.1.3 Diet and predation ................................................................................................................. 2 2.1.4 Growth ................................................................................................................................... 3 2.1.5 Influence of the physical environment on hake ..................................................................... 3
2.2 Stock Assessment........................................................................................................................... 4 2.3 TACs and harvesting levels ........................................................................................................... 5 2.4 The fishing industry ....................................................................................................................... 5
2.4.1 Holders of exploitation rights ................................................................................................ 5 2.4.2 Fishing fleet ........................................................................................................................... 6 2.4.3 Employment .......................................................................................................................... 6 2.4.4 Hake bycatch in other fisheries ............................................................................................. 7 2.4.5 Bycatch of other species in hake fishery ............................................................................... 7 2.4.6 Processing and marketing ...................................................................................................... 7
2.5 Current management measures ...................................................................................................... 7
3 Management goals and objectives ........................................................................................................... 9 Goal 1: Responsible and sustainable utilisation of the hake resource ....................................................... 11
Objective 1.1: Recovery of the hake stocks to the MSY level ............................................................. 11 Objective 1.2: Management measures based on best available scientific evidence ............................. 12 Objective 1.3: New assessment of the hake stocks ............................................................................... 13 Objective 1.4: Sufficient institutional capacity, skills, equipment and funding ................................... 15
Goal 2: Minimal impact on the ecosystem ................................................................................................ 17 Objective 2.1: Maintain biodiversity and ecosystem functioning ........................................................ 17 Objective 2.2: Minimise bycatches including incidental mortality of non-commercial species .......... 18 Objective 2.3: Mitigate habitat and substrate damage .......................................................................... 19 Objective 2.4: Sufficient institutional capacity, skills, equipment and funding ................................... 19
Goal 3: Stable business environment established conducive to the promotion of economic efficiency ... 20 Objective 3.1: The hake industry can respond effectively to external changes. ................................... 20 Objective 3.2: Appropriate investments are undertaken by the industry. ............................................. 22 Objective 3.3: Promote increased level of value addition by hake fishing and processing companies. 24
Goal 4: Hake fishery benefits a large number of Namibians, directly and indirectly ............................... 25 Objective 4.1: Quota fees provide revenue to government .................................................................. 25 Objective 4.2: Hake industry provides sustainable and quality employment to Namibians................. 26 Objective 4.3: Increased Namibian ownership in the hake industry .................................................... 26 Objective 4.4: Support to community initiatives encouraged. .............................................................. 27
Goal 5: Efficient, cost-effective and participatory management of the hake fishery ................................ 28 Objective 5.1: MFMR provides the required management services cost-effectively. .......................... 28 Objective 5.2: Consultations with stakeholders and wider community. ............................................... 28 Objective 5.3: Industry contributes to research and compliance. ......................................................... 29 Objective 5.4: Management measures are complied with. ................................................................... 29
Summary of research and reviews ............................................................................................................ 30
DRAFT Management Plan for the Namibian Hake Fishery
4 Summary of management measures ...................................................................................................... 31 4.1 Total allowable catch ................................................................................................................... 31 4.2 Limited entry into fishery ............................................................................................................ 31 4.3 Quota system ................................................................................................................................ 31 4.4 Fees .............................................................................................................................................. 31 4.5 Technical measures ...................................................................................................................... 31 4.6 Management capacity .................................................................................................................. 32
5 Response of management ...................................................................................................................... 33
6 Review of the management plan ........................................................................................................... 34
7 Bibliography .......................................................................................................................................... 35
DRAFT Management Plan for the Namibian Hake Fishery
List of tables
Table 1: TACs and landings of hake, 1990-2009 (tonnes) .............................................................................. 5
Table 2: Allocation of hake quotas to others (tonnes) ..................................................................................... 6
Table 3: Hake as bycatch, 2007-2010 (tonnes) ............................................................................................... 7
Table 4: Exports of hake, country shares 2007-2009 ...................................................................................... 7
Table 5: Strategies for Objective 1.1: Recovery of the hake stocks to MSY level ....................................... 12
Table 6: Strategies for Objective 1.2: Management measures based on best available scientific evidence.. 13
Table 7: Strategies for Objective 1.3: New assessment of the hake stocks ................................................... 14
Table 8: Strategies for Objective 1.4: Sufficient institutional capacity, skills, equipment and funding ....... 16
Table 9: Strategies for Objective 2.1: Maintain biodiversity and ecosystem functioning ............................. 17
Table 10: Strategies for Objective 2.2: Minimise bycatches including incidental mortality of non-
commercial species ................................................................................................................... 18
Table 11: Strategies for Objective 2.3: Mitigate habitat and substrate damage ............................................ 19
Table 12: Strategies for Objective 2.4: Sufficient institutional capacity, skills, equipment and funding ..... 19
Table 13: Strategies for Objective 3.1: The industry can respond effectively to external changes............... 22
Table 14: Strategies for Objective 3.2: Appropriate investments are undertaken by the industry ................ 23
Table 15: Strategies for Objective 3.4: Promote increased level of value addition by hake fishing and
processing companies ............................................................................................................... 24
Table 16: Strategies for Objective 4.1: Quota fees provide revenue to government ..................................... 25
Table 17: Strategies for Objective 4.2: Hake industry provides sustainable employment to Namibians ...... 26
Table 18: Strategies for Objective 4.3: Increased Namibian ownership in the hake industry ....................... 27
Table 19: Strategies for Objective 4.4: Support to community initiatives encouraged. ................................ 27
Table 20: Strategies for Objective 5.1: MFMR provides required management services cost-effectively ... 28
Table 21: Strategies for Objective 5.2: Consultations with stakeholders and wider community .................. 29
Table 22: Strategies for Objective 5.3: Industry contributes to research and compliance ............................ 29
Table 23: Strategies and performance indicators for Goal 5 objectives ........................................................ 29
Table 24: List of research and reviews .......................................................................................................... 30
Table 25: Important milestones regarding review ......................................................................................... 34

DRAFT Management Plan for the Namibian Hake Fishery
List of acronyms
BCC Benguela Current Commission
BCLME Benguela Current Large Marine Ecosystem Programme
BENEFIT Benguela Environment Fisheries Interaction and Training Programme
CPUE Catch per unit effort
DOP Directorate of Operations
DPPE Directorate of Policy, Planning and Economics
DRM Directorate of Resource Management
EAF Ecosystem approach to fisheries management
FAO Food and Agricultural Organization of the United Nations
FCPT Fish Consumption Promotion Trust
FOA Fisheries Observer Agency
IMP Interim management procedure
IQ Individual quota
ITQ Individual transferable quota
MCS Monitoring, control and surveillance
MFMR Ministry of Fisheries and Marine Resources
MSY Maximum sustainable yield
NAMFI Namibian Maritime Fisheries Institute
NHA Namibian Hake Association
NPOA National plan of action
OMP Operational management procedure
SADC Southern African Development Community
TAC Total allowable catch
VMS Vessel monitoring system
Ministry of Fisheries and Marine Resources
Hake Management Plan Page 1
1 Purpose
“A prosperous and industrialised Namibia, developed by her human resources, enjoy-
ing peace, harmony and political stability” is the Vision of Namibia for 2030 (Office
of the President 2004). The sub-vision for marine resources states that by 2030 Na-
mibia’s marine species and habitats “significantly contribute to the economy without
threatening biodiversity or the functioning of natural ecosystems, in a dynamic exter-
nal environment.”
This management plan sets goals, objectives and management measures for the hake
fishery that should bring Namibia closer to the above sub-vision during 2011-2014.
This includes three fishing seasons, from May 2011 to April 2014. The management
plan brings together in one document the relevant legal provisions and policies that
currently govern the management of the hake resource. In the development of this
plan, no significant changes in policy were made. However, the plan highlights issues
that need reviewing and further evaluation during the plan’s time frame and beyond.
Access to the hake resource comes with certain obligations for the right holders re-
garding the proper management and care of the resource and the environment. Where
appropriate, these obligations are set out in this management plan.
While the recovery and long term sustainability of the hake resource is the first prior-
ity of the plan, additional goals relate to ecosystem management; to establishing a sta-
ble business environment promoting economic efficiency; to ensuring that benefits
from the hake fishery accrue to a wide number of Namibian nationals; and to provid-
ing cost effective and participatory management of the hake fishery. Consequently,
this plan is an important step in the direction of an ecosystem approach to fisheries
management (EAF). It should be kept in mind that sometimes these goals contradict
each other, in which case compromises need to be made.
The plan refers to the hake resource as two separate stocks as one of the important
objectives during the coming years is to assess and manage the two species separately.
This is the first management plan for the hake fishery. It has two main aims. Firstly, to
bring together in one plan all the current management measures and policies that ap-
ply to the hake fishery. These measures and policies are currently found in different
documents, making it hard to obtain an overview of the fishery and its management.
Secondly, to identify aspects of the current management measures and policies that
need attention and perhaps improvement in the coming years. In order to incorporate
many of the management measures discussed in this plan a number of reviews and
investigations are needed to identify the most appropriate strategies. This is entirely to
be expected and as the plan evolves, particularly at the nominated review dates, more
specific management measures, indicators and time frames will be incorporated.
The following section (Chapter 2) briefly describes the status of knowledge of the
hake stocks, some important aspects of the industry and the current management
strategies. Chapter 3, the core section of this document, defines five goals; each goal
having a number of objectives. These objectives set out several strategies and key per-
formance indicators to allow for assessment of whether management objectives are
being achieved. Chapter 4 summarises the main management measures and any new
actions that will be required to achieve the defined goals. Chapters 5 and 6 set out the
time frame of the plan, including the review process, and describe the procedure to be
followed if any performance indicators are not being achieved.

Ministry of Fisheries and Marine Resources
Hake Management Plan Page 2
2 Current situation
This section of the management plan gives a brief synopsis of the current situation in
the fishery, providing a historical background as needed. Much of the biological in-
formation was taken from MFMR 2010; the data on the fishery coming from the an-
nual reports and the economic model used to calculate the contribution of the fishing
sector to the gross domestic product.
2.1 Biology of hake
Three species of hake occur in Namibian waters: Cape hake (Merluccius capensis),
deep-water hake (M. paradoxus) and Benguela hake (M. polli)1. Benguela hake has a
maximum total length of 80 cm, but Namibia is at the extreme southern limit of its
distribution where only much smaller fish occur. The industry has no interest in this
species and it is therefore not included in this management plan.
2.1.1 Distribution
The two species of commercially important hake occur on the continental shelf in
Namibian waters: Cape hake at depths from about 100 m to 350 m, overlapping with
the shallow end of the distribution range of deep-water hake, which occurs mainly at
depths of 300 m to 600 m.
Both species occur in Namibian and South African waters, but the degree of stock
separation, if any, is unclear. In particular, it has been suggested that deep-water hake
is shared with South Africa as there is no recent evidence of this species spawning in
Namibian waters. The transboundary nature of this species is the subject of a coopera-
tive research project between Namibia and South Africa, previously under BCLME
and BENEFIT and now under BCC.
The distribution of Cape hake extends into southern Angola, but the portion of the
stock is believed to be small and the impact on the stock of any catches is likely to be
limited.
2.1.2 Spawning
Spawning of Cape hake occurs primarily in winter, mainly between 100 m and 400 m
depending on environmental conditions. Juvenile fish are pelagic, becoming demersal
at about 2 years of age (at around 23 cm total length).
Deep-water hake has not been recorded spawning in Namibian waters (Kainge et al.
2007).
2.1.3 Diet and predation
Hake are piscivorous, feeding on a range of fish species. No data on diet from the pre-
Independence period exists, but a comparison between the recent diet of hakes in
South Africa, where the small pelagic stocks of sardine and anchovy are still abun-
dant, and Namibia show a larger component of small pelagics in South Africa. In
Namibia a greater proportion of lower quality fish are eaten, such as gobies. This sug-
gests that the diet of Namibia hakes may, historically, have contained more small
1 Note that M. capensis and M. paradoxus are sometimes referred to as “shallow-water Cape hake” and
“deep-water Cape hake,” respectively.

Ministry of Fisheries and Marine Resources
Hake Management Plan Page 3
pelagics, which with their higher energy content (per gram) may have allowed higher
productivity – faster growth, better survival and higher levels of recruitment.
The effects of predation on the hake stocks is largely unknown. This is likely to be
low for adult hake, being top predators themselves, but juvenile hake are more suscep-
tible and are known to be preyed on by a range of fish and mammals, including seals
and adult hake (cannibalism).
2.1.4 Growth
Hake may grow to more than 100 cm in length, although the largest found since trawl
surveys started in 1990 was 92 cm, but hake of up to 112 cm are still being landed by
long-line boats. Both species may live up to 12 years, but few of that age are found in
trawler samples. Cape hake and deep-water hake grow at different rates. Males mature
earlier than females in both species and have a lower average maximum length and a
higher growth rate.
According to the latest trawl survey results (2010), 50% of the Cape hake population
reaches maturity at about 21 cm, as compared to 35 cm for deep-water hake, at 1.7
and 2.5 years respectively (but see next paragraph). There is a large amount of annual
variation in growth, possibly caused by feeding conditions or by environmental fac-
tors. Growth and maturity may also vary with species abundance.
Current age validation research suggests that the age of Cape hake has previously
been overestimated and hence growth underestimated. This work still needs to be
peer-reviewed, but if accepted means that Cape hake at least are shorter-lived and
faster growing than reported above (Wilhelm pers. comm.).
2.1.5 Influence of the physical environment on hake
A regime shift is believed to have occurred in the northern Benguela during the 1980s
and 1990s, at least partially driven by fishing. Very low biomass levels of exploited
fish stocks associated with changes in the transfer of energy between predators and
prey may have resulted in a less efficient energy transfer (Cury and Shannon 2004).
This is believed to have reduced the productivity of top predators such as hake (Roux
pers. comm.)
Being demersal fish the adult portion of the stocks are partially buffered from most
environmental anomalies, which generally have the highest impact on the inshore and
near-surface pelagic zone. It is generally accepted that the 1993-1994 low oxygen
event in the central area of the Namibian shelf had a negative effect on both demersal
and pelagic fish stocks. While no clear link has been established between the occur-
rence of Benguela Niños (warm and saline surface water intrusions) and the produc-
tivity of adult hake, pre-recruits were severely affected during the 1995 Benguela
Niño through poor growth and high natural mortality. The impacts of climate change
are currently unknown and various scenarios are possible. These range from a de-
crease in upwelling, and hence productivity, of the system, through to an increase in
upwelling and productivity. An increase in the frequency and severity of adverse con-
ditions, such as Benguela Niño events, is also considered likely. It is probably safe to
speculate that any changes will have severe effects on the Namibian fishing industry,
although predicting which sectors will be most affected is difficult.

Ministry of Fisheries and Marine Resources
Hake Management Plan Page 4
2.2 Stock Assessment
An important aspect of the current approach to stock assessment is that the two hake
species are treated as a single stock, since separate data for the two species has only
been collected during research surveys since 1990. Catch, and hence the commercial
catch rate data, is not differentiated between the two species, although the proportion
of each species, and their length frequency, has been recorded from sampled catches
by on-board fisheries observers since 1997. Given that growth and maturity rates are
significantly different for the two species this is far from ideal.
During the years 1991 to 1996, hake TAC recommendations were based on the bio-
mass estimated by annual combined swept-area/acoustic research surveys. It was as-
sumed that these surveys estimated the absolute abundance of Namibian hake and a
recommended TAC was calculated as 20% of the fishable biomass2. This resulted in
the TAC increasing from 60 000 t in 1990 to 170 000 t in 1996.
Between 1997 and 2000 TAC recommendations were based on an Interim Manage-
ment Procedure (IMP); this adjusted the recommended TAC up or down depending
on trends in the research survey and the commercial CPUE data. This procedure was
introduced at a time when there was great uncertainty about the status of the hake re-
source. This IMP should have been replaced in 2001, but the process of developing
and testing a new procedure was not completed. Therefore, the TAC recommendation
for the 2001/02 season was based on an assessment which looked at the effect that
different catch levels were predicted to have on the future state of the stock. Note that
until 1999 the hake fishing season followed the calendar year. In 1999 the fishing sea-
son was changed, starting on 1 May and ending 30 April the following year.
The TACs for the 2002/03 to 2004/05 seasons were based on an Operational Man-
agement Procedure (OMP). From 2005/06 to 2008/09, the recommended TACs were
based on an age-structured production model with future projections of the stock
status using various models and assuming different levels of catch. The recommended
annual TAC was 140 000 t in 2006/07, decreasing to 100 000 t by 2009/10, but the
actual TACs were set at a constant level of 130 000 t for three seasons.
Since 1997 the main population indicators estimated were virgin biomass, current
biomass, MSY and depletion. Due to the imprecise (and in some cases unreliable)
data and different methods used to calculate these, large year-to-year variations in
recommended TACs made decision-making a difficult task. Since 2008, a reference
year of 1990 has been used as a baseline, this being the first time that reliable data be-
came available. Although, the absolute abundance of the stock in 1990 is unknown, it
is well-recognised that the resource was in a critical state at that time.
Since 2009 the stock was again evaluated using an age-structured production model.
As with the OMP this model integrates all the available reliable information from both
the commercial fishery and the research surveys on the state of resource: historic
catches, indices of abundance, age and length composition data, but calculates the
likely yield, on which TAC recommendations are based. In addition seal scat informa-
tion provides an index of recruitment. Despite the fact that the stock was assessed at
2 Note that “fishable biomass” refers to fish larger than 35 cm total length and is a management term.
“Spawning biomass”, a biological term, refers to Cape hake larger than about 21 cm and deep-water
hake larger than 35 cm when 50% of the fish reach maturity; these lengths refer to 2010 and vary ac-
cording to environmental and other conditions.

Ministry of Fisheries and Marine Resources
Hake Management Plan Page 5
being around 90% of the 1990 biomass, the TAC was increased to 148 000 in
2009/10.3
2.3 TACs and harvesting levels
Table 1 gives an overview of TACs and landings in the hake fishery from the 1990
fishing season. Note that until 1999 the hake fishing season followed the calendar
year; then the season was changed, starting on 1 May and ending 30 April the follow-
ing year. However, in the tables below landings are reported for the calendar year,
making comparison with the TAC problematic after 1999. The landings data reported
here come from the economic model used to calculate official national account statis-
tics as published annually by the National Planning Commission.
Table 1: TACs and landings of hake, 1990-2009 (tonnes)
Season TAC Year Landings
1990 60 000 1990 54 989
1991 60 000 1991 56 135
1992 90 000 1992 87 498
1993 120 000 1993 106 921
1994 150 000 1994 111 672
1995 150 000 1995 129 996
1996 170 000 1996 135 339
1997 120 000 1997 116 727
1998 165 000 1998 149 456
1999 (to May)
65 000
1999/00 210 000 1999 164 249
2000/01 194 000 2000 159 574
2001/02 200 000 2001 166 351
2002/03 195 000 2002 144 449
2003/04 180 000 2003 184 605
2004/05 195 000 2004 169 154
2005/06 180 000 2005 152 048
2006/07 130 000 2006 132 566
2007/08 130 000 2007 120 337
2008/09 130 000 2008 122 036
2009/10 148 000 2009 134 976
Analysis of the fishing seasons between 2002/03 and 2009/10 shows that on average
about 10% of the annual quota allocated to the hake industry remained uncaught;
ranging from 81.1% in 2005/06 to 99.3% in 2003/04.
2.4 The fishing industry
2.4.1 Holders of exploitation rights
Currently, 38 companies hold rights of exploitation for hake. Of these 24 companies
are fully Namibian owned and only one has less than 50% Namibian ownership. That
company is in fact fully foreign owned.
3 See Kirchner & Ianelli (2010) for more information on stock assessment of hakes.

Ministry of Fisheries and Marine Resources
Hake Management Plan Page 6
In addition to the hake right holders, small amounts of hake (as shown in Table 2) are
also allocated to large pelagic right holders, for research, to the Fish Consumption
Promotion Trust and to Lüderitz Town Council.
Table 2: Allocation of hake quotas to others (tonnes)
Recipient of quota 2008/09 2009/10
Large Pelagic Right Holders 1 000 1 000
Research 1 600 1 600
Fish Consumption Trust 443 1 000
Lüderitz Town Council 300 200
Total 3 343 3,800
2.4.2 Fishing fleet
The hake fishing fleet consists of three different types of vessels. Firstly, there are
freezer trawlers which have processing facilities onboard. In most cases their catches
are exported directly without any additional processing on-shore. Secondly, wet-fish
trawlers land their catches for further processing on-shore. Thirdly, long-line vessels
target larger fish which are exported fresh to European markets. The long-line catches
are a relatively small share of total catches, averaging 5.5% from 1998 and never ex-
ceeding 8%.
The number of vessels licensed to harvest hake fluctuates year from year, during the
past few years varying from 78 to 121 vessels. However, since vessels are often only
licensed for a part of the season these figures do not reflect the actual effort used. In
fact, vessels are often licensed, but not used for harvesting (Kirchner 2010).
During the 2009/2010 fishing season, 62% of the wet-fish trawlers are older than 30
years, with 64% of the freezer vessels also falling into that category. The long-line
fleet was somewhat younger, with an average age of 25, although 33% were older
than 30 years. Little renewal of vessels has taken place in recent years, resulting in a
fleet that is inefficient in many respects. The Fisheries and Aquaculture Conference
held in Swakopmund in 2008 recommended that it was imperative to address the
problem of Namibia’s aging fleet (MFMR 2008).
Since the hake fishery is managed with quotas, effort is not usually considered a ma-
jor concern for the management of the fishery. It is normally logical for the fishing
companies to minimise the effort they use to catch their quota by adapting the effort to
the quota allocated to them. However, as quota allocation depends partly on the level
of investments, including in vessels, some excess capacity has developed.
2.4.3 Employment
The hake industry is the major provider of employment in the fishing sector, employ-
ing around 7 000 people in the 2008/2009 fishing season (MFMR 2009b). The num-
bers employed on fishing vessels has decreased slightly during the past six years, but
this has been more than compensated by number of people working on-shore. About
98% of people working in the hake industry are Namibians and 44% are women. Of
the total, 95% have permanent jobs in the industry.
It is worth noting that even though the TAC has been highly variable in recent years,
for example falling by 27% in 2006, employment has remained relatively stable
(MFMR 2009b).

Ministry of Fisheries and Marine Resources
Hake Management Plan Page 7
2.4.4 Hake bycatch in other fisheries
Small amounts of hake are caught as bycatch in other fisheries as shown in Table 3.
Table 3: Hake as bycatch, 2007-2010 (tonnes)
Fishery 2007/8 2008/9
Monk 1 269 1 985
Mid-water 3 592 2 264
Orange Roughy 27 0
Total 4 888 4 249
2.4.5 Bycatch of other species in hake fishery
The hake fleets catch other commercial species, including orange roughy and horse
mackerel. By far the greatest amount is monk. Between 1994 and 2001 the average
catch was around 3 500 tonnes, representing almost 30% of the total monk catch.
However, monk as a percentage of the hake caught is relatively trivial, generally less
than 3%.
2.4.6 Processing and marketing
In the first years following Independence all hake catches were taken by freezer ves-
sels, processed at sea and exported directly without any on-shore processing. How-
ever, soon policies were introduced aimed at reducing offshore processing and giving
priority to the more labour intensive on-shore processing. These policies had the de-
sired effect, resulting in ever decreasing proportion of the catch processed at sea.
As the proportion of on-shore processing has increased, the number of factories has
also increased. Twenty years after Independence sixteen factories in Lüderitz and
Walvis Bay process hake with an overall capacity of over 200 000 tonnes per year.
Namibian hake products are primarily exported to Europe, with Spain traditionally
being by far the largest market. However, due to the recent financial crisis in Spain,
the exports have reduced drastically since 2007 with a greater proportion going to
South Africa and Italy.
Table 4: Exports of hake, country shares 2007-2009
Country 2007 2008 2009
Spain 71% 61% 49%
South Africa 12% 16% 24%
Italy 2% 4% 14%
Other countries 15% 19% 13%
Total 100% 100% 100%
2.5 Current management measures
The management of the hake fishery consists of a combination of exploitation rights,
TACs, individual quotas (IQs), quota fees, bycatch fees, a number of technical meas-
ures, and a comprehensive MCS and observer system.
The backbone of Namibian fisheries management is the right of exploitation. Anyone
not holding a right is strictly forbidden from fishing in Namibian waters. Rights are
issued for different time periods, ranging from seven to twenty years, depending on

Ministry of Fisheries and Marine Resources
Hake Management Plan Page 8
various factors specified in the Marine Resources Act, 2000, such as level of Namib-
ian ownership, investments and fishing experience.
TACs are set in order to ensure that the fishery is sustainable. These are determined
annually and are based on a comprehensive scientific assessment of the state of the
stocks. Recommendations from DRM are considered by the Marine Resources Advi-
sory Council who make their own recommendations. Both sets of recommendations
are forwarded to the Minister, who then sets the TAC.
IQs are allocated in order to ensure economic viability of the fishing industry. Quotas
are issued to right holders and can be caught by any vessel licensed to fish in Namib-
ian waters. These quotas are not permanently transferable, but can be leased between
right holders within a fishing season. Even if leased, it is the original right holder that
is responsible for the use of the quota and payments of fees.
Right holders must pay quota fees on the quota allocated to them. This represents the
resource rent and must be paid regardless of whether the quota is caught or not, thus
encouraging rights holders to make full use of their allocated quota. Quota fees have
proved an effective management tool to achieve a number of government objectives.
Firstly, the level of the fee is constructed in such a way that those utilising Namibian
vessels pay lower fees than those utilising foreign vessels. Secondly, hake rights hold-
ers using Namibian vessels carrying over 90% Namibian crew pay a more favourable
fee than those using crews that are less Namibian. Thirdly, to promote local employ-
ment, fish landed for on-shore processing is subject to lower quota fees than fish
processed at sea.
During a fishing trip, a vessel can only carry a quota for one species. Any other spe-
cies that is caught is labelled bycatch and a penalty fee must be paid on any such har-
vest. The bycatch fees are carefully constructed, recognising that some bycatch will
always be taken, so some bycatch is exempt from the fee. However, once the fee
comes into effect, it creates a considerable incentive to reduce the level of bycatch,
but without encouraging discarding.
Various technical measures are in place, first and foremost with the aim of protecting
the hake resource and the environment. These measures specify the allowed fishing
gear for the harvesting of hake. For instance, a bottom trawl may not have a cod-end
mesh size under 110 mm, while area and time closures are used primarily to protect
spawning grounds. All hake vessels have been banned from fishing within the 200 m
depth line since the early 1990s in order to protect both the small pelagic stocks and
juvenile hake. More recently this has been extended south of 25 ; since 2006 wet-fish
vessels have been banned from fishing within the 300 m isobath, and freezer vessels
within 350 m, to protect juvenile hake. Since 2006, fishing for hake is not allowed
during the month of October, once again to protect juvenile hake which are perceived
to move offshore, and so become mixed with the adult fish, at that time. A full list of
technical measures, such as these, are published in relevant regulations and licences
and will not be listed in this management plan (see MFMR 2001).
Finally, all Namibian vessels must carry an observer on board when fishing. The pri-
mary role of the observer is to monitor that the at-sea provisions of the Marine Re-
sources Act and Regulations are adhered to. For instance, it is forbidden by law to
discard fish, so all fish caught must be landed and it is the observer’s role to report
any discarding that may take place. The observers also play an important role in col-
lecting scientific information, primarily length frequency data, of catches.

Ministry of Fisheries and Marine Resources
Hake Management Plan Page 9
3 Management goals and objectives
The mission of the Ministry of Fisheries and Marine Resources is “to responsibly
manage living aquatic resources to continuously ensure a conducive environment for
the fishing and aquaculture sector to prosper” (MFMR 2009).
This mission statement and MFMR’s core values of transparency, accountability, eq-
uity, honesty, loyalty and diligence form the foundation for the goals and objectives
outlined in this management plan. In the plan the more general laws, regulations and
policies of the Namibian government relating to marine resources provide the basis to
many of the specific objectives for the hake fishery.
In addition, Namibia is a party to a number of regional and international legal instru-
ments and agreements. These include the United Nations Convention on the Law of
the Sea, 1982, the United Nations Fish Stocks Agreement, 1995, the FAO Compliance
Agreement, 1993, the Code of Conduct for Responsible Fisheries and its associated
International Plans of Action and the SADC Regional Protocol on Fisheries, the 2001
Reykjavik Declaration on Responsible Fisheries in the Marine Ecosystem and the Rio
(1992) and Johannesburg (2002) declarations on sustainable development. These have
all been considered in the development of this management plan.
While the plan is specifically designed for the hake fishery, due cognisance is taken of
the EAF (FAO 2003). The incorporation of the EAF into a fisheries management sys-
tem should typically be an iterative process, building on the existing system. This plan
is a first step in this process and an important objective for the first revision of the
plan (in 2014) should be to have reviewed the management system such that the EAF
can be more fully integrated at that point in time. The BCC will play an important role
in this regard (BCC 2010). Indeed, for the forthcoming 5 years, the BCC has an ambi-
tious suite of projects planned, although to be successfully achieved a large commit-
ment from MFMR will be required. It is not clear whether DRM and PPE have the
capacity to fully participate in this work. MFMR will still remain responsible to im-
plement any of the outputs from these projects.
As noted above, a considerable amount of biological and ecological research is cur-
rently being directed at hake. The plan includes many of these studies as strategies to
provide information on the most appropriate measures for the management of the
hake stocks. As these studies are completed the plan will be updated to include the
recommendations as strategies with precise indicators and time frames.
The management of the hake fishery is already well developed in Namibia and this
plan records the existing structures and measures. Some inconsistencies were identi-
fied by MFMR and other stakeholders and these are either aligned or reviews are rec-
ommended. A number of changes were also proposed during the consultation process
and reviews to investigate these have been included.
The five major management goals for the hake fishery are the following:
1. Responsible and sustainable utilisation of the hake resource.
2. Minimal impact on the ecosystem.
3. Stable business environment conducive to the promotion of economic effi-
ciency.

Ministry of Fisheries and Marine Resources
Hake Management Plan Page 10
4. Benefits from the fishery accrue to a large number of Namibians, both directly
and indirectly.
5. Efficient, cost-effective and participatory management of the fishery.
Sometimes these goals contradict each other. For instance, increasing quota fees in
order to increase the benefits accruing to Namibians as a whole, may negatively im-
pact the business environment. Also, increased employment often results in decreased
efficiency, which in turn means lower taxes and resource rents accrue to the govern-
ment (e.g., Kirchner 2010). This highlights the need for prioritisation allowing in-
formed decisions to be taken. However, the recovery and sustainable utilisation of the
hake resource is first priority.
For each goal a number of objectives have been identified. A set of strategies is linked
to each objective to ensure that the objectives are pursued effectively during the time
frame of the management plan and beyond. Each objective has an associated indicator
or output which will show whether the strategy has been completed successfully.

Ministry of Fisheries and Marine Resources
Hake Management Plan Page 11
Goal 1: Responsible and sustainable utilisation of the hake resource
The hake stocks yielded annual catches in excess of 300 000 tonnes for most years
between 1967 and 1988, the level calculated to have been the sustainable yield. The
hake stocks are currently assessed as being overexploited4 and indeed even below the
biomass at Independence in 1990, which at that time was considered to be an historic
low. There are some indications of a slight recovery in the Cape hake stock since
2007.
The decline of the hake stocks in the decades between the mid-1960s and 1990 is be-
lieved to be primarily due to prolonged annual catches in excess of the sustainable
yield level and up to 800 000 t in 1973 (unofficial reports suggest that the catches
were considerably higher); depletion of many of the key prey species, especially the
small pelagic stocks of sardine and anchovy; and possibly a change in the ecosystem
functioning. The reasons for the failure to recover during the past two decades are less
clear. TACs set above the recommended levels (catch was higher than estimated yield
in 10 of the past 20 years), partly due to a lack of data and hence uncertainties in the
assessments, may have been compounded by ecosystem anomalies resulting in high
levels of juvenile mortality and subsequent poor recruitment. The lack of high quality
prey seems to have forced the hake to switch to other lower quality food types such as
gobies, which together with increased levels of cannibalism, may have further con-
tributed to the lack of a recovery of the stocks.
It is highly unlikely that catches of historical levels will be achievable in the future;
the functioning of the ecosystem is believed to have changed, and as a result the pro-
ductivity of the hake stocks may have been reduced. Preliminary assessments suggest
that sustained catches in the order of 150 000 – 200 000 t may be the maximum possi-
ble.
Four broad objectives are defined which it is believed will lead to the achievement of
this first goal.
Objective 1.1: Recovery of the hake stocks to the MSY level
The biological goal for the hake stocks is to provide an optimal yield on a sustainable
basis. The primary biological objective is to manage the stocks to enhance the chances
of a recovery in the stocks to the biomass at which the MSY is reached. This optimal
utilisation level can only be achieved by first allowing a sustainable improvements in
the state of the stocks, including an increase in the spawning biomass of Cape hake
and an improved age structure of both species.
An indicator previously applied (to 2010) to monitor the recovery of the hake stocks
was that the combined spawning biomass of the stocks should reach the 1990 level.
This was being achieved by setting TAC levels somewhat below the average yield
(net growth), thereby allowing any excess production to grow the stock. Whether the
biomass in 1990 is an appropriate indicator is contentious given that the stock was in
such a depleted state at that time and that some abundance indicators suggest that the
4 Overexploited, according to the FAO classification scheme means that “the fishery is being exploited
above the optimal yield/effort which is believed to be sustainable in the long term, with no potential
room for further expansion and a higher risk of stock depletion/collapse”. Some may argue that the
stocks are actually depleted, i.e. “catches are well below historical optimal yields, irrespective of the
amount of fishing effort exerted”.

Ministry of Fisheries and Marine Resources
Hake Management Plan Page 12
stock has reached or is beyond this level. However interim indicators to monitor the
recovery of the stocks would clearly be useful to assess the success, or otherwise, of
management actions.
In the longer term, once the stock sizes approximate the MSY biomass, management
measures (primarily TACs) will be set slightly below MSY to ensure long-term sus-
tainable yield.
Existing population indicators (such as MSY) for the hake stocks (as a single unit) at
least partially refer to the stock from the pre-Independence era. It is likely that the
productivity of hake has changed and hence, if used as reference points, these indica-
tors may be misleading. As proposed in strategy (c), updated target and limit reference
points applicable to the new productivity regime are needed.
Table 5: Strategies for Objective 1.1: Recovery of the hake stocks to MSY level
Strategy Indicators / Outputs Time frame
(a) To set the TAC at 80% of the average
biological yield of the previous 5 years,
until strategy (c) introduces a different
strategy
Spawning biomass reaches
1990 level
TAC set annu-
ally
(b) To assess the appropriateness of 1990 as
a baseline year, and define alternative
interim indicators to monitor the recov-
ery of the stock
Alternative indicators intro-
duced
Completed be-
fore end of
2011/12 season
(c) To implement new management meas-
ures in order to enhance the recovery of
stock beyond 1990 baseline
New management measures
in place
Measures im-
plemented
within 3 years
(2013)
Objective 1.2: Management measures based on best available scientific evidence
The first objective is to manage the stocks in order to enable a recovery to a level ap-
proaching the MSY biomass. In order for this to be achieved internationally accepted
good fisheries management practices should be used, notably “…management meas-
ures ….. should be based on the best scientific evidence available and be designed to
ensure the long-term sustainability of the resource……. to maintain or restore stocks
at levels capable of producing maximum sustainable yield …….” (taken from Articles
7.11 and 7.21 of the Code of Conduct for Responsible Fisheries). This is confirmed in
the Marine Resources Act, 2000, paragraph 38 (2) which states that “TACs shall be
determined on the basis of the best scientific advice available”.
Scientifically determined TACs will be considered as maximum levels of harvest.
Note that during exceptional circumstances recommended TACs may need to be set
below this. For example, during periods of severe adverse environmental anomalies
the TAC may need to be decreased at rates greater than allowed under 3.1 (a), thus
applying the precautionary approach. Note that the Code of Conduct refers to this as
“emergency action” (FAO 1995). Catches should not exceed recommended TACs.
These first two objectives are relevant during both the rebuilding phases and once the
stock has recovered to the MSY level.
The ecosystem approach to fisheries (EAF) has in recently years been adopted as a
recognised and formal management protocol. This plan incorporates the EAF but to
more fully implement this approach some of the current legislation, policies and
strategies may need adapting. As part of this multispecies, bio-economic and social

Ministry of Fisheries and Marine Resources
Hake Management Plan Page 13
models will be developed and incorporated into management advice. These actions
will be supported by the BCC programme “Development of ecological sustainable
fisheries practices in the Benguela Large Marine Ecosystem – ECOFISH”. (BCC
2010).
Table 6: Strategies for Objective 1.2: Management measures based on best available scientific evi-dence
Strategy Indicators / Outputs Time frame
(a) To set TACs and other management
measures according to scientific recom-
mendations
Scientific advice forms the
baseline to management
decisions
Continuous
(b) To implement emergency measures dur-
ing exceptional circumstances, notably to
reduce the TAC beyond the level defined
in Objective 1.1
Only used during severe
environmental anomalies
and similar events
Rarely applied
(c) To review legal, policy and strategic
changes to the management of hake that
will be needed for the further application
of the EAF
HMP changed to fully in-
corporate EAF
Incrementally
applied during
next 5 years
Objective 1.3: New assessment of the hake stocks
The two hake species are currently assessed as a single stock, despite having different
growth, distributional and other biological characteristics. An important objective to
achieve the overall goal is to assess the two species independently and to develop
management protocols that will allow catches to be adjusted separately. Achieving
this objective in not a trivial development and will require adequate resources, and
time, to achieve. The development of regional stock assessment through BCC is
planned by the end of 2015 (BCC 2010), although, as previously noted, with all BCC
projects it will remain the responsibility of the national governments to accept and
implement outputs. Given the importance of the hake resource to the Namibian econ-
omy, and both the risks and potential lost catches through inappropriate assessments,
all efforts will be made to develop single stock assessments and the other strategies
listed below much sooner than this. Cooperation with assessment experts from outside
the region, for example with the ICES Demersal Working Group, will be considered.
Once single species assessments are developed, the outputs will need to be incorpo-
rated into management measures. As the two stocks are harvested by the same fishery,
and often both species are found in the same trawl, this will be far from simple. Set-
ting separate TACs will in all likelihood not be feasible. Effort could be used as a
blunt tool to control the amount of each species, possibly through forcing vessels to
fish in specific areas, this will be complicated by the species co-occurring in some re-
gions (notably around the 350 m bathymetric line) and annual changes in the distribu-
tions. Despite the difficulties of implementing separate species management meas-
ures, this will not be used to avoid developing the best practices possible.
The current assessment uses abundance indices spanning the history of the fishery.
The productivity of the system is believed to have changed between mid-1980s and
mid-1990s (Cury and Shannon 2004) and therefore these historical indices may no
longer be relevant. These new assessments will be based on the “current” system, only
using data from 1990 onwards.

Ministry of Fisheries and Marine Resources
Hake Management Plan Page 14
Recent ageing research suggests that at least Cape hake age-length keys have over-
estimated age and hence underestimated growth (Wilhelm In prep.). Ageing valida-
tion of both species needs to be completed and the assessments updated accordingly.
However, until these age-length keys have been fully validated the precautionary ap-
proach will be applied and the more conservation keys used, i.e. the current ones.
The migration patterns of hakes are poorly understood, but it is generally accepted
that at least deep-water hake is a shared stock with South Africa. Each country cur-
rently manages their fishery independently and harvesting strategies and management
rules of one country could have a major impact on the stock status in the other coun-
try. Ascertaining the precise transboundary nature of both stocks (but especially deep-
water hake) and agreeing on joint management protocols are crucial. This research
will include both surveys and genetic analysis. The genetic work is planned through
BCC (BCC 2010), while the surveys are already part of an EAF-Nansen project.
Note that many of the strategies listed to achieve this objective are currently being, or
will soon be, researched. Once this research has been completed it will be necessary
to define new strategies based on the outputs of the research. Until then, the indica-
tors, or outputs as they actually are, will be the results of these research projects. It is
also worth noting that this section of the management plan will be updated as and
when new information becomes available and not necessarily solely at the review pe-
riod in 2014.
Table 7: Strategies for Objective 1.3: New assessment of the hake stocks
Strategy Indicators / Outputs Time frame
(a) To develop separate species assessments.
Assessments to be peer-reviewed
Outputs of assessments
available to enable man-
agement of each species
independently
By 2016, but
ideally sooner5
(b) To investigate procedures to manage
each species independently
If feasible, management
measures implemented
As above
(c) To incorporate into new assessments
assumptions that the ecosystem has
changed
Assessments to be peer-reviewed
Availability of reliable esti-
mates of MSY and other
target and limit reference
points in new productivity
regime.
As above
(d) To validate new ageing research and
incorporate into assessments
Age-length keys incorpo-
rated into assessments, but
only if keys validated
As above
(e) To research transboundary shared stock
levels through BCC projects
Sufficient information avail-
able to negotiate manage-
ment protocols with S. Af-
rica
As above
(f) To agree transboundary management
protocols with Government of S Africa
Implementation of agreed
management protocols
31/12/2012
(g) To assess transboundary status of Cape
hake with Angola
If necessary, agree and im-
plement joint management
protocols with the Govern-
ment of Angola
5 years
5 BCC will be developing this over a 5-year project, but all efforts should be made to implement this
much earlier

Ministry of Fisheries and Marine Resources
Hake Management Plan Page 15
(h) To develop multispecies, bio-economic
and social models to replace single spe-
cies models
Model outputs used in man-
agement of hake
5 years
(i) To apply the precautionary approach
where uncertainty exists, including due
to climate change
TACs set well below the
estimated maximum yield
Continuous
(k) To improve understanding of the proc-
esses and consequences of any altered
ecosystem functioning, including the
consequences of climate change, and of
the productivity of hake
Assessments and manage-
ment can apply this informa-
tion as appropriate
Continuous
In line with the move towards an integrative EAF, multispecies, bio-economic and
social models will need to be developed to guide in the management of both hake
stocks, and other species. As already noted, much of this development will take place
within the BCC, but the incorporation of the outputs into management will remain the
responsibility of the MFMR.
Detailed monitoring of the changes in the environment and their effect on the dynam-
ics and the trophic structure of the system will be the keys to successful management
and sustainability of the system. In the interim period of uncertainty the precautionary
approach will be rigorously applied, ensuring that all fish stocks, not just the hake
stocks, are in a robust condition and hence more likely to be resilient to long-term en-
vironmental changes.
Objective 1.4: Sufficient institutional capacity, skills, equipment and funding
The above three objectives require considerable research into understanding the popu-
lation dynamics of hake stocks and advising management on appropriate options to
ensure that the objectives are reached. While a competent core of research and techni-
cal staff have been built up in the past two decades in Swakopmund and Lüderitz,
staff turn-over is high resulting in far too many personnel lacking experience. It is
critical that more staff are trained, and in particular retained, to face the challenges
that these objectives will demand of them.
Similarly, adequate equipment and funding is also needed to enable this research to be
conducted.
The current government employment and funding structures are largely designed for
routine state functions and do not cope well with highly specialised services such as
research. A review of the human resources and funding requirements to provide the
level of research required for management of the hake stocks (and others) is urgently
needed, including the consideration to privatise research (possibly within a parastatal
organisation).
Such a review, and especially the necessary recruitment and training of staff, will take
some years to achieve. The research proposed in the next few years is way beyond the
capacity of the current staff. Given the economic and social value of the hake stocks
some of this work cannot be delayed and in the interim period outside researchers
may be needed to guide some of the required tasks, possibly being drafted in through
the BCC projects. In some cases, if staffing or other resources are unavailable for
some the work proposed above, the time frames suggested may need to be reconsid-
ered.

Ministry of Fisheries and Marine Resources
Hake Management Plan Page 16
Table 8: Strategies for Objective 1.4: Sufficient institutional capacity, skills, equipment and funding
Strategy Indicators / Outputs Time frame
(a) To assess the human resource require-
ments, training and retention to imple-
ment this Goal
Report delivered 1 year
(b) To assess the equipment and funding that
is required
Sufficient research equip-
ment and funding available
2 years
(c) To implement the results of the assess-
ment
Sufficient qualified and ex-
perienced research and tech-
nical staff, etc. available
5 years
(d) To obtain support and assistance from
the industry and other stakeholders
Continuous
(e) To collect data to enable the above objec-
tives to be reached, including:
Annual trawl survey
Landings by fleet
Commercial CPUE data
Commercial length frequency data
Catch-at-age data
Seal scat data
Data are collected timeously
and are available for analysis
Continuous
The industry already provides support to research, both indirectly through the pay-
ment of a research levy, and more directly through the annual trawl survey, noting
that a new research vessel is currently being negotiated and may replace the industry
vessel currently used for the annual trawl survey. This support will be continued and
where possible extended.
Ministry of Fisheries and Marine Resources
Hake Management Plan Page 17
Goal 2: Minimal impact on the ecosystem
The ecological risks and issues for the Namibian hake fishery were compiled at an
ecological risk assessment workshop held in 2005 (Nel et al. 2005, Cochrane et al.
2007). This listed a number of issues that, if not addressed, were perceived to have a
potential negative impact on the recovery of the hake (and other) stocks. These eco-
logical risks were reviewed by a group of stakeholders in July 2009 and the issues
were combined into some specific objectives (Paterson et al. 2010). Much of the in-
formation that follows is taken from these reports.
Most of these issues are currently poorly understood and hence many of the strategies
listed under this goal are to initiate, or increase, research studying these impacts.
Within the overall goal of minimising the impact of the fishery on the ecosystem,
three broad objectives can be defined:
Objective 2.1: Maintain biodiversity and ecosystem functioning
The structure and trophic functioning of the northern Benguela ecosystem has clearly
changed during the half-century since large-scale commercial fishing started, although
precisely how and to what extent is not known. The hake fishery must bear some of
the responsibility for this and while this process can never be reversed, efforts need to
be made to halt some of the more critical negative impacts, and in the case of endan-
gered species, communities and habitats, to attempt to reverse these changes.
The small pelagic stocks are an important prey for hake, especially sardine and an-
chovy. These stocks have both become seriously depleted and as a result the hake diet
has adjusted to include a greater proportion of lower quality prey items such as go-
bies, and possibly increased cannibalism. This is believed to have affected the produc-
tivity of the hake stocks. Hence it is important for the recovery of the hake stocks that
the small pelagic stocks themselves recover. This research will partly be conducted
through the BCC where the trophic position of small pelagics, hake and horse mack-
erel will be determined (BCC 2010).
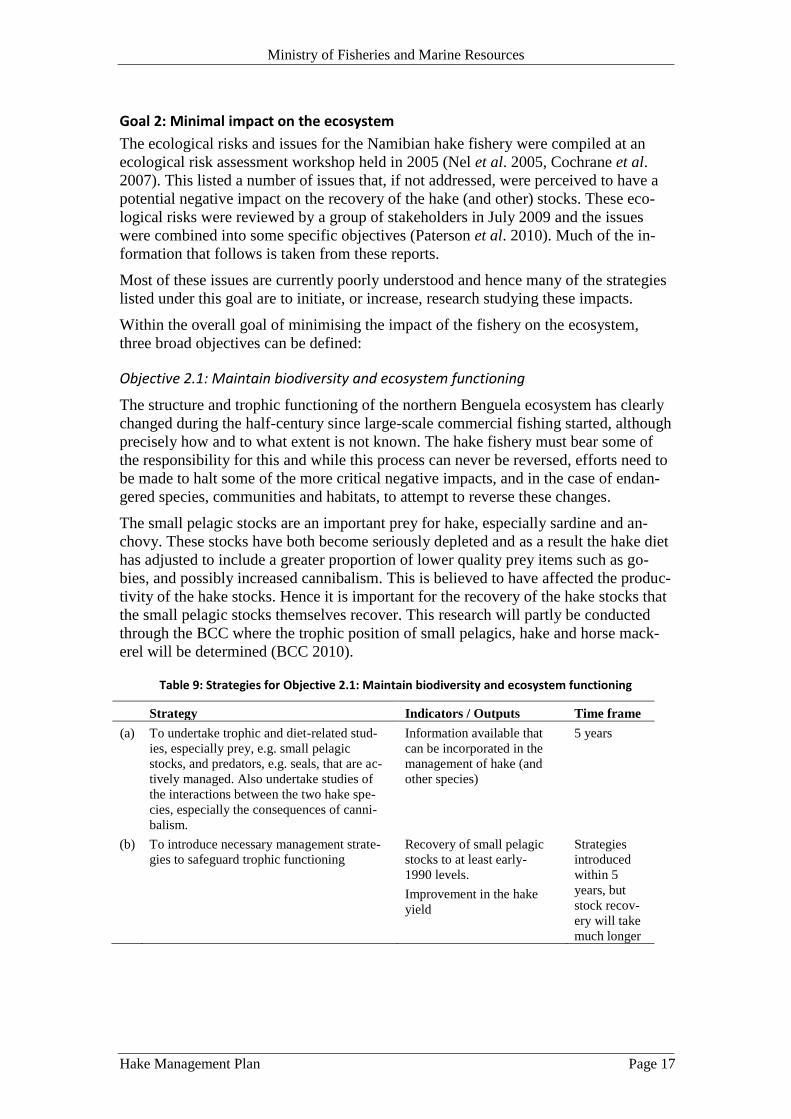
Table 9: Strategies for Objective 2.1: Maintain biodiversity and ecosystem functioning
Strategy Indicators / Outputs Time frame
(a) To undertake trophic and diet-related stud-
ies, especially prey, e.g. small pelagic
stocks, and predators, e.g. seals, that are ac-
tively managed. Also undertake studies of
the interactions between the two hake spe-
cies, especially the consequences of canni-
balism.
Information available that
can be incorporated in the
management of hake (and
other species)
5 years
(b) To introduce necessary management strate-
gies to safeguard trophic functioning
Recovery of small pelagic
stocks to at least early-
1990 levels.
Improvement in the hake
yield
Strategies
introduced
within 5
years, but
stock recov-
ery will take
much longer

Ministry of Fisheries and Marine Resources
Hake Management Plan Page 18
Objective 2.2: Minimise bycatches including incidental mortality of non-commercial species
The bycatch of other commercial species has been more successfully managed in
Namibia than most fishing nations. Despite this, bycatch remains a concern and needs
to be monitored to ensure that the yield of these species is not compromised. Monk is
the main species of concern, but the bycatch of other species will also be minimised.
Similarly, the bycatch of hake in the midwater fishery and of juvenile hake in the
small pelagic fisheries, and also in the hake fishery itself, will be carefully monitored
and actions implemented to reduce hake bycatch if necessary.
Incidental mortality (bycatch) of non-commercial species in fisheries is a universal
problem, with an increasing realization of the seriousness of the impacts on vulnerable
species, such as sharks and seabirds. The bycatch of seabirds may be negatively im-
pacting the viability of 13 species of albatross and petrels, plus Cape gannet (Morus
capensis) in Namibia. This is compounded by changes in behaviour and population
dynamics due to the supplementation of their diets by foraging on offal, discards and
fish “stolen” from the cod-end or off the line.
The bycatch of sharks may be negatively impacting the viability of three endemic
(Benguela) shark species and three endemic skate species. The impacts on the popula-
tions of other sharks and rays (not currently classified as threatened or specifically
protected), such as blue and mako sharks (a targeted fishery for mako sharks exists) is
similarly unknown but may be significant.
Research to ascertain the precise level of mortalities and the impact of supplementary
feeding on these vulnerable species is urgently needed. National Plans of Action
(NPOAs) for both seabirds and sharks have been developed, which detail the imple-
mentation of mitigating devices and practices. Sufficient information on the negative
impacts of both trawl and line fisheries on these vulnerable species exists from else-
where in the world to indicate that these need to be adopted with immediate effect,
even before the precise impact on local species has been ascertained.
Changes in behaviour, population dynamics and distribution of seals through foraging
on offal and ingestion of discarded rubbish is possible but unknown. Measures to
minimise these impacts will be taken immediately prior to research to quantify them.
Table 10: Strategies for Objective 2.2: Minimise bycatches including incidental mortality of non-commercial species
Strategy Indicators / Outputs Time frame
(a) To assess the cost-effectiveness of current
bycatch measures for commercial species
and conduct further research into mini-
mising bycatch (of all commercial spe-
cies), including area closures and techni-
cal measures
Introduction of appropriate im-
provements
5 years
(b) To approve and implement NPOA for
seabirds
Introduction of methods to re-
duce the impact on seabird
populations
Immediate
(c) To approve and implement NPOA for
sharks
Introduction of methods to re-
duce bycatch of sharks and rays
Immediate
(d) To assess the extent of seal mortalities in
hake fishery
If necessary, introduce appro-
priate management measures
5 years

Ministry of Fisheries and Marine Resources
Hake Management Plan Page 19
Objective 2.3: Mitigate habitat and substrate damage
The impact of trawling on the substrate is a global problem. Research needs regarding
ecologically sensitive marine habitats and ecologically important areas within Na-
mibia have been identified but so far, apart from a broad area classification of trawl-
ing impacts and some limited experimental work, little has been attempted (Mafwila
In prep.). Fishery impacts on the populations and structures of the benthic fish com-
munity (primarily rattails) is similarly well-recognised, but the level of impact is un-
known within the Namibian system. Considerably more work detailing the impacts of
fishing on the substrate and benthic zone is needed.
Table 11: Strategies for Objective 2.3: Mitigate habitat and substrate damage
Strategy Indicators / Outputs Time frame
(a) To extend research measures on the effect of
trawling and other gear types on substrate
habitat and benthic community, including a
review of the effectiveness of current pro-
tected areas
Propose mitigating methods
to reduce impacts
5 years6
(b) To introduce mitigating methods after stake-
holder consultations, including establishing
closed areas
Damage to substrate and
benthic communities re-
duced
As above
Objective 2.4: Sufficient institutional capacity, skills, equipment and funding
As detailed under Goal 1, considerable research effort will be needed to achieve Ob-
jectives 2.1, 2.2 and 2.3. The staff and funding requirements need to be defined and
appropriate changes made.
Table 12: Strategies for Objective 2.4: Sufficient institutional capacity, skills, equipment and funding
Strategy Indicators / Outputs Time frame
(a) Same strategy as in Objective 1.4 (a, b, c and
d)
(b) To collect data to enable the above objec-
tives to be reached, including (but not lim-
ited to):
Probable inter-annual variability in
yield and any likely long-term trends
in resource productivity
Details on environmental constraints
and sensitive habitats
Data on predator-prey relationships
Data are collected timeously
and available for analysis
Continuous
6 Time frames for these strategies are uncertain and may need to be revised once the capacity of DRM
has been reviewed

Ministry of Fisheries and Marine Resources
Hake Management Plan Page 20
Goal 3: Stable business environment established conducive to the promotion of economic efficiency
Most of Namibian hake catches are exported and sold in foreign markets, thus provid-
ing valuable foreign exchange earnings. Namibian hake products compete against
similar products from many other countries. In order for Namibian companies to be
competitive in these markets, it is important for them to operate in an environment
that allows them to respond to changes in the markets as well as to changes in various
external factors that affect profitability.
The following three objectives all work towards the above goal.
Objective 3.1: The hake industry can respond effectively to external changes.
A number of external factors have the potential of significantly affecting the eco-
nomic viability of the hake industry. Fuel comprises a considerable part of the expen-
ditures of a fishing company, typically 15-25%. Changes in oil prices can therefore
have a considerable impact on profitability. Market prices are another important fac-
tor. As hake from Namibia competes with fish from many other countries, the impact
that Namibian companies can have on the fish price is negligible. Namibian compa-
nies are more or less price-takers and must have the ability to adjust to changes in
prices in the foreign markets. Finally, the exchange rate of the Namibian dollar
against other currencies can have a large impact of fishing companies that earn most
of their revenue in foreign currency while costs are to a large degree in Namibian dol-
lars.
The possibility of changes in these three factors requires that the hake industry main-
tains a degree of flexibility in its operations. While the Namibian government cannot
influence these factors directly, it may be possible to have policies in place that makes
the industry better equipped to meet such changes. In order to be equipped to do that,
MFMR needs to have reliable information about the operations of the hake industry.
For that purpose MFMR undertakes the annual Income and Expenditure Survey. It is
imperative, as with all data collection, that correct information be provided in a timely
manner.
In addition to the above external factors, the industry depends on a volatile resource,
where the overall production is constrained by the level of TAC. For example, in
2005/06, the TAC for hake was 180 000 tonnes, but the following season it had re-
duced to 130 000 tonnes, a decrease of more than 27%. A similar decrease was ex-
perienced from 1996 to 1997. While the Ministry is unable to affect external factors
such as fuel prices, market fluctuations and exchange rate changes, providing a level
of certainty of TAC and allocation of quotas is within the power of MFMR and will
reduce one of the major causes of uncertainty faced by industry.
In order to reduce the “TAC uncertainty” the Ministry will aim to maintain stability
from one year to the next by keeping changes of the TAC within a range of ±10%.
This will only be deviated from in exceptional circumstances, for example, in the case
of a severe environmental anomaly, in line with Strategy 1.2 (b). In such circum-
stances the TAC may be reduced more than 10%. It is not foreseen that the TAC will
be increased by more than 10% from one year to the next.
Once a TAC has been announced, it will not be changed within a fishing season. The
possibility of an increase in the TAC currently results in some quota holders harvest-

Ministry of Fisheries and Marine Resources
Hake Management Plan Page 21
ing their quota earlier, as an increase in the quota is anticipated. This behaviour re-
duces the efficiency of the quota system, resulting in wasteful operations.
The Minister divides the TAC into individual quotas and allocates to right holders.
The main reason for the quotas is to allow right holders to harvest their share of the
TAC as efficiently as possible. Quotas also reduces risk, as right holders know that
the quota is exclusively theirs until the end of the fishing season. The Marine Re-
sources Act, 2000, guides the Minister as to the criteria he may use when allocating
quotas.
Currently, quotas are allocated for one year, with the allocation announcement made a
few weeks prior to the start of each fishing season. Right holders have for a long time
complained that quota allocations lack transparency and that it would be preferable to
have quotas allocated for a longer period. One possibility is that a right holder be
given a certain percentage of the TAC for a number of years. This could be a perma-
nent percentage or linked to a rolling TAC, for instance for three years. Another pos-
sibility is that a certain part of the TAC is allocated permanently and the remainder is
at the discretion of the Minister. Other possibilities exist. The Ministry will embark on
a study to explore alternative ways to allocate quotas (Esau 2011) to reduce uncer-
tainty in the industry further.
According to the Marine Resources Policy, quota fees should provide revenue to gov-
ernment valued between 5 and 15 percent of the first-hand value of the catch (MFMR
2004). That implies that if the first-hand value falls, so should the quota fee revenue
and vice versa. Currently, quota fees are rarely changed resulting in quota fees reve-
nue fluctuating as a percentage of the first-hand value. By linking quota fees to prices
and exchange rates the quota fee revenue would better match government policy.
Such a link would benefit industry when there is a downturn in markets. If the market
price of fish falls, or if the Namibian dollar gains strength, revenue of the fishing
companies when measured in Namibian dollars reduces. Consequently, the currently
fixed quota fee becomes a larger share of the price received for the fish. On the other
hand, when prices increase, or the Namibian dollar weakens, the revenue of the indus-
try rises and the quota fees become a smaller share of the price received. In this way,
the fixed quota fees can increase fluctuations in profits. Intuitively, this should be the
other way around; when prices fall the quota fee should fall, easing the price drop.
When prices increase the quota fee should rise, allowing the state to capture a part of
the price increase.
In a BCLME report (BCLME 2007) it was pointed out that the process of calculating
fees in Namibian fisheries lacks a quantitative basis and that MFMR acknowledges
the importance of taking into account the economic viability of the industry and its
international competitiveness when setting charges, such as quota fees.
A review of quota-related fees was started in 2008. It is important to finish that re-
view, keeping the above concerns in mind. Of course, one consideration will be the
effort and cost needed by MFMR to adjust the quota fees periodically. However, be-
tween 2005 and 2007 quota fees for hake were less than 3% of the first-hand value,
indicating that quota fee revenues could increase by tens of millions of dollars if
brought up to 5%. Such an increase would warrant some increase in the administrative
costs of collecting and monitoring the fees.
In the case of longer-term external changes, such as the continuing increase in the
price of fuel, companies, regardless of sector, often change their structure. Sometimes
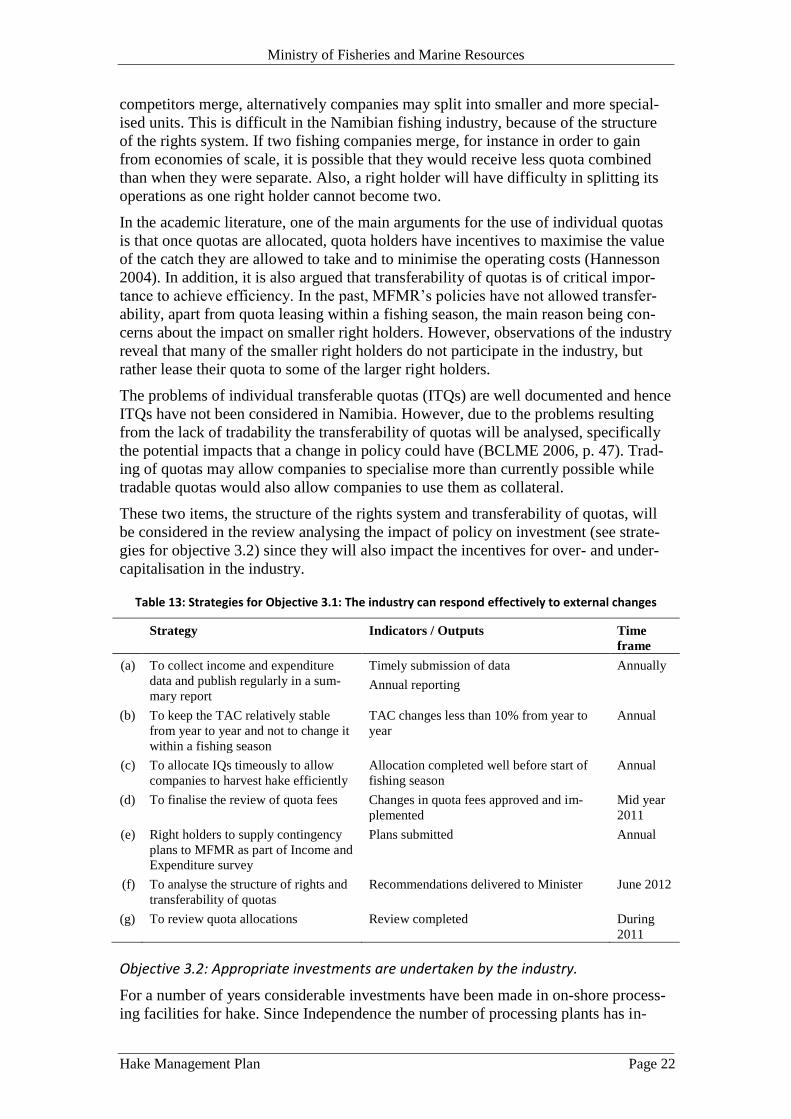
Ministry of Fisheries and Marine Resources
Hake Management Plan Page 22
competitors merge, alternatively companies may split into smaller and more special-
ised units. This is difficult in the Namibian fishing industry, because of the structure
of the rights system. If two fishing companies merge, for instance in order to gain
from economies of scale, it is possible that they would receive less quota combined
than when they were separate. Also, a right holder will have difficulty in splitting its
operations as one right holder cannot become two.
In the academic literature, one of the main arguments for the use of individual quotas
is that once quotas are allocated, quota holders have incentives to maximise the value
of the catch they are allowed to take and to minimise the operating costs (Hannesson
2004). In addition, it is also argued that transferability of quotas is of critical impor-
tance to achieve efficiency. In the past, MFMR’s policies have not allowed transfer-
ability, apart from quota leasing within a fishing season, the main reason being con-
cerns about the impact on smaller right holders. However, observations of the industry
reveal that many of the smaller right holders do not participate in the industry, but
rather lease their quota to some of the larger right holders.
The problems of individual transferable quotas (ITQs) are well documented and hence
ITQs have not been considered in Namibia. However, due to the problems resulting
from the lack of tradability the transferability of quotas will be analysed, specifically
the potential impacts that a change in policy could have (BCLME 2006, p. 47). Trad-
ing of quotas may allow companies to specialise more than currently possible while
tradable quotas would also allow companies to use them as collateral.
These two items, the structure of the rights system and transferability of quotas, will
be considered in the review analysing the impact of policy on investment (see strate-
gies for objective 3.2) since they will also impact the incentives for over- and under-
capitalisation in the industry.
Table 13: Strategies for Objective 3.1: The industry can respond effectively to external changes
Strategy Indicators / Outputs Time
frame
(a) To collect income and expenditure
data and publish regularly in a sum-
mary report
Timely submission of data
Annual reporting
Annually
(b) To keep the TAC relatively stable
from year to year and not to change it
within a fishing season
TAC changes less than 10% from year to
year
Annual
(c) To allocate IQs timeously to allow
companies to harvest hake efficiently
Allocation completed well before start of
fishing season
Annual
(d) To finalise the review of quota fees Changes in quota fees approved and im-
plemented
Mid year
2011
(e) Right holders to supply contingency
plans to MFMR as part of Income and
Expenditure survey
Plans submitted Annual
(f) To analyse the structure of rights and
transferability of quotas
Recommendations delivered to Minister June 2012
(g) To review quota allocations Review completed During
2011
Objective 3.2: Appropriate investments are undertaken by the industry.
For a number of years considerable investments have been made in on-shore process-
ing facilities for hake. Since Independence the number of processing plants has in-

Ministry of Fisheries and Marine Resources
Hake Management Plan Page 23
creased from none to sixteen. The result is increased employment and higher value
products. However, the processing capacity of these factories, above 200 000 tonnes
annually, is now excessive given the size of the hake resource itself.
The fleet largely consists of old and inefficient vessels. This has a number of undesir-
able effects. For instance, the safety of crews may be compromised. From an envi-
ronmental perspective, old vessels use more fuel than newer vessels, resulting in a
larger carbon footprint of the industry on the environment. In general, older vessels
are more costly to run than newer vessels, resulting in considerable inefficiencies in
fisheries operations. Renewal of the fishing fleet has become a pressing issue. In spite
of this, few companies have invested in new vessels in recent years.
Another important issue worth considering is that the Namibian fleet consists of too
many vessels (Kirchner 2010); the current fleet could easily catch well over 200 000
tonnes annually. It is likely that the current policy of a right holder needing to own a
share in a vessel is maintaining the number of vessels higher than is efficient given the
level of TAC.
It is important to look at the incentives of the current policies of the government and
analyse how investment efforts can be diverted from processing plants to new fishing
vessels, while also promoting decommissioning of old vessels. Fishing vessels are
highly specialised investments, with a long lifetime and require considerable funds. If
a right holder has less than 10 years remaining of a fishing right, then investing in
equipment costing tens of millions of Namibian dollars, with a lifespan of more than
30 years is likely to be considered excessively risky. Longer term quota allocations,
such as discussed in the previous objective, and amendments in the durability of fish-
ing rights are likely to improve the incentive to invest in new fishing vessels. Hannes-
son (2004, p. 57) states that if quotas “are valid for the long term, they also provide
incentives for quota holders to invest optimally in fishing vessels.”
For MFMR to establish appropriate investment policies it needs to have access to reli-
able information on investments in the industry. MFMR will continue collecting such
information as part of the annual Income and Expenditure Survey. The hake industry
must provide accurate and timeous information.
Using the terms of the financial sector, the hake industry has over-capitalised in proc-
essing plants and under-capitalised in fishing vessels. If efficiency is to be attained,
this needs to be corrected. In order to address this, the Ministry will lead a study ana-
lysing the current investment incentives in the hake industry and provide recommen-
dations aimed to encourage investments in new vessels. It is important to include the
financial sector in this work, both the commercial banks and the Development Bank
of Namibia. In the past, the idea of a special development bank for the fishing sector
has been raised. The viability of such a bank will be investigated thoroughly. The
study will incorporate issues raised as part of Objective 3.3.
Table 14: Strategies for Objective 3.2: Appropriate investments are undertaken by the industry
Strategy Indicators / Outputs Time frame
(a) To collect and analyse investment data as part of
the Income and Expenditure survey
Timely submission of data
Annual reporting
Annually
(b) To analyse the impact of current management
policies on investment
Analysis with recommen-
dations completed
June 2012
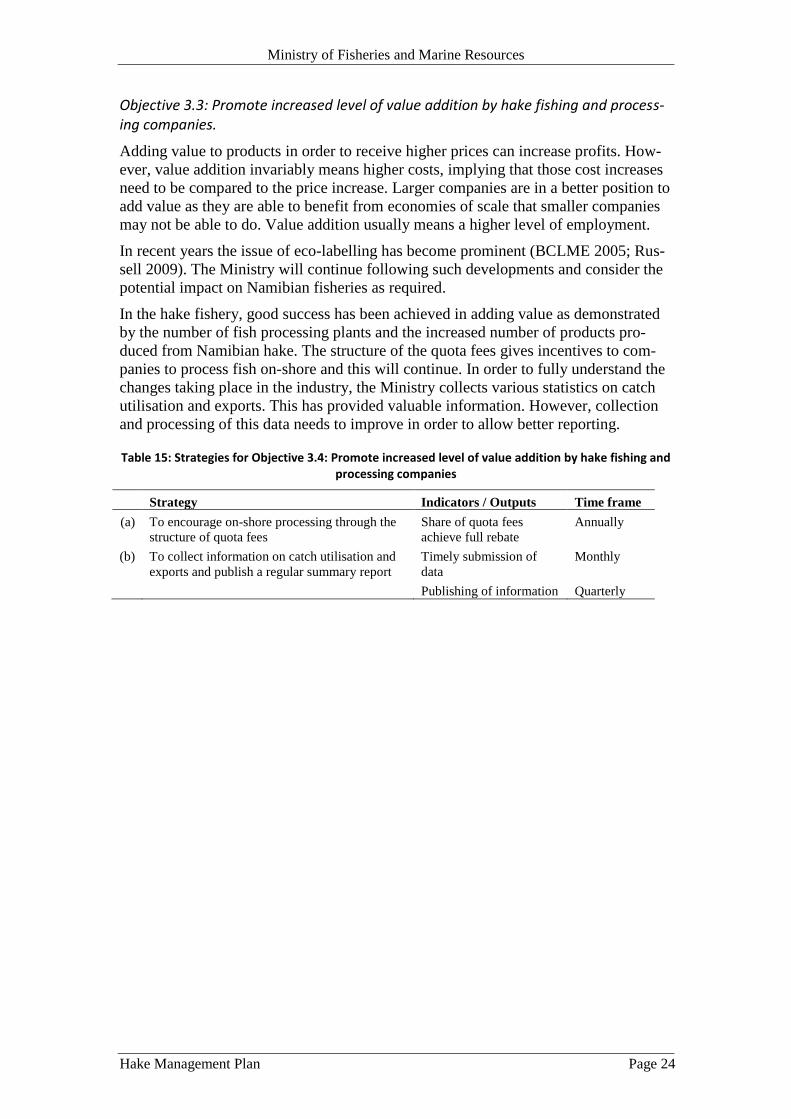
Ministry of Fisheries and Marine Resources
Hake Management Plan Page 24
Objective 3.3: Promote increased level of value addition by hake fishing and process-ing companies.
Adding value to products in order to receive higher prices can increase profits. How-
ever, value addition invariably means higher costs, implying that those cost increases
need to be compared to the price increase. Larger companies are in a better position to
add value as they are able to benefit from economies of scale that smaller companies
may not be able to do. Value addition usually means a higher level of employment.
In recent years the issue of eco-labelling has become prominent (BCLME 2005; Rus-
sell 2009). The Ministry will continue following such developments and consider the
potential impact on Namibian fisheries as required.
In the hake fishery, good success has been achieved in adding value as demonstrated
by the number of fish processing plants and the increased number of products pro-
duced from Namibian hake. The structure of the quota fees gives incentives to com-
panies to process fish on-shore and this will continue. In order to fully understand the
changes taking place in the industry, the Ministry collects various statistics on catch
utilisation and exports. This has provided valuable information. However, collection
and processing of this data needs to improve in order to allow better reporting.
Table 15: Strategies for Objective 3.4: Promote increased level of value addition by hake fishing and processing companies
Strategy Indicators / Outputs Time frame
(a) To encourage on-shore processing through the
structure of quota fees
Share of quota fees
achieve full rebate
Annually
(b) To collect information on catch utilisation and
exports and publish a regular summary report
Timely submission of
data
Publishing of information
Monthly
Quarterly
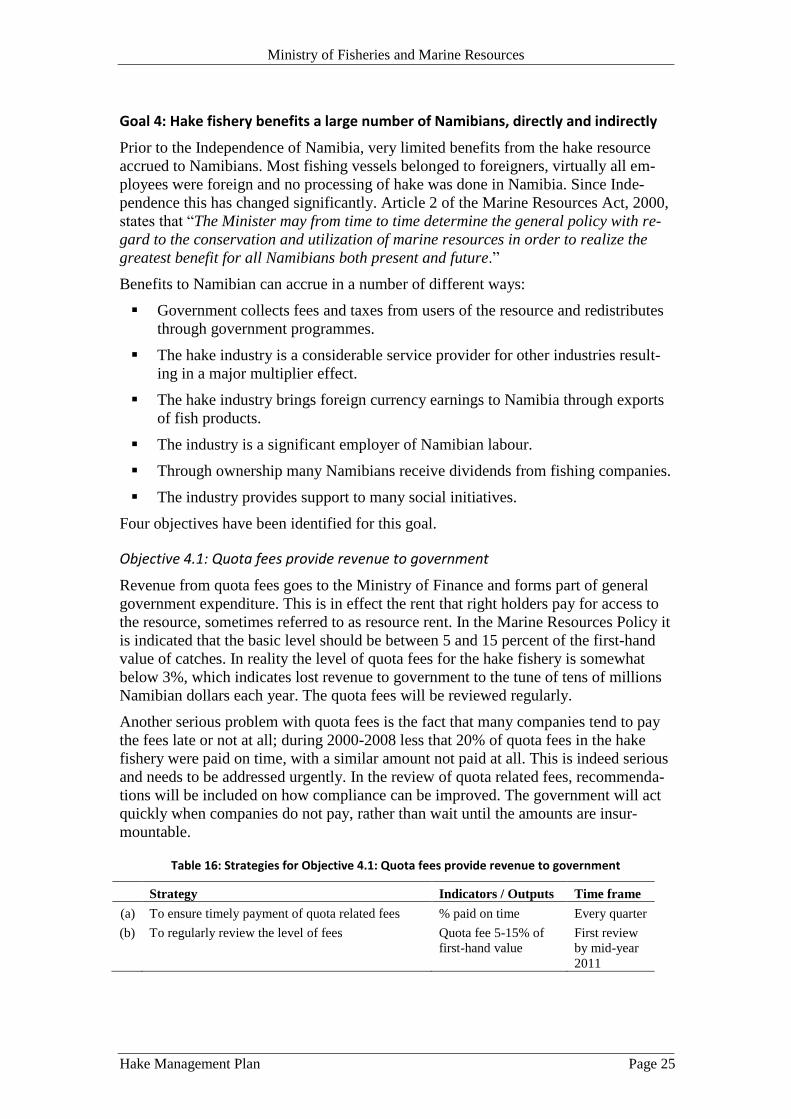
Ministry of Fisheries and Marine Resources
Hake Management Plan Page 25
Goal 4: Hake fishery benefits a large number of Namibians, directly and indirectly
Prior to the Independence of Namibia, very limited benefits from the hake resource
accrued to Namibians. Most fishing vessels belonged to foreigners, virtually all em-
ployees were foreign and no processing of hake was done in Namibia. Since Inde-
pendence this has changed significantly. Article 2 of the Marine Resources Act, 2000,
states that “The Minister may from time to time determine the general policy with re-
gard to the conservation and utilization of marine resources in order to realize the
greatest benefit for all Namibians both present and future.”
Benefits to Namibian can accrue in a number of different ways:
Government collects fees and taxes from users of the resource and redistributes
through government programmes.
The hake industry is a considerable service provider for other industries result-
ing in a major multiplier effect.
The hake industry brings foreign currency earnings to Namibia through exports
of fish products.
The industry is a significant employer of Namibian labour.
Through ownership many Namibians receive dividends from fishing companies.
The industry provides support to many social initiatives.
Four objectives have been identified for this goal.
Objective 4.1: Quota fees provide revenue to government
Revenue from quota fees goes to the Ministry of Finance and forms part of general
government expenditure. This is in effect the rent that right holders pay for access to
the resource, sometimes referred to as resource rent. In the Marine Resources Policy it
is indicated that the basic level should be between 5 and 15 percent of the first-hand
value of catches. In reality the level of quota fees for the hake fishery is somewhat
below 3%, which indicates lost revenue to government to the tune of tens of millions
Namibian dollars each year. The quota fees will be reviewed regularly.
Another serious problem with quota fees is the fact that many companies tend to pay
the fees late or not at all; during 2000-2008 less that 20% of quota fees in the hake
fishery were paid on time, with a similar amount not paid at all. This is indeed serious
and needs to be addressed urgently. In the review of quota related fees, recommenda-
tions will be included on how compliance can be improved. The government will act
quickly when companies do not pay, rather than wait until the amounts are insur-
mountable.
Table 16: Strategies for Objective 4.1: Quota fees provide revenue to government
Strategy Indicators / Outputs Time frame
(a) To ensure timely payment of quota related fees % paid on time Every quarter
(b) To regularly review the level of fees Quota fee 5-15% of
first-hand value
First review
by mid-year
2011
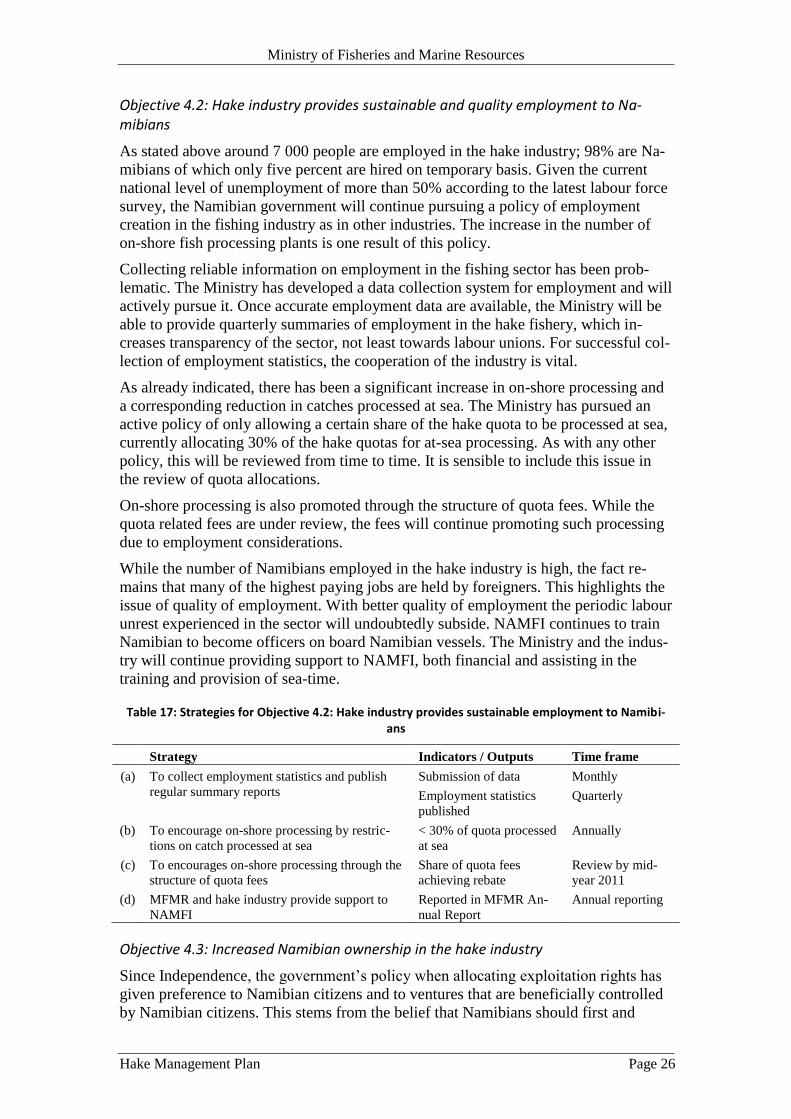
Ministry of Fisheries and Marine Resources
Hake Management Plan Page 26
Objective 4.2: Hake industry provides sustainable and quality employment to Na-mibians
As stated above around 7 000 people are employed in the hake industry; 98% are Na-
mibians of which only five percent are hired on temporary basis. Given the current
national level of unemployment of more than 50% according to the latest labour force
survey, the Namibian government will continue pursuing a policy of employment
creation in the fishing industry as in other industries. The increase in the number of
on-shore fish processing plants is one result of this policy.
Collecting reliable information on employment in the fishing sector has been prob-
lematic. The Ministry has developed a data collection system for employment and will
actively pursue it. Once accurate employment data are available, the Ministry will be
able to provide quarterly summaries of employment in the hake fishery, which in-
creases transparency of the sector, not least towards labour unions. For successful col-
lection of employment statistics, the cooperation of the industry is vital.
As already indicated, there has been a significant increase in on-shore processing and
a corresponding reduction in catches processed at sea. The Ministry has pursued an
active policy of only allowing a certain share of the hake quota to be processed at sea,
currently allocating 30% of the hake quotas for at-sea processing. As with any other
policy, this will be reviewed from time to time. It is sensible to include this issue in
the review of quota allocations.
On-shore processing is also promoted through the structure of quota fees. While the
quota related fees are under review, the fees will continue promoting such processing
due to employment considerations.
While the number of Namibians employed in the hake industry is high, the fact re-
mains that many of the highest paying jobs are held by foreigners. This highlights the
issue of quality of employment. With better quality of employment the periodic labour
unrest experienced in the sector will undoubtedly subside. NAMFI continues to train
Namibian to become officers on board Namibian vessels. The Ministry and the indus-
try will continue providing support to NAMFI, both financial and assisting in the
training and provision of sea-time.
Table 17: Strategies for Objective 4.2: Hake industry provides sustainable employment to Namibi-ans
Strategy Indicators / Outputs Time frame
(a) To collect employment statistics and publish
regular summary reports
Submission of data
Employment statistics
published
Monthly
Quarterly
(b) To encourage on-shore processing by restric-
tions on catch processed at sea
< 30% of quota processed
at sea
Annually
(c) To encourages on-shore processing through the
structure of quota fees
Share of quota fees
achieving rebate
Review by mid-
year 2011
(d) MFMR and hake industry provide support to
NAMFI
Reported in MFMR An-
nual Report
Annual reporting
Objective 4.3: Increased Namibian ownership in the hake industry
Since Independence, the government’s policy when allocating exploitation rights has
given preference to Namibian citizens and to ventures that are beneficially controlled
by Namibian citizens. This stems from the belief that Namibians should first and

Ministry of Fisheries and Marine Resources
Hake Management Plan Page 27
foremost benefit from the utilisation of Namibia’s marine resources. This policy will
not change.
While the government gives preference to Namibians, it also acknowledges the bene-
fits from foreign investment and expertise in the industry. The Ministry appreciates
the interest of foreign investors and will accommodate them expecting that those in-
vestors respect Namibian legislation and policies. Apart from allocation of fishing
rights, the main tool to promote the participation of Namibians in the hake fishery is
the structure of quota fees. While quota fees will be reviewed on regular basis, they
will still be used for the promotion of Namibian participation in the hake fishery.
Table 18: Strategies for Objective 4.3: Increased Namibian ownership in the hake industry
Strategy Indicators / Outputs Time frame
(a) To give preference to Namibians when rights
are allocated
% Nam. ownership When rights allo-
cated
(b) To encourage Namibian ownership through
the structure of quota fees
% Nam. ownership Biennially
Objective 4.4: Support to community initiatives encouraged.
While the marine resources are owned by the people of Namibia, only a few are able
to receive direct benefits through employment and ownership of fishing companies. It
is well known that the hake industry contributes in many meaningful ways to the
community at large. This will continue to be encouraged.
The Marine Resources Act, 2000, states that the Minister may keep socio-economic
concerns in mind when allocating rights and quotas. The Ministry will keep track of
socio-economic contributions, for instance through the Income and Expenditure Sur-
vey. Orphans and vulnerable children should, in particular, benefit from the industry
support.
Given the high incidence of HIV/AIDS in Namibia, the Ministry and hake industry
will continue their efforts against the epidemic. This will be done mostly through
training and support to those carrying the disease.
Through the Fish Consumption Promotion Trust, the Namibian government continues
its efforts to encourage Namibians to consume more fish. The Trust has been sup-
ported by the hake industry in the past and will continue to do so.
Table 19: Strategies for Objective 4.4: Support to community initiatives encouraged.
Strategy Indicators / Outputs Time frame
a. To keep socio-economic concerns in mind when
allocating rights and quotas
Data published in
economic report
Annually
b. MFMR and industry provide training on
HIV/AIDS
Number of right hold-
ers with an active
HIV/AIDS policy
Annually
c. Hake industry gives support to the Fish Consump-
tion Promotion Trust
Annual report of
FCPT
Annually
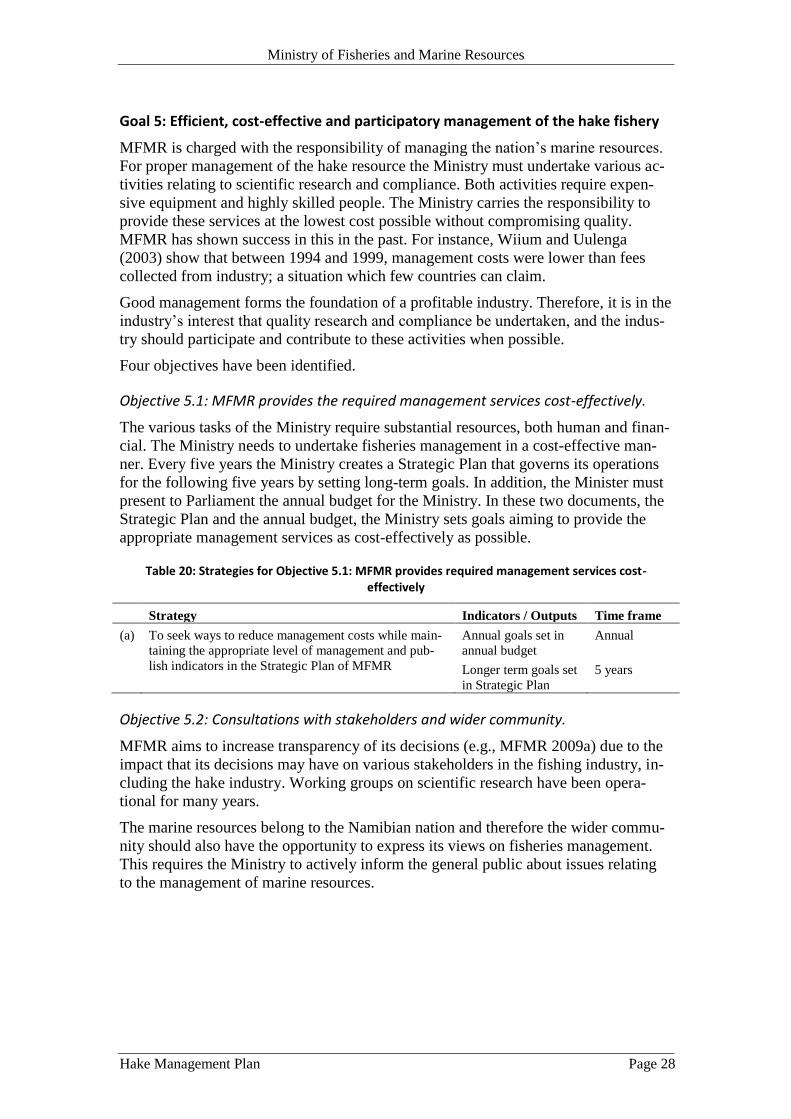
Ministry of Fisheries and Marine Resources
Hake Management Plan Page 28
Goal 5: Efficient, cost-effective and participatory management of the hake fishery
MFMR is charged with the responsibility of managing the nation’s marine resources.
For proper management of the hake resource the Ministry must undertake various ac-
tivities relating to scientific research and compliance. Both activities require expen-
sive equipment and highly skilled people. The Ministry carries the responsibility to
provide these services at the lowest cost possible without compromising quality.
MFMR has shown success in this in the past. For instance, Wiium and Uulenga
(2003) show that between 1994 and 1999, management costs were lower than fees
collected from industry; a situation which few countries can claim.
Good management forms the foundation of a profitable industry. Therefore, it is in the
industry’s interest that quality research and compliance be undertaken, and the indus-
try should participate and contribute to these activities when possible.
Four objectives have been identified.
Objective 5.1: MFMR provides the required management services cost-effectively.
The various tasks of the Ministry require substantial resources, both human and finan-
cial. The Ministry needs to undertake fisheries management in a cost-effective man-
ner. Every five years the Ministry creates a Strategic Plan that governs its operations
for the following five years by setting long-term goals. In addition, the Minister must
present to Parliament the annual budget for the Ministry. In these two documents, the
Strategic Plan and the annual budget, the Ministry sets goals aiming to provide the
appropriate management services as cost-effectively as possible.
Table 20: Strategies for Objective 5.1: MFMR provides required management services cost-effectively
Strategy Indicators / Outputs Time frame
(a) To seek ways to reduce management costs while main-
taining the appropriate level of management and pub-
lish indicators in the Strategic Plan of MFMR
Annual goals set in
annual budget
Longer term goals set
in Strategic Plan
Annual
5 years
Objective 5.2: Consultations with stakeholders and wider community.
MFMR aims to increase transparency of its decisions (e.g., MFMR 2009a) due to the
impact that its decisions may have on various stakeholders in the fishing industry, in-
cluding the hake industry. Working groups on scientific research have been opera-
tional for many years.
The marine resources belong to the Namibian nation and therefore the wider commu-
nity should also have the opportunity to express its views on fisheries management.
This requires the Ministry to actively inform the general public about issues relating
to the management of marine resources.

Ministry of Fisheries and Marine Resources
Hake Management Plan Page 29
Table 21: Strategies for Objective 5.2: Consultations with stakeholders and wider community
Strategy Indicators / Outputs Time frame
(a) To ensure active cooperation between industry and
MFMR, in particular in matters relating to biological,
economic and social research
Regular working
groups meetings held
Continuous
(b) To seek stakeholders’ input when preparing manage-
ment plans and undertaking policy review
Meetings and work-
shops
Ongoing
(c) To communicate management arrangements to stake-
holders and the wider community
Press releases and
statistical bulletins
Quarterly
Objective 5.3: Industry contributes to research and compliance.
The hake industry is the main beneficiary of the fisheries research and the compliance
of laws and regulations governing the management of the hake resource. As a result,
the industry has in the past contributed to research and compliance and will continue,
both through levies for the Marine Resources Fund and the Fisheries Observers Fund,
as well as participating in scientific surveys and various data collections.
Table 22: Strategies for Objective 5.3: Industry contributes to research and compliance
Strategy Indicators / Outputs Time frame
(a) Industry to pay levies into the Marine Resources
Fund and the Fisheries Observers Fund
Timely payments Quarterly
(b) Fishing industry to supply fishing vessel for scien-
tific surveys noting that this may in future be taken
over by the planned MFMR research vessel
Survey completed Annual
(c) To provide timely accurate biological, economic
and social data
Data received by
MFMR
Monthly or
annual as
required
Objective 5.4: Management measures are complied with.
Management measures are restrictive and therefore it is necessary to have in place a
comprehensive monitoring, control and surveillance system to ensure compliance.
Difficulties have been experienced in operating the vessel monitoring system (VMS)
and it is currently not functional. MFMR will ensure that the situation is rectified as
quickly as possible.
Table 23: Strategies and performance indicators for Goal 5 objectives
Strategy Indicators / Outputs Time frame
(a) To have a comprehensive MCS system in place,
including an operational vessel monitoring system.
Various MCS statis-
tics available
VMS operational
Annual
As soon as
possible
(b) To have appropriate penalties are in place and en-
forced
Degree of compliance Ongoing

Ministry of Fisheries and Marine Resources
Hake Management Plan Page 30
Summary of research and reviews
The following table is a summary of research and reviews needing to begin during the
lifespan of the management plan. These will be instrumental for effective future re-
view of the management plan.
Table 24: List of research and reviews
Subject Responsibility
Development of separate species assessments, using the most recent available
data and development of target and limit reference points.
DRM and BCC
Development of protocols to enable separate species management DPPE and BCC
Research into the transboundary shared stock issue with South Africa. DRM and BCC
Development of multispecies, bio-economic and social models. DRM and DPPE
Review legal, policy and strategic changes to management of hake for the
application of EAF.
DRM, DPPE and
BCC
Research into the processes and consequences of any altered ecosystem func-
tioning.
DRM and BCC
Assessment of the funding and the human resource requirements, training and
retention of staff to conduct the researched required for good management.
DPPE
Research into minimising bycatch. DRM, FOA and NHA
Research into the effect of trawling on the substrate and benthic communities. DRM and NHA
Review of quota allocations. DPPE
Analyse the impact of current policies on investment and structure of the
rights and transferability of quotas.
DPPE
Review of quota related fees to be finalised. DPPE
Review of the recent failings of the vessel monitoring system to ensure that it
is operational.
DOP

Ministry of Fisheries and Marine Resources
Hake Management Plan Page 31
4 Summary of management measures
The following outlines the main management measures used in the hake fishery.
4.1 Total allowable catch
Each year a TAC is set, first and foremost to ensure the long-term sustainability of the
hake stocks. As stipulated in the Marine Resources Act, 2000, the TAC will continue
to be based on the best available scientific assessments of the stocks.
In order to promote the recovery of the stocks the TAC will continue to be set well
below the average biological yield.
To promote stability for the fishing industry, the TAC will not be changed by more
than 10% from one year to the next.
The TAC will not be changed within a fishing season, except in extraordinary circum-
stances, such as adverse environmental conditions when the precautionary approach
may be applied.
4.2 Limited entry into fishery
As in many other fisheries in the world, entry into the hake fishery is limited through
rights of exploitation. MFMR will continue limiting the number of rights.
4.3 Quota system
In order to promote economic efficiency, the Minister allocates the TAC as individual
quotas to right holders. These quotas are for the relevant fishing season and cannot be
transferred. When allocating quotas, the Minister keeps in mind criteria from the Ma-
rine Resources Act, 2000, and other policies as appropriate.
No more than 30% of the allocated quotas may be harvested by freezer vessels. When
quotas are allocated to the individual companies, it is specified whether they may be
used for this purpose.
4.4 Fees
The various fees used in the hake fishery forms an important management tool, assist-
ing the government in achieving a number of its objectives.
Fees will continue to be charged as outlined in the Marine Resource Act, 2000, and
the associated regulations.
MFMR will increase its efforts to ensure that fees are paid fully and on time.
4.5 Technical measures
MFMR closes certain areas for fishing in order to protect juvenile hake. This will con-
tinue and MFMR may, on short notice, close further areas, or indeed the entire fish-
ery, if the need arises, for example if the number of juvenile fish becomes a signifi-
cant part of catches.
The closure of the hake fishery during the month of October each year will continue,
but will be reviewed if deemed necessary.
Ministry of Fisheries and Marine Resources
Hake Management Plan Page 32
Various restrictions on fishing gear are in place, as outlined in the Marine Resources
Regulations.
4.6 Management capacity
It is of paramount importance to have sufficient skilled staff in the Ministry.
Timely and accurate data collection is imperative for good fisheries management.
MFMR will continue collecting the necessary information needed.

Ministry of Fisheries and Marine Resources
Hake Management Plan Page 33
5 Response of management
If indicators in the tables in section 3 of this management plan suggest that strategies
are not having the required impact, the following action will be taken:
1. Any stakeholder should notify the Minister and Permanent Secretary of
MFMR as well as relevant participants in the hake fishery.
2. Permanent Secretary undertakes a detailed review of causes and implications
of not achieving the planned performance. A part of the review is consulting
with relevant stakeholders.
3. Permanent Secretary provides a report to the Minister within three months of
the initial notification. The report should include recommendations and man-
agement strategies to rectify the problem.
4. Minister considers recommendations, seeking input from the Marine Re-
sources Advisory Council, and makes a decision.

Ministry of Fisheries and Marine Resources
Hake Management Plan Page 34
6 Review of the management plan
The management plan is a living document that will regularly need to be adapted to
the realities on the ground. The plan should be formally revised every three to five
years. Because this is the first management plan, it will be reviewed after three years
with a revised plan ready for the 2014/2015 fishing season. As knowledge advances
periodic reviews and improvements may need to be made. All reviews should be done
in consultation with stakeholders.
Any changes in legislation or international agreements may require a review of the
management plan.
One year before the plan ends, consultations with all stakeholders will begin in prepa-
ration for a new plan. A revised plan should be finalised several months before the
end the fishing season. Current suggestions to change the hake fishing season to begin
1 November each year and end 30 September may be enacted during the lifetime of
this plan (Esau 2011). Table 27 provides precise dates based on the current fishing
season and the proposed new dates.
Table 25: Important milestones regarding review
Milestone May to April season November to September season
Start of plan 1 May 2011 1 November 2011
Review begins May 2013 November 2013
New plan approved January 2014 July 2014
End of first plan 30 April 2014 30 September 2014
New plan begins 1 May 2014 1 November 2014

Ministry of Fisheries and Marine Resources
Hake Management Plan Page 35
7 Bibliography
BCC. 2010. Development of ecological sustainable fisheries practices in the Benguela
Large Marine Ecosystem – ECOFISH. Project proposal DCI/ENV/2009/8/66.
BCLME. 2005. Assessing the Role and Impact of Eco-Labelling in the Three BCLME
Countries. BCLME Project LMR/SE/03/02. 1 December.
BCLME. 2006. Report on the Biological, Social and Economic Impact of Rights
Allocations in the BCLME Region. BCLME Project LMR/SE/03/03. 27
October.
BCLME. 2007. An Analysis of Revenue Raising Instruments for the Important
Commercial Fisheries in the BCLME Countries. Final Report. BCLME
Project LMR/SE/03/05. March.
Cochrane K L, Augustyn C J, Bianchi G, de Barros P, Fairweather T,Iitembu J, Japp
D, Kanandjembo A, Kilongo K, Moroff N, Nel D, Roux J-P, Shannon L J, van
Zyl B, Vaz Velho F , 2007. Results and conclusions of the project “Ecosystem
approaches for fisheries management in the Benguela Current Large Marine
Ecosystem”. FAO Fisheries Circular. No. 1026. Rome, FAO.167p.
Cury P and Shannon L J. 2004. Regional shifts in upwelling ecosystems: Observed
changes and possible mechanisms in the northern and southern Benguela.
Progress in Ocenaography. Vol. 60 2-4. p. 223-243.
Esau B. 2011. Annual address to the fishing and aquaculture industry and related
stakeholders, by Honourable Minister of Fisheries and Marine Resources.
Walvis Bay, 17 February.
FAO. 1995. Code of Conduct for Responsible Fisheries. Rome: Food and Agricultural
Organization of the UN.
FAO. 1998. International Fisheries Instruments with Index. United Nations
FAO. 2003. The Ecosystem Approach to Fisheries. Issues, terminology, principles,
institutional foundations, implementation and outlook. FAO Fisheries
Technical Paper. No. 443. Rome: Food and Agricultural Organization of the
UN.
FAO. 2010. The State of World Fisheries and Aquaculture 2010. FAO Fisheries and
Aquaculture Department. Rome: Food and Agricultural Organization of the
UN.
Field J G, Moloney C L, du Buisson L, Jarre A, Stroemme T, Lipinski M R and
Kainge P. 2008. Exploring the BOFFFF hypothesis using a model of Southern
African deepwater Hake (Merluccius paradoxus). K. Tsukamoto, T.
Kawamura, T. Takeuchi, T. D. Beard, Jr. and M. J. Kaiser, eds. Fisheries for
Global Welfare and Environment, 5th World Fisheries Congress 2008, pp. 17–
26.
Hannesson. R., 2004. The privatization of the oceans. Massachusetts Institute of
Technology.
Kainge P, Kjesbu O S, Thorsen A and Salvanes A G. 2007. Merluccius capensis
spawn in Namibian waters, but do M. paradoxus? African Journal of Marine
Science 29 (3): 379–392.

Ministry of Fisheries and Marine Resources
Hake Management Plan Page 36
Kirchner C. and Ianelli J. 2010. An assessment and management of Namibian hake
(M. capensis and paradoxus) using an age-structured model. DWG, HK, Doc
4b.
Kirchner C. 2010. Determinants of resource rents in the Namibian hake industry.
Unpublished MBA research report presented to the Graduate School of
Business, University of Cape Town.
Mafila S. In prep. Ecosystem effects of bottom-trawling in the Benguela system:
experimental and retrospective data analysis. Unpublished PhD research
report. University of Namibia.
Marine Resources Act. 2000. Act no 27 of 2000. Government Gazette, no. 2458, 27
December.
MFMR. 2001. Regulations relating to the exploitation of marine resources.
Government Gazette of the Republic of Namibia. Government notice No. 214.
7 December.
MFMR. 2004. Namibia’s Marine Resource Policy: Towards Responsible
Development and Management of the Marine Resources Sector. Government
of Namibia.
MFMR. 2008. The History, Current and Future Perspectives. Outcome of Fisheries
and Aquaculture Conference held in Swakopmund, 24-26 September.
MFMR. 2009a. MFMR Strategic Plan 2009-2014. Government of Namibia.
MFMR. 2009b. Employment Verification Report. Prepared by PPE. August.
MFMR. 2009c. Policy statement (guidelines) for the granting of rights to harvest
marine resources and the allocation of fishing quotas. July.
MFMR. 2010. Hake State of Stock Report. NatMIRC: Demersal Section,
Swakopmund.
MFMR. various years. Annual Report. Government of Namibia.
Nel N, Cochrane K and Petersen S.. 2005. Report on the Ecological Risk Assessment
(ERA). Workshop for the Namibian Hake fishery. Swakopmund. April.
Office of the President. 2004. Prosperity, Harmony, Peace and Political Stability:
Namibia Vision 2030. Policy Framework for Long-Term National
Development. Government of Namibia.
Paterson B, Petersen S L, Okes N and P Kainge. 2010. Ecological Risk Assessment
Review for theNamibian Hake Fishery. In Petersen S, Paterson B, Basson J,
Moroff N, Roux J-P, Augustyn J and D’Almeida G (eds). Tracking the
Implementation of an Ecosystem Approach to Fisheries in Southern Africa.
WWF South Africa Report Series – 2010/Marine/001.
Russell D. 2009. Certification of the hake industry in Namibia. United Nations
Environment Programme (UNEP) to the Institute for Security Studies (ISS).
United Nations. 1997. The Law of the Sea.
Wiium V. and Uulenga A. 2003. Fishery Management Costs and Rent Extraction: The
Case of Namibia. In Schrank W E, Hannesson R and Arnason R (eds.). The
costs of fisheries management. pp. 173-186. Aldershot: Ashgate Publishing
Company.