draft - san francisco municipal railway · ship, disabled access, ... cent sfmta travel decisions...
TRANSCRIPT

TNCs TodayA Profile of San Francisco Transportation Network Company Activity
JUNE, 2017
D R A F T

ContentsExecutive Summary 1
Introduction 3
Purpose 4
Methodology 5
Research Questions 7
How many TNCs operate in San Francisco today? 7
How many TNC trips are occurring in San Francisco? 8
When are TNC trips occurring in San Francisco? 9
Where are TNC trips occurring in San Francisco? 11
How much VMT do TNCs generate within San Francisco? 15
Do TNCs provide good geographic coverage throughout the entire city? 17
Future Research 18
For More Information 18
Bibliography 19
Glossary 19
S A N F R A N C I S C O C O U N T Y T R A N S P O R T A T I O N A U T H O R I T Y
1455 Market Street, 22nd Floor, San Francisco, CA 94103tel 415.522.4800 fax 415.522.4829email [email protected] web www.sfcta.org
ACKNOWLEDGEMENTS
We wish to thank the following individuals who contributed to the development of this report:
PROJECT TEAM
JOE CASTIGLIONE, SFCTA
TILLY CHANG, SFCTA
DREW COOPER, SFCTA
JEFF HOBSON, SFCTA
WARREN LOGAN, SFCTA
ERIC YOUNG, SFCTA
BILLY CHARLTON, Because LLC
CHRISTO WILSON, Northeastern University
ALAN MISLOVE, Northeastern University
LE CHEN, Northeastern University
SHAN JIANG, Northeastern University
PHOTO CREDITS
Uncredited photos are from the Transportation Authority photo library. The photographers cited below, identified by their screen names, have made their work available for use on flickr Commons: Follow the link for use and licensing information.
Cover top left: Elvert Barnes, https://flic.kr/p/RnBh3WCover top right: Sergio Ruiz, https://flic.kr/p/TcdmM8p. 4: Melies the Bunny, https://flic.kr/p/hF62Dc
REPORT DESIGN: Bridget Smith, SFCTA

PAGE 1
TNCs TODAY: A PROFILE OF SAN FRANCISCO TRANSPORTATION NETWORK COMPANY ACTIVITY | DRAFT REPORT
SAN FRANCISCO COUNTY TRANSPORTATION AUTHORITY • JUNE 2017
Executive SummaryTransportation network companies (TNCs) such as Uber and Lyft are an increasingly visible presence on San Fran-cisco streets, but there has been no comprehensive data source to help the public and decision-makers understand how many TNC trips occur in San Francisco, how much vehicle travel they generate, and their potential effects on congestion, transit ridership, and other measures of sys-tem performance. The California Public Utilities Commis-sion (CPUC) regulates TNCs and requires data reporting by TNCs, but will not share these data with local jurisdictions and the public.
The purpose of this report is to provide information on TNC activity in San Francisco, in order to help the San Francisco County Transportation Authority (Transportation Authori-ty) fulfill its role as the Congestion Management Agency for San Francisco County. The report is also intended to inform the Transportation Authority board which is comprised of the members of the San Francisco Board of Supervisors, as well as state and local policy-makers in other arenas, and the general public, on the size, location and time-of-day characteristics of the TNC market in San Francisco.
The information presented is a profile of estimated local TNC usage (trips made entirely within San Francisco) from mid-November to mid-December of 2016. The TNC data was originally gathered by researchers at Northeastern University from the Application Programming Interfaces (APIs) of Uber and Lyft and then shared with the Trans-portation Authority. The Transportation Authority’s data team cleaned and analyzed the data for presentation here.
While this document provides a broad range of descrip-tive information about TNC trips, it does not evaluate the effects of these TNC trips on the performance of the San Francisco transportation system, nor does it explain TNC customer trip purposes, demographic characteristics, or longer term effects on vehicle ownership and residential and employment location. This report does not identify the extent to which TNCs affect congestion. Many factors contribute to increased congestion—population and em-ployment growth, construction activity, increased delivery and other transportation services, and TNCs.
Subsequent reports and studies by the Transportation Au-thority and others will address these important analytic and policy topics in depth, including the effects of TNCs on roadway congestion, public transit operations and rider-ship, disabled access, and equity.
The report is structured around six primary questions:
HOW MANY TNCS OPERATE IN SAN FRANCISCO TODAY?
• The San Francisco Treasurer’s Office estimates that 45,000 Uber and Lyft drivers may operate in San Francisco, and in 2016 sent notices requiring them to register their business with the city.
• Almost 21,000 drivers are estimated to have complied with the requirements to register their business with the city. Of that number, only 29% are San Francisco residents.
• On a typical weekday, over 5,700 TNC vehicles oper-ate on San Francisco streets at peak times, with the peak period occurring between 6:30pm and 7:00pm. On Fridays, over 6,500 TNC vehicles are on the street during the peak of 7:30pm to 8:00pm. This is over 15 times the number of taxis on the street at these times of day.
HOW MANY TNC TRIPS ARE OCCURRING IN SAN FRANCISCO?
• On a typical weekday, TNCs make over 170,000 vehi-cle trips within San Francisco, which is approximately 12 times the number of taxi trips, and 15% of all in-tra-San Francisco vehicle trips. This represents a con-servative estimate of total TNC trips in San Francisco because the study’s dataset does not include trips with a regional origin or destination.
• Assuming TNC occupancy rates are similar to taxi oc-cupancy rates, it is estimated that at least 9% of all San Francisco person trips use TNCs.

PAGE 2
TNCs TODAY: A PROFILE OF SAN FRANCISCO TRANSPORTATION NETWORK COMPANY ACTIVITY | DRAFT REPORT
SAN FRANCISCO COUNTY TRANSPORTATION AUTHORITY • JUNE 2017
WHEN ARE TNC TRIPS OCCURRING IN SAN FRANCISCO?
• Significant numbers of TNC vehicle trips occur on both weekdays and weekends, with the highest number on Fridays with over 222,500 trips, and the lowest num-ber on Sundays with approximately 129,000 trips.
• On weekdays, TNC usage is concentrated during the AM and PM peak periods when congestion is greatest, and extends into the evenings on Friday. Saturday and Sunday TNC trips occur primarily in the after-noon and evening.
WHERE ARE TNC TRIPS OCCURRING IN SAN FRANCISCO?
• TNC trips are concentrated in the densest and most congested parts of San Francisco including the down-town and northeastern core of the city. At peak peri-ods, TNCs are estimated to comprise 25% of vehicle trips in South of Market.
• TNC trips are concentrated on the busiest arterials, yet also operate extensively on neighborhood streets, including along major public transit lines.
HOW MANY VEHICLE MILES TRAVELED (VMT) DO TNCS GENERATE WITHIN SAN FRANCISCO?
• Intra-SF TNC trips generate approximately 570,000 vehicle miles of travel (VMT) on a typical weekday, comprising as much as 20% of intra-SF-only VMT, at
least 6.5% of average total weekday VMT citywide, and may account for more than 10% of weekend VMT, primarily during the AM peak, PM peak, and early evening time periods. These estimates include both in-service and out-of-service vehicle miles.
• Approximately 20% of total TNC VMT are out-of-ser-vice miles. This is significantly lower than the more than 40% of taxi VMT that are out-of-service miles. The greater efficiency of TNCs is likely due to the high-er number of TNC vehicles and more efficient technol-ogy.
DO TNCS PROVIDE A HIGH DEGREE OF GEOGRAPHIC COVERAGE THROUGHOUT THE ENTIRE CITY?
• TNCs provide broader service across the city than tax-is, particularly in the western neighborhoods.
• TNCs provide fewer trips per population and employ-ment in southern and southeastern areas of the city, which may reflect the presence of fewer TNC vehicles, or neighborhood preferences or demographics.
For more information, or to obtain a downloadable file of Transportation Authority processed data, visit the TNCs Today website at www.sfcta.org/tncstoday.

PAGE 3
TNCs TODAY: A PROFILE OF SAN FRANCISCO TRANSPORTATION NETWORK COMPANY ACTIVITY | DRAFT REPORT
SAN FRANCISCO COUNTY TRANSPORTATION AUTHORITY • JUNE 2017
IntroductionTransportation network companies (TNCs) such as Uber and Lyft are visible presences on San Francisco’s streets, in both the downtown core as well as in the city’s neigh-borhoods. These companies allow people to use a smart-phone app to request and pay for rides sourced from a pool of available drivers. These services are taxi-like in that they provide point-to-point transportation primar-ily in private vehicles. The success of TNCs in attracting rides in San Francisco and other cities reflects the high unmet demand for premium services and the extensive benefits they provide to users who can afford their servic-es. Initially TNCs offered some distinct advantages over taxis including the ability to easily reserve a ride, the abil-ity for both driver and passenger to contact each other and to know the location of the other using GPS, ease of payment, cheaper fares, shorter wait times, and more availability at all times of day due to a larger supply of vehicles. Taxis now offer some of these features, although the supply of taxis is still significantly smaller than TNCs, and taxi fares are higher.
The advantages of TNCs over taxis and other transporta-tion modes are in part a result of the technological innova-tion of directly connecting travelers and drivers, but are also in part an outcome and reflection of the relatively light regulatory requirements under which TNCs operate, relative to taxis and other for-hire vehicles. The biggest dif-ference between TNCs and other modes is the significantly lower barrier for drivers to enter the market. California state law grants municipalities the ability to regulate taxis, and in San Francisco, the taxi medallion system limits the number of taxi vehicles that can serve the city. In addition, taxis are subject to price controls, must provide access to all areas of the city, must provide service to people with
disabilities, have greater insurance requirements, and are subject to driver background checks and vehicle inspec-tions. In contrast, there is no limit on the number of TNCs that may operate on San Francisco streets, no price con-trols, no geographic service area requirements, minimal disabled access requirements, limited driver background checks and few vehicle inspection or driver training re-quirements (TRB 2015).
There is a perception that TNC vehicles now comprise a sig-nificant number of the vehicles on San Francisco streets, having increased rapidly since TNCs started operating in the city seven years ago. However, there has been little data to either confirm or refute this perception. The California Public Utilities Commission (CPUC), which regulates TNCs due to the inter-city, non-hail nature of the service they provide, requires TNCs to report to the CPUC an extensive set of information on service provision including where and when trips are starting and ending, the availability of disabled-accessible vehicles, traffic incidents, and hours and miles logged by drivers. However, the CPUC has refused to share these TNC data with San Francisco, stating that it is authorized to withhold official information if disclosure of the information is against the public interest (CPUC Let-ter to the Transportation Authority, 2017). However, re-cent SFMTA Travel Decisions Survey results indicate that TNCs are growing in significance as a share of overall San Francisco travel, doubling in mode share served between 2014 and 2015 (SFMTA 2014, SFMTA 2015). In addition, it has been noted that Uber reported an annual tripling of trips in San Francisco (TRB 2015). However, these data sources provide no reliable estimates of the true number of TNC trips occurring in San Francisco, where TNC trips are occurring, or when TNC trips are occurring.

PAGE 4
TNCs TODAY: A PROFILE OF SAN FRANCISCO TRANSPORTATION NETWORK COMPANY ACTIVITY | DRAFT REPORT
SAN FRANCISCO COUNTY TRANSPORTATION AUTHORITY • JUNE 2017
PurposeThe purpose of this report is to provide information on TNC activity in San Francisco, in order to help the San Francisco County Transportation Authority (Transporta-tion Authority) fulfill its role as the Congestion Manage-ment Agency for San Francisco County. The report is also intended to inform the Transportation Authority board which is comprised of the members of the San Francisco Board of Supervisors, as well as state and local policy-makers in other arenas, and the general public, on the size, location and time-of-day characteristics of the TNC market in San Francisco.
This document provides estimates of how many TNCs are operating in San Francisco during all times of day and days of week, imputes the number, location, and timing of intra-San Francisco TNC trips based on TNC driver trip acceptance information (referred to in this report as pick-ups) and TNC driver drop off information (referred to as drop-offs). The report estimates the amount of daily ve-hicle miles travelled (VMT) generated by TNCs, and contex-tualizes these relative to the other travel modes operating in San Francisco, including private vehicles, public transit, walking and biking. TNC trips between San Francisco and other counties (regional TNC trips) are not included in these estimates, and as a result these numbers represent a lower-bound estimate of the number of actual TNC ve-hicles and trips operating in San Francisco. Note that the data on which this report is based does not include any information on TNC trip purposes, travel party size, fares paid, traveler attributes such as gender, income, disability, mode choice shifts, or induced travel.
The information presented is a profile of local TNC usage in San Francisco from mid-November to mid-December of 2016, excluding dates around the Thanksgiving 2016 holi-day. The TNC data was originally gathered by researchers at Northeastern University from the Application Program-ming Interfaces (APIs) of Uber and Lyft which show the locations of available vehicles to mobile apps, and then was shared with the Transportation Authority through a research collaboration over the past year. The other data referenced in the report come from a variety of sources in-cluding Caltrans, the San Francisco Municipal Transporta-tion Agency (SFMTA), and the Transportation Authority’s SF-CHAMP travel demand model.
This document does not evaluate the near-term impacts of TNCs on the performance of the San Francisco transporta-tion system, nor does it explain potential longer-term ef-fects of TNC provision on vehicle ownership or residential and employment location.
This report does not identify the extent to which TNCs af-fect congestion. Many factors contribute to increased con-gestion—population and employment growth, construc-tion activity, increased delivery and other transportation services, and TNCs. Subsequent reports by the Transporta-tion Authority through this project and the larger Emerg-ing Mobility Services and Technology (EMST) policy frame-work and the Connect SF long-range planning process, both being undertaken in coordination with other City agencies, will address these important analytic and policy questions in depth.

PAGE 5
TNCs TODAY: A PROFILE OF SAN FRANCISCO TRANSPORTATION NETWORK COMPANY ACTIVITY | DRAFT REPORT
SAN FRANCISCO COUNTY TRANSPORTATION AUTHORITY • JUNE 2017
MethodologyThis research team developed and applied multiple proce-dures to estimate TNC trips within San Francisco. First, the team acquired data on TNC vehicle locations that was gathered from the Uber and Lyft APIs. The research team then cleaned this location data, removing unnecessary, anomalous, or redundant information. Finally, the team identified trips and imputed missing attributes.
DATA COLLECTIONIn order to provide real-time information to drivers and passengers, Lyft and Uber expose certain data through public-facing APIs. This information includes nearby vehi-cle locations, estimated times-to-pickup, and sometimes, estimated costs. The data exposed through the APIs also includes, among other things, a vehicle identifier associ-ated with a sequence of time-stamped coordinates, and the service types associated with that vehicle, such as UberX or UberPOOL. Sending a request to the API returns a text file response containing this information for the near-est available vehicles. When a vehicle becomes unavail-able, either because the driver has turned off their app or they have accepted a ride request, the vehicle disappears from the datastream. Similarly, when the vehicle becomes available, either because the driver has turned on their app or they have completed a ride request, it reappears in the datastream. Researchers at Northeastern Univer-sity implemented a systematic method for collecting this datastream such that it geographically covers all of San Francisco. The Northeastern University researchers col-lected information on vehicle locations every five seconds for approximately six weeks. The data collection methodol-ogy has no impacts on either drivers or riders.
DATA CLEANINGThe research team collected data by sampling available TNC vehicles using a geographic grid that covers all of San Francisco. This sampling procedure means that any available Uber or Lyft vehicle may be detected by multiple sampling locations. Furthermore, because data is being collected almost continuously in time for each sampling location, the same vehicle will often appear repeatedly in the datastream for each individual sampling location. The first step in the data preparation process involved clean-ing the information in the datastream. In addition, the raw data may at times contain anomalous data, which was also screened out to ensure the reasonableness of the GPS traces. The result was a set of unique GPS traces for each TNC vehicle.
TRIP IDENTIFICATION, TRIP MATCHING AND ATTRIBUTE IMPUTATIONCleaning resulted in a set of unique “pre-trip” vehicle trajectories that reflect when a vehicle became available (due to the driver dropping off a passenger or starting a shift) and when the vehicle became unavailable (due to the driver accepting a passenger or ending a shift). Once pre-trips and pickup and drop-off locations were defined, “trips” were imputed by linking the pickup and trip drop-off locations. Lyft trips were created first because the Lyft API reveals a persistent vehicle identifier, with which it is possible to build an aggregate matrix of Lyft flows from pickup locations to dropoff locations by detailed time-of-day. This matrix of flows is used to estimate the vehicle miles traveled generated by TNCs. Uber’s API does not have persistent identifiers that are necessary to connect pickup and dropoff locations, so the research team used the Lyft matrix of pickup and dropoff flows by travel analysis zone (TAZ) and time-of-day as a starting point, and then pro-portionally fitted the matrix to match Uber trip pickup lo-cations and drop-off locations by time-of-day.
A unique aspect of the Uber and Lyft driver labor market is that drivers may drive for both services simultaneously. As a result, these driver vehicles may appear in both the Uber and Lyft datastreams. It is necessary to identify these “matched pre-trips” in order to avoid double-counting of TNC pre-trips and trips. Matched pre-trips were identi-fied by comparing the start and end times of the pre-trips and selecting only those pre-trips whose start and end times both occurred within a limited time window, as well as selecting only pre-trips that traversed the same set of network links in the same sequence. The pre-trip (and as-sociated trip) were then assigned to either Lyft or Uber, based on which pre-trip ended first, representing the first platform on which a driver accepted the trip.
For pre-trips, out of service travel times and distances could be calculated directly from the cleaned and pro-cessed datastream. For Lyft trips, trip travel times could be derived from the datastream. Because the datastream does not contain the information on the actual paths used by TNCs on trips, it was necessary to impute distances be-tween observed pickup and dropoff locations using infor-mation from the Transportation Authority’s SF-CHAMP model. For Uber trips, both travel times and distances were imputed from the model system.
DATA LIMITATIONSIt must be emphasized that the TNC information docu-mented in this report does not represent direct observa-

PAGE 6
TNCs TODAY: A PROFILE OF SAN FRANCISCO TRANSPORTATION NETWORK COMPANY ACTIVITY | DRAFT REPORT
SAN FRANCISCO COUNTY TRANSPORTATION AUTHORITY • JUNE 2017
tion of TNC trips. Trips and pre-trips are imputed based on the changes in the supply of Uber and Lyft vehicles as revealed by each company’s API. Requests to the CPUC and to Uber and Lyft for data that could be used to validate these findings were declined.
However, as documented in subsequent sections of this report, the summaries of how the time and location of im-puted TNC trips vary across time and space are generally consistent with overall travel patterns within the city.
There are a number of other limitations to the data as revealed by the APIs. Pickup locations and drop-off loca-tions are not true trip origins and trip destinations. In-stead, they represent where drivers accept rides (which
are assumed to be a few minutes from true trip origins) and where drivers are available again (which are assumed to be near true trip destinations). In addition, no infor-mation on the specific TNC products used (such as UberX or LyftLine) can be derived from the datastream. Pooled services like UberPOOL and LyftLine which are designed to encourage users to share rides may not show up in the datastream. No information on TNC vehicle occupancy or traveler demographics is available, nor is consistent infor-mation on costs. Finally, these estimates are a lower bound on TNC trips in San Francisco, as all trips with one or more end outside the city (regional and through trips) are ex-cluded from the analysis.
PAGE 7
TNCs TODAY: A PROFILE OF SAN FRANCISCO TRANSPORTATION NETWORK COMPANY ACTIVITY | DRAFT REPORT
SAN FRANCISCO COUNTY TRANSPORTATION AUTHORITY • JUNE 2017
Research Questions
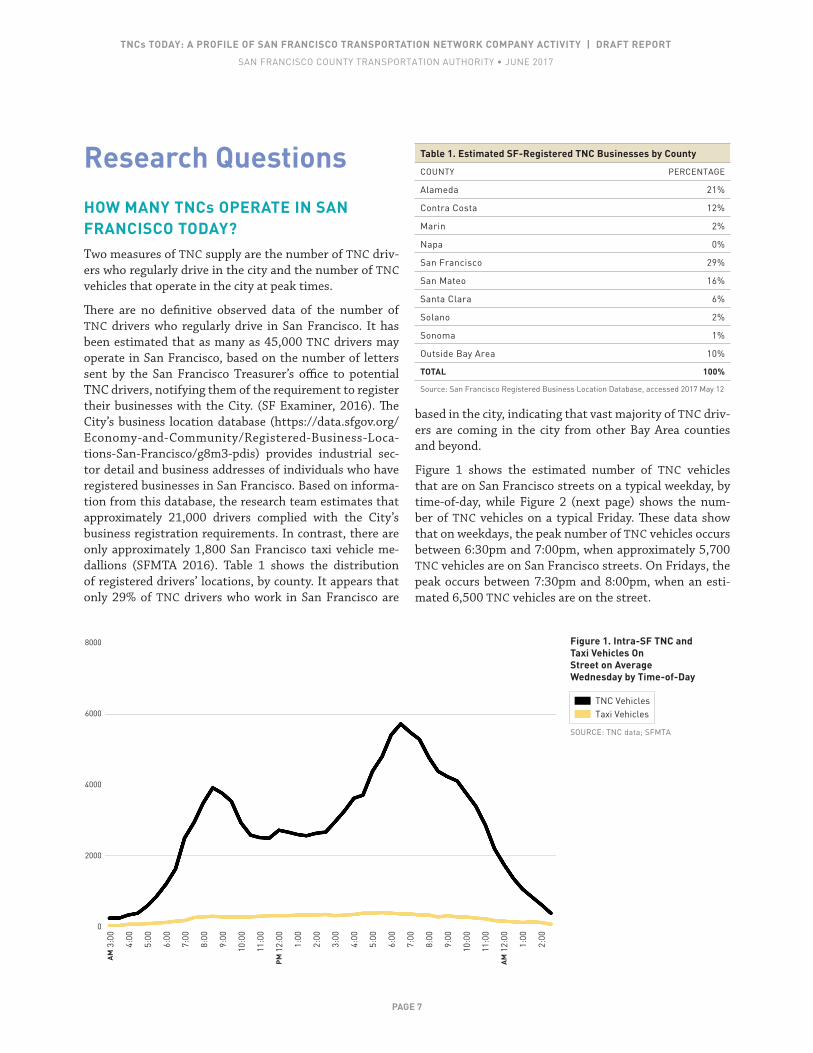
HOW MANY TNCs OPERATE IN SAN FRANCISCO TODAY?Two measures of TNC supply are the number of TNC driv-ers who regularly drive in the city and the number of TNC vehicles that operate in the city at peak times.
There are no definitive observed data of the number of TNC drivers who regularly drive in San Francisco. It has been estimated that as many as 45,000 TNC drivers may operate in San Francisco, based on the number of letters sent by the San Francisco Treasurer’s office to potential TNC drivers, notifying them of the requirement to register their businesses with the City. (SF Examiner, 2016). The City’s business location database (https://data.sfgov.org/Economy-and-Community/Registered-Business-Loca-tions-San-Francisco/g8m3-pdis) provides industrial sec-tor detail and business addresses of individuals who have registered businesses in San Francisco. Based on informa-tion from this database, the research team estimates that approximately 21,000 drivers complied with the City’s business registration requirements. In contrast, there are only approximately 1,800 San Francisco taxi vehicle me-dallions (SFMTA 2016). Table 1 shows the distribution of registered drivers’ locations, by county. It appears that only 29% of TNC drivers who work in San Francisco are
based in the city, indicating that vast majority of TNC driv-ers are coming in the city from other Bay Area counties and beyond.
Figure 1 shows the estimated number of TNC vehicles that are on San Francisco streets on a typical weekday, by time-of-day, while Figure 2 (next page) shows the num-ber of TNC vehicles on a typical Friday. These data show that on weekdays, the peak number of TNC vehicles occurs between 6:30pm and 7:00pm, when approximately 5,700 TNC vehicles are on San Francisco streets. On Fridays, the peak occurs between 7:30pm and 8:00pm, when an esti-mated 6,500 TNC vehicles are on the street.
Table 1. Estimated SF-Registered TNC Businesses by County
COUNTY PERCENTAGE
Alameda 21%
Contra Costa 12%
Marin 2%
Napa 0%
San Francisco 29%
San Mateo 16%
Santa Clara 6%
Solano 2%
Sonoma 1%
Outside Bay Area 10%
TOTAL 100%
Source: San Francisco Registered Business Location Database, accessed 2017 May 12
8000
6000
4000
2000
0
AM
3:0
0
4:00
5:00
6:00
7:00
8:00
9:00
10:0
0
11:0
0
PM
12:
00
1:00
2:00
3:00
4:00
5:00
6:00
7:00
8:00
9:00
10:0
0
11:0
0
AM
12:
00
1:00
2:00
TNC VehiclesTaxi Vehicles
Figure 1. Intra-SF TNC and Taxi Vehicles On Street on Average Wednesday by Time-of-Day
SOURCE: TNC data; SFMTA

PAGE 8
TNCs TODAY: A PROFILE OF SAN FRANCISCO TRANSPORTATION NETWORK COMPANY ACTIVITY | DRAFT REPORT
SAN FRANCISCO COUNTY TRANSPORTATION AUTHORITY • JUNE 2017
8000
6000
4000
2000
0
TNC VehiclesTaxi Vehicles
Figure 2. Intra-SF TNC and Taxi Vehicles On Street on Average Friday by Time-of-Day
HOW MANY TNC TRIPS ARE OCCURRING IN SAN FRANCISCO?Two types of TNC trips were estimated: vehicle trips and person trips. The number of TNC vehicle trips is important because more vehicle trips generally leads to increased con-gestion and conflicts with other street users, while more person trips may indicate enhanced mobility. Again, only those trips with both pickup and drop-off location within San Francisco are considered in the following summaries.
“Vehicle trips” in Table 2 refers to movements by motor vehicles with origins and destinations entirely within San Francisco. Vehicles may carry different numbers of people, or may be public transit vehicles or taxis. Trucks are excluded. Approximately 170,000 TNC vehicle trips are estimated to occur within San Francisco during a typical weekday. This represents approximately 15% of all week-day vehicle trips that both start and end within the city, as shown in Table 2. There are approximately 12 times as many TNC trips as taxi trips during a typical weekday.
Table 2. Weekday Intra-SF Vehicle Trips by Mode
MODE VEHICLE TRIPS %
Private Auto 940,000 83%
Public Transit Vehicle 11,000 1%
Taxi 14,000 1%
TNC 170,000 15%
TOTAL 1,135,000 100%
Source: TNC data; SF-CHAMP travel model, SFMTA
Figure 3. Average Wednesday Intra-SF Vehicle Trips by Mode
Private Auto 83%Public Transit Vehicle 1%Taxi 1%TNC 15%
AM
3:0
0
4:00
5:00
6:00
7:00
8:00
9:00
10:0
0
11:0
0
PM
12:
00
1:00
2:00
3:00
4:00
5:00
6:00
7:00
8:00
9:00
10:0
0
11:0
0
AM
12:
00
1:00
2:00
SOURCE: TNC data; SFMTA
SOURCE: TNC data; SF-CHAMP.

PAGE 9
TNCs TODAY: A PROFILE OF SAN FRANCISCO TRANSPORTATION NETWORK COMPANY ACTIVITY | DRAFT REPORT
SAN FRANCISCO COUNTY TRANSPORTATION AUTHORITY • JUNE 2017
Person trips refers to movements by people with origins and destinations in San Francisco. Person trips are differ-ent than vehicle trips because person trips include walk-ing and biking trips (which don’t require motor vehicles), and also because private vehicles, public transit vehicles and taxis may carry more than one person. For TNCs and taxis, vehicle trips were converted to person trips using an assumed occupancy rate of 1.66, based on observed taxi data (Schaller, 2017). This assumed occupancy rate affects the TNC share of overall travel. Use of a lower occupancy rate would result in lower TNC person trip mode shares. Approximately 290,000 TNC person trips are estimated to occur within San Francisco during a typical weekday. This represents approximately 9% of all weekday person trips within the city, as shown in Table 3.
Table 3. Weekday Intra-SF Person Trips by Mode
MODE PERSON TRIPS %
Drive 1,099,000 34%
Public Transit 512,000 16%
Bike 103,000 3%
Walk 1,193,000 37%
Taxi 24,000 1%
TNC 283,000 9%
TOTAL 3,214,000 100%
Source: TNC data; SF-CHAMP travel model, SFMTA
Figure 4. Average Weekday Intra-SF Person Trips by Mode
WHEN ARE TNC TRIPS OCCURRING IN SAN FRANCISCO?The timing of TNC trips is important because trips that oc-cur during peak periods and weekdays are more likely to exacerbate congestion and delay on roads, affecting both general traffic, surface public transit as well as conflicts with bicycles and pedestrians.
Figure 5 shows the total number of estimated TNC vehicle trips and taxi trips by day-of-week. It shows that TNC trips increase as the week progresses, reaching their peak vol-ume on Friday and hitting their lowest volume on Sunday. This indicates that TNCs are serving both the weekday and
250,000
200,000
150,000
100,000
50,000
0
TNC TripsTaxi Trips
Figure 5. TNC and Taxi Intra-SF Trips by Day-of-Week
MONDAY TUESDAY WEDNESDAY THURSDAY FRIDAY SATURDAY SUNDAY
SOURCE: TNC data; SFMTA
Private Auto 34%Public Transit 16%Bike 3%Walk 37%Taxi 1%TNC 9%
SOURCE: TNC data; SF-CHAMP.
PAGE 10
TNCs TODAY: A PROFILE OF SAN FRANCISCO TRANSPORTATION NETWORK COMPANY ACTIVITY | DRAFT REPORT
SAN FRANCISCO COUNTY TRANSPORTATION AUTHORITY • JUNE 2017
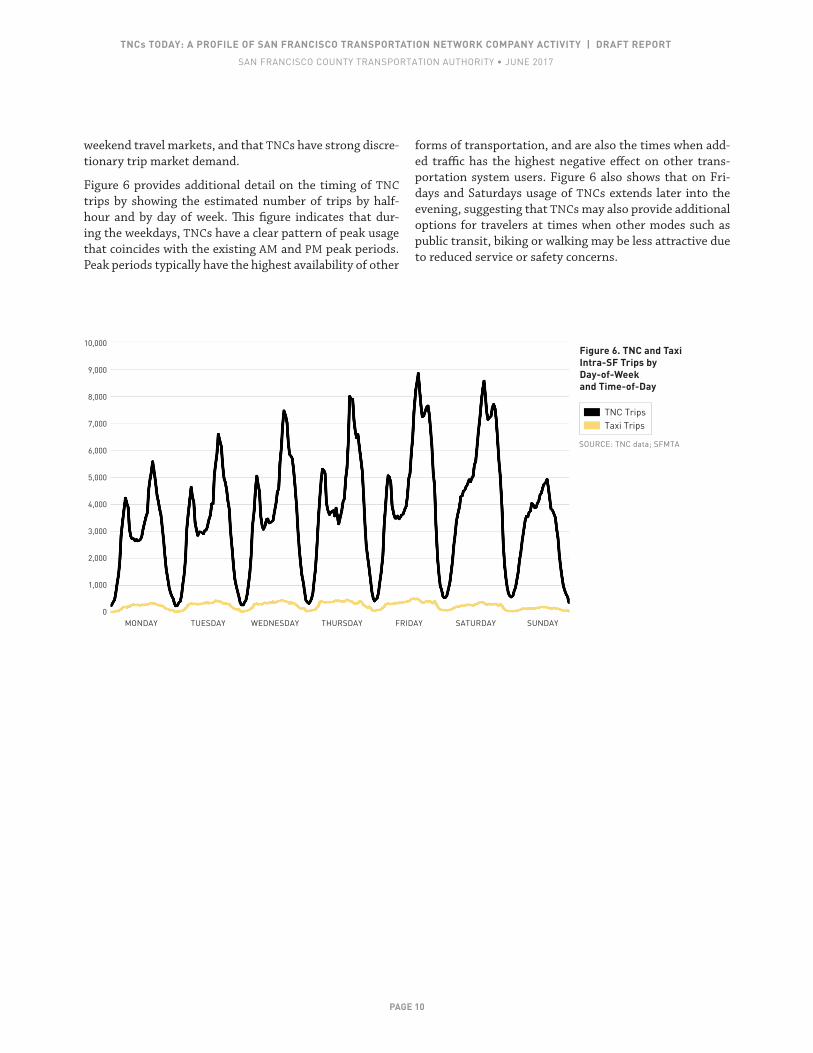
weekend travel markets, and that TNCs have strong discre-tionary trip market demand.
Figure 6 provides additional detail on the timing of TNC trips by showing the estimated number of trips by half-hour and by day of week. This figure indicates that dur-ing the weekdays, TNCs have a clear pattern of peak usage that coincides with the existing AM and PM peak periods. Peak periods typically have the highest availability of other
forms of transportation, and are also the times when add-ed traffic has the highest negative effect on other trans-portation system users. Figure 6 also shows that on Fri-days and Saturdays usage of TNCs extends later into the evening, suggesting that TNCs may also provide additional options for travelers at times when other modes such as public transit, biking or walking may be less attractive due to reduced service or safety concerns.
10,000
9,000
8,000
7,000
6,000
5,000
4,000
3,000
2,000
1,000
0MONDAY TUESDAY WEDNESDAY THURSDAY FRIDAY SATURDAY SUNDAY
TNC TripsTaxi Trips
Figure 6. TNC and Taxi Intra-SF Trips by Day-of-Week and Time-of-Day
SOURCE: TNC data; SFMTA
PAGE 11
TNCs TODAY: A PROFILE OF SAN FRANCISCO TRANSPORTATION NETWORK COMPANY ACTIVITY | DRAFT REPORT
SAN FRANCISCO COUNTY TRANSPORTATION AUTHORITY • JUNE 2017
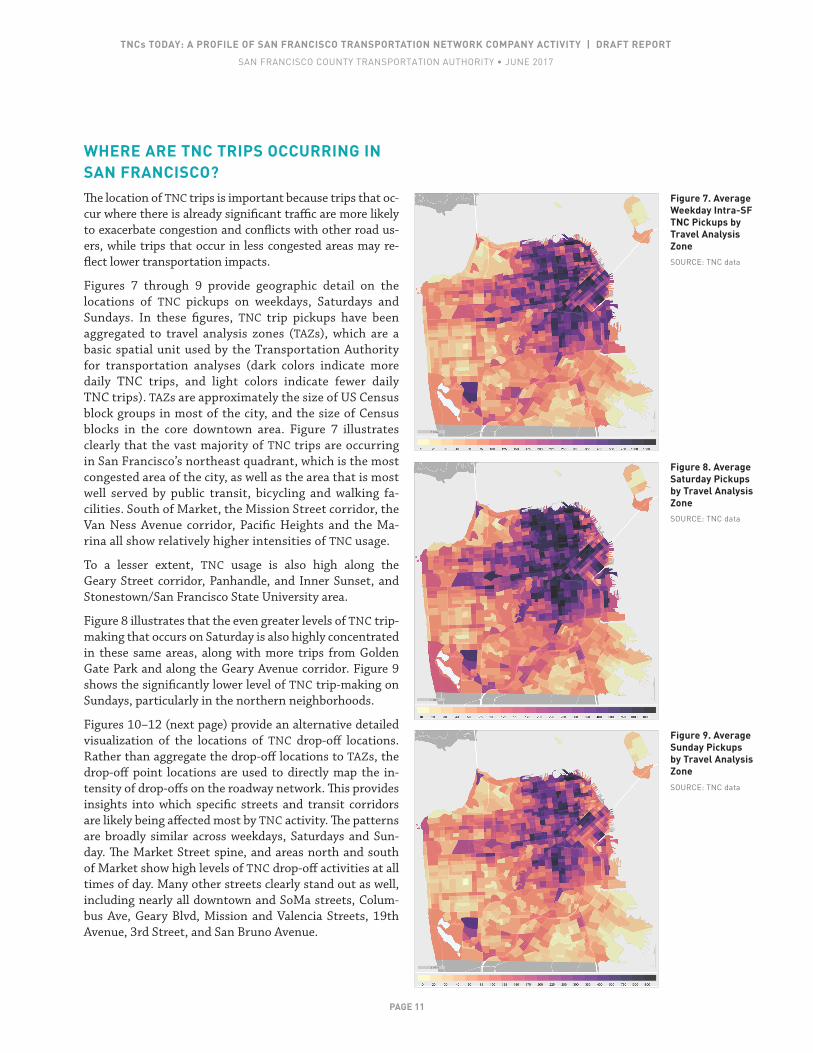
WHERE ARE TNC TRIPS OCCURRING IN SAN FRANCISCO?The location of TNC trips is important because trips that oc-cur where there is already significant traffic are more likely to exacerbate congestion and conflicts with other road us-ers, while trips that occur in less congested areas may re-flect lower transportation impacts.
Figures 7 through 9 provide geographic detail on the locations of TNC pickups on weekdays, Saturdays and Sundays. In these figures, TNC trip pickups have been aggregated to travel analysis zones (TAZs), which are a basic spatial unit used by the Transportation Authority for transportation analyses (dark colors indicate more daily TNC trips, and light colors indicate fewer daily TNC trips). TAZs are approximately the size of US Census block groups in most of the city, and the size of Census blocks in the core downtown area. Figure 7 illustrates clearly that the vast majority of TNC trips are occurring in San Francisco’s northeast quadrant, which is the most congested area of the city, as well as the area that is most well served by public transit, bicycling and walking fa-cilities. South of Market, the Mission Street corridor, the Van Ness Avenue corridor, Pacific Heights and the Ma-rina all show relatively higher intensities of TNC usage.
To a lesser extent, TNC usage is also high along the Geary Street corridor, Panhandle, and Inner Sunset, and Stonestown/San Francisco State University area.
Figure 8 illustrates that the even greater levels of TNC trip-making that occurs on Saturday is also highly concentrated in these same areas, along with more trips from Golden Gate Park and along the Geary Avenue corridor. Figure 9 shows the significantly lower level of TNC trip-making on Sundays, particularly in the northern neighborhoods.
Figures 10–12 (next page) provide an alternative detailed visualization of the locations of TNC drop-off locations. Rather than aggregate the drop-off locations to TAZs, the drop-off point locations are used to directly map the in-tensity of drop-offs on the roadway network. This provides insights into which specific streets and transit corridors are likely being affected most by TNC activity. The patterns are broadly similar across weekdays, Saturdays and Sun-day. The Market Street spine, and areas north and south of Market show high levels of TNC drop-off activities at all times of day. Many other streets clearly stand out as well, including nearly all downtown and SoMa streets, Colum-bus Ave, Geary Blvd, Mission and Valencia Streets, 19th Avenue, 3rd Street, and San Bruno Avenue.
Figure 7. Average Weekday Intra-SF TNC Pickups by Travel Analysis Zone
Figure 8. Average Saturday Pickups by Travel Analysis Zone
Figure 9. Average Sunday Pickups by Travel Analysis Zone
SOURCE: TNC data
SOURCE: TNC data
SOURCE: TNC data

PAGE 12
TNCs TODAY: A PROFILE OF SAN FRANCISCO TRANSPORTATION NETWORK COMPANY ACTIVITY | DRAFT REPORT
SAN FRANCISCO COUNTY TRANSPORTATION AUTHORITY • JUNE 2017
Figure 10. Weekday Pickup Hotspots
Figure 11. Saturday Pickup Hotspots
Figure 12. Sunday Pickup Hotspots
Figure 13. TNC AM and PM Vehicle Shares by Supervisorial District
The locations with the highest levels of TNC pickups and drop-offs include:
• Union Square • Market/Van Ness • Caltrain (4th and King) • Transbay Terminal
(2nd and Market to Harrison/Beale) • Chinatown • Marina • 9th/Brannan • Fell/Oak/Divisadero • Embarcadero Center (Clay/Front) • Clay/Van Ness
Figure 13 summarizes the percentage of all vehicle trips starting in each of the supervisorial district that are TNC vehicle trips. This provides information on how the overall share of 15% of daily vehicle trips as TNC trips varies by time of day and location. In District 6, the research team estimates that more than 25% of AM peak and PM peak period vehicle trips are by TNC.
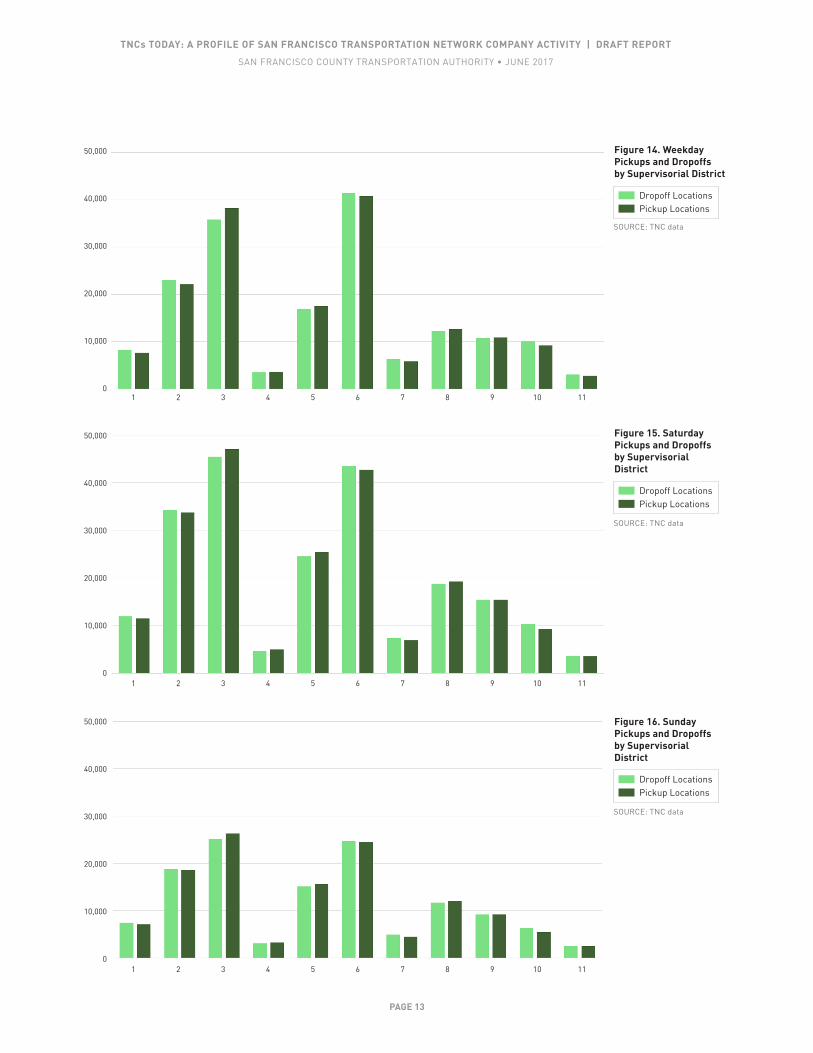
Figures 14–16 (next page) show the average number of TNC pickups and drop-offs by San Francisco supervisorial district by day-of-week. Figure 14 shows that, as noted above, Dis-trict 6 absorbs the greatest number of weekday TNC trips, followed closely by District 3 and more distantly by Districts 2 and 5. This likely reflects the significant employment and public transit hubs found in Districts 3 and 6, combined with higher parking supply restrictions and parking costs. Interestingly, Figure 15 indicates that the greatest number of Saturday TNC trips occur in District 3 instead, followed by District 6, possibly reflecting a greater concentration of entertainment and dining opportunities in District 3. Final-ly, Figure 16 shows the overall lower number of TNC trips occurring across all districts on Sunday, while the relative distribution by district is very similar to that observed on weekdays and Saturdays.
SOURCE: TNC data
SOURCE: TNC data
SOURCE: TNC data
SOURCE: TNC data
PAGE 13
TNCs TODAY: A PROFILE OF SAN FRANCISCO TRANSPORTATION NETWORK COMPANY ACTIVITY | DRAFT REPORT
SAN FRANCISCO COUNTY TRANSPORTATION AUTHORITY • JUNE 2017
Dropoff LocationsPickup Locations
Figure 14. Weekday Pickups and Dropoffs by Supervisorial District
50,000
40,000
30,000
20,000
10,000
01 2 3 4 5 6 7 8 9 10 11
Dropoff LocationsPickup Locations
Figure 15. Saturday Pickups and Dropoffs by Supervisorial District
50,000
40,000
30,000
20,000
10,000
01 2 3 4 5 6 7 8 9 10 11
Dropoff LocationsPickup Locations
Figure 16. Sunday Pickups and Dropoffs by Supervisorial District
50,000
40,000
30,000
20,000
10,000
01 2 3 4 5 6 7 8 9 10 11
SOURCE: TNC data
SOURCE: TNC data
SOURCE: TNC data
PAGE 14
TNCs TODAY: A PROFILE OF SAN FRANCISCO TRANSPORTATION NETWORK COMPANY ACTIVITY | DRAFT REPORT
SAN FRANCISCO COUNTY TRANSPORTATION AUTHORITY • JUNE 2017
TNC AMVehicles AM
Figure 17. Intra-SF AM TNC and Vehicle Trips by Supervisorial District
40,000
30,000
20,000
10,000
01 2 3 4 5 6 7 8 9 10 11
TNC PMVehicles PM
Figure 18. Intra-SF PM TNC and Vehicle Trips by Supervisorial District
40,000
30,000
20,000
10,000
01 2 3 4 5 6 7 8 9 10 11
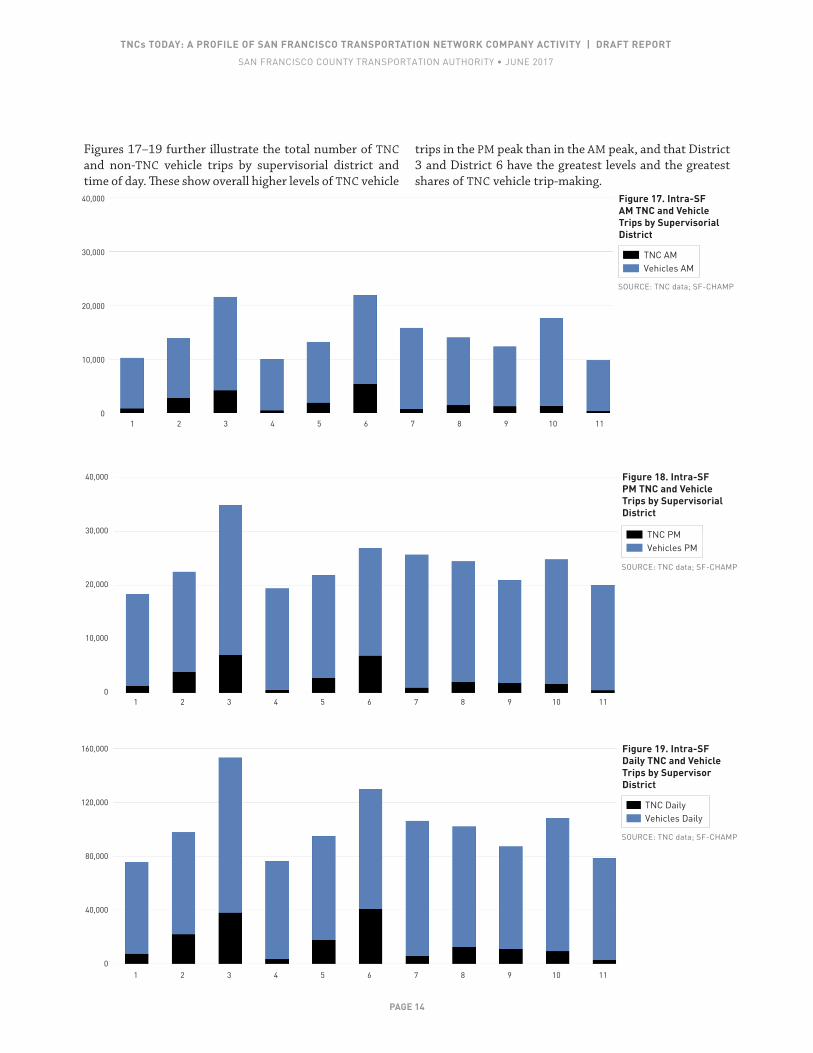
Figures 17–19 further illustrate the total number of TNC and non-TNC vehicle trips by supervisorial district and time of day. These show overall higher levels of TNC vehicle
trips in the PM peak than in the AM peak, and that District 3 and District 6 have the greatest levels and the greatest shares of TNC vehicle trip-making.
TNC DailyVehicles Daily
Figure 19. Intra-SF Daily TNC and Vehicle Trips by Supervisor District
160,000
120,000
80,000
40,000
01 2 3 4 5 6 7 8 9 10 11
SOURCE: TNC data; SF-CHAMP
SOURCE: TNC data; SF-CHAMP
SOURCE: TNC data; SF-CHAMP

PAGE 15
TNCs TODAY: A PROFILE OF SAN FRANCISCO TRANSPORTATION NETWORK COMPANY ACTIVITY | DRAFT REPORT
SAN FRANCISCO COUNTY TRANSPORTATION AUTHORITY • JUNE 2017
HOW MUCH VMT DO TNCs GENERATE WITHIN SAN FRANCISCO?The amount of VMT, or vehicle miles travelled, that is generated by TNCs is important because VMT is a funda-mental measure of transportation system performance. Higher levels of VMT are associated with greater levels of emissions of greenhouse gases such as CO2 as well as other pollutants. In addition, higher levels of VMT are also asso-ciated with greater roadway congestion and conflicts. For TNCs and taxis, two types of VMT are important, in-ser-vice VMT and out-of-service VMT. In-service VMT refers to the vehicle miles traveled when transporting a passen-ger. Out-of-service VMT refers to the vehicle miles traveled while circulating to pickup a passenger.
Tables 4–6 show the total trips, total VMT, average to-tal trip length, in-service trip length, out-of-service trip length, and percent out-of-service trip length by day-of-week for local TNCs and taxis. These tables indicate that TNCs and taxis are generally similar in terms of average in-service trip length. However, a notably smaller share of TNCs’ total trip lengths are out-of-service miles, while a significant share of total taxi trip length (over 40%) are out-of-service miles. The greater efficiencies of TNCs, as reflected in a lower share of out-of-service miles, are likely primarily a reflection of the larger fleets of TNC drivers op-erating on the road at any given time, enabling shorter dis-tances to pickup locations. In addition, TNCs' routing soft-ware may be more efficient than the taxi dispatch systems. Most critically, Table 4 indicates that the estimated TNC total VMT on a typical weekday is approximately 570,000 VMT, and this estimate is clearly conservative given that it:
• Includes only intra-SF TNC trips (such as trips to and from San Francisco International Airport).
• Underestimates out-of-service VMT because it ex-cludes the additional distance from acceptance loca-tion to where the passenger is actually picked up.
• Excludes VMT associated with TNC drivers commut-ing to SF from non-SF home origins.
This TNC VMT estimate indicates that intra-SF TNCs gen-erate as much as 20% on weekday VMT for intra-SF vehi-cle trips and at least 6.5% of total weekday VMT in San Francisco, given Caltrans’ most recent estimate of week-day VMT traveled on San Francisco streets and highways (Caltrans 2014). Saturday roadway volumes are lower than weekday volumes, yet Saturday TNC VMT is even greater than average weekday TNC VMT. It is possible that TNCs may account for approximately 10% of VMT on Saturdays.
Figure 20 (next page) illustrates the amount of estimated in-service and out-of-service VMT generated by local TNCs and taxis for typical weekdays, Saturdays and Sundays. TNCs generate more than 10 times as many VMT as taxis on a typical weekday, while generating 12 times as many trips.
Figure 21 (next page) shows the distribution of weekday VMT by time-of-day for TNCs and taxis. It indicates that most of the VMT generated by TNCs occurs during the AM peak and PM peak hours, with significant VMT also oc-curring during the evening hours, following the PM peak. VMT generated during periods of peak demand likely exac-erbates existing peak period congestion.
Table 4. Average Weekday Intra-SF Trip Lengths
TNCS TAXIS
Trips 170,400 14,400
VMT 569,700 65,900
Average Total Trip Length 3.3 4.6
Average In-service Trip Length 2.6 2.6
Average Out-of-service Trip Length 0.7 2.0
% Out-of-service Trip Length 21.0% 43.6%
Table 5. Average Saturday Intra-SF Trip Lengths
TNCS TAXIS
Trips 220,700 12,300
VMT 703,600 53,600
Average Total Trip Length 3.2 4.4
Average In-service Trip Length 2.6 2.4
Average Out-of-service Trip Length 0.6 1.9
% Out-of-service Trip Length 18.6% 44.1%
Table 6. Average Sunday Intra-SF Trip Lengths
TNCS TAXIS
Trips 129,100 6,700
VMT 471,200 31,900
Average Total Trip Length 3.7 4.8
Average In-service Trip Length 2.9 2.6
Average Out-of-service Trip Length 0.8 2.2
% Out-of-service Trip Length 20.7% 45.5%

PAGE 16
TNCs TODAY: A PROFILE OF SAN FRANCISCO TRANSPORTATION NETWORK COMPANY ACTIVITY | DRAFT REPORT
SAN FRANCISCO COUNTY TRANSPORTATION AUTHORITY • JUNE 2017
80,000
70,000
60,000
50,000
40,000
30,000
20,000
10,000
0
TNC In-ServiceTNC Out-of-serviceTaxi In-ServiceTaxi Out-of-service
Figure 20. Intra-SF TNC and Taxi Vehicle Miles Traveled (VMT)
WEEKDAY SATURDAY SUNDAY
25,000
20,000
15,000
10,000
5,000
0
TNC VMTTaxi VMT
Figure 21. Intra-SF Weekday TNC and Taxi VMT by Time-of-Day
AM
3:0
0
4:00
5:00
6:00
7:00
8:00
9:00
10:0
0
11:0
0
PM
12:
00
1:00
2:00
3:00
4:00
5:00
6:00
7:00
8:00
9:00
10:0
0
11:0
0
AM
12:
00
1:00
2:00
SOURCE: TNC data
SOURCE: TNC data
PAGE 17
TNCs TODAY: A PROFILE OF SAN FRANCISCO TRANSPORTATION NETWORK COMPANY ACTIVITY | DRAFT REPORT
SAN FRANCISCO COUNTY TRANSPORTATION AUTHORITY • JUNE 2017
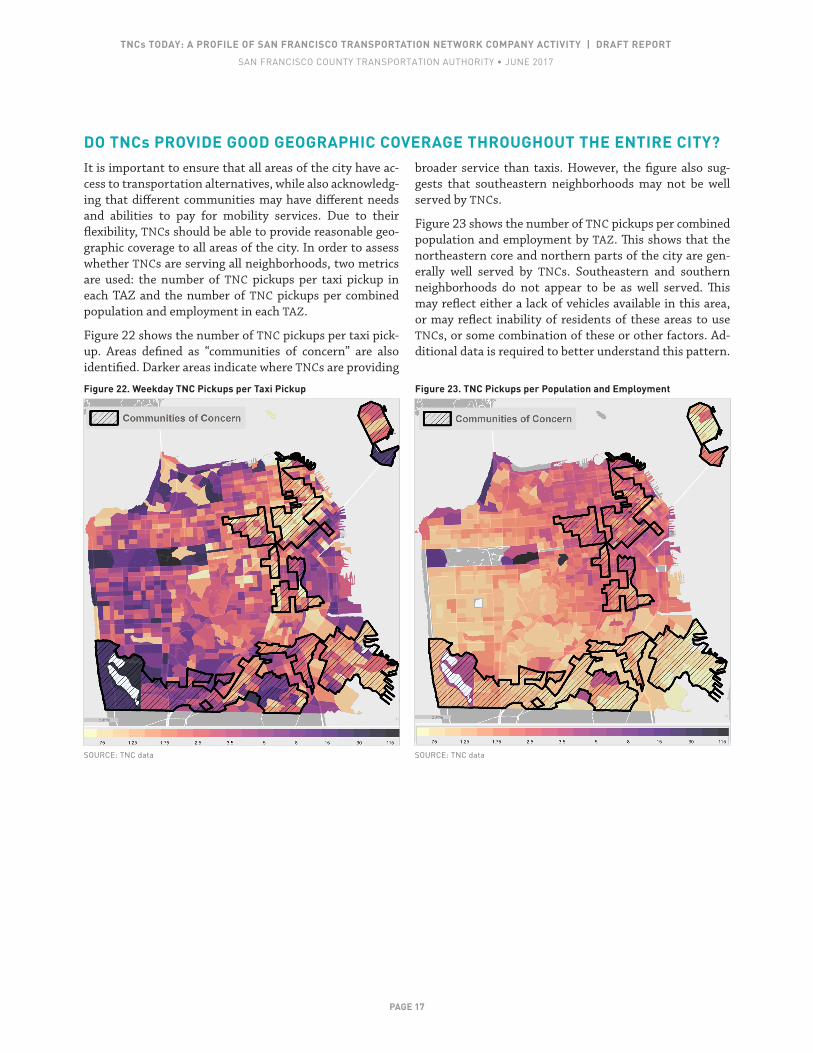
DO TNCs PROVIDE GOOD GEOGRAPHIC COVERAGE THROUGHOUT THE ENTIRE CITY?It is important to ensure that all areas of the city have ac-cess to transportation alternatives, while also acknowledg-ing that different communities may have different needs and abilities to pay for mobility services. Due to their flexibility, TNCs should be able to provide reasonable geo-graphic coverage to all areas of the city. In order to assess whether TNCs are serving all neighborhoods, two metrics are used: the number of TNC pickups per taxi pickup in each TAZ and the number of TNC pickups per combined population and employment in each TAZ.
Figure 22 shows the number of TNC pickups per taxi pick-up. Areas defined as “communities of concern” are also identified. Darker areas indicate where TNCs are providing
broader service than taxis. However, the figure also sug-gests that southeastern neighborhoods may not be well served by TNCs.
Figure 23 shows the number of TNC pickups per combined population and employment by TAZ. This shows that the northeastern core and northern parts of the city are gen-erally well served by TNCs. Southeastern and southern neighborhoods do not appear to be as well served. This may reflect either a lack of vehicles available in this area, or may reflect inability of residents of these areas to use TNCs, or some combination of these or other factors. Ad-ditional data is required to better understand this pattern.
Figure 22. Weekday TNC Pickups per Taxi Pickup Figure 23. TNC Pickups per Population and Employment
SOURCE: TNC data SOURCE: TNC data

PAGE 18
TNCs TODAY: A PROFILE OF SAN FRANCISCO TRANSPORTATION NETWORK COMPANY ACTIVITY | DRAFT REPORT
SAN FRANCISCO COUNTY TRANSPORTATION AUTHORITY • JUNE 2017
Future ResearchThe report provides a profile of estimated TNC usage from mid-November to mid-December of 2016. This document does not evaluate the impacts of TNCs on the performance of the San Francisco transportation system, nor does it recommend any policy responses. Subsequent reports by the Transportation Authority and others will address im-portant analytic and policy questions in depth, including:
• TNC POLICIES. What is the role of government in regu-lating TNCs? What TNC regulatory frameworks exist in other US cities or internationally?
• TNC BEST PRACTICES. What potential impacts of TNCs have other agencies identified, and what policies have they enacted in response? How have agencies part-nered with TNCs?
• TNCS AND STREET SAFETY. How do TNCs affect the safe-ty of people who use the roads, including public tran-sit riders, bicyclists and pedestrians? How can TNCs help San Francisco achieve its VisionZero goals?
• TNCS AND TRANSIT DEMAND. How do TNCs complement, compete with, or otherwise affect public transit rider-ship and mode share?
• TNCS AND PUBLIC TRANSIT OPERATIONS How do TNCs af-fect public transit service operations?
• TNCS AND CONGESTION. How do TNCs affect roadway congestion, delay and travel time unreliability? How do TNCs affect air quality?
• TNCS AND DISABLED ACCESS. To what extent do TNCs serve people with disabilities?
• TNCS AND EQUITY. Can TNCs be accessed by all San Francisco residents including communities of con-cern and those without smartphones or credit cards? Are all neighborhoods served equitably?
• TNCS, LAND USE AND CURB MANAGEMENT. What are the best practices for loading/curbside/roadway space allocation? How do TNCs affect parking demand? Is TNC demand associated with certain land uses? What are the effects of TNCs on location choices and auto ownership?
Additional data collection will be necessary in order to help answer these questions. We are seeking/open to research collaborations to obtain further information, including data to validate or enhance these findings, TNC vehicle occupancy information, traveler demographics and travel purposes, travel costs, TNC fleet composition data, and a range of other data items.
For More Information The Transportation Authority makes available aggregate travel analysis zone (TAZ) level summaries of TNC pickups and drop-offs by hour of day, which can be downloaded at the Transportation Authority website (www.sfcta.org/tncstoday). In addition, an interactive visualization of the TAZ-level TNC data can be found at http://tncstoday.sfcta.org. The Transportation Authority will not provide detailed telemetry data or processed pre-trip and trip information due to the potential to contain personally identifiable information. Parties interested in the detailed telemetry data may contact the Northeastern University researchers to request access. Further information on on-going emerging mobility services and technology work being performed by the Transportation Authority can be found on the Transportation Authority website (www.sf-cta.org/emst).
Figure 24. High Injury Corridors with Average Weekday Intra-SF TNC Pickups by Travel Analysis Zone
SOURCE: TNC data

PAGE 19
TNCs TODAY: A PROFILE OF SAN FRANCISCO TRANSPORTATION NETWORK COMPANY ACTIVITY | DRAFT REPORT
SAN FRANCISCO COUNTY TRANSPORTATION AUTHORITY • JUNE 2017
BibliographyCalifornia Department of Transportation. “2014 Cali-fornia Public Road Data: Statistical Information Derived from the Highway Performance Monitoring System.” http://www.dot.ca.gov/hq/tsip/hpms/hpmslibrary/prd/2014prd/2014PublicRoadData.pdf
California Public Utilities Commission, Letter to San Fran-cisco County Transportation Authority, May, 2017.
Corey, Canapary & Galanis Research. “Travel Decisions Survey 2014—Summary Report.” Prepared for San Fran-cisco Municipal Transportation Agency. https://www.sfm-ta.com/sites/default/files/reports/2015/Travel%20Deci-sion%20Survey%202014%20Summary%20Report.pdf
Corey, Canapary & Galanis Research. “Travel Decisions Survey 2015—Summary Report.” Prepared for San Fran-cisco Municipal Transportation Agency. https://www.sfmta.com/sites/default/files/reports/2016/Travel%20Decision%20Survey%202015%20Report_Accessible.pdf
Hara Associates. “Best Practices Studies of Taxi Regula-tion: Managing Taxi Supply.” Prepared for San Francisco Municipal Transportation Agency, 2013.
Rayle L, Dai D, Chan N, Cervero R and Shaheen S. “Just a better taxi? A survey-based comparison of taxis, tran-sit, and ridesourcing services in San Francisco.” Transport Policy 45, 2016.
Schaller, B. “Entry Controls in Taxi Regulation: Implica-tions of US and Canadian experience for taxi regulation and deregulation.” Transport Policy 14, September 2007.
Transportation Research Board. “TRB Special Report 319: Between Public and Private Mobility: Examining the Rise of Technology-Enabled Transportation Services.” National Academies Press, Transportation Research Board, 2015.
GlossaryAPPLICATION PROGRAMMING INTERFACE (API): Programming code that allows interaction with software, or between software components. It is a tool that a developer of an app uses to communicate with data from a central server.
IMPUTE: Refers to any method to estimate an unknown or missing value in a dataset based on known values or infor-mation.
PERSON TRIPS: A trip by one or more people in any mode of transportation.
TELEMETRY: A remotely collected continuous series of GPS points with associated time and other information that forms a path.
TRANSPORTATION NETWORK COMPANY: Uses an online-en-abled platform to connect passengers with drivers using their personal, non-commercial, vehicles.
TRAVEL ANALYSIS ZONE (TAZ): A geographic unit used for transportation analysis. The Transportation Authority uses a roughly 1000-zone system with average sizes of 1 block in the downtown area and several blocks for outer areas.